eleven-year trends in key financial indicators · depreciation and amortization 4,880 4,101 4,731...
TRANSCRIPT

38 39
Eleven-Year Trends in Key Financial IndicatorsConsolidated Eleven-Year SummarySCREEN Holdings Co., Ltd. and Consolidated Subsidiaries Years ended March 31
2015 2014 2013 2012 2011 2010 2009 2008 2007 2006 2005 2015
For the Year: Millions of yen Thousands of U.S. dollars
Net sales ¥237,646 ¥235,946 ¥199,795 ¥250,090 ¥254,953 ¥164,129 ¥219,049 ¥279,816 ¥301,312 ¥246,534 ¥269,341 $1,980,383
Cost of sales 165,192 177,175 157,790 187,325 182,990 137,827 169,391 208,266 211,159 173,628 190,639 1,376,600
Cost of sales to net sales (%) 69.5% 75.1% 79.0% 74.9% 71.8% 84.0% 77.3% 74.4% 70.1% 70.4% 70.8%
Operating income (loss) ¥ 17,168 ¥ 8,903 ¥ (4,833) ¥ 13,498 ¥ 26,811 ¥ (14,046) ¥ (4,510) ¥ 14,628 ¥ 30,541 ¥ 18,568 ¥ 25,292 $ 143,067
Operating income to net sales (%) 7.2% 3.8% -2.4% 5.4% 10.5% -8.6% -2.1% 5.2% 10.1% 7.5% 9.4%
Net income (loss) ¥ 12,122 ¥ 5,419 ¥ (11,333) ¥ 4,637 ¥ 25,687 ¥ (8,003) ¥ (38,191) ¥ 4,578 ¥ 18,452 ¥ 15,236 ¥ 14,454 $ 101,017
Comprehensive income 24,018 14,262 (6,031) 4,192 22,576 (5,257) — — — — — 200,150
Depreciation and amortization 4,880 4,101 4,731 4,986 5,805 7,012 8,414 5,563 4,113 3,823 5,944 40,667
Cash flows from operating activities (1,492) 24,703 (15,320) 11,279 34,299 25,113 (24,593) 7,934 23,645 14,906 22,301 (12,433)
Cash flows from investing activities (6,318) (4,201) (5,768) (4,162) (2,191) 6,885 (6,921) (16,510) (8,519) (7,482) (5,108) (52,650)
Cash flows from financing activities (3,823) (29,302) 21,534 (9,468) (22,250) (27,124) 34,071 669 (8,875) (13,442) (16,775) (31,860)
Capital expenditures 6,659 4,574 6,450 7,347 3,613 1,911 4,007 12,866 14,420 5,906 6,146 55,492
R&D expenses 13,972 12,274 12,685 13,889 12,130 11,615 16,073 16,248 16,884 13,269 12,628 116,433
Per Share of Capital Stock: Yen U.S. dollars
Net income (loss) ¥ 51.07 ¥ 22.83 ¥ (47.75) ¥ 19.54 ¥ 108.21 ¥ (33.71) ¥ (160.86) ¥ 18.81 ¥ 74.05 ¥ 60.66 ¥ 59.88 $ 0.43
Net income—diluted — — — — — — — 17.39 68.63 55.81 52.57 —
Cash dividends 7.00 3.00 — 5.00 5.00 — — 10.00 15.00 10.00 7.50 0.06
Net assets 467.13 364.23 321.24 379.44 367.00 272.15 292.12 514.26 542.13 500.30 408.03 3.89
At Year End: Millions of yen Thousands of U.S. dollars
Total assets ¥249,517 ¥232,376 ¥232,390 ¥245,382 ¥253,127 ¥216,622 ¥246,918 ¥291,114 ¥319,519 ¥270,238 ¥256,398 $2,079,308
Return on total assets (%) 5.0% 2.3% -4.8% 1.9% 10.9% -3.5% -14.2% 1.5% 6.3% 5.8% 5.8%
Current assets ¥160,367 ¥157,327 ¥161,614 ¥177,543 ¥183,523 ¥139,984 ¥168,191 ¥196,989 ¥223,463 ¥181,077 ¥179,012 $1,336,392
Property, plant and equipment, net 42,606 40,711 39,902 38,669 40,699 45,413 50,955 49,069 42,346 36,096 34,308 355,050
Current liabilities 92,750 114,367 120,014 123,223 148,132 93,874 132,431 123,702 133,784 106,134 111,998 772,917
Long-term debt 32,666 21,943 29,642 25,988 10,634 48,195 32,967 40,644 43,900 24,674 31,803 272,217
Equity 110,865 86,448 76,248 90,069 87,118 64,607 69,353 122,094 133,062 126,392 99,219 923,874
Equity ratio (%) 44.4% 37.2% 32.8% 36.7% 34.4% 29.8% 28.1% 41.9% 41.6% 46.8% 38.7%
Return on equity (%) 12.3% 6.7% -14.2% 5.2% 33.9% -11.9% -39.9% 3.6% 14.2% 13.5% 16.4%
Capital stock ¥ 54,045 ¥ 54,045 ¥ 54,045 ¥ 54,045 ¥ 54,045 ¥ 54,045 ¥ 54,045 ¥ 54,045 ¥ 54,045 ¥ 53,999 ¥ 51,331 $ 450,375
Retained earnings 54,448 41,824 36,405 55,440 26,418 731 8,734 49,390 48,497 32,536 19,284 453,733
Number of shares issued (in thousands) 253,974 253,974 253,974 253,974 253,974 253,974 253,974 253,974 253,974 253,792 243,164
Number of employees 5,082 4,968 4,955 4,890 4,732 4,679 4,992 5,041 4,798 4,672 4,547
Notes: 1. Dollar figures are translated, for convenience only, at the rate of ¥120 to US$1.00. 2. Net income (loss) per share of capital stock is calculated based on the weighted average number of shares outstanding during each term, excluding the
Company’s treasury stock. Fully diluted net income per share of capital stock is not shown for the years that net losses were recorded or no dilutive stock existed. Net assets per share of capital stock is calculated based on the fiscal year-end total number of shares outstanding, excluding the Company’s treasury stock.
3. Return on total assets and return on equity are calculated on the basis of average total assets and average equity, respectively, at the current and previous fiscal year-ends.
4. For the year ended March 31, 2005, depreciation and amortization included ¥2,299 million of nonrecurring depreciation of property, plant and equipment and other assets from the withdrawal from the CRT mask business.
5. Equity in the above table represents the total of shareholders’ equity and accumulated other comprehensive income in the consolidated balance sheets. This is due to the adoption of the new accounting standards for presentation of net assets in the balance sheet, which require former shareholders’ equity and minority interests to be presented as net assets, and net assets to be classified as shareholders’ equity, accumulated other comprehensive income and minority interests. Under the new accounting standards, the net assets section includes deferred hedge income and loss, net of taxes, which was previously included in the assets or liabilities section without considering the related income tax effects. The accompanying consolidated financial state-ments after the year ended March 31, 2006 have been prepared in accordance with the new accounting standards, whereas the statements for the previ-ous years are presented pursuant to the previous presentation rules.
6. Effective from the fiscal year ended March 31, 2011, the “Accounting Standard for Presentation of Comprehensive Income” has been adopted. Under the new accounting standard, the above table includes comprehensive income whereas these amounts are not shown before the years ended March 31, 2010.
7. Effective from the fiscal year ended March 31, 2014, as for main unit sales in the Semiconductor Solutions (SE) segment and the Finetech Solutions (FT) segment, the revenue recognition method was changed to the completion of installation basis. Accordingly, amounts for the fiscal year ended March 31, 2013 have been reclassified with amounts calculated by applying this change of accounting policies retroactively.
40 41
Management’s Discussion and AnalysisSCREEN Holdings Co., Ltd. and Consolidated Subsidiaries Fiscal Years Ended March 31
300
50
100
0
150
200
250
2011 2012 2013 2014 2015
Consolidated Net Sales by Reportable Segment
(Billions of Yen)
(Years ended March 31)
� SE � GP � FT � Other
300
50
0
90
15
100 30
150 45
200 60
250 75
02011 2012 2013 2014 2015
Domestic Sales, Overseas Sales and Ratio of Overseas Sales to Net Sales(Billions of Yen) (%)
(Years ended March 31)
� Domestic Sales � Overseas Sales � Ratio of Overseas Sales to Net Sales
Cost of Sales and SGA Expenses
The cost of sales improved due to reductions in variable costs made to boost profitability, among other factors. As a result, the ratio of cost of sales to net sales fell from 75.1% in the previous fiscal year to 69.5% during the year under review. In spite of cost-cutting efforts, selling, general and administrative (SGA) expenses increased ¥5,418 million, or
10.9%, year on year to ¥55,286 million due to increased personnel costs and R&D expenses as a result of the weak-ening of the yen and the removal of emergency measures implemented in the first half of the previous fiscal year. As a result, operating income rose ¥8,265 million year on year to ¥17,168 million.
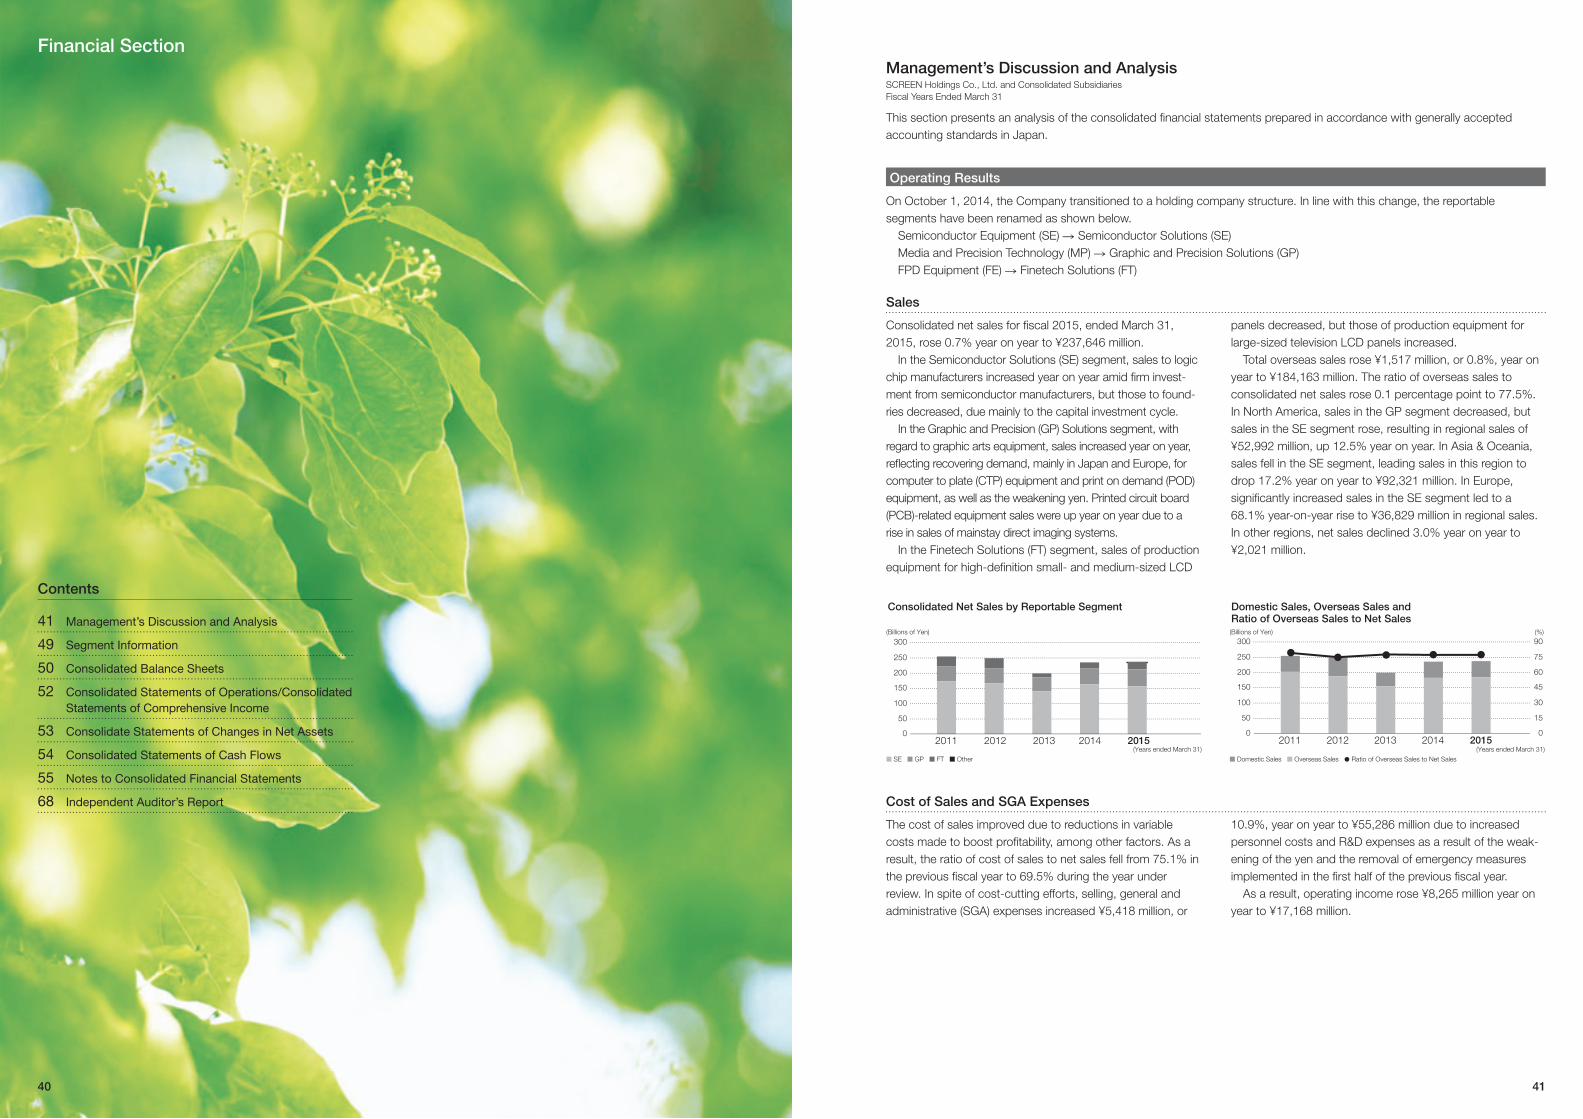
On October 1, 2014, the Company transitioned to a holding company structure. In line with this change, the reportable segments have been renamed as shown below. Semiconductor Equipment (SE) R Semiconductor Solutions (SE) Media and Precision Technology (MP) R Graphic and Precision Solutions (GP) FPD Equipment (FE) R Finetech Solutions (FT)
Sales
Consolidated net sales for fiscal 2015, ended March 31, 2015, rose 0.7% year on year to ¥237,646 million. In the Semiconductor Solutions (SE) segment, sales to logic chip manufacturers increased year on year amid firm invest-ment from semiconductor manufacturers, but those to found-ries decreased, due mainly to the capital investment cycle. In the Graphic and Precision (GP) Solutions segment, with regard to graphic arts equipment, sales increased year on year, reflecting recovering demand, mainly in Japan and Europe, for computer to plate (CTP) equipment and print on demand (POD) equipment, as well as the weakening yen. Printed circuit board (PCB)-related equipment sales were up year on year due to a rise in sales of mainstay direct imaging systems. In the Finetech Solutions (FT) segment, sales of production equipment for high-definition small- and medium-sized LCD
panels decreased, but those of production equipment for large-sized television LCD panels increased. Total overseas sales rose ¥1,517 million, or 0.8%, year on year to ¥184,163 million. The ratio of overseas sales to consolidated net sales rose 0.1 percentage point to 77.5%. In North America, sales in the GP segment decreased, but sales in the SE segment rose, resulting in regional sales of ¥52,992 million, up 12.5% year on year. In Asia & Oceania, sales fell in the SE segment, leading sales in this region to drop 17.2% year on year to ¥92,321 million. In Europe, significantly increased sales in the SE segment led to a 68.1% year-on-year rise to ¥36,829 million in regional sales. In other regions, net sales declined 3.0% year on year to ¥2,021 million.
Operating Results
This section presents an analysis of the consolidated financial statements prepared in accordance with generally accepted accounting standards in Japan.
Financial Section
41 Management’s Discussion and Analysis
49 Segment Information
50 Consolidated Balance Sheets
52 Consolidated Statements of Operations/Consolidated Statements of Comprehensive Income
53 Consolidate Statements of Changes in Net Assets
54 Consolidated Statements of Cash Flows
55 Notes to Consolidated Financial Statements
68 Independent Auditor’s Report
Contents

42 43
Financial Section
Millions of yen
Years ended March 31, 2015 2014 2013 2012 2011R&D expenses ¥13,972 ¥12,274 ¥12,685 ¥13,889 ¥12,130R&D expenses to net sales (%) 5.9% 5.2% 6.3% 5.6% 4.8%
Segment Information
In the SE segment, sales to logic chip manufacturers increased year on year amid firm investment from semicon-ductor manufacturers, but those to foundries decreased, due mainly to the capital investment cycle. As a result, net sales in this segment amounted to ¥157,479 million, down 3.5% year on year. Operating income in this segment came to ¥15,738 million, up ¥6,978 million, or 79.7%, from the previ-ous fiscal year, reflecting a reduction in variable costs, changes in the product mix and reduced loss on valuation of inventories despite the increase in fixed costs, including personnel costs and R&D expenses, due to the removal of emergency measures taken in the first half of the previous fiscal year and the depreciation of the yen. In the GP segment, with regard to graphic arts equipment, sales increased year on year, reflecting recovering demand mainly in Japan and Europe for CTP equipment and POD equipment as well as the weakening yen. PCB-related equip-
ment sales were up year on year due to a rise in sales of mainstay direct imaging systems. As a result, net sales in this segment came to ¥55,707 million, up 6.8% year on year. Operating income in this segment came to ¥2,840 million, up 2.6% from the previous fiscal year, due to the increase in net sales, despite the rise in fixed costs due to the removal of emergency measures taken in the first half of the previous fiscal year and the depreciation of the yen. In the FT segment, sales of production equipment for high-definition small- and medium-sized LCD panels decreased, but those of production equipment for large-sized television LCD panels increased. As a result, net sales in this segment amounted to ¥23,774 million, up 19.8% year on year. On the earnings front, reflecting the increase in net sales, this segment returned to profitability, posting an operating income of ¥339 million compared with an operating loss of ¥422 million in the previous fiscal year.
Earnings Analysis
Although sales decreased in the SE segment, sales in the GP and FT segments increased, and net sales for the Group as a whole rose ¥1,700 million, or 0.7%, year on year to ¥237,646 million. Operating income came to ¥17,168 million, up ¥8,265 million year on year due to reductions in variable costs, changes in the SE segment product mix and reduced loss on valuation of inventories despite the increase in fixed costs, including personnel costs and R&D expenses, because of the removal of emergency measures taken in the first half of the previous fiscal year and the depreciation of the yen. The ratio of operating income to net sales improved 3.4 percentage points from the previous fiscal year to 7.2%. Net other income and expenses worsened by ¥884 million from the preceding fiscal year to a net expense of ¥1,386 million in the year under review. Despite a decrease in interest
expenses during the year accompanying a reduction in inter-est-bearing debt, the loss was attributable to an increase in exchange loss on foreign currency translations and the post-ing of office transfer expenses for overseas subsidiaries. Income before income taxes was ¥15,782 million, up ¥7,381 million year on year, and net income was ¥12,122 million, up ¥6,703 million. The ratio of net income to net sales improved 2.8 percentage points from the previous term to 5.1%. Net income per share of common stock was ¥51.07, an improvement of ¥28.24 compared with amounts from the previous fiscal year, and return on equity improved 5.6 percentage points from the previous term to 12.3%. Return on total assets improved 2.7 percentage points from the previous term to 5.0%.
In the energy field, the Group worked to develop various thin film deposition equipment that uses high-density plasma chemical vapor generation technology to quickly apply extremely even coatings. The Group has also applied conven-tional slit coating technology to the development of coating and drying equipment for secondary battery electrodes. Furthermore, on April 1, 2015, a new organization was launched within SCREEN Holdings Co., Ltd. bringing
together R&D, sales and marketing functions at WHITE CANVAS RAKUSAI to accelerate the formation of businesses in new fields.
* Basic research expenses are, in principle, distributed among the segments in the calculation of segment income or loss presented under Segment Information.
Millions of yen
Years ended March 31, 2015 2014 2013 2012 2011Net sales ¥237,646 ¥235,946 ¥199,795 ¥250,090 ¥254,953Cost of sales 165,192 177,175 157,790 187,325 182,990Cost of sales to net sales (%) 69.5% 75.1% 79.0% 74.9% 71.8%Gross profit ¥ 72,454 ¥ 58,771 ¥ 42,005 ¥ 62,765 ¥ 71,963SGA expenses 55,286 49,868 46,838 49,267 45,152SGA expenses to net sales (%) 23.3% 21.1% 23.4% 19.7% 17.7%
Note: Effective from the fiscal year ended March 31, 2014, as for main unit sales in the SE and FT segments, the revenue recognition method was changed to the completion of installation basis. Accordingly, amounts for the fiscal year ended March 31, 2013 have been reclassified with amounts calculated by applying this change of accounting policies retroactively.
Research and Development Expenses
At the SCREEN Group, we maintain close relationships between SCREEN Holdings Co., Ltd. and Group companies to foster the combination and application of the diverse tech-nologies that are key to photolithography, including cleaning, coating, image processing, optical systems, and inspection and measurement technologies. This approach enables us to launch aggressive R&D initiatives spanning basic research through product development. In October 2014, the Group transitioned to a holding company structure. Under the new structure, the holding company, SCREEN Holdings Co., Ltd., will continue R&D aimed at further developing core technologies, promoting the global establishment of R&D sites, advancing open innova-tion and establishing businesses in new fields. Meanwhile, product development in existing business areas will be handled by the business operating companies, SCREEN Semiconductor Solutions Co., Ltd., SCREEN Graphic and Precision Solutions Co., Ltd. and SCREEN Finetech Solutions Co., Ltd. During the year under review, the Group invested ¥13,972 million in R&D. We invested mainly in reinforcing and expand-ing existing businesses, particularly those in the SE segment, as well as in R&D for new business creation in the new busi-ness fields of life science, inspection and measurement, printed electronics and energy. With regard to the SE segment, focusing on the develop-ment of ultra-miniaturization technologies to create IC circuits with line widths of under seven nanometers, the Group engaged in the joint development of cutting-edge semicon-ductor processes, including cleaning, wet etching, and lithography (coater/developers), with overseas research insti-tutions. We also worked on applying existing technologies to the upgrading of equipment suited for use with 200mm wafers in response to demand for flexible development and the production of power devices and micro-electromechani-cal systems (MEMS) for use in automobiles and other appli-cations. As a result, this segment’s R&D expenses amounted to ¥5,626 million. In the GP segment, with regard to graphic arts equipment and in response to the printing industry need for higher added value, such as for high-quality, personalized direct mail advertising, the Group developed the Truepress Jet 520HD, a high-definition
roll inkjet printing press that can accommodate variable data printing. This segment’s R&D expenses amounted to ¥3,692 million. In the FT segment, we worked on developing thin (film) resist coating technology in response to demand for thinner and higher definition LCD panels as well as the development of resin substrate-type LCD panels. This segment’s R&D expenses amounted to ¥547 million. In addition to the above segments, SCREEN Holdings Co., Ltd. also engaged in basic research and R&D related to new business fields. R&D expenses in these areas amounted to ¥4,107 million.* To develop the life science field, using its core direct imag-ing and image processing technologies, the Group devel-oped the DP-i3000 inkjet pharmaceutical tablet printer for the pharmaceutical industry. This printer is capable of printing easy-to-discern images directly onto tablets and is expected to help prevent mistakes in both the dispensing of prescrip-tions and taking of medicine. To develop the inspection and measurement field and in order to help prevent the overlooking of defects in visual inspections of forged automobile components, the Group used its core image processing technologies to develop the IM-3100 automatic optical forged component inspection system, which features high productivity and reliability. In the printed electronics field, the Group developed print-ing equipment using its unique ultra-fine printing technologies to form circuit patterns on thin, lightweight, bendable substrates and thus contributing to the development of new applications, such as electronic paper, high-quality touch panels and micro-sensors.
20
5
0
8
2
10 4
15 6
02011 2012 2013 2014 2015
R&D Expenses and Ratio of R&D Expenses to Net Sales
(Billions of Yen) (%)
(Years ended March 31)
� R&D Expenses � Ratio of R&D Expenses to Net Sales

44 45
Financial Section
Millions of yen
As of March 31, 2015 2014 2013 2012 2011Total assets ¥249,517 ¥232,376 ¥232,390 ¥245,382 ¥253,127 Reportable Segment: SE 114,733 119,015 117,714 133,927 129,061 GP 53,289 48,963 46,653 41,226 39,684 FT 20,624 13,664 13,428 15,662 26,446 Other 4,979 3,566 4,043 4,763 4,047 Adjustments 55,892 47,168 50,552 49,804 53,889Working capital 67,617 42,960 41,600 54,320 35,391Interest-bearing debt 39,677 41,375 70,443 47,676 55,590Equity 110,865 86,448 76,248 90,069 87,118Equity ratio (%) 44.4% 37.2% 32.8% 36.7% 34.4%Net assets per share of capital stock (yen) ¥ 467.13 ¥ 364.23 ¥ 321.24 ¥ 379.44 ¥ 367.00
Note: Effective from the fiscal year ended March 31, 2014, as for main unit sales in the SE and FT segments, the revenue recognition method was changed to the completion of installation basis. Accordingly, amounts for the fiscal year ended March 31, 2013 have been reclassified with amounts calculated by applying this change of accounting policies retroactively.
Capital Expenditures and Depreciation and Amortization
For the year ended March 31, 2015, capital expenditures for the Group, including expenditures for intangible fixed assets, totaled ¥6,659 million. In the SE segment, capital expenditures, centered on R&D and manufacturing facilities for semiconductor production equipment, amounted to ¥4,221 million. Capital expenditures in the GP segment, centered on R&D and manufacturing facilities for graphic arts equipment, were ¥866 million. In the FT segment, capital expenditures, invested mainly in R&D and other facilities for FPD production equipment, totaled ¥172 million.
Capital expenditures for other businesses, which went mainly to R&D facilities and information system-related equipment, came to ¥139 million. On a Groupwide basis, capital expenditures, centered on R&D facilities, amounted to ¥1,261 million. Depreciation and amortization during the year came to ¥4,880 million, up ¥779 million, or 19.0%, from the previous fiscal year.
80
20
0
40
60
2011 2012 2013 2014 2015
Working Capital
(Billions of Yen)
(Years ended March 31)
80
20
0
40
60
2011 2012 2013 2014 2015
Interest-Bearing Debt
(Billions of Yen)
(Years ended March 31)
120
20
0
60
20
10
40
3060
4080
100 50
02011 2012 2013 2014 2015
Equity and Equity Ratio
(Billions of Yen)
(Years ended March 31)
� Equity � Equity Ratio
(%)
500
100
0
200
300
400
2011 2012 2013 2014 2015
Net Assets Per Share of Capital Stock
(Yen)
(Years ended March 31)
40
-20
-40
0
20
2011 2012 2013 2014 2015
Return on Equity and Return on Total Assets
(%)
(Years ended March 31)
� Return on Equity � Return on Total Assets
20
-10
-20
0
10
2011 2012 2013 2014 2015
Ratio of Operating Income to Net Sales and Ratio of Net Income to Net Sales
(%)
(Years ended March 31)
� Ratio of Operating Income to Net Sales � Ratio of Net Income to Net Sales
Millions of yen
Years ended March 31, 2015 2014 2013 2012 2011Operating income (loss) ¥17,168 ¥8,903 ¥ (4,833) ¥13,498 ¥26,811Operating income to net sales (%) 7.2% 3.8% -2.4% 5.4% 10.5%Net income (loss) ¥12,122 ¥5,419 ¥(11,333) ¥ 4,637 ¥25,687Net income to net sales (%) 5.1% 2.3% -5.7% 1.9% 10.1%Per share of capital stock (yen) Net income (loss) ¥ 51.07 ¥22.83 ¥ (47.75) ¥ 19.54 ¥108.21 Net income - diluted — — — — —Return on equity (%) 12.3% 6.7% -14.2% 5.2% 33.9%Return on total assets (%) 5.0% 2.3% -4.8% 1.9% 10.9%
Notes: 1. Return on equity and return on total assets are calculated on the basis of average equity and average total assets, respectively, for the current and previous fiscal year-ends. 2. Effective from the fiscal year ended March 31, 2014, as for main unit sales in the SE and FT segments, the revenue recognition method was changed to the completion of installation
basis. Accordingly, amounts for the fiscal year ended March 31, 2013 have been reclassified with amounts calculated by applying this change of accounting policies retroactively.
150
0
-50
50
100
2011 2012 2013 2014 2015
Net Income Per Share of Capital Stock
(Yen)
(Years ended March 31)
Assets, Liabilities, and Net Assets
Total assets as of March 31, 2015 stood at ¥249,517 million, an increase of ¥17,141 million, or 7.4%, from March 31, 2014. This was due to an increase in trade notes and accounts receivable and an increase in investment securities accompanying rises in the market values of stocks held, despite a decrease in cash and time deposits. Total liabilities amounted to ¥138,004 million, down ¥7,275 million, or 5.0%, from the end of the previous fiscal year. This was due mainly to decreases in trade notes and accounts payable and interest-bearing debt. Interest-bearing debt decreased ¥1,698 million, or 4.1%, from March 31, 2014 to ¥39,677 million, due mainly to the redemption of bonds payable, in spite of an increase in loans payable. Net
interest-bearing debt, or interest-bearing debt minus cash and time deposits, increased ¥6,876 million, or 96.0%, from March 31, 2014 to ¥14,037 million. Total net assets amounted to ¥111,513 million, up ¥24,416 million, or 28.0%, from March 31, 2014. This was attributable mainly to an increase in retained earnings due to the posting of net income as well as an increase in valuation difference on available-for-sale securities due to the rising market values of stocks held and an increase in foreign currency translation adjustment due to the yen depreciation. As a result, the equity ratio as of March 31, 2015 improved 7.2 percentage points from the end of the previous fiscal year to 44.4%.
Financial Position and Liquidity

46 47
(1) Semiconductor and FPD market trendsWhile the semiconductor and FPD markets have recorded significant growth on rapid technological innovation, they are also susceptible to deterioration in market supply-demand balance which leads to cyclical upturns and downturns. Given such market conditions, the SCREEN Group is promoting business portfolio reform so that it can consis-tently generate profits during market downturns. However, unexpectedly large market downturns can have a material impact on the Group’s financial condition and business performance.
(2) Concentration of transactions with specific customersThe SCREEN Group delivers production equipment to lead-ing semiconductor manufacturers in Japan and overseas. However, as raising production capacity and responding to miniaturization trends in this industry requires huge capital investments, certain leading manufacturers are consolidating. Accordingly, the Group’s sales are tending to concentrate on specific customers. As a result, fluctuations in capital invest-ments and orders by these specific customers could have a material impact on the Group’s financial condition and busi-ness performance.
(3) Concentration of production sitesThe SCREEN Group’s domestic manufacturing sites are concentrated in the Kyoto and Shiga regions, and a large-scale earthquake or other disaster affecting this area could seriously damage the Group’s operations. To minimize the potential for loss and ensure continuation or early resumption of business operations, the Group has been promoting busi-ness continuity management (BCM). However, the halting of operations at a production site as a result of such a disaster could have a material impact on the Group’s financial condi-tion and business performance.
(4) Product qualityThe SCREEN Group has created its quality management system on the basis of standards for quality management systems (ISO 9001) and works to enhance the quality of its products and services. Nevertheless, if a product defect should arise and lead to a large-scale recall or product liabil-ity resulting in losses to a customer, the Group could incur significant additional expenses and suffer a decrease in trust, prompting a decline in sales. Such cases could have a mate-rial impact on the Group’s financial condition and business performance.
(5) New product developmentIn order to strengthen its earnings structure by expanding market share, the Group is working to concentrate development themes in line with the respective strategies of each in-house company to share technologies held within the Group and effectively utilize external technology resources to strengthen and invigorate its development capabilities in the timely introduction of products that incor-porate the latest technologies. This notwithstanding, extended development periods could result in delays in new product releases that could have a material impact on the Group’s financial condition and business performance.
(6) Intellectual property rightsOver the years the Group has striven to introduce into the market products utilizing the latest technologies into the market and has created various proprietary technologies within each business division. In addition, the Group has worked to establish and protect its intellectual property rights under related intellectual property laws and in contracts with other companies. However, given the increasing complexity of intellectual property rights in leading-edge technology fields, there is the risk that the Group could in the future become involved in intellectual property disputes and that such disputes could have a material impact on the Group’s financial condition and business performance.
(7) Information securityIn the course of its business operations, the Group handles various personal, customer and technological information. The Group has established Network System Management Regulations to strengthen the security of internal information systems as well as the SCREEN Group CSR Charter, which establishes a Code of Conduct for all Group employees to comply with in their business operations, seeking to reinforce information management. However, unforeseen leaks of confidential information could have a material impact on the Group’s financial condition and business performance.
(8) Corporate acquisitions and capital participation The Group may engage in corporate acquisitions or capital participation in other companies as part of its business strat-egy. While the Group will thoroughly examine each specific project before taking action, business plans may not proceed as originally planned after an acquisition or a business alli-ance is concluded, and this could have a material impact on the Group’s financial condition and business performance.
Risk Factors
Financial Section
8
2
0
4
6
2011 2012 2013 2014 2015
Capital Expenditures
(Billions of Yen)
(Years ended March 31)
6
2
0
4
2011 2012 2013 2014 2015
Depreciation and Amortization
(Billions of Yen)
(Years ended March 31)
Cash Flows
During the fiscal year ended March 31, 2015, net cash used in operating activities came to ¥1,492 million, compared with ¥24,703 million provided by operating activities in the previ-ous fiscal year. This was because cash outflows, including an increase in trade notes and accounts receivable and decrease in trade notes and accounts payable, outpaced cash inflows, including the posting of income before income taxes and depreciation and amortization. Net cash used in investing activities amounted to ¥6,318 million, compared with ¥4,201 million used in investing activi-ties in the previous fiscal year. This was due mainly to the
purchase of property, plant and equipment, such as equip-ment for R&D. Net cash used in financing activities amounted to ¥3,823 million, compared with ¥29,302 million used in financing activities in the previous fiscal year. This was attributable mainly to the redemption of bonds payable and cash divi-dends paid, in spite of an increase in loans payable. As a result, cash and cash equivalents as of March 31, 2015 totaled ¥21,991 million, down ¥9,571 million from March 31, 2014.
Millions of yen
Years ended March 31, 2015 2014 2013 2012 2011Capital expenditures ¥6,659 ¥4,574 ¥6,450 ¥7,347 ¥3,613 Reportable Segment: SE 4,221 2,224 4,238 2,951 2,510 GP 866 868 899 1,041 539 FT 172 86 132 448 323 Other 139 206 154 114 89 Adjustments 1,261 1,190 1,027 2,793 152Depreciation and amortization ¥4,880 ¥4,101 ¥4,731 ¥4,986 ¥5,805 Reportable Segment: SE 2,620 2,542 2,970 3,204 3,452 GP 625 485 407 310 674 FT 59 80 79 329 460 Other 119 110 103 112 121 Adjustments 1,457 884 1,172 1,031 1,098
Millions of yen
Years ended March 31, 2015 2014 2013 2012 2011Cash flows from operating activities ¥(1,492) ¥24,703 ¥(15,320) ¥11,279 ¥34,299Cash flows from investing activities (6,318) (4,201) (5,768) (4,162) (2,191)Cash flows from financing activities (3,823) (29,302) 21,534 (9,468) (22,250)Effect of exchange rate changes on cash and cash equivalents 2,062 2,335 1,949 (400) (1,380)
Net increase (decrease) in cash and cash equivalents ¥(9,571) ¥ (6,465) ¥ 2,395 ¥ (2,751) ¥ 8,478

48 49
Net Sales and Income (Loss) in Reportable SegmentsMillions of yen
Years ended March 31, 2015 2014 2013 2012 2011Net Sales Reportable Segment: SE ¥157,479 ¥163,132 ¥140,690 ¥167,593 ¥174,279
GP 55,707 52,156 46,324 49,164 47,306 FT 23,774 19,850 12,042 32,611 32,711 Other 770 808 739 722 657 Intersegment sales (84) — — — —Consolidated ¥237,646 ¥235,946 ¥199,795 ¥250,090 ¥254,953
Operating Income (Loss) Reportable Segment: SE ¥ 15,738 ¥ 8,760 ¥ (3,753) ¥ 13,628 ¥ 28,141 GP 2,840 2,768 1,475 2,305 (1,304) FT 339 (422) (836) (1,217) 34 Other (805) (652) (158) 3 303 Total ¥ 18,112 ¥ 10,454 ¥ (3,272) ¥ 14,719 ¥ 27,174 Adjustments (944) (1,551) (1,561) (1,221) (363)Consolidated ¥ 17,168 ¥ 8,903 ¥ (4,833) ¥ 13,498 ¥ 26,811
Notes: 1. The SCREEN Group has created three business segments for reporting: “Semiconductor Solutions (SE),” “Graphic and Precision Solutions (GP),” and “Finetech Solutions (FT).” The products and services of each segment are as follows: SE: Development, manufacturing, sale, and maintenance services of semiconductor production equipment GP: Development, manufacturing, sale, and maintenance services of graphic arts equipment and PCB related equipment F T: Development, manufacturing, sale, and maintenance services of FPD production equipment 2. The “Other” category incorporates operations not included in reportable segments, including software development, planning and production of printed matter, logistics operations
and other businesses. 3. For more information such as details of each reportable segment, see Note 7, “Segment Information.” 4. Effective from the fiscal year ended March 31, 2014, as for main unit sales in the SE and FT segments, the revenue recognition method was changed to the completion of installation
basis. Accordingly, amounts for the fiscal year ended March 31, 2013 have been reclassified with amounts calculated by applying this change of accounting policies retroactively.
Domestic Sales and Overseas SalesMillions of yen
Years ended March 31, 2015 2014 2013 2012 2011Domestic sales ¥ 53,483 ¥ 53,300 ¥ 44,109 ¥ 62,135 ¥ 52,629 Overseas sales 184,163 182,646 155,686 187,955 202,324 North America 52,992 47,094 45,185 53,479 54,365 Asia & Oceania 92,321 111,555 80,395 92,063 114,787 Europe 36,829 21,914 19,227 26,138 26,573 Others 2,021 2,083 10,879 16,275 6,599 Ratio of overseas sales to net sales (%) 77.5% 77.4% 77.9% 75.2% 79.4% Net sales ¥237,646 ¥235,946 ¥199,795 ¥250,090 ¥254,953
Notes: 1. Sales to customers in Japan by the Company and its consolidated subsidiaries. 2. Sales to customers outside Japan by the Company and its consolidated subsidiaries. 3. For information by geographic areas, see Note 7, “Segment Information.” 4. Effective from the fiscal year ended March 31, 2014, as for main unit sales in the SE and FT segments, the revenue recognition method was changed to the completion of installation
basis. Accordingly, amounts for the fiscal year ended March 31, 2013 have been reclassified with amounts calculated by applying this change of accounting policies retroactively.
Segment InformationFinancial Section
(9) Interest rate fluctuationsAll the Group’s interest-bearing debt as of the end of the fiscal year was fixed-rate debt and was, therefore, not subject to interest rate fluctuation risk. Nevertheless, the Group’s financial condition and business performance could be materially affected by the impact of interest rate fluctuations on new fund procurement at variable interest rates.
(10) Procurement of fundsCertain loan contracts of the Company provide for financial covenants regarding its consolidated net assets at the end of each fiscal year and its consolidated ordinary income (loss) of each fiscal year. If these covenants were to be breached and the financial institutions required repayment, the Company could be forced to forfeit the benefit of time in relation to such loans. In such a case, the Company could also forfeit the benefit of time in relation to its bonds and other loans. If the Company forfeits the benefit of time for its loans and incurs the obligation to make a lump-sum repayment, it could have a material impact on the Group’s financial condition.
(11) Exchange rate fluctuationsAs the Group has a high overseas sales ratio, we make a proactive effort to avoid exchange rate risks on export sales by conducting transactions denominated in yen. However, some transactions are denominated in foreign currencies. While the Group is working to minimize the impact of exchange rate fluctuations by using forward exchange contracts and other measures to minimize the impact on its business performance, rapid fluctuations in exchange rates could have a material impact on the Group’s financial condi-tion and business performance.
(12) Retirement benefit obligationsThe Group calculates accrued pension and severance costs based on assumed discount rates set by actuarial calcula-tions and on expected returns on pension asset investments. If differences arise between actual results and assumed costs, changes in assumed parameters and/or declines in pension fund returns, the recognition of future costs and the recording of benefit obligations could be affected. While the Group is working through a conversion from a qualified retirement pension system to a cash balance plan and a defined contribution plan and taking other measures to reduce the impact of retirement benefit obligations, worse than forecasted investment returns and other factors could have a material impact on the Group’s financial condition and business performance.
(13) Impact of impairment accountingDue to the application of impairment accounting for fixed assets, future trends in property prices and the earnings outlook for the business could have a material impact on the Group’s financial condition and business performance.
(14) Recoverability of deferred tax assetsThe SCREEN Group records deferred tax assets against temporary differences due to future losses and loss carryfor-wards for tax purposes based on rational forecasts of future income taxes and its judgments of their recoverability. The Group reviews its assumptions on future income taxes based on such factors as changes in the management environment. A resulting decision that some or all of these deferred tax assets are unrecoverable and that the drawing down of deferred tax assets is necessary could have a material impact on the Group’s financial condition and business performance.
(15) Other risksIn addition to the above described risks, the Group’s busi-ness operations are affected, as are those of other compa-nies, by risks of the global and domestic political environment, the economic environment, natural disasters such as earthquakes and floods, wars, terrorism, epidemics, stock markets, commodity markets, regulations by govern-ment and etc., the supply systems of business associates and employment conditions. Adverse developments in any of the above areas could, therefore, have a material impact on the Group’s financial condition and business performance.

50 51
Millions of yen
Thousands of U.S. dollars
Assets 2015 2014 2015
Current Assets:
Cash and cash equivalents (Note 9) ¥ 21,991 ¥ 31,562 $ 183,258
Time deposits (Note 9) 3,650 2,652 30,417
Trade notes and accounts receivable (Note 9) 55,054 45,257 458,783
Allowance for doubtful receivables (Note 9) (795) (860) (6,625)
Inventories 70,311 70,159 585,925
Deferred tax assets (Note 3) 4,793 3,959 39,942
Prepaid expenses and other 5,363 4,598 44,692
Total current assets 160,367 157,327 1,336,392
Property, Plant and Equipment, at Cost (Notes 2 and 6):
Land 9,939 9,907 82,825
Buildings and structures 52,804 52,257 440,033
Machinery, equipment and other 49,810 46,039 415,084
Lease assets 6,705 6,193 55,875
Construction in progress 1,470 1,425 12,250
Total property, plant and equipment 120,728 115,821 1,006,067
Accumulated depreciation (78,122) (75,110) (651,017)
Net property, plant and equipment 42,606 40,711 355,050
Investments and Other Assets:
Investment securities (Notes 9 and 11) 36,346 28,582 302,883
Investments in unconsolidated subsidiaries and affiliated companies (Notes 9 and 11) 39 38 325
Lease assets (Notes 2 and 6) 38 130 317
Net defined benefit asset (Note 12) 4,748 200 39,567
Deferred tax assets (Note 3) 292 309 2,433
Other assets 5,081 5,079 42,341
Total investments and other assets 46,544 34,338 387,866
Total Assets ¥249,517 ¥232,376 $2,079,308
The accompanying notes to the consolidated financial statements are an integral part of these statements.
Millions of yen
Thousands of U.S. dollars
Liabilities and Net Assets 2015 2014 2015
Current Liabilities:
Short-term debt (Notes 4 and 9) ¥ — ¥ 104 $ —
Current portion of long-term debt (Notes 4 and 9) 3,680 16,254 30,667
Lease obligations (Notes 2 and 9) 397 819 3,308
Notes and accounts payable—
Trade (Note 9) 62,382 68,705 519,850
Construction and other 3,839 2,477 31,992
Accrued expenses 7,879 6,557 65,658
Income taxes payable 2,375 1,485 19,792
Provision for product warranties 4,557 5,021 37,975
Provision for directors’ bonuses 126 56 1,050
Provision for loss on order received 18 575 150
Other current liabilities 7,497 12,314 62,475
Total current liabilities 92,750 114,367 772,917
Long-Term Liabilities:
Long-term debt (Notes 4 and 9) 32,666 21,943 272,217
Net defined benefit liability (Note 12) 716 1,292 5,967
Provision for directors' retirement benefits 114 95 950
Lease obligations (Notes 2 and 9) 2,934 2,255 24,450
Deferred tax liabilities (Note 3) 8,357 4,843 69,642
Asset retirement obligations 49 49 408
Other long-term liabilities 418 435 3,483
Total long-term liabilities 45,254 30,912 377,117
Contingent Liabilities (Note 8)
Net Assets (Note 5):
Shareholders’ Equity:
Capital stock
Authorized—900,000,000 shares in 2015 and 2014
Issued—253,974,333 shares in 2015 and 2014 54,045 54,045 450,375
Capital surplus 4,583 4,583 38,192
Retained earnings 54,448 41,824 453,733
Treasury stock, at cost 16,642,614 shares in 2015 and 16,625,067 shares in 2014 (12,263) (12,251) (102,192)
Total shareholders’ equity 100,813 88,201 840,108
Accumulated Other Comprehensive Income:
Valuation difference on available-for-sale securities 12,586 7,089 104,883
Foreign currency translation adjustment (1,394) (4,834) (11,617)
Remeasurements of defined benefit plans (1,140) (4,008) (9,500)
Total accumulated other comprehensive income 10,052 (1,753) 83,766
Minority Interests:
Minority interests 648 649 5,400
Total net assets 111,513 87,097 929,274
Total Liabilities and Net Assets ¥249,517 ¥232,376 $2,079,308
Financial SectionConsolidated Balance SheetsSCREEN Holdings Co., Ltd. and Consolidated Subsidiaries As of March 31, 2015 and 2014
52 53
Millions of yen
Shareholders’ equityAccumulated other
comprehensive income
Shares of issued capital
stock (thousands)
Capital stock
Capital surplus
Retained earnings
Treasury stock
Valuation difference on available-for-sale securities
Foreign currency
translation adjustments
Remeasure- ments of defined
benefit plansMinority interests
Total net assets
Balance at the beginning of fiscal 2014 253,974 ¥54,045 ¥4,583 ¥36,405 ¥(12,245) ¥ 2,717 ¥(9,257) ¥ — ¥606 ¥ 76,854
Net income — — — 5,419 — — — — — 5,419
Valuation difference on available-for-sale securities — — — — — 4,372 — — — 4,372
Foreign currency translation adjustments — — — — — — 4,423 — — 4,423
Remeasurements of defined benefit plans — — — — — — — (4,008) — (4,008)
Acquisition of treasury stock — — — — (6) — — — — (6)
Disposal of treasury stock — — (0) — 0 — — — — 0
Other — — — — — — — — 43 43
Balance at the end of fiscal 2014 253,974 ¥54,045 ¥4,583 ¥41,824 ¥(12,251) ¥ 7,089 ¥(4,834) ¥(4,008) ¥649 ¥ 87,097
Balance at the beginning of fiscal 2015 253,974 ¥54,045 ¥4,583 ¥41,824 ¥(12,251) ¥ 7,089 ¥(4,834) ¥(4,008) ¥649 ¥ 87,097
Cumulative effects of changes in accounting policies — — — 1,214 — — — — — 1,214
Currently stated balance, as of beginning of current period 253,974 ¥54,045 ¥4,583 ¥43,038 ¥(12,251) ¥ 7,089 ¥(4,834) ¥(4,008) ¥649 ¥ 88,311
Net income — — — 12,122 — — — — — 12,122
Cash dividends paid, ¥3.00 per share — — — (712) — — — — — (712)
Valuation difference on available-for-sale securities — — — — — 5,497 — — — 5,497
Foreign currency translation adjustments — — — — — — 3,440 — — 3,440
Remeasurements of defined benefit plans — — — — — — — 2,868 — 2,868
Acquisition of treasury stock — — — — (12) — — — — (12)
Other — — — — — — — — (1) (1)
Balance at the end of fiscal 2015 253,974 ¥54,045 ¥4,583 ¥54,448 ¥(12,263) ¥12,586 ¥(1,394) ¥(1,140) ¥648 ¥111,513
Thousands of U.S. dollars
Shareholders’ equityAccumulated other
comprehensive income
Capital stock
Capital surplus
Retained earnings
Treasury stock
Valuation difference on available-for-sale securities
Foreign currency
translation adjustments
Remeasure- ments of defined
benefit plansMinority interests
Total net assets
Balance at the beginning of fiscal 2015 $450,375 $38,192 $348,533 $(102,092) $ 59,075 $(40,283) $(33,400) $5,408 $725,808
Cumulative effects of changes in accounting policies — — 10,116 — — — — — 10,116
Currently stated balance, as of beginning of current period $450,375 $38,192 $358,649 $(102,092) $ 59,075 $(40,283) $(33,400) $5,408 $735,924
Net income — — 101,017 — — — — — 101,017
Cash dividends paid, $0.03 per share — — (5,933) — — — — — (5,933)
Valuation difference on available-for-sale securities — — — — 45,808 — — — 45,808
Foreign currency translation adjustments — — — — — 28,666 — — 28,666
Remeasurements of defined benefit plans — — — — — — 23,900 — 23,900
Acquisition of treasury stock — — — (100) — — — — (100)
Other — — — — — — — (8) (8)
Balance at the end of fiscal 2015 $450,375 $38,192 $453,733 $(102,192) $104,883 $(11,617) $ (9,500) $5,400 $929,274
The accompanying notes to the consolidated financial statements are an integral part of these statements.
Financial SectionConsolidated Statements of OperationsSCREEN Holdings Co., Ltd. and Consolidated Subsidiaries For the years ended March 31, 2015 and 2014
Consolidated Statements of Changes in Net AssetsSCREEN Holdings Co., Ltd. and Consolidated Subsidiaries For the years ended March 31, 2015 and 2014
Millions of yen
Thousands of U.S. dollars
2015 2014 2015
Net Sales (Note 7) ¥237,646 ¥235,946 $1,980,383
Cost of Sales (Note 7) 165,192 177,175 1,376,600
Gross profit 72,454 58,771 603,783
Selling, General and Administrative Expenses 55,286 49,868 460,716
Operating income (Note 7) 17,168 8,903 143,067
Other (Income) Expenses:
Interest and dividend income (620) (527) (5,167)
Interest expenses 1,020 1,115 8,500
Exchange loss on foreign currency transactions, net 851 117 7,092
Sales discounts 188 222 1,567
Gain on sales of investment securities (Note 9) (91) (12) (758)
Gain on bargain purchase (181) — (1,508)
Loss on valuation of investment securities — 5 —
Office transfer expenses (Note 15) 364 — 3,033
Impairment loss 181 — 1,508
Loss on valuation of investments in capital 41 — 342
Other, net (367) (418) (3,059)
Net other expenses 1,386 502 11,550
Income Before Income Taxes 15,782 8,401 131,517
Income Taxes (Note 3)
Current 3,419 2,342 28,492
Deferred 163 635 1,358
Total income taxes 3,582 2,977 29,850
Income Before Minority Interests 12,200 5,424 101,667
Minority Interests in Net Income of Consolidated Subsidiaries 78 5 650
Net Income ¥ 12,122 ¥ 5,419 $ 101,017
Per Share of Capital Stock:
Yen U.S. dollars
2015 2014 2015
Net income ¥ 51.07 ¥ 22.83 $ 0.43
Net income—diluted — — —
Cash dividends, applicable to earnings for the year 7.00 3.00 0.06
The accompanying notes to the consolidated financial statements are an integral part of these statements.
Consolidated Statements of Comprehensive IncomeSCREEN Holdings Co., Ltd. and Consolidated Subsidiaries For the years ended March 31, 2015 and 2014
Millions of yen
Thousands of U.S. dollars
2015 2014 2015
Income Before Minority Interests ¥12,200 ¥ 5,424 $101,667
Other Comprehensive Income (Note 13)
Valuation difference on available-for-sale securities 5,498 4,373 45,817
Foreign currency translation adjustment 3,452 4,465 28,766
Remeasurements of defined benefit plans 2,868 — 23,900
Total other comprehensive income 11,818 8,838 98,483
Comprehensive Income (Note 13) ¥24,018 ¥14,262 $200,150
Comprehensive income attributable to
Owners of the parent 23,926 14,213 199,383
Minority interests 92 49 767
The accompanying notes to the consolidated financial statements are an integral part of these statements.

54 55
Notes to Consolidated Financial StatementsSCREEN Holdings Co., Ltd. and Consolidated Subsidiaries For the years ended March 31, 2015 and 2014
Millions of yen
Thousands of U.S. dollars
2015 2014 2015
Cash Flows from Operating Activities:
Income before income taxes ¥15,782 ¥ 8,401 $131,517
Depreciation and amortization 4,880 4,101 40,667
Impairment loss 181 — 1,508
Loss (gain) on valuation of investment securities — 5 —
Loss (gain) on sales of investment securities (91) (12) (758)
Loss on valuation of investments in capital 41 — 342
Gain on bargain purchase (181) — (1,508)
Office transfer expenses 364 — 3,033
Increase (decrease) in net defined benefit liability (328) (254) (2,733)
Increase (decrease) in provision for directors’ bonuses 71 16 592
Increase (decrease) in provision for product warranties (514) 37 (4,283)
Increase (decrease) in provision for loss on order received (557) 443 (4,642)
Interest and dividend income (620) (527) (5,167)
Interest expenses 1,020 1,115 8,500
Decrease (increase) in trade notes and accounts receivable (9,168) (3,392) (76,400)
Decrease (increase) in inventories 1,248 5,105 10,400
Decrease (increase) in other current assets (1,219) (349) (10,158)
Increase (decrease) in trade notes and accounts payable (5,993) 7,324 (49,942)
Increase (decrease) in accrued expenses 1,095 1,372 9,125
Increase (decrease) in other current liabilities (4,220) 3,828 (35,167)
Other, net (567) 13 (4,727)
Subtotal 1,224 27,226 10,199
Interest and dividend income received 614 526 5,117
Interest expenses paid (1,024) (1,081) (8,533)
Contribution in connection with the shift to a defined contribution pension plan (1) (16) (8)
Income taxes paid (2,305) (1,952) (19,208)
Net cash provided by (used in) operating activities (1,492) 24,703 (12,433)
Cash Flows from Investing Activities:
Decrease (increase) in time deposits, net (660) 189 (5,500)
Purchase of property, plant and equipment (4,655) (3,458) (38,792)
Proceeds from sales of property, plant and equipment 22 9 183
Purchase of investment securities (200) (150) (1,667)
Proceeds from sales of investment securities 105 35 875
Purchase of treasury shares of subsidiaries (102) — (850)
Other, net (828) (826) (6,899)
Net cash used in investing activities (6,318) (4,201) (52,650)
Cash Flows from Financing Activities:
Increase (decrease) in short-term debt, net (102) (33,700) (850)
Proceeds from long-term debt 15,400 — 128,333
Repayments of long-term debt (3,251) (3,396) (27,092)
Repayments of finance lease obligations (1,142) (742) (9,517)
Proceeds from issuance of bonds — 8,547 —
Redemption of bonds (14,000) — (116,667)
Decrease (increase) in treasury stock, net (11) (6) (92)
Cash dividends paid (712) — (5,933)
Cash dividends paid to minority shareholders (5) (5) (42)
Net cash used in financing activities (3,823) (29,302) (31,860)
Effect of Exchange Rate Changes on Cash and Cash Equivalents 2,062 2,335 17,184
Net Increase (Decrease) in Cash and Cash Equivalents (9,571) (6,465) (79,759)
Cash and Cash Equivalents at Beginning of Year 31,562 38,027 263,017
Cash and Cash Equivalents at End of Year ¥21,991 ¥31,562 $183,258
The accompanying notes to the consolidated financial statements are an integral part of these statements.
Financial SectionConsolidated Statements of Cash FlowsSCREEN Holdings Co., Ltd. and Consolidated Subsidiaries For the years ended March 31, 2015 and 2014
(a) Basis of presenting consolidated financial statements
The accompanying consolidated financial statements of SCREEN
Holdings Co., Ltd. (the “Company”) have been prepared in accor-
dance with the provisions set forth in the Financial Instruments and
Exchange Law and its related accounting regulations and in confor-
mity with accounting principles generally accepted in Japan, which
are different in certain respects as to application and disclosure
requirements from International Financial Reporting Standards.
The accounts of the consolidated overseas subsidiaries have been
prepared in accordance with either International Financial Reporting
Standards or U.S. generally accepted accounting principles, with
adjustments for the five specified items as applicable. The accompa-
nying consolidated financial statements have been restructured and
translated into English, with some expanded descriptions, from the
consolidated financial statements of the Company prepared in
accordance with Japanese GAAP and filed with the appropriate
Local Finance Bureau of the Ministry of Finance as required by the
Financial Instruments and Exchange Law. Some supplementary
information included in the Japanese language statutory consolidated
financial statements, but not required for fair presentation, is not
presented in the accompanying consolidated financial statements.
Certain Japanese yen amounts in the accompanying consolidated
financial statements have been translated into U.S. dollar amounts
solely for the convenience of readers outside Japan, using the
prevailing exchange rate as of March 31, 2015, which was ¥120 to
U.S. $1.00. This translation should not be construed as a represen-
tation that the amounts shown could be converted into U.S. dollars
at this or any other rate of exchange.
Certain amounts in the prior years’ consolidated financial statements
have been reclassified to conform to the current year’s presentation.
(b) Principles of consolidation
The accompanying consolidated financial statements include the
accounts of the Company and significant companies over which the
Company has power of control through majority voting rights or the exis-
tence of certain other conditions evidencing control by the Company.
Investments in unconsolidated subsidiaries are accounted for by
the equity method.
(c) Translation of foreign currencies
Receivables and payables denominated in foreign currencies are
translated into Japanese yen at year-end rates.
Except for shareholders’ equity accounts, which are translated at
historical rates, balance sheets of the consolidated overseas subsid-
iaries are translated into Japanese yen at year-end rates.
Except for transactions with the Company, which are translated at
rates used by the Company, income statements of the consolidated
overseas subsidiaries are translated at average rates.
The resulting translation adjustments are presented as foreign
currency translation adjustments in net assets.
(d) Inventories
The Company and its consolidated domestic subsidiaries state the
value of inventories mainly by either the first-in, first-out method or
the specific identification method. With regard to the amounts stated
in the balance sheet, the book value devaluation method is used to
write down the value of inventory in the event of a decline in profitability.
Consolidated overseas subsidiaries state inventories mainly at the
lower of cost or net realizable value either by the first-in, first-out
method or the specific identification method.
(e) Securities
The Company and its consolidated subsidiaries classify securities as
“available-for-sale securities.” Available-for-sale securities with avail-
able fair values are stated at fair value. Unrealized holding gains
(losses) on these securities are reported, net of applicable income
taxes, as a separate component of net assets. Realized gains and
losses on the sales of such securities are computed using moving
average cost. Other securities with no available fair values are stated
at moving average cost.
(f) Depreciation
Depreciation of property, plant and equipment of the Company and
its consolidated domestic subsidiaries is computed primarily by the
straight-line method.
Depreciation of property, plant and equipment of the consolidated
overseas subsidiaries is computed mainly by the straight-line
method.
The estimated useful lives are as follows:
Buildings and structures 2–60 years
Machinery and equipment 2–17 years
Maintenance and repairs, including minor renewals and better-
ments, are charged to income as incurred.
Leased assets related to finance lease transactions in which
ownership transfers to the lessee are depreciated in the same
manner as owned property, plant and equipment.
Leased assets related to finance lease transactions in which
ownership does not transfer are depreciated on a straight-line basis,
with the lease periods as the useful life and no residual value.
(g) Impairment of fixed assets
The Company and its consolidated subsidiaries evaluate the book
value of fixed assets for impairment. If the book value of a fixed asset
is impaired, the amount by which the book value exceeds the recov-
erable amount is recognized as impairment loss.
(h) Software
Software, included in “Other assets,” is amortized using the straight-
line method over its estimated useful life (3-5 years for internal use
software and 3 years for software for sale).
(i) Research and development
Expenses related to research and development are charged to
income as incurred and amounted to ¥13,972 million ($116,433
thousand) in 2015 and ¥12,274 million in 2014.
(j) Cash and cash equivalents
Cash and cash equivalents include cash on hand and deposits
placed with banks on demand or with maturities of three months
or less.
(k) Goodwill
Goodwill, which represents the excess of the purchase price over
the fair value of net assets acquired, is amortized on a straight-line
basis over a period of five years.
(l) Bonds issue costs
Bonds issue costs are charged to expenses as incurred.
(m) Income taxes
The Company and its consolidated subsidiaries record deferred tax
assets and liabilities on loss carryforwards and temporary differences
between the carrying amounts of assets and liabilities for financial
reporting purposes and the amounts used for income tax purposes
by using the asset/ liability approach.
Note 1: Summary of Significant Accounting and Reporting Policies

56 57
(n) Allowance for doubtful receivables
An allowance for doubtful receivables is provided to cover possible
losses on collection. The Company and its consolidated domestic
subsidiaries provide the allowance for doubtful receivables by adding
individually estimated uncollectible amounts of specific items to an
amount based on the actual rate of past uncollected receivables.
The consolidated overseas subsidiaries provide the allowance for
doubtful receivables based mainly on the estimated uncollectible
amounts of specific receivables.
(o) Provision for directors’ bonuses
Certain consolidated subsidiaries provide provision for directors’ bonuses
based on the estimated amounts of payments for the fiscal year.
(p) Employees’ severance and retirement benefits
The Company and its consolidated subsidiaries provide funded or
unfunded defined benefit plans and defined contribution plans for
employees’ severance and retirement benefits. The Company and
certain consolidated domestic subsidiaries have a cash balance plan
in defined benefit pension plans combined with defined contribution
pension plans.
Certain consolidated domestic subsidiaries have unfunded lump-
sum payment plans.
Certain consolidated overseas subsidiaries have defined contribu-
tion plans.
In calculating retirement benefit obligations, the method of attribut-
ing expected benefit to periods up to the end of the fiscal year is
based on a benefit formula basis.
Actuarial gains and losses are recognized in expenses using the
straight-line method within the average of the estimated remaining
service years (mainly 13 years) commencing with the following period.
(q) Retirement benefits for directors and corporate auditors
Certain consolidated subsidiaries have unfunded retirement and
termination allowance plans for directors and statutory auditors. The
amounts required under the plans have been fully accrued.
(r) Provision for product warranties
The Company and certain consolidated subsidiaries provide for esti-
mated product warranty costs for the warranty period after product
delivery based on actual payments in the past.
(s) Provision for loss on order received
Estimated loss accrued in or after the next fiscal year is provided to
cover possible future loss related to orders received if future losses is
expected and can be reasonably estimated. (If the net sales value is
negative after calculations based on the “Accounting Standard for
Measurement of Inventories” (ASBJ Statement No. 9, issued on July
5, 2006), the amounts are provided for as provision for loss on order
received.)
(t) Derivatives and hedge accounting
If derivative financial instruments are used as hedges and meet certain
hedging criteria, the Company defers recognition of gain or loss result-
ing from a change in the fair value of the derivative financial instrument
until the related loss or gain on the hedged item is recognized.
When a forward foreign exchange contract meets certain condi-
tions, the hedged item is stated at the forward exchange contract rate.
If interest rate swap contracts are used as hedges and meet
certain hedging criteria, the net amount to be paid or received under
the interest rate swap contract is added to or deducted from the
interest on the assets or liabilities for which the swap contract
was executed.
The Company uses forward foreign exchange contracts, interest
rate swap contracts and interest rate cap contracts only for the
purpose of mitigating future risk of fluctuation in foreign currency
exchange rates and interest rates. In terms of forward foreign
exchange contracts, the Company uses them within the amounts of
foreign currency receivables and authorized forecast transactions.
The following table summarizes the derivative financial instruments
used in hedge accounting and the related hedged items.
Hedging instruments: Hedged items:
Forward foreign exchange contracts Foreign currency receivables
Interest rate swap contracts Interest on short-term and long-term debt
Interest rate cap contracts Interest on short-term and long-term debt
The Company executes and manages derivative transactions in
accordance with established internal policies and specified limits on
the amounts of derivative transactions allowed. The derivative trans-
actions are reported to and approved by the Board of Directors.
The Company evaluates hedge effectiveness semiannually by
comparing the cumulative changes in the hedging derivative instru-
ments and the items hedged.
(Changes of accounting policies)
(Adoption of new accounting standards for retirement benefits)
Effective from the fiscal year ended March 31, 2015, SCREEN
Holdings and its consolidated domestic subsidiaries have applied
the Accounting Standard for Retirement Benefits (ASBJ Statement
No. 26, May 17, 2012 (hereinafter, “Statement No. 26”)) and
Guidance on Accounting Standard for Retirement Benefits (ASBJ
Guidance No. 25, March 26, 2015 (hereinafter, “Guidance No. 25”))
with respect to certain provisions described in Article 35 of Statement
No. 26 and Article 67 of Guidance No. 25. As a result, the methods
for calculating retirement benefit obligations and service costs have
been revised in several respects. The method for attributing projected
benefits to periods has been changed from the straight-line basis to
the benefit formula basis, and the method for determining the
discount rate has been changed from a method based on an approx-
imation of the average of the estimated remaining service years to
a method using a single weighted-average discount rate that reflects
the periods until the expected payment of retirement benefits and the
amount of projected benefits every such period.
According to the transitional treatment provided in Article 37 of
Statement No. 26, the effect of changing the method for calculating
retirement benefit obligations and service costs was recognized by
adjusting retained earnings at the beginning of the fiscal year ended
March 31, 2015.
As a result of the application, net defined benefit asset, retained
earnings and deferred tax liabilities were ¥1,881 million ($15,675
thousand), ¥1,214 million ($10,116 thousand) and ¥668 million
($5,567 thousand) greater, respectively, at the beginning of the fiscal
year ended March 31, 2015 than they would have been without the
application. The effect of this change on operating income, ordinary
income, income before income taxes and net assets per share of
capital stock for the fiscal year ended March 31, 2015 was immaterial.
(Accounting standards issued but not yet applied)
• Revised Accounting Standards for Business Combination (ASBJ
Statement No. 21, September 13, 2013)
• Revised Accounting Standard for Consolidated Financial
Statements (ASBJ Statement No. 22, September 13, 2013)
• Revised Accounting Standard for Business Divestitures (ASBJ
Statement No. 7, September 13, 2013)
• Revised Accounting Standard for Earnings Per Share (ASBJ
Statement No. 2, September 13, 2013)
• Revised Guidance on Accounting Standard for Business
Combinations and Accounting Standards for Business Divestitures
(ASBJ Guidance No. 10, September 13, 2013)
• Revised Guidance on Accounting Standard for Earnings Per Share
(ASBJ Guidance No. 4, September 13, 2013)
1. Summary
The above standards and guidance have been revised primarily to
account for:
(1) How changes in the shares in subsidiaries over which the
Company continues to control should be treated by the Company
when additional stock of a subsidiary is acquired.
(2) Treatment of acquisition related costs
(3) Presentation of current net income and changes in shareholders’
equity from minority interests to non-controlling interests
(4) Provisional application of accounting treatments
2. Effective date
Effective from the beginning of the fiscal year ending March 31,
2016.
Provisional application of the accounting standards is scheduled
to begin for business combinations effective after the beginning of
the fiscal year ending March 31, 2016.
3. Effects of application of the standards
The Company and its consolidated domestic subsidiaries are
currently in the process of determining the effects of these new stan-
dards on the consolidated financial statements.
Note 2: Consolidated Statements of Cash Flows
Significant noncash financing activities for the years ended March 31, 2015 and 2014 were as follows:
Newly booked assets and liabilities relating to finance leases
Millions of yen
Thousands of U.S. dollars
2015 2014 2015
Lease assets ¥1,118 ¥147 $ 9,317
Lease obligations 1,398 149 11,650
Financial Section

58 59
Note 3: Income Taxes
The Company is subject to several taxes based on income with an
aggregate statutory tax rate of approximately 35.5% in 2015 and
2014. As of March 31, 2015, the Company and certain consolidated
subsidiaries had net tax loss carryforwards aggregating ¥73,168
million ($609,733 thousand), which were available to offset the
respective future taxable incomes of these companies. Significant
components of the Company and its consolidated subsidiaries’
deferred tax assets and liabilities as of March 31, 2015 and 2014
were as follows:
Millions of yen
Thousands of U.S. dollars
2015 2014 2015
Deferred tax assets (current)
Accrued bonuses for employees ¥ 996 ¥ 896 $ 8,300
Loss on valuation of inventories 2,607 3,529 21,725
Provision for product warranties 1,398 1,682 11,650
Other 2,885 1,945 24,042
Valuation allowance (3,087) (4,082) (25,725)
Deferred tax liabilities (current)
Adjustment of allowance for doubtful accounts and other (15) (45) (125)
Net deferred tax assets (current) ¥ 4,784 ¥ 3,925 $ 39,867
Deferred tax assets (noncurrent)
Net operating loss carryforwards ¥23,727 ¥26,443 $197,725
Research and development expenses 1,371 1,723 11,425
Depreciation 1,074 1,254 8,950
Net defined benefit liability 403 1,434 3,358
Other 3,043 3,528 25,358
Valuation allowance (28,864) (33,352) (240,533)
Deferred tax liabilities (noncurrent)
Undistributed earnings of consolidated overseas subsidiaries (1,504) (1,109) (12,533)
Valuation difference on available-for-sale securities (5,381) (3,399) (44,842)
Net defined benefit asset (1,875) (1,044) (15,625)
Other (59) (12) (491)
Net deferred tax liabilities (noncurrent) ¥ (8,065) ¥ (4,534) $ (67,208)
A reconciliation of the aggregate statutory income tax rate and the
effective income tax rate as a percentage of income before income
taxes for the year ended March 31, 2015 was as follows:
A reconciliation of the aggregate statutory income tax rate and the
effective income tax rate as a percentage of income before income
taxes for the year ended March 31, 2014 is not shown due to the fact
that the rate difference was not greater than five hundredths of the
aggregate statutory income tax rate.
2015
Statutory income tax rate 35.5%
Nondeductible expenses 0.9
Valuation allowance (15.6)
Effects of change in tax rates 0.6
Tax rate difference from a parent company (3.7)
Undistributed earnings of consolidated overseas subsidiaries 2.7
Consolidated overseas subsidiaries’ source of dividends 1.4
Other, net 0.9
Effective income tax rate 22.7%
(Additional information)
On March 31, 2015, amendments to the Japanese tax regulations
were enacted into law. Based on the amendments, the statutory
income tax rates utilized for the measurement of deferred tax assets
and liabilities expected to be settled or realized from April 1, 2015 to
March 31, 2016 and on or after April 1, 2016 are changed from 35.5%
for the fiscal year ended March 31, 2015 to 33.0% and 32.2%, respec-
tively, as of March 31, 2015.
Due to these changes in statutory income tax rates, net deferred tax
assets (after deducting the deferred tax liabilities) and net deferred tax
liabilities (after deducting the deferred tax assets) decreased by ¥191
million ($1,592 thousand) and ¥645 million ($5,375 thousand), respec-
tively, and deferred income taxes and valuation difference on available-
for-sale securities increased by ¥98 million ($817 thousand) and ¥552
million ($4,600 thousand), respectively, compared with the amounts
that would have been reported without the changes.
Note 4: Short-Term and Long-Term Debt
Short-term debt generally consists of short-term notes from banks. The average interest rate on these borrowings at March 31, 2014 was 5.60%.
There was no short-term debt as of March 31, 2015.
Long-term debt as of March 31, 2015 and 2014 consisted of the following:
Millions of yen
Thousands of U.S. dollars
2015 2014 2015
0.70% to 1.69% loans from Japanese banks, due in installments through 2019
Secured ¥ — ¥ — $ —
Unsecured 17,153 4,429 142,942
1.58% loans from a governmental institution, due in installments through 2018
Secured — — —
Unsecured 2,400 3,472 20,000
1.32% to 1.59% loans from an insurance company, due in installments through 2021
Secured — — —
Unsecured 3,193 2,696 26,608
2.00% unsecured notes, due June 7, 2016 8,600 8,600 71,667
1.34% unsecured notes, due September 26, 2016 5,000 5,000 41,667
1.06% unsecured notes, due September 26, 2014 — 14,000 —
Total 36,346 38,197 302,884
Current portion of long-term debt shown in current liabilities (3,680) (16,254) (30,667)
Long-term debt, less current portion ¥32,666 ¥21,943 $272,217
As is customary in Japan, substantially all of the bank borrowings are
subject to general agreements with each bank which provide,among
other things, that additional security and guarantees for present and
future indebtedness will be given upon request by the bank and that
any collateral so furnished will be applicable to all indebtedness to
that bank. In addition, the agreements provide that the bank has the
right to offset cash deposited against any long-term or short-term
debt that becomes due and, in case of default and certain other
specified events, against all other debts payable to the bank. To
date, the Company has not received any such requests from its banks.
The Company has contracts for commitment lines by which banks
are bound to extend loans up to a prearranged amount upon request.
As of March 31, 2015, the total financing available under these
contracts amounted to ¥30,000 million ($250,000 thousand), and no
amount of these commitment lines had been used.
The aggregate annual maturities of long-term debt are as follows:
Years ended March 31
Millions of yenThousands of U.S. dollars
2017 ¥17,279 $143,991
2018 3,680 30,667
2019 5,280 44,000
2020 6,104 50,867
2021 and thereafter 323 2,692
Total ¥32,666 $272,217
Financial Section
Under Japanese laws and regulations, the entire amount paid for
new shares is required to be designated as capital stock. However, a
company may, by a resolution of the Board of Directors, designate
an amount not exceeding one half of the price of the new shares as
additional paid-in capital, which is included in capital surplus.
Under the Japanese Corporate Law (the “Law”), in cases in which
a dividend distribution of surplus is made, the smaller of an amount
equal to 10% of the dividend or the excess, if any, of 25% of capital
stock over the total of additional paid-in capital and legal earnings
reserve must be set aside as additional paid-in capital or legal earn-
ings reserve. Legal earnings reserve is included in retained earnings
in the accompanying consolidated balance sheets.
Additional paid-in capital and legal earnings reserve may not be
distributed as dividends. Under the Law, all additional paid-in capital
and all legal earnings reserve may be transferred to other capital
surplus and retained earnings, respectively, and are potentially avail-
able for dividends. Both of these appropriations generally require
a resolution of the shareholders’ meeting.
The maximum amount that the Company can distribute as divi-
dends is calculated based on the nonconsolidated financial state-
ments of the Company in accordance with Japanese laws and
regulations.
Net income per share is based on the weighted average number
of shares of capital stock outstanding. Diluted net income per share
is computed using the weighted average number of shares after
assuming conversion of all dilutive convertible notes and the exercise
of all outstanding stock acquisition rights.
Diluted net income per share of capital stock for the fiscal year ended
March 31, 2015 is not shown because there was no dilutive stock.
At the annual shareholders’ meeting held on June 25, 2015, the
shareholders approved cash dividends of ¥7.00 ($0.06) per share,
totaling ¥1,661 million ($13,842 thousand). The application had not
been accrued in the consolidated financial statements as of
March 31, 2015. Such appropriations are recognized in the period
in which they are approved by the shareholders.
Note 5: Net Assets and Per Share Data

60 61
1. General information about reportable segments
(1) Calculation method for reportable segments
The SCREEN Group’s reportable segments are the business units for
which the Company is able to obtain respective financial information
separately in order for the Board of Directors to conduct periodic
investigations to determine distribution of management resources
and evaluate their business results.
Effective October 1, 2014, the Company has changed to a holding
company structure. The internal companies categorized as product
or service segments underwent a company split and became Group
subsidiaries. These subsidiaries inherit the internal companies’ func-
tions, including planning and execution of overall business plans in
their specific areas of operation.
Consequently, the SCREEN Group has created three business
segments for reporting: the Semiconductor Solutions (SE) segment,
the Graphic and Precision Solutions (GP) segment and the Finetech
Solutions (FT) segment, categorized by products based on the
above subsidiaries.
(2) Products and services of reportable segments
The SE segment develops and manufactures semiconductor produc-
tion equipment and conducts sales and maintenance services. In the
GP segment, graphic arts equipment and PCB related equipment
are developed, manufactured, sold and maintained. The FT segment
develops, manufactures, and markets FPD production equipment
and others, and it also conducts maintenance services.
2. Basis of measurement about reportable segment income
(loss), segment assets and other material items
The accounting methods applied to reported business segments are
identical with those stated in Note 1, “Summary of Significant
Accounting and Reporting Policies.” Income for each reportable
segment reflects operating income. Intersegment revenues and
transfers reflect market prices.
(Changes in basis of measurement about segment income (loss))
Corporate expenses had been allocated to each reportable
segment. From the first quarter under review, in line with a change to
a holding company structure, the allocation method was changed
and the estimated amounts of expenses were allocated to each
reportable segment.
As a result of this change, segment income for the year ended
March 31, 2015 decreased by ¥286 million ($2,383 thousand) in the
SE segment, ¥133 million ($1,108 thousand) in the GP segment and
¥70 million ($583 thousand) in the FT segment, respectively,
compared with amounts that would have been recorded using the
previously applied method.
(Changes in the segment names)
On October 1, 2014, the Company transitioned to a holding
company structure. In line with this change, the reportable segments
have been renamed, as shown below.
Semiconductor Equipment (SE) R Semiconductor Solutions (SE)
Media and Precision Technology (MP) R Graphic and Precision
Solutions (GP)
FPD Equipment (FE) R Finetech Solutions (FT)
The reporting order of the segments has also been changed.
In addition, segment information for the year ended March 31, 2014
has been described using the new segment names and the report-
ing order of the segments has also been changed.
Note 7: Segment Information
1. Finance leases
A. Information relating to finance leases for which the ownership
of the leased assets is considered to be transferred to the
lessee as of and for the years ended March 31, 2015 and 2014
was as follows:
(As lessee)
1) Description of leased assets
1. Tangible fixed assets: Mainly the production facilities in the
Semiconductor Solutions business ( “Machinery, equipment
and other”)
2. Intangible fixed assets: Software
2) Depreciation method for leased assets
As described in Note 1, “Summary of Significant Accounting and
Reporting Policies, (f) Depreciation”
B. Information relating to finance leases, excluding those leases
for which the ownership of the leased assets is considered to
be transferred to the lessee, as of and for the years ended
March 31, 2015 and 2014 was as follows:
(As lessee)
1) Description of leased assets
1. Tangible fixed assets: Mainly the production facilities and the
R&D facilities in the Semiconductor Solutions business
(“Buildings and structures”and “Machinery, equipment
and other”)
2. Intangible fixed assets: Software
2) Depreciation method for leased assets
As described in Note 1, “Summary of Significant Accounting and
Reporting Policies, (f) Depreciation”
2. Operating leases
(As lessee)
Future minimum lease payments as lessee:
Millions of yen
Thousands of U.S. dollars
2015 2014 2015
Due within one year ¥304 ¥404 $2,533
Due after one year 576 581 4,800
Total ¥880 ¥985 $7,333
Note 6: Leases
Financial Section
3. Information about reportable segment income (loss), segment assets and other material items
Millions of yen
Reportable segmentAs of and for the year ended March 31, 2015 SE GP FT Others Adjustments Consolidated
Sales Sales to outside customers ¥157,478 ¥55,677 ¥23,721 ¥ 770 ¥ — ¥237,646 Intersegment sales and transfers 1 30 53 9,612 (9,696) — Total ¥157,479 ¥55,707 ¥23,774 ¥10,382 ¥ (9,696) ¥237,646 Segment income (loss) ¥ 15,738 ¥ 2,840 ¥ 339 ¥ (805) ¥ (944) ¥ 17,168 Segment assets ¥114,733 ¥53,289 ¥20,624 ¥ 4,979 ¥55,892 ¥249,517 Other Depreciation and amortization 2,620 625 59 119 1,457 4,880 Capital expenditures 4,221 866 172 139 1,261 6,659
Millions of yen
Reportable segmentAs of and for the year ended March 31, 2014 SE GP FT Others Adjustments Consolidated
Sales Sales to outside customers ¥163,132 ¥52,156 ¥19,850 ¥ 808 ¥ — ¥235,946 Intersegment sales and transfers — — — 7,625 (7,625) — Total ¥163,132 ¥52,156 ¥19,850 ¥8,433 ¥ (7,625) ¥235,946 Segment income (loss) ¥ 8,760 ¥ 2,768 ¥ (422) ¥ (652) ¥ (1,551) ¥ 8,903 Segment assets ¥119,015 ¥48,963 ¥13,664 ¥3,566 ¥47,168 ¥232,376 Other Depreciation and amortization 2,542 485 80 110 884 4,101 Capital expenditures 2,224 868 86 206 1,190 4,574
Thousands of U.S. dollars
Reportable segment
As of and for the year ended March 31, 2015 SE GP FT Others Adjustments Consolidated
Sales Sales to outside customers $1,312,317 $463,975 $197,675 $ 6,416 $ — $1,980,383 Intersegment sales and transfers 8 250 442 80,100 (80,800) — Total $1,312,325 $464,225 $198,117 $86,516 $ (80,800) $1,980,383 Segment income (loss) $ 131,150 $ 23,667 $ 2,825 $ (6,708) $ (7,867) $ 143,067 Segment assets $ 956,108 $444,075 $171,867 $41,491 $465,767 $2,079,308 Other Depreciation and amortization 21,833 5,208 492 992 12,142 40,667 Capital expenditures 35,175 7,217 1,433 1,159 10,508 55,492
Notes: 1. The “Other” category incorporates operations not included in reportable segments, including software development, planning and production of printed matter, logistics operations and other businesses.
2. Segment operating income (loss) adjustments of ¥(944) million ($(7,867) thousand) for the year ended March 31, 2015 are the corporate profit (loss) not attributable to each reportable segment. Corporate profit (loss) consists mainly of general and administrative expenses not attributable to segments.
Segment operating income (loss) adjustments of ¥(1,551) million for the year ended March 31, 2014 are the corporate expenses not attributable to each reportable segment. Corporate expenses consist mainly of general and administrative expenses not attributable to segments.
Segment assets adjustments of ¥55,892 million ($465,767 thousand) for the year ended March 31, 2015 are the corporate assets not apportioned to each reportable segment. Corporate assets consist mainly of assets not usually attributed to segments.
Segment asset adjustments of ¥47,168 million for the year ended March 31, 2014 are the corporate assets not apportioned to each reportable segment. Corporate assets consist mainly of administrative assets of the parent company not usually attributed to segments.
3. Segment income is adjusted with operating income (loss) under consolidated statements of operations.
<Related Information>
1. Information about geographic areas
(1) Net Sales
Millions of yen
Thousands of U.S. dollars
Years ended March 31, 2015 2014 2015
Japan ¥ 53,483 (22.5%) ¥ 53,300 (22.6%) $ 445,692 Taiwan 45,448 (19.1%) 69,676 (29.5%) 378,733 South Korea 11,309 (4.8%) 17,581 (7.5%) 94,242 China 29,010 (12.2%) 15,441 (6.5%) 241,750 United States 52,291 (22.0%) 46,701 (19.8%) 435,758 Europe 36,829 (15.5%) 21,914 (9.3%) 306,908 Others 9,276 (3.9%) 11,333 (4.8%) 77,300 Total ¥237,646 (100.0%) ¥235,946 (100.0%) $1,980,383
Notes: 1 Net sales are categorized by country or geographic area based on the location of the customer. 2 The numbers shown in parentheses are component ratios.

62 63
(2) Property, plant and equipment
Information about property, plant and equipment by geographic area is omitted because the amount of fixed assets held in Japan exceeds 90%
of the amount of property, plant and equipment on the consolidated balance sheet.
2. Information about major customers
Year ended March 31, 2015
Millions of yenThousands of U.S. dollars
Net sales
Taiwan Semiconductor Manufacturing Co., Ltd. (related segment: SE) ¥30,218 $251,817
Year ended March 31, 2014
Millions of yen
Net sales
Taiwan Semiconductor Manufacturing Co., Ltd. (related segment: SE) ¥60,466
Note 8: Contingent Liabilities
As of March 31, 2015 and 2014, the Company and its consolidated subsidiaries were contingently liable for the following:
Millions of yen
Thousands of U.S. dollars
2015 2014 2015
As guarantors of
Customers’ lease payments ¥ 1 ¥ 7 $ 8
Employees’ housing loans 94 122 783
Trade notes receivable endorsed 50 46 417
Liquidation of receivables with recourse 81 — 675
Total ¥226 ¥175 $1,883
Note 9: Financial Instruments
1. Qualitative information on financial instruments
A. Qualitative information on financial instruments
The SCREEN Group procures funds necessary to conduct business by means such as loans from financial institutions and the issuance of
bonds, in accordance with annual funding plans. Investments of capital are limited to instruments that satisfy safety and liquidity requirements.
Derivative transactions are used only to hedge financial risk such as the risk of fluctuations in exchange rates and interest rates. Speculative
transactions are not undertaken.
B. Details of financial instruments used, risks and processes for risk management
Financial instruments Risks Processes for risk management
Trade notes and accounts receivable Credit risk of clients The amounts outstanding are managed for each client and by due date. Also, the financial condition of the clients is monitored.
Accounts receivable denominated in foreign currency
Risk of fluctuation in foreign currency exchange rates
The risk is hedged by using forward foreign exchange contracts on certain portions of the receivables.
Investments in securities Risk of fluctuation in market prices The fair values of the instruments and financial conditions of issuers are regularly monitored.
Trade notes and accounts payable, loans, bonds and lease obligations
Liquidity risk Funding plans are prepared and renewed, and a certain level of liquidity on hand is maintained.
Portion of loans Risk of fluctuation in interest rates The risk is hedged by using interest rate swaps.
The derivative transactions which the Company uses are forward foreign exchange contracts and interest rate swap contracts and are only used
for the purpose of mitigating risks of fluctuation in foreign currency exchange rates and interest rates. For information about hedging instruments,
hedged items, hedging policies, evaluation of hedge effectiveness and management of derivative transactions, see Note 1, “Summary of
Significant Accounting and Reporting Policies (t) Derivatives and hedge accounting.” The Company believes that its credit risk is insignificant as
the counterparties to its derivative transactions are limited to creditable financial institutions.
C. Supplemental information on fair values
The contract amounts of the derivative transactions described in Note 10, “Derivative Transactions,” do not reflect the market risks of the deriva-
tive transactions themselves.
Financial Section
2. Fair values of financial instruments
As of March 31, 2015 and 2014, the book value and fair value of financial instruments and the differences between these figures are set forth in
the table below. The table does not include financial instruments whose fair values were not readily determinable. (See Note 2, “Consolidated
Statements of Cash Flows.”)
Millions of yen Thousands of U.S. dollars
2015 2014 2015Years ended March 31, Book value Fair value Difference Book value Fair value Difference Book value Fair value Difference
(1) Cash, cash equivalents and time deposits ¥ 25,641 ¥ 25,641 ¥ — ¥ 34,214 ¥ 34,214 ¥ — $213,675 $213,675 $ —
(2) Trade notes and accounts receivable 55,054 55,054 45,257 45,256 458,783 458,783
Allowance for doubtful receivables (*1) (795) (795) (860) (860) (6,625) (6,625)
54,259 54,259 (0) 44,397 44,396 (1) 452,158 452,158 (0)
(3) Investments in securities
Available-for-sale securities 35,521 35,521 — 27,936 27,936 — 296,008 296,008 —
Total assets ¥115,421 ¥115,421 ¥ (0) ¥106,547 ¥106,546 ¥ (1) $961,841 $961,841 $ (0)
(1) Notes and accounts payable—trade ¥ 62,382 ¥ 62,382 ¥ — ¥ 68,705 ¥ 68,705 ¥ — $519,850 $519,850 $ —
(2) Short-term debt — — — 104 104 — — — —
(3) Long-term debt 36,346 36,553 207 38,197 38,166 (31) 302,884 304,609 1,725
(4) Lease obligations 3,331 5,356 2,025 3,074 5,290 2,216 27,758 44,633 16,875
Total liabilities ¥102,059 ¥104,291 ¥2,232 ¥110,080 ¥112,265 ¥2,185 $850,492 $869,092 $18,600
Derivative transactions (*2)
(1) Without application of hedge accounting ¥ (13) ¥ (13) ¥ — ¥ (45) ¥ (45) ¥ — $ (108) $ (108) $ —
(2) With application of hedge accounting — — — (14) (14) — — — —
Total derivative transactions ¥ (13) ¥ (13) ¥ — ¥ (59) ¥ (59) ¥ — $ (108) $ (108) $ —
(*1) Allowance for doubtful receivables recorded for trade notes and accounts receivable is subtracted.(*2) Net assets and liabilities incurred by derivative transactions are shown in net figures, and items whose total amounts are liabilities are indicated in parentheses.Notes: 1. Method of estimating fair values of financial instruments and items regarding investment in securities, and derivative transactions Assets (1) Cash, cash equivalents and time deposits As these assets are settled on a short-term basis, their fair values are approximately equal to their book values. For this reason, their fair values are reported based on their appli-
cable book values. (2) Trade notes and accounts receivable The fair values of these assets are based on the current value classified by length of time until settlement and discounted with consideration for the length of time until settlement
and credit risk. (3) Investments in securities The fair values of securities are based on market prices on the stock exchange. For information about securities classified by purpose, see Note 11, “Securities.” Liabilities (1) Notes and accounts payable -trade and (2) Short-term debt As these liabilities are settled on a short-term basis, their fair values are approximately equal to their book values. For this reason, their fair values are reported based on their appli-
cable book values. (3) Long-term debt The fair values of bonds are based on the “Reference Statistical Prices [Yields] for OTC Bond Transactions” released by Japan Securities Dealers Association. The fair values of
other long-term debt are based on the current value, which is the principal discounted with consideration for the length of time until repayment and credit risk. (4) Lease obligations The fair values of lease obligations are based on the current value, which is the principal discounted with consideration for the length of the remaining period of lease obligation
and credit risk. Derivative transactions See Note 10, “Derivative Transactions.”
2. The book value of financial instruments whose fair values were deemed to be exceedingly difficult to estimate as of March 31, 2015 and 2014 was as follows:
Millions of yen Thousands of U.S. dollars
2015 2014 2015Category Book value Book value Book value
Non-listed equity securities ¥864 ¥684 $7,200
The amount in the above table includes investments in unconsolidated subsidiaries and affiliated companies of ¥39 million ($325 thousand). These items do not have market prices and are deemed to require excessive cost to estimate the future cash flows. Therefore, they are not included in (3) “Investments in securities” as it is deemed to be exceedingly difficult to estimate the fair values.
3. Expected redemption amounts of receivables and securities with maturities after the consolidated financial statement date
Millions of yen Thousands of U.S. dollars
2015 2014 2015
Due within one year
Due between one year
and five years
Due between five years
and ten years
Due after ten years
Due within one year
Due between one year
and five years
Due between five years
and ten years
Due after ten years
Due within one year
Due between one year
and five years
Due between five years
and ten years
Due after ten years
Cash, cash equivalents and time deposits ¥25,617 ¥ — ¥— ¥— ¥34,188 ¥ — ¥— ¥— $213,475 $ — $— $—
Trade notes and accounts receivable 54,862 192 — — 45,012 245 — — 457,183 1,600 — —
Investments in securities— available-for-sale securities with maturities — — — — — — — — — — — —
Total ¥80,479 ¥192 ¥— ¥— ¥79,200 ¥245 ¥— ¥— $670,658 $1,600 $— $—
4. Expected repayment amounts of long-term debt after the consolidated financial statements date See Note 4, “Short-Term and Long-Term Debt.”

64 65
Note 10: Derivative Transactions
Outstanding derivative transactions as of March 31, 2015 and 2014 were as follows:
Millions of yen Thousands of U.S. dollars
2015 2014 2015
Years ended March 31,Contracted
amount
Portion exceeding one year
Fair value
Recognized gain (loss)
Contracted amount
Portion exceeding one year
Fair value
Recognized gain (loss)
Contracted amount
Portion exceeding one year
Fair value
Recognized gain (loss)
Non-exchange traded
forward foreign
exchange contracts
(Sell–U.S. dollars) ¥4,485 ¥— ¥(80) ¥(80) ¥3,394 ¥— ¥(18) ¥(18) $37,375 $— $(666) $(666)
(Sell–Euro) 1,608 — 58 58 1,514 — (27) (27) 13,400 — 483 483
Total ¥6,093 ¥— ¥(22) ¥(22) ¥4,908 ¥— ¥(45) ¥(45) $50,775 $— $(183) $(183)
Notes: 1. Method of estimating fair value The fair values of exchange forward transactions as of March 31, 2015 and 2014 were estimated based on the prices presented by financial institutions. 2. The above table does not list derivative transactions for which hedge accounting has been applied.
Millions of yen Thousands of U.S. dollars
2015 2014 2015
Years ended March 31,Contracted
amount
Portion exceeding one year
Fair value
Recognized gain (loss)
Contracted amount
Portion exceeding one year
Fair value
Recognized gain (loss)
Contracted amount
Portion exceeding one year
Fair value
Recognized gain (loss)
Non-exchange traded
forward foreign
exchange contracts
(Buy–U.S. dollars) ¥1,911 ¥— ¥9 ¥9 ¥— ¥— ¥— ¥— $15,925 $— $75 $75
Total ¥1,911 ¥— ¥9 ¥9 ¥— ¥— ¥— ¥— $15,925 $— $75 $75
Notes: 1. Method of estimating fair value The fair values of exchange forward transactions as of March 31, 2015 and 2014 were estimated based on the prices presented by financial institutions. 2. The above table does not list derivative transactions for which hedge accounting has been applied.
Note 11: Securities
1. The following table summarizes acquisition costs and book values and any differences between these amounts of securities with available fair
values as of March 31, 2015 and 2014:
Available-for-sale securities
Millions of yen Thousands of U.S. dollars
2015 2014 2015Acquisition
cost Book value DifferenceAcquisition
cost Book value Difference Acquisition cost Book value Difference
Securities with book values exceeding acquisition costs:
Equity securities ¥15,704 ¥33,816 ¥18,112 ¥14,848 ¥25,602 ¥10,754 $130,867 $281,800 $150,933
Others — — — — — — — — —
Total ¥15,704 ¥33,816 ¥18,112 ¥14,848 ¥25,602 ¥10,754 $130,867 $281,800 $150,933
Other securities:
Equity securities ¥ 1,833 ¥ 1,705 ¥ (128) ¥ 2,598 ¥ 2,334 ¥ (264) $ 15,275 $ 14,208 $ (1,067)
Others — — — — — — — — —
Total ¥ 1,833 ¥ 1,705 ¥ (128) ¥ 2,598 ¥ 2,334 ¥ (264) $ 15,275 $ 14,208 $ (1,067)
2. Total sales of available-for-sale securities for the year ended March 31, 2015 amounted to ¥105 million ($875 thousand), and the related total gain
amounted to ¥91 million ($758 thousand). Total sales of available-for-sale securities for the year ended March 31, 2014 amounted to ¥35 million,
and the related total gain and loss amounted to ¥12 million and ¥0 million, respectively.
Financial Section
Note 12: Employees’ Severance and Pension Benefits
Breakdown related to retirement benefit plans for the year ended March 31, 2015 and 2014 was as follows:
1. Defined benefit plans
(1) Movements in retirement benefit obligations
Millions of yen
Thousands of U.S. dollars
2015 2014 2015
Balance at beginning of year ¥32,949 ¥33,262 $274,575
Cumulative effects of changes in accounting policies (1,881) — (15,675)
Currently stated balance, at beginning of year 31,068 33,262 258,900
Service cost 1,796 1,559 14,967
Interest cost 369 280 3,075
Actuarial loss (gain) (329) (1,463) (2,742)
Benefits paid (1,231) (947) (10,258)
Other 339 258 2,825
Balance at end of year ¥32,012 ¥32,949 $266,767
(2) Movements in plan assets
Millions of yen
Thousands of U.S. dollars
2015 2014 2015
Balance at beginning of year ¥31,858 ¥27,808 $265,483
Expected return on plan assets 893 774 7,442
Actuarial loss (gain) 1,392 1,104 11,600
Contributions paid by the employer 2,615 2,621 21,792
Benefits paid (1,201) (947) (10,008)
Other 486 498 4,049
Balance at end of year ¥36,043 ¥31,858 $300,358
(3) Reconciliation from retirement benefit obligations and plan assets to liability (asset) for retirement benefits
Millions of yen
Thousands of U.S. dollars
2015 2014 2015
Funded retirement benefit obligations ¥31,993 ¥32,934 $266,608
Plan assets 36,043 31,858 300,358
(4,050) 1,076 (33,750)
Unfunded retirement benefit obligations 18 16 150
Total net liability (asset) for retirement benefits ¥ (4,032) ¥ 1,092 $ (33,600)
Net defined benefit liability 716 1,292 5,967
Net defined benefit asset 4,748 200 39,567
Total net liability (asset) for retirement benefits ¥ (4,032) ¥ 1,092 $ (33,600)
(4) Retirement benefit costs
Millions of yen
Thousands of U.S. dollars
2015 2014 2015
Service cost ¥1,796 ¥1,559 $14,967
Interest cost 369 280 3,075
Expected return on plan assets (893) (774) (7,442)
Net actuarial loss amortization 1,147 1,601 9,558
Total retirement benefit costs ¥2,419 ¥2,666 $20,158

66 67
Note 13: Consolidated Statements of Comprehensive Income
Amounts reclassified as net income (loss) in the current period that were recognized in other comprehensive income in the current or previous
periods and the tax effects for each component of other comprehensive income for the year ended March 31, 2015 and 2014 were as follows:
Millions of yen
Thousands of U.S. dollars
2015 2014 2015
Valuation difference on available-for-sale securities:
Increase (decrease) during the year ¥ 7,585 ¥6,645 $63,208
Reclassification adjustments (91) (12) (758)
Subtotal, before tax 7,494 6,633 62,450
Tax (expense) or benefit (1,996) (2,260) (16,633)
Subtotal, net of tax 5,498 4,373 45,817
Foreign currency translation adjustment:
Increase (decrease) during the year 3,452 4,465 28,766
Remeasurements of defined benefit plans:
Increase (decrease) during the year 1,974 — 16,450
Reclassification adjustments 894 — 7,450
Subtotal, before tax 2,868 — 23,900
Tax (expense) or benefit — — —
Subtotal, net of tax 2,868 — 23,900
Total other comprehensive income ¥11,818 ¥8,838 $98,483
(7) Plan assets
1. Plan assets comprise:
2015 2014
Bonds 50% 44%
Equity securities 28% 32%
Cash and cash equivalents 3% 3%
Life insurance company general accounts 19% 21%
Total 100% 100%
2. Long-term expected rate of return
Current and target asset allocations, historical and expected
returns on various categories of plan assets have been consid-
ered in determining the long-term expected rate of return.
(8) Actuarial assumptions
The principal actuarial assumptions at March 31, 2015 and 2014
were as follows:
2015 2014
Discount rate 0.9%~1.3% 0.9%
Long-term expected rate of return 3.0% 3.0%
The Group does not take into account an expected pay raise rate
in calculating retirement benefit costs.
2. Defined contribution plans
Contributions paid by the Company and its consolidated subsidiaries
to defined contribution plans for the fiscal year ended March 31,
2015 and 2014 amounted to ¥719 million ($5,992 thousand) and
¥613 million, respectively.
Financial Section
(5) Remeasurements of defined benefit plans in other comprehensive income
Millions of yen
Thousands of U.S. dollars
2015 2014 2015
Actuarial gains and losses ¥2,868 ¥— $23,900
Total balance ¥2,868 ¥— $23,900
(6) Remeasurements of defined benefit plans in accumulated comprehensive income
Millions of yen
Thousands of U.S. dollars
2015 2014 2015
Actuarial gains and losses that are yet to be recognized ¥(1,140) ¥(4,008) $(9,500)
Total balance ¥(1,140) ¥(4,008) $(9,500)
Note 14: Business Combinations
Business combinations involving entities or operations of entities under common control
Summary of company split in connection with a change to the holding company structure is as follows:
1. Summary of business combination
(1) Business activities targeted, successor company and date of business combination
Business activities targeted Successor companyDate of business
combination
Semiconductor equipment related business SCREEN Semiconductor Solutions Co., Ltd. October 1, 2014
Measurement system related business SCREEN Semiconductor Solutions Co., Ltd. November 1, 2014
Graphic arts equipment and PCB-related equipment business SCREEN Graphic and Precision Solutions Co., Ltd. November 1, 2014
FPD equipment and other equipment related business SCREEN Finetech Solutions Co., Ltd. November 1, 2014
Manufacturing support and manufacturing contracting operations SCREEN Manufacturing Support Solutions Co., Ltd. November 1, 2014
Shared administration services operations(Operations related to general affairs, accounting, human resources and information systems)
SCREEN Business Support Solutions Co., Ltd. November 1, 2014
(2) Legal form of business combination
The method employed was an absorption-type company split, whereby with the Company as the splitting company and with the five wholly owned
subsidiaries, SCREEN Semiconductor Solutions Co., Ltd., SCREEN Graphic and Precision Solutions Co., Ltd., SCREEN Finetech Solutions Co.,
Ltd., SCREEN Manufacturing Support Solutions Co., Ltd. and SCREEN Business Support Solutions Co., Ltd. as the successor companies.
The Company changed to a holding company structure as of October 1, 2014 and changed its company name from “Dainippon Screen Mfg.
Co., Ltd.” to “SCREEN Holdings Co., Ltd.”
(3) Purpose of business combination
The SCREEN Group initiated “Challenge2016,” a new medium-term three-year management plan, in April 2014. Under this medium-term three-
year management plan, we will endeavor to further promote reform of the earnings structure, shift to a high earnings structure and rapidly
commercialize new business domains. In order to achieve the goal of this “Challenge2016,” we changed to a pure holding company structure so
as to grant clear responsibility and authority to each business and to enable flexible and bold management decisions under the strong control of
the holding company. The Company aims to maximize the corporate value of the SCREEN Group. As a holding company we will do this by
performing such functions as formulating integrated and flexible strategies for the entire group, optimally allocating management resources, and
monitoring the status of business execution at subsidiaries while maintaining and developing the core technologies that are the source of our
corporate group value, as well as by developing a strategic and clear management organization.
2. Summary of accounting method employed
This company split was accounted for as business combinations involving entities or operations of entities under common control in accordance
with the Accounting Standards for Business Combination (ASBJ Statement No. 21, December 26, 2008) and Guidance on Accounting
Standards for Business Combination and Business Divestiture, etc. (ASBJ Guidance No. 10, December 26, 2008).
Note 15: Office Transfer Expenses
Under the office transfer plan, overseas subsidiaries recorded office transfer expenses of ¥364 million ($3,033 thousand) which included impair-
ment loss for assets expected to be unavailable and premium severance pay in other expenses.

68 69
Financial SectionIndependent Auditor’s Report
To the Board of SCREEN Holdings Co., Ltd.:
We have audited the accompanying consolidated financial statements of SCREEN Holdings Co., Ltd. and its consolidated subsidiar-
ies, which comprise the consolidated balance sheet as at March 31, 2015, and the consolidated statement of operations, statement
of comprehensive income, statement of changes in net assets and statement of cash flows for the year then ended, and a summary of
significant accounting policies and other explanatory information.
Management’s Responsibility for the Consolidated Financial Statements
Management is responsible for the preparation and fair presentation of these consolidated financial statements in accordance with
accounting principles generally accepted in Japan, and for such internal control as management determines is necessary to enable
the preparation of consolidated financial statements that are free from material misstatements, whether due to fraud or error.
Auditor’s Responsibility
Our responsibility is to express an opinion on these consolidated financial statements based on our audit. We conducted our audit in
accordance with auditing standards generally accepted in Japan. Those standards require that we comply with ethical requirements
and plan and perform the audit to obtain reasonable assurance about whether the consolidated financial statements are free from
material misstatement.
An audit involves performing procedures to obtain audit evidence about the amounts and disclosures in the consolidated financial
statements. The procedures selected depend on our judgement, including the assessment of the risks of material misstatement of the
consolidated financial statements, whether due to fraud or error. In making those risk assessments, we consider internal control rele-
vant to the entity’s preparation and fair presentation of the consolidated financial statements in order to design audit procedures that
are appropriate in the circumstances, while the objective of the financial statement audit is not for the purpose of expressing an opin-
ion on the effectiveness of the entity’s internal control. An audit also includes evaluating the appropriateness of accounting policies
used and the reasonableness of accounting estimates made by management, as well as evaluating the overall presentation of the
consolidated financial statements.
We believe that the audit evidence we have obtained is sufficient and appropriate to provide a basis for our audit opinion.
Opinion
In our opinion, the consolidated financial statements present fairly, in all material respects, the financial position of SCREEN Holdings
Co., Ltd. and its consolidated subsidiaries as at March 31, 2015, and their financial performance and cash flows for the year then
ended in accordance with accounting principles generally accepted in Japan.
Convenience Translation
The U.S. dollar amounts in the accompanying consolidated financial statements with respect to the year ended March 31, 2015 are
presented solely for convenience. Our audit also included the translation of yen amounts into U.S. dollar amounts and, in our opinion,
such translation has been made on the basis described in Note 1 to the consolidated financial statements.
KPMG AZSA LLC
June 25, 2015
Kyoto, Japan
11/4 12/197 11 53 97 11 13/1 53 97 11 14/1 53 15/1 5397 110
0
100,000
200,000
500
250
750
1,000(¥)
(Thousands of shares)
Company Name: SCREEN Holdings Co., Ltd.Established: October 11, 1943Representative Directors: Akira Ishida, Chairman and CEO Eiji Kakiuchi, President and COOCapital: ¥54 billion
Employees: 5,082 employees (Consolidated)Major Business and Manufacturing Sites: Head Office, Rakusai (WHITE CANVAS
RAKUSAI), Kumiyama, Yasu, Hikone, Taga, Kudan and Monzennakacho (WHITE CANVAS MON-NAKA)
Corporate Data (As of March 31, 2015)
Overseas
North AmericaD.S. North America Holdings, Inc. / DNS Electronics, LLC / Dainippon Screen Graphics (USA), LLC / Silicon Light Machines Corporation
EuropeInca Digital Printers Ltd. / Dainippon Screen (Deutschland) GmbH / Dainippon Screen Unterstuetzungskasse GmbH / Dainippon Screen Ireland Ltd. / Dainippon Screen Electronics France Sarl / Laser Systems & Solutions of Europe SASU / Dainippon Screen Italy S.R.L. / Dainippon Screen Israel Ltd. / Dainippon Screen (Nederland) B.V.
Asia & OceaniaDainippon Screen Electronics (Shanghai) Co., Ltd. / Dainippon Screen (China) Ltd. / Screen Media Technology Ltd. / Dainippon Screen MT (Hangzhou) Co., Ltd. / Dainippon Screen (Korea) Co., Ltd. / Dainippon Screen Electronics (Taiwan) Co., Ltd. / DNS Feats (Taiwan) Co., Ltd. / Dainippon Screen (Taiwan) Co., Ltd. / Dainippon Screen Singapore Pte. Ltd. / Dainippon Screen (Australia) Pty. Ltd.
Domestic
SCREEN Semiconductor Solutions Co., Ltd. / SCREEN Graphic and Precision Solutions Co., Ltd. / SCREEN Finetech Solutions Co., Ltd. / SCREEN Manufacturing Support Solutions Co., Ltd. / SCREEN Business Support Solutions Co., Ltd. / Tech In Tech Co., Ltd. / SEBACS Co., Ltd. / Quartz Lead Co., Ltd. / FASSE Co., Ltd. / Scientific and Semiconductor Manufacturing Equipment Recycling Co., Ltd. / Media Technology Japan Co., Ltd. / MT Service Japan East Co., Ltd. / MT Service Japan West Co., Ltd. / MEBACS Co., Ltd. / FEBACS Co., Ltd. / S. Ten Nines Kyoto Co., Ltd. / Tec Communications Co., Ltd. / DS Finance Co., Ltd. / INITOUT Japan Co., Ltd. / TRANSUP Japan Co., Ltd. / Link Ring Japan Co., Ltd. / GERANT Co., Ltd. / EMD Corporation / SCREEN KUMAMOTO Co., Ltd. / MIXA Co., Ltd.*
* MIXA Co., Ltd. was changed from an affiliated company accounted for by the equity method to an unconsolidated subsidiary accounted for by the equity method during the fiscal year ended March 31, 2015.
Note: Overseas group companies changed their trade names effective from April 1, 2015 in connection with the change to holding company structure. For details, see http://www.screen.co.jp/eng/press/NR150227-2E.html
Consolidated Companies (As of March 31, 2015)
Stock Information
Authorized Number of Shares: 900,000,000Number of Shares Issued: 253,974,333Number of Shareholders: 11,577Number of Shares Held by Non-Japanese Companies and Individuals: 68,741,237 (27.06%)Listings: TokyoCode Number: 7735
Major Shareholders
Major ShareholdersNumber of shares
(thousands)Percentage of total shares issued (%)
The Master Trust Bank of Japan, Ltd. (Trust Account) 23,244 9.15
Japan Trustee Services Bank, Ltd. (Trust Account) 16,286 6.41
Nippon Life Insurance Company 9,153 3.60
The Bank of Kyoto, Ltd. 6,730 2.65
SCREEN’s Business Partners Shareholders’ Association Synchronize 4,647 1.83
Resona Bank, Limited 4,562 1.79
The Shiga Bank, Ltd. 4,241 1.67
STATE STREET BANK AND TRUST COMPANY 505223 4,191 1.65
STATE STREET BANK AND TRUST COMPANY 505001 4,079 1.60
SCREEN’s Employees Shareholders’ Association 3,948 1.55
Note: Figures exclude 16,642,614 (6.55%) shares of treasury stock held by SCREEN Holdings Co., Ltd.
Bank References
The Bank of Tokyo-Mitsubishi UFJ, Ltd. / Resona Bank, Ltd. /The Bank of Kyoto, Ltd. / The Shiga Bank, Ltd. /Development Bank of Japan Inc.
Underwriter
Nomura Securities Co., Ltd.
Sub-Underwriters
Mitsubishi UFJ Morgan Stanley Securities Co., Ltd. Daiwa Securities Co. Ltd.
Breakdown by Type of Shareholder
Stock Information (As of March 31, 2015)
Treasury stock6.55%
Individuals and others15.12%
Financial institutions38.23%
Securities companies2.95%
Non-Japanese companies and individuals27.06%
Other Japanese companies10.06%
Stock Price Range and Turnover