ellen brook catchment - chittering landcare...
TRANSCRIPT

Ellen Brook Catchment Water Quality Monitoring
June – September 2014
Plate 1: Warren Rd (EBICG, 2014).
Prepared by the Ellen Brockman Integrated Catchment Group: March 2015.
This project is co-funded by the Australian and Western Australian Government's investment in Caring for our Country
administered by the Perth Region NRM.
Ellen Brook Catchment Water Quality Monitoring Snapshot June – September 2014
Ellen Brockman Integrated Catchment Group 2
1. Acknowledgements
This report was prepared for the Ellen Brockman Integrated Catchment Group (EBICG) by Natural
Resource Management Officer, Bonny Dunlop-Heague. Water samples were collected with the help
of Megan O’Grady and various work experience students from Murdoch University. Samples were
analysed by the National Measurement Institute (NMI), an accredited laboratory of the National
Association of Testing Authorities (NATA).
For further information contact:
Ellen Brockman Integrated Catchment Group
Chittering Landcare Centre
PO Box 62
Muchea WA 6501
Phone: (08) 9571 0400
Fax: (08) 9571 4350
Email: [email protected]

Ellen Brook Catchment Water Quality Monitoring Snapshot June – September 2014
Ellen Brockman Integrated Catchment Group 3
2. Executive Summary The assessment of water quality within the Ellen Brook catchment was undertaken between June
and September 2014 in compliance with the sampling and analysis plan (Appendix G). The
objective of the 2014 snapshot is to provide baseline information on the water quality within the
Ellen Brook catchment, and to identify high contaminant contributing sub-catchments, emergent
and ongoing trends. Recommendations are then made for areas with nutrient and metal
concentration levels outside the Australian and New Zealand Environment and Conservation
Council water quality guidelines for aquatic ecosystems (2000) to improve or maintain water
quality in the catchment, and mitigate detrimental environmental effects in the Swan–Canning
estuary system. Intensive clearing, grazing and fertiliser use combined with poor sandy soils in the
Ellen Brook catchment has historically contributed a large amount of nutrients entering the Swan-
Canning system. The high nutrient levels contribute to algal blooms in the upper reaches of the
Swan River.
It must be noted that this assessment was based on once-off grab sampling of water quality in June,
July, August and September from 27 selected sites within the Ellen Brook catchment (Figure 2).
Consequently, the results represent the condition of the water in the catchment at the time of
sampling only. Twenty six of the sites were tested for physical parameters (pH, salinity,
temperature and total suspended solids) and nutrients, including total nitrogen (TN), total oxidised
nitrogen (TON), and filterable organic nitrogen (FON), total phosphorous (TP), total filterable
phosphorous and soluble reactive phosphorous (SRP). Total metals and total water hardness were
sampled from seven strategically identified sites.
Comparison to previous nutrient data collected by the Ellen Brockman Integrated Catchment Group
indicates that nutrient concentrations have remained relatively static at most sampling sites since
2005; however they have increased slightly since 1996. Acidity has also remained relatively static
at most of the sampling sites since 2005. However the increase in acidity since 1996 at a number of
sampling sites (identified in Figure 8) is of great concern to the ecological health and function of the
Ellen Brook and agricultural production. If left unmanaged this could become a major issue for
landholders in terms of agricultural production with metal toxicity affecting livestock and soil
condition. Continued monitoring will help identify potential trends and patterns as more data is
collected over a greater period of time. All data is entered into the Department of Water’s Water
Information Network (WIN) database and available to the public.
Ellen Brook Catchment Water Quality Monitoring Snapshot June – September 2014
Ellen Brockman Integrated Catchment Group 4
3. Key Findings
Total Nitrogen and Total Phosphorous were found in relatively high concentrations, above
the guideline trigger values, across the catchment.
The sub-catchments to the west of the Ellen Brook were the primary sources of total
nitrogen in the catchment. Nitrogen was mostly in soluble form at sites with high TN
concentrations.
The sub-catchments to the west of the Ellen Brook were the primary sources of
phosphorous. The phosphorous was mostly in soluble form at sites with high TP
concentrations when compared to the ANZECC Guidelines.
All western sub-catchment sampling sites had high total nitrogen, total phosphorous and
filterable reactive phosphorous concentrations which were above the ANZECC trigger
values. Muchea North (EBN11) was identified as the highest contributor of these nutrients
to the Ellen Brook.
All western sub-catchment sampling sites had total oxidised nitrogen(TON) concentrations
above the trigger value.
Lennard Brook (EBN1), Yal Yal Brook (EBN5) – sub catchments to the east of the Ellen
Brook, and Egerton (EBN26), Roxburgh Ave (EBN29) and Sawpit Gully (EBN25) – sub
catchments to the west of Ellen Brook were identified as the greatest contributors of TON to
the Ellen Brook.
Wandena North (EBN7) and Muchea East (EBN10) had low pH levels, which were outside
the guidelines, and were identified as contributors of metals to the Ellen Brook.
Results from Table 1 show that the majority of sites exceeded the lowland trigger value for
conductivity on most sampling occasions. This is more evidence to show that salinisation of
waterways is an issue in the Ellen Brook catchment. Marginal to brackish conductivity
levels were recorded predominantly in the main channel of the Ellen Brook and the
subcatchments to the east of Ellen Brook including Wandena North (EBN7) and Muchea
East (EBN10), (Table 7).
Acidity of surface water, potentially due to the effects of exposure of soils containing iron
sulphide and acid groundwater seepage, in the Ellen Brook catchment is becoming an issue.
These identified sites should continue to be investigated and include Wandena North
(EBN7), Muchea East (EBN10) and Upper Yal Yal (EBN28).

Ellen Brook Catchment Water Quality Monitoring Snapshot June – September 2014
Ellen Brockman Integrated Catchment Group 5
Aluminium and Iron concentrations were above the ANZECC guidelines at all metal
sampling sites, on every sampling occasion.
Ellen Brook Catchment Water Quality Monitoring Snapshot June – September 2014
Ellen Brockman Integrated Catchment Group 6
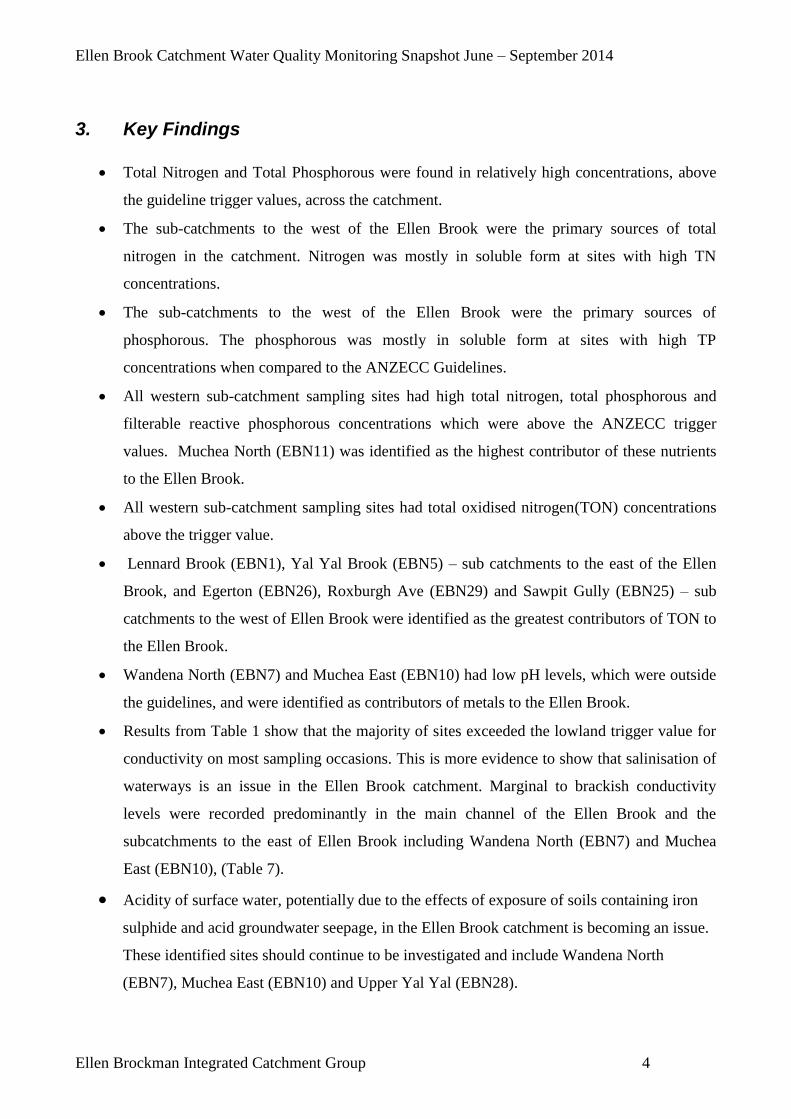
Table 1: Number of sites (out of a total of 27) equal to or exceeding the ANZECC Water Quality Guidelines and trigger values.
*Note, metals out of a total of seven sampling sites. Cadmium, Chromium, Copper, Lead, Nickel and Zinc ANZECC water quality trigger values have been modified
according to Water Hardness (Appendix) and must be equal to or exceed the Hardness-modified Trigger Value to be over the guideline.
Parameter Number of
Sampling
Sites
D.O.W
Interim
Guideline
ANZECC
Trigger
Value
Water Quality Trigger Value-
lowland rivers
25th
June
30th
Jul
20th
Aug
22nd
Sep
25th
June
30th
Jul
20th
Aug
22nd
Sep
Physical
pH 27 6.5-8 4 4 4 3
Conductivity 27 0.12-0.3
mg/L
26 26 26 26
Total Nitrogen 27 1.2 mg/L 20 22 22 22
Total Oxidised
Nitrogen
27 0.15 mg/L 12 8 5 6
Nitrogen as
Ammonia
27 0.08mg/L 10 9 3 5
Total Phosphorous 27 0.065
mg/L
17 19 19 19
Soluable Reactive
Phosphorous
27
0.04 mg/L
17 18 19 19
Total Suspended
Solids
27 6mg/L 7 7 13 10
Metal Number of
Sampling
Sites
Hardness
Modified
Trigger
Value (400)
ANZECC
Trigger
Value
(mg/L)
25th
June
30th
Jul
20th
Aug
22nd
Sep
Aluminium 7 0.055 4 4 4 3
Arsenic 7 0.024 0 0 0 0
Cadmium 7 0.002mg/L 0.0002 0 0 0 0
Chromium 7 0.0049/0.008
4mg/L
0.001 0 0 0 0
Copper 7 0.00728/
0.0126mg/L
0.0014 0 0 0 1
Iron 7 0.3 7 8 8 8
Lead 7 0.04/0.09mg/
L
0.0034 0 0 0 0
Mercury 7 0.0006 0 0 0 0
Nickel 7 0.099/0.057m
g/L
0.011 0 0 0 0
Zinc 7 0.072mg/L 0.008 0 0 0 0
Total Suspended Solids-
DOE Interim Guideline

Ellen Brook Catchment Water Quality Monitoring Snapshot June – September 2014
Ellen Brockman Integrated Catchment Group 7
4. Table of Contents
1. ACKNOWLEDGEMENTS ............................................................................................................................................. 2
2. EXECUTIVE SUMMARY .............................................................................................................................................. 3
3. KEY FINDINGS .............................................................................................................................................................. 4 Table 1: Number of sites (out of a total of 27) equal to or exceeding the ANZECC Water Quality Guidelines and
trigger values. .................................................................................................................................................................. 6
4. TABLE OF CONTENTS ................................................................................................................................................. 7
4.1 LIST OF FIGURES ............................................................................................................................................................. 9
5. BACKGROUND............................................................................................................................................................ 11
5.1 ELLEN BROOK CATCHMENT ...................................................................................................................................... 13
5.1.1 CLIMATE ..................................................................................................................................................................... 16 5.1.2 GEOLOGY AND GEOMORPHOLOGY .............................................................................................................................. 16 5.1.3 SOIL TYPES .................................................................................................................................................................. 17 5.1.4 VEGETATION ............................................................................................................................................................... 18 5.1.5 LAND USE ................................................................................................................................................................... 19
Table 2: Land Use and Management Issues: Factors affecting Conservation or Protection of Natural Resources
(Land Assessment Pty Ltd, 1999). .................................................................................................................................. 22
6. METHODOLOGY ......................................................................................................................................................... 23
Table 3: Site information including site number, site name, waterway section/component, location, northings and
eastings........................................................................................................................................................................... 23 6.1 WATER SAMPLING ......................................................................................................................................................... 25 6.2 WATER ANALYSIS ......................................................................................................................................................... 25
Table 4: Summary of chemical analysis techniques. ...................................................................................................... 26
7. RESULTS AND DISCUSSION .................................................................................................................................... 27
7.1 WATER QUALITY ........................................................................................................................................................... 28 7.1.1 Flow and Rainfall .................................................................................................................................................. 28 7.2 Physical Properties .................................................................................................................................................. 32 7.2.1 pH .......................................................................................................................................................................... 32 Table 5: pH levels of Wandena North (EBN7), Wandena South (EBN8), Muchea East (EBN10) between July and
October 2012. ................................................................................................................................................................. 34 7.2.2 Electrical Conductivity .......................................................................................................................................... 35 7.2.3 Total Suspended Solids .......................................................................................................................................... 38
7.3 NUTRIENT CONCENTRATIONS IN WATER ........................................................................................................................ 40 7.3.1 Total Nitrogen ....................................................................................................................................................... 40 7.3.2 Total Oxidised Nitrogen ........................................................................................................................................ 43 7.3.3. Ammonia as NH3N ............................................................................................................................................... 46 7.3.4. Dissolved Organic Nitrogen ................................................................................................................................. 48 7.3.3 Total Phosphorous ................................................................................................................................................ 50 7.3.4 Soluble Reactive Phosphorous .............................................................................................................................. 53 7.3.5. Total Filterable Phosphorous .............................................................................................................................. 55
7.4 METALS IN SURFACE WATER .................................................................................................................................... 61
7.4.1 Metals at Upper Yal Yal (EBN28) ......................................................................................................................... 63 7.4.2. Surface Water Hardness ....................................................................................................................................... 64 7.4.2 Aluminium ............................................................................................................................................................. 66 7.4.3 Arsenic .................................................................................................................................................................. 68 7.4.4 Cadmium ............................................................................................................................................................... 69 7.4.5 Chromium .............................................................................................................................................................. 70 7.4.6 Copper ................................................................................................................................................................... 71 7.4.7 Iron ........................................................................................................................................................................ 72

Ellen Brook Catchment Water Quality Monitoring Snapshot June – September 2014
Ellen Brockman Integrated Catchment Group 8
7.4.8 Lead ....................................................................................................................................................................... 73 7.4.9 Nickel .................................................................................................................................................................... 74 7.4.10 Zinc ...................................................................................................................................................................... 75
8. COMPARISON WITH PREVIOUS RESULTS............................................................................................................ 76
8.1 pH ............................................................................................................................................................................. 77 8.2 Conductivity ............................................................................................................................................................. 79 8.3 Total Nitrogen .......................................................................................................................................................... 81 8.4 Total Phosphorous ................................................................................................................................................... 82
9. RECOMMENDATIONS ............................................................................................................................................... 83
10. REFERENCES ............................................................................................................................................................... 84
APPENDIX A – WATER QUALITY RESULTS (RAW) ...................................................................................................... 87
PHYSICAL PARAMETERS ...................................................................................................................................................... 87 NUTRIENTS .......................................................................................................................................................................... 91 TOTAL METAL CONCENTRATIONS IN SURFACE WATER WITHIN THE ELLEN BROOK CATCHMENT 2014. ............................... 96
APPENDIX B – FRESHWATER TRIGGER VALUES AND GUIDELINES ...................................................................... 98
TRIGGER VALUES AND GUIDELINES FOR NUTRIENT CONCENTRATIONS AND PHYSICAL PROPERTIES IN LOWLAND RIVERS AND
FRESHWATER ....................................................................................................................................................................... 98 TRIGGER VALUES AND GUIDELINES FOR TOXICANTS (METALS) IN FRESHWATER ................................................................. 99 TRIGGER VALUES AND GUIDELINES FOR TOXICANTS (METALS) IN FRESHWATER ............................................................... 100
APPENDIX C – PHOTOGRAPHS OF SAMPLE SITES ..................................................................................................... 101
APPENDIX D – SALINITY MEASUREMENTS & TOLERANCE LIMITS ..................................................................... 106
APPENDIX E – HARDNESS-MODIFIED TRIGGER VALUE CALCULATIONS BASED ON VARYING WATER
HARDNESS (TABLE 3.4.4. ANZECC & ARMCANZ, 2000). ........................................................................................... 107
APPENDIX F – DAILY, MONTHLY AND ANNUAL RAINFALL (MM) RECORDED AT PEARCE RAAF BASE .... 108
APPENDIX G – SAMPLING AND ANALYSIS PLAN ...................................................................................................... 109

Ellen Brook Catchment Water Quality Monitoring Snapshot June – September 2014
Ellen Brockman Integrated Catchment Group 9
4.1 List of Figures
Figure 1: Ellen Brook Catchment Regional Location. ............................................................. 15 Figure 2: Major Landforms of the Ellen Brook Catchment. ..................................................... 17
Figure 3: Major landform and soil-landscape of the Ellen Brook Catchment (LandSmart, 2006) ............................................................................................................................... 18
Figure 4: Ellen Brook catchment Land Use map (SRT, 2009). ............................................... 21 Figure 5: Ellen Brook water quality sampling site locations. ................................................... 24 Figure 6: Total monthly rainfall for 2013, 2012 and 2011 within the Ellen Brook Catchment at
009053 – Pearce RAAF Base. ......................................................................................... 29
Figure 7: Temperature of surface waters sampled between July and October within the Ellen Brook catchment in 2013. ................................................................................................ 31
Figure 8: pH of surface water sampled within the Ellen Brook catchment between July and October 2013. *Note: blanks represent no sample .......................................................... 34
Figure 9: Electrical Conductivity of surface water within the Ellen Brook Catchment between July and October 2013.*Note blanks represent no sample .............................................. 37
Figure 10: Total Suspended Solid concentrations in surface water within the Ellen Brook Catchment between July and October 2013. *Note blanks represent not sampled ......... 39
Figure 11: Total Nitrogen concentration in surface water within the Ellen Brook catchment sampled between July and October 2013. ....................................................................... 42
Figure 12: Total Oxidised Nitrogen (TON) sampled within the Ellen Brook catchment between July and October 2013. *Note blanks represent no sample. ............................................ 45
Figure 13: Ammonia as Nitrogen (NH3N) sampled within the Ellen Brook catchment between July and October 2013. *Note blanks represent no sample ............................................. 47
Figure 14: Dissolved Organic Nitrogen (DON) sampled within the Ellen Brook catchment between July and October 2013. *Note blanks represent no sample .............................. 49
Figure 15: Total Phosphorous concentration sampled within the Ellen Brook catchment between July and October 2013. ..................................................................................... 52
Figure 16: Soluble Reactive Phosphorous concentrations sampled within the Ellen Brook catchment between July and October 2013 ..................................................................... 54
Figure 19: Composition of Total Filterable phosphorous in percentages of Soluble Organic P and SRP in August Sampling run 2013. *note that blanks represent no sample ............. 58
Figure 22: Water hardness of surface water within the Ellen Brook Catchment at sites sampled for metal contamination, between July and October 2013.*Blanks represent no sample ............................................................................................................................. 65
Figure 23: Aluminium concentrations in surface water within the Ellen Brook catchment between July and October 2013. *please note blanks represent no sample ................... 67
Figure 24: Arsenic concentrations in surface water within the Ellen Brook catchment between July and October 2013. *please note blanks represent no sample .................................. 68
Figure 25: Cadmium concentrations in surface water within the Ellen Brook catchment between July and October 2013. *please note that blanks represent no sample ............ 69
Figure 26: Chromium concentrations in surface water within the Ellen Brook catchment between July and October 2013. *Note blanks represent no sample. ............................. 70
Figure 27: Copper concentrations in surface water within the Ellen Brook catchment between July and October 2013.*note that blanks represent no sample. ...................................... 71

Ellen Brook Catchment Water Quality Monitoring Snapshot June – September 2014
Ellen Brockman Integrated Catchment Group 10
Figure 28: Iron concentrations in surface water within the Ellen Brook Catchment between July and October 2013.*please note blanks represent no sample ................................... 72
Figure 29: Lead concentrations in surface water within the Ellen Brook catchment between July and October 2013. *Note blanks represent no sample ............................................. 73
Figure 30: Nickel concentrations in surface water within the Ellen Brook catchment between July and October 2013. *Note blanks represent no sample ............................................. 74
Figure 31: Zinc concentrations in surface water within the Ellen Brook catchment between July and October 2013. *Note that blanks represent no sample ...................................... 75
Figure 32: Average pH levels in surface water within the Ellen Brook catchment between 2005 and 2013. ................................................................................................................ 78

Ellen Brook Catchment Water Quality Monitoring Snapshot June – September 2014
Ellen Brockman Integrated Catchment Group 11
5. Background
The Ellen Brockman Integrated Catchment Group (EBICG) was formed in 1996 as part of the Swan
Avon Regional Initiative. EBICG focuses on coordinating activities, improving communication
between stakeholders, encouraging natural resource management (NRM) in the catchment, which
varies from revegetation to improved agricultural practices and property planning to educate
landholders on how to best manage their land no matter the size(Horwood & Worley, 1996). EBICG
and has developed a catchment management plan for the Ellen Brook catchment and works with the
Shires of Chittering and Gingin, as well as the City of Swan to improve the health of the Ellen Brook
Catchment (SRT, 2009).
With support from Tronox and the Department of Water (DoW), the Ellen Brockman Integrated
Catchment Group commenced an annual sampling program focusing on nutrients, physical parameters
and total suspended solids at 20 sites within the Ellen Brook catchment, in 2005 and 2006. Water
samples collected from seven strategically selected sampling sites in 2005, and six sites in 2006 were
also analysed for heavy metals. In 2007 the number of sampling sites were increased to 27 and
‘Muchea South’ (EBN12) was removed. In 2008 sampling occurred once every three weeks over a
three month period commencing with the first consistent winter flows in July. From 2009 to 2014
sampling occurred monthly over four months. The program was funded through the Ellen Brockman
Integrated Catchment Group.
An assessment of the water quality within the Ellen Brook Catchment was undertaken on four
occasions, between June and September 2014. The objectives of this snapshot are to provide annual
data on the water quality within the catchment, to assess and monitor the outcomes of on ground works
carried out to reduce nutrient transport, to monitor areas of high nutrient transport identified in the
previous year’s sampling, to determine other potential areas of high nutrient transport arising in the
catchment as a result of altered land use, and to build on previous results to determine emerging trends
in the subcatchments of the Ellen Brook catchment.
EBICG has been sampling the physical water quality parameters since 1999 as part of a large range of
activities in monitoring and environmental repair, concentrated on reducing nutrient export from the
region. 2014 water quality has been entered on to the Department of Water’s (DoW) Water Information

Ellen Brook Catchment Water Quality Monitoring Snapshot June – September 2014
Ellen Brockman Integrated Catchment Group 12
Network (WIN) database.

Ellen Brook Catchment Water Quality Monitoring Snapshot June – September 2014
Ellen Brockman Integrated Catchment Group 13
5.1 Ellen Brook Catchment
The Ellen Brook Catchment is located to the north-east of the Perth metropolitan region and has a
gauged area of 71, 500 hectares(Figure 1). The Ellen Brook headwaters start just south of Gingin and
run for approximately 60km south through the townships of Muchea and Bullsbrook to its confluence
with the Swan River near All Saints Church in Henley Brook. The catchment is situated in three local
government authorities, including the Shire of Chittering, Shire of Gingin and the City of Swan(SRT,
2009)
The Ellen Brook and its tributaries (134 subcatchments) form a catchment area shown in Figure 1 as
the western portion of the North-East sub region of the Perth Region NRM. These subcatchments
include: eastwards flowing groundwater fed streams rising from the Gnangara Mound; westward
flowing streams from catchments extending onto the Darling and Dandaragan Plateau; smaller streams
and drains flowing into the Ellen Brook from the east and west, rising in the agricultural land on the
Swan Coastal Plain (Russell, 2001).
The Ellen Brook, which is an ephemeral stream, discharges into the upper Swan River contributing an
average of 8.3% of the total volume each year to this system. The catchment represents the largest
coastal subcatchment of the Swan-Canning estuary system, (SRT, 2009).
Despite this relatively small portion of run-off compared to its geographical size, the Ellen Brook
catchment is the single largest contributor of nutrients entering the Swan River estuary, on the Swan
Coastal Plain (Micenko, 2005). The excessive input of nutrients, predominantly nitrogen and
phosphorous, have been partially responsible for regular and potentially toxic algal blooms in the upper
reaches of the estuary (DEBCMP, 2000). These algal blooms have caused major ecological
disturbances including unsightly scums, foul odours and occasional fish deaths.
According to the Draft Ellen Brook Catchment Management Plan (PPK Environment and
Infrastructure, 2000), landuses such as livestock grazing and clearing of vegetation has caused
significant land degradation, including soil salinity, wind erosion, water erosion, waterlogging and

Ellen Brook Catchment Water Quality Monitoring Snapshot June – September 2014
Ellen Brockman Integrated Catchment Group 14
flooding. These processes lead to phosphorous and nitrogen export. If these processes are left
unmanaged it will continue to compromise the catchment’s economic, environmental and social value.

Ellen Brook Catchment Water Quality Monitoring Snapshot June – September 2014
Ellen Brockman Integrated Catchment Group 15
Figure 1: Ellen Brook Catchment Regional Location.

Ellen Brook Catchment Water Quality Monitoring Snapshot June – September 2014
Ellen Brockman Integrated Catchment Group 16
5.1.1 Climate
The Ellen Brook catchment experiences a Mediterranean climate of distinctly dry (and hot) summers
and cool wet winters. Mean maximum temperatures range from 17.8ºCin winter and 33.5ºC in summer
and mean minimum temperatures range from 8.1ºC in winter to 18ºC in summer. Average Annual
rainfall for Pearce is 684.1mm. The break of season has changed from April or May to June or July,
and 90% of the rainfall occurs between May and October. The growing season lasts several months.
Total pan evaporation is 1934mm/yr, with an average daily evaporation of 10.8mm in January to
1.8mm in June (BOM, 2012).
5.1.2 Geology and Geomorphology
The Ellen Brook catchment can be divided into three major geomorphic regions (Figure 2); the Darling
Plateau to the east; the Dandaragan Plateau which covers the north eastern part of the catchment and
the Swan Coastal Plain which covers the western portion of the catchment (King & Wells, 1990). The
geological setting of the Ellen Brook is strongly linked to nutrient transport, with a noticeable
difference in nutrient levels in the east and west of the catchment.
The Darling Plateau is part of the Yilgarn Block in the eastern section of the catchment. The Yilgarn
Block is an extensive area of Archaean crust typified by old granite rock outcrops with younger
doleritic intrusions. It has been dissected by the Avon River system and includes the following
geomorphic characteristics; lateritic uplands, dissected valleys, spurs and valleys below the scarp
surface, minor valleys and drainage depressions. It is separated from the Dandaragan Plateau by the
Darling Fault (DEBCMP, 2001).
The Dandaragan Plateau, in the north east part of the catchment, is less dissected than the neighbouring
Darling Plateau and is covered by sands and laterite overlaying older sedimentary formations. It
includes a gentle scarp, sandy (lateritic) uplands and relatively shallow incised valleys. The sand plain
features dominate, and the western margin of the Dandaragan Plateau is formed by the Gingin Scarp, a
moderately sloping topographical feature formed by shoreline erosion and rising approximately 90
metres above the Swan Coastal Plain (WRC 2002).

Ellen Brook Catchment Water Quality Monitoring Snapshot June – September 2014
Ellen Brockman Integrated Catchment Group 17
Figure 2: Major Landforms of the Ellen Brook Catchment.
5.1.3 Soil types
Soil types are grouped according to their geomorphic setting. Aeolian deposits on the Swan Coastal
Plain are characterised by the Bassendean dune system (Figure 3). These are well drained porous soils
with very poor phosphorous retention capacity. The alluvial deposits in the centre of the catchment are
part of the Pinjarra Plain landform, and contain soils made up of coalescing alluvial fans with varying
sand and clay content subject to water logging in low-lying areas. Soils of this landform often contain a
duplex of impermeable clay layers overlain by deep sandy soils (Russell, 2001).
The Darling Plateau and Dandaragan landforms contain lateritic uplands characterised by gravely
yellow earths and yellow duplex soils. Minor valleys and drainage depressions often contain soils in
Ellen Brook Catchment Water Quality Monitoring Snapshot June – September 2014
Ellen Brockman Integrated Catchment Group 18
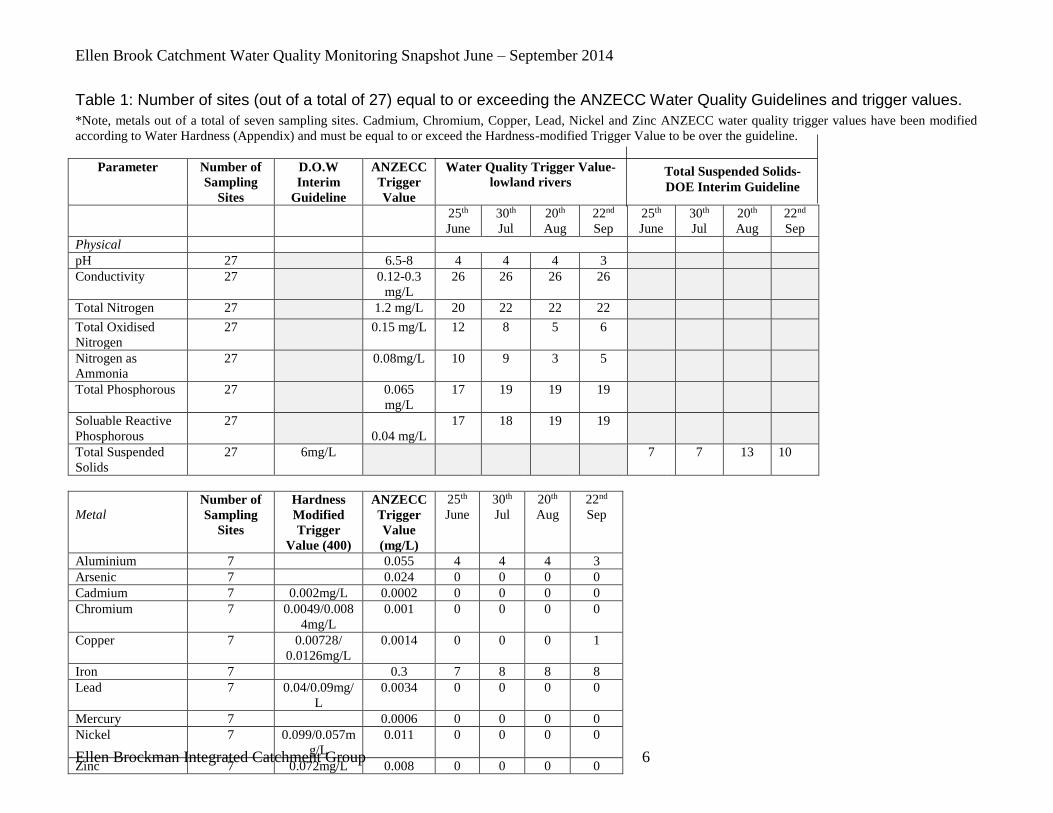
which the surface layer of the soil profile is often separated from lower finer textured materials by a
layer of gravels or stone (Russell, 2001).
Figure 3: Major landform and soil-landscape of the Ellen Brook Catchment (LandSmart, 2006)
5.1.4 Vegetation
Weeds in the Ellen Brook catchment are usually soft leaved, decaying quickly and releasing high levels
of organic nutrients and carbon. Organic matter accumulated in the soil is released following clearing.
Native vegetation contains and releases high levels of tannins and oils into the Ellen Brook catchment
(DEBCMP, 2001).
A significant area of the catchment has been cleared. The majority of clearing has occurred in the
western margin of the Darling Plateau, parts of the Dandaragan Plateau to the north, and much of the
Key to map units
212Bs Bassendean System
213Fo Forrestfield System
213Pj Pinjarra System
213Ya Yanga System
222Cb Coonambidgee System
222Cp Capitella System
222Da Dandaragan System
222Mb Mogumber System
222Re Reagan System
253Bn Bindoon System
253By Boyagin System
253Ga Gabbla System
253Ju Julimar System
253Nn Nooning System
253Ug Udamong System
253Wa Wannamal System
253Wn Wundowie System
253Yh Yarawindah System
255Dp Darling Plateau System

Ellen Brook Catchment Water Quality Monitoring Snapshot June – September 2014
Ellen Brockman Integrated Catchment Group 19
southern section of the Swan Coastal Plain. Remnant vegetation is found in state forests, in the sloping
lands of the western edge of the Darling Scarp, in local streamlines and wetlands and in local areas of
nature reserves and national parks, and in some isolated areas of privately owned land (DEBCMP,
2001).
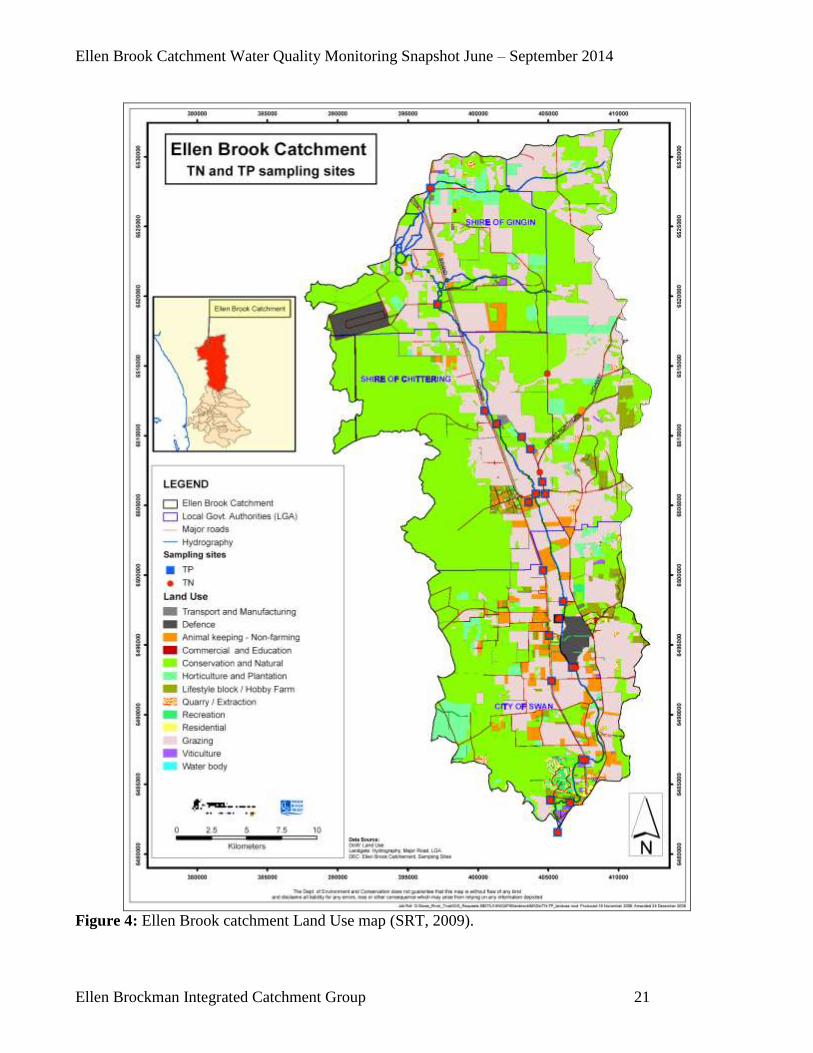
5.1.5 Land Use
The majority of the Ellen Brook Catchment has been cleared for either urban use or agriculture. The
main categories of agriculture are grazing, horticulture and fodder production. Specific land uses
include vineyards and other intensive horticulture, cattle grazing, piggeries, abattoir, chicken farms,
gravel extraction, mining, golf courses and residential developments (SRT, 2009).
Pasture and grazing are the largest land-uses in the region, covering over 31,000ha and representing
over 85% of all recorded land uses (KBR, 2003). Land use generally changes from cattle grazing and
horticulture in the northern parts of the catchment to more urban settlements and small scale light
industry in the southern parts(SRT, 2009)
Cattle grazing contributes large amounts of nutrients to the Ellen Brook as the cattle tend to congregate
in or around unprotected waterways causing soil compaction and erosion, and directly excreting
nutrients into the waterway. The pasture needed to support the cattle is fertilised resulting in an
application of over 20kg/ha/yr of phosphate (DECMP 2001). Although the pasture does fix a small
amount of phosphorous, most of the nutrients associated with this land use are transported through the
soil and into the waterways. The soil has a very poor ability to retain nutrients, which is exacerbated by
over stocking and erosion. In comparison, although on a smaller scale with regards to area, horticulture
has an even higher concentrated nutrient run off potential. For example, orchards in the north of the
catchment are supplied with 65kg/ha/yr of phosphorus, although more established vineyards over ten
years old were supplied with half of this amount (Gerritse 1996).
Urban expansion is an issue in the catchment, particularly in the southern part of the region where
many large farms have been subdivided into small “lifestyle” sized blocks. It is difficult to predict
whether this change in land use will be beneficial or detrimental to water quality in the Ellen Brook
(Table 2). If managed appropriately during the planning phase, it may allow for conditions to be in

Ellen Brook Catchment Water Quality Monitoring Snapshot June – September 2014
Ellen Brockman Integrated Catchment Group 20
place that will improve or at least maintain water quality. If not managed correctly, issues such as over
stocking, increased fertiliser application and herbicide use, increased water use, erosion and more
weeds would certainly be detrimental to the water quality in the catchment (CSIRO 1994).
The excessive nutrient load in the Ellen Brook is diffuse because of the nature of the erosion prone,
sandy, draining soils with underlying clay layers and high water table which is ideal for the transport of
nutrients. All land uses contribute to the nutrient run-off to the Ellen Brook, particularly phosphorus
which does not bind in the soil as effectively as nitrogen (Horwood 1997). This nutrient load does not
have as much effect on the local environment as it does to the Swan-Canning system.
Ellen Brook Catchment Water Quality Monitoring Snapshot June – September 2014
Ellen Brockman Integrated Catchment Group 21
Figure 4: Ellen Brook catchment Land Use map (SRT, 2009).

Ellen Brook Catchment Water Quality Monitoring Snapshot June – September 2014
Ellen Brockman Integrated Catchment Group 22
Table 2: Land Use and Management Issues: Factors affecting Conservation or Protection of Natural Resources (Land Assessment Pty Ltd, 1999).
Water Deteriorating Water Quality due to;
Nutrient loss to drainage (eutrophication)
Salinity
Other pollutants
Soils Loss of soil due to;
Water erosion
Wind erosion
Vegetation Decrease in amount and quality of vegetation due to;
Clearing
Weed infestation
Agricultural
Productivity
Soil salinity
Waterlogging
Soil acidity
Soil structure decline
Water repellence
Land Development Flooding
Waterlogging
Ease of excavation/slope instability
Socio economic
aspects of land use
change
Loss of agricultural land
Land use conflict
Diversification
Fire risk

Ellen Brook Catchment Water Quality Monitoring Snapshot June – September 2014
Ellen Brockman Integrated Catchment Group 23
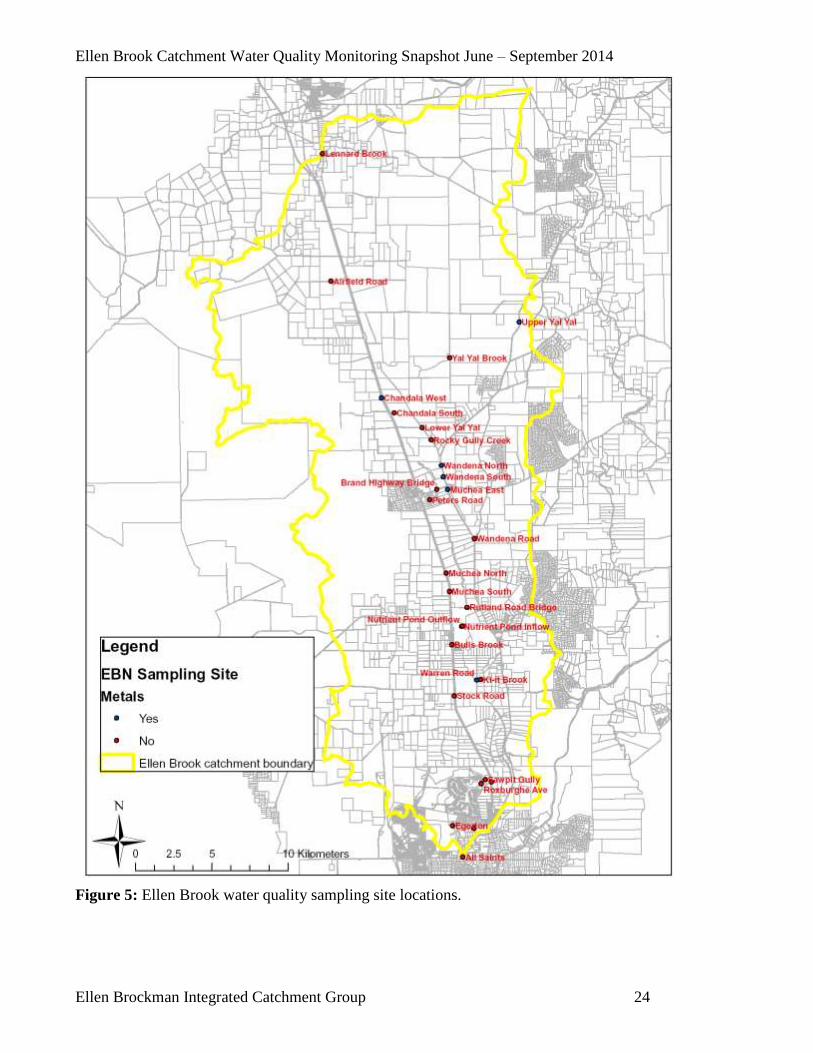
6. Methodology Water samples were taken from twenty seven sites within the Ellen Brook catchment (Figure 5). These
sites were selected to be representative of a particular part of the catchment, to determine their relative
nutrient and metal contribution to the Ellen Brook, and whether they were situated upstream or
downstream of potentially high impact land uses or of likely contaminant sources. Table 3 lists the
sampled sites by site number, site name and relative waterway component. Site location is also
provided using street names, northings and eastings.
Table 3: Site information including site number, site name, waterway section/component, location, northings and eastings.
Site
no.
Site Name Waterway section/
Component
Location Northing Easting
EBN1 Lennard Brook Lennard Brook Lennard Brook Road 6527771 0396613
EBN2 Airfield Road North Chandala/Ellen Brook
(Bambun Lakes)
Airfield Road 6519428 0397101
EBN3 Chandala West Chandala Brook West Brand Hwy west loc # 853 6511801 0400463
EBN4 Chandala South Chandala Brook South Brand Hwy east / TIWest 6510846 0401302
EBN5 Yal Yal Brook Yal Yal Brook Reserve Road 6514458 0404923
EBN6 Rocky Gully Creek Rocky Gully Creek Old Gingin Rd 6509047 0403714
EBN7 Wandena North Waterway to Ellen Brook Wandena North - Great Northern
Highway
6507384 0404384
EBN8 Wandena South Waterway to Ellen Brook Wandena South - Great Northern Highway
6506686 0404561
EBN9 Brand Hwy Bridge Ellen Brook - Muchea Central Bridge on Brand Hwy south 6505838 0404093
EBN10 Muchea East Waterway to Ellen Brook
Muchea East
Great Northern/Brand Highways 6505833 0404780
EBN11 Muchea North Waterway to Ellen Brook - Muchea south /Railway Rd 491
chit/swan sign
6500336 0404611
EBN13 Rutland Road Ellen Brook (upper) Rutland Road bridge 6498117 0406044
EBN14 Nutrient Inflow Waterway – Nutrient stripping inflow
Bingham Road/ Department of Defence
6496871 0405690
EBN15 Nutrient Outflow Waterway - Nutrient stripping
Pond outflow
Bingham Road/ Department of
Defence
6496885 0405757
EBN16 Bulls Brook Bullsbrook Sth past Strachan on Railway Rd 6495684 0405054
EBN17 Warren Road Mid Ellen Brook Warren Road 6493379 0406685
EBN18 Gauging Station Ellen Brook - Almeria Gauging
Station
Almeria Parade/Apple Street 6486743 0407638
EBN19 Belhus Reserve Lower Ellen Brook Belhus Reserve Millhouse Rd
Bridge
6483685 0406519
EBN21 Lower Yal Yal Yal Yal Brook South Old Gingin Road 6509922 0403110
EBN22 Ki-it Brook Ki-it Brook Warren Road 6493382 0406959
EBN23 Peters Road Waterway to Ellen Brook –
Muchea town site
Peters Road 6505232 0403580
EBN24 Stock Road Waterway to Ellen Brook West Railway Parade 6492415 0405221
EBN25 Sawpit Gully Waterway to Ellen Brook – The
Vines north
Lot 4/285 Railway Parade, Upper
Swan
6486777 0407430
EBN26 Egerton Waterway from Egerton Estate
to Ellen Brook
Corona Way 6483859 0405129
EBN27 Wandena Road Waterway to Ellen Brook Corner of Great Northern Hwy
and Wandena Road
6502590 0406553
EBN28 Upper Yal Yal Yal Yal Brook North Great Northern Hwy 6516783 0409421
EBN29 Roxburgh Avenue Drain leading to Ellen Brook from The Vines east
Roxburgh Avenue 6486603 0406975
Ellen Brook Catchment Water Quality Monitoring Snapshot June – September 2014
Ellen Brockman Integrated Catchment Group 24
Figure 5: Ellen Brook water quality sampling site locations.

Ellen Brook Catchment Water Quality Monitoring Snapshot June – September 2014
Ellen Brockman Integrated Catchment Group 25
6.1 Water Sampling
Western Australia experienced a below average rainfall year in 2014. With the total annual rainfall for
Perth recorded as 674.4mm. The average total annual rainfall for Perth is 729.9mm, and 677.9mm for
Pearce RAAF Base (BOM, 2014). In 2007 the Pearce RAAF received a total of 626.2mm In 2008
Pearce received a total of 610.8mm. In 2009 Pearce received a total of 554.9mm. In 2010 Pearce
received at total of 347.2mm. In 2011 pearce received a total of 638.6mm. In 2012 Pearce received
543.7mm. In 2013 Pearce received a total of 632.3. In 2014 Pearce received 533.8mm which is
approximately 79% of the average. However the majority of this rainfall was between July and
September. Spring rainfall was above average but the summer rainfall was well below average..
(Appendix F).
Sampling occurred on 25th-26th June, 30th-31st July, 20th-21st August and 22nd-23rd September. The
collection of the samples followed strict protocols to prevent contamination and ensure consistency in
results. An outline of the sample collection technique is included in the Ellen Brook sampling and
analysis plan 2014 (Appendix G). Field observation forms were filled out for each water sample. All
samples were transported under ‘chain of custody’ to NMI and were analysed in accordance with the
laboratory methods. All samples collected from the Ellen Brook catchment were analysed by NMI
laboratory, which has been accredited by the National Association of Testing Authorities (NATA).
6.2 Water Analysis
Water at each of the sites was measured in situ for physical properties (pH, conductivity and
temperature), using WTW pH and EC probes. Samples were also collected and analysed for a range of
contaminants likely to be present in semi-rural, industrial and urban catchments. They were then sent to
NMI laboratory to be analysed for nutrients including total nitrogen (TN), total phosphorus (TP), total
filterable phosphorous (TFP), total oxidised nitrogen (TON), soluble reactive phosphorus (SRP),
dissolved organic nitrogen (DOrgN), nitrogen as ammonia (NH4-N), and total suspended solids on
each sampling occasion.
Samples from Chandala South (EBN4), Wandena North (EBN7), Wandena South (EBN8), Muchea
East (EBN10), Warren Road (EBN17), Brand Hwy (EBN9) and Upper Yal Yal (EBN28) were also

Ellen Brook Catchment Water Quality Monitoring Snapshot June – September 2014
Ellen Brockman Integrated Catchment Group 26
collected and sent to NMI laboratory for analysis of metals on each sampling occasion. NMI analysed
the samples for the following metals; cadmium (Cd), mercury (Hg), arsenic (As), copper (Cu), lead
(Pb), zinc (Zn), aluminium (Al), chromium (Cr), iron (Fe) and nickel (Ni). Table 4 summarizes analysis
techniques used for physical parameters, nutrients and heavy metals by NMI.
Table 4: Summary of chemical analysis techniques.
Parameters
Limit of Reporting (LOR)
Variable Unit
Analysis Technique
Cond
(Comp25ºC) 1 uS/cm direct read
pH 0.05 direct read
TSS 1 mg/L grav
PO4-P 0.003 mg/L DA
NOx-N 0.005 mg/L DA
TP 0.01 mg/L DA
TN 0.05 mg/L DA
Parameter
Limit Of Reporting
(LOR)
Variable Unit
Analysis Technique
Inorganics
Aluminium 0.005 mg/L NT2.47
Arsenic 0.001 mg/L NT2.47/2.51
Cadmium 0.0001 mg/L NT2.47
Chromium 0.001 mg/L NT2.47
Copper 0.001 mg/L NT2.47
Iron 0.005 mg/L NT2.47
Lead 0.001 mg/L NT2.47
Mercury 0.0001 mg/L NT2.47/2.44
Nickel 0.001 mg/L NT2.47
Zinc 0.001 mg/L NT2.47

Ellen Brook Catchment Water Quality Monitoring Snapshot June – September 2014
Ellen Brockman Integrated Catchment Group 27
7. Results and Discussion
The National Water Quality Management Strategy provides guidance on both ecosystem and human
health protection. Water quality guidelines are provided for a range of environmental values including
aquatic ecosystems, primary industries, recreation and aesthetics, drinking water, industrial water,
cultural issues, and monitoring and assessment (ANZECC & ARMCANZ, 2000). This report will
compare sample concentration results with aquatic ecosystem trigger values for lowland river systems
and, when necessary, livestock drinking water trigger values. This is in accordance with the trigger
values suggested in the Draft Ellen Brook Management Plan.
The guidelines recognise three levels of protection for aquatic ecosystems; those with high
conservation value, slightly to moderately disturbed ecosystems and highly disturbed ecosystems. To
assess the level of toxicant contamination in aquatic ecosystems, trigger values were developed from
data using toxicity testing on a range of test species. The trigger values (99%, 95%, 90% and 80%)
approximately correspond to the levels of protection described above. This report will use the 95%
protection level for aquatic ecosystems due to the high conservation value of the receiving environment
of the Swan River.
Six metals (cadmium, copper, chromium, lead, nickel, mercury and zinc) are known to have varying
toxicity in different water hardness and so were compared to the ANZECC hardness-modified trigger
values (HMTV). Refer to Appendix E for details on calculations.
It is important to note that exceedence of the trigger value does not indicate that “standards” are not
being met, but is rather an indication that further consideration should be given to the situation. An
exceedence of the trigger value indicates that there is the potential for an impact to occur and should
therefore trigger a management response such as further investigation or adaptation of the guidelines
according to local conditions (ANZECC & ARMCANZ 2000). No ecosystem is pristine, so when
using guidelines the realistic and achievable water quality of the Ellen Brook should be considered.

Ellen Brook Catchment Water Quality Monitoring Snapshot June – September 2014
Ellen Brockman Integrated Catchment Group 28
7.1 Water Quality
7.1.1 Flow and Rainfall
According to the DEBCMP (2000) runoff from the Ellen Brook catchment consists of approximately
60% surface and near-surface runoff, with 40% shallow groundwater flow. Additionally, it has been
suggested that surface runoff from agricultural paddocks during the winter months is the primary cause
of nutrient (nitrogen and phosphorous) discharge to streams within the catchment. The existing
townships including Pearce, Bullsbrook and Muchea also contribute small amounts to the total load.
Muchea and West Bullsbrook are unsewered townships.
Muchea and Bambun are situated on Palusplains which are seasonally waterlogged plains or flats.
Groundwater levels vary seasonally and in relation to rates of recharge from rainfall, evapo-
transpiration, changes in vegetation and land use, and groundwater extraction. The shallow depth to
groundwater for the low lying portion of the Ellen Brook catchment and the risk of seasonal inundation
places constraints on urban and industrial development, and facilitates the transport of readily soluble
nutrients into the waterways.
Flow from the Ellen Brook into the Swan River occurs as a result of winter rainfall and groundwater
seepage, and ceases over the summer months. The Lennard Brook and Yal Yal Brook are perennial
streams which depend on groundwater discharge during the hotter months.
Figure 6 shows the total rainfall for Station 009053 – Pearce RAAF Base. In 2012 the season broke in
June with the highest monthly rainfall received in June but unfortunately July was very dry and no
substantial rain was received until August. In 2013 the season broke in late July but the highest
monthly rainfall received in September. Unfortunately we had very little rain since then and any
summer flows were greatly reduced. In 2014 the highest monthly rainfall was received in May. June
was relatively dry before decent rainfall was again received in July. Because of this we commenced our
sampling period in June rather then July in order to catch the break of season flows.

Ellen Brook Catchment Water Quality Monitoring Snapshot June – September 2014
Ellen Brockman Integrated Catchment Group 29
Figure 6: Total monthly rainfall for 2014, 2013, 2012 and 2011 within the Ellen Brook Catchment at 009053 – Pearce RAAF Base.
Sampling occasion

Ellen Brook Catchment Water Quality Monitoring Snapshot June – September 2014
Ellen Brockman Integrated Catchment Group 30
All samples taken were from sites with flowing water at a depth ranging from 10-20cm below the
surface and not in contact with the sediment at any time. Water temperatures ranged from 1.8ºC to
21.8ºC (Figure 7). Temperatures recorded during the June sampling run ranged between 8.6ºC and
17.7ºC. Temperatures recorded during the July sampling run ranged between 12.5ºC and 19.5ºC.
Temperatures recorded during the August sampling run ranged between 1.8ºC and 19.5ºC.
Temperatures recorded during the September sampling run ranged between 12.8ºC and 21.8ºC.

Ellen Brook Catchment Water Quality Monitoring Snapshot June – September 2014
Ellen Brockman Integrated Catchment Group 31
Figure 7: Temperature of surface waters sampled between July and October within the Ellen Brook catchment in 2014. * Note, blanks represent no sample.
Ellen Brook Catchment Water Quality Monitoring Snapshot June – September 2014
Ellen Brockman Integrated Catchment Group 32
7.2 Physical Properties
7.2.1 pH
pH is a measure of acidity and alkalinity. It is measured on a logarithmic scale with a pH of 7.0 being
neutral, a pH of less than 7 being acidic and a pH of greater than 7 being alkaline or basic. The
importance of pH lies mainly in its effect on other water quality parameters, chemical reactions and
aquatic organisms. For example, pH can affect the solubility and toxicity of a wide range of metal
contaminants (IEA 2003). No pH data was collected at Upper Yal Yal (EBN28) as it is known to have
extremely acidic pH values and would have possibly damaged the monitoring equipment.
The majority of pH levels recorded within the Ellen Brook catchment were within the ANZECC water
quality guidelines of 6.5-8 for lowland rivers (Figure 8). There was little variation in pH among most
sites or between most sampling occasions.
Wandena South (EBN8), Wandena North (EBN7) and Muchea East (EBN10) recorded pH levels
below the ANZECC Guidelines on each sampling occasion (Figure 8). These three sites have
consistently recorded pH levels lower than the ANZECC guideline since the 2005 water quality
sampling program. There has been a significant drop in pH at Muchea East (EBN10) since the 2005
water quality monitoring program. In 2005 pH ranged between 6.3 and 6.95. In 2011 pH ranged
between 3.4 and 6.2 This is potentially due to clay extraction pits located upstream of the tributary.
Dewatering clay pits located higher up in the catchment may have contributed to pulses of increased
acidity being released from those sites. An acidic dam, with a recorded pH as low as 2.8 is on a
neighbouring property. Therefore, sites situated downstream of existing clay pits require regular
monitoring. Interactions with groundwater could also impact the level of pH, and warrants further
investigation.
According to Parsons Brinckerhoff et al. (2006), the overlying gravely sands found at the Wandena and
Muchea East subcatchments are slightly acidic with pH values ranging between 5 and 6. pH was found
to decrease with increasing depth to the clay horizon. At a depth of 2m pH values were recorded
around 5. At a depth of 10m pH was recorded as low as 3.63. The likely source of actual acidity
identified by Parsons Brinckerhoff included;

Ellen Brook Catchment Water Quality Monitoring Snapshot June – September 2014
Ellen Brockman Integrated Catchment Group 33
Historic precipitation of iron sulphides under anoxic marine conditions and subsequent
oxidation of sulphides forming sulphuric acid as sea levels declined.
Some of the acidity would have been leached by rainfall infiltration.
Some of the acidity may have been lost by displacement of cations (e.g. Al3+, Mg2+) on cation
exchange sites of clay minerals.
Potential acidity was only encountered beneath the watertable at a 15m depth as expected
because of the relatively permanent anoxic condition.
Therefore, these soils are naturally acidic, however disturbance and excavation works carried out at
these sites has altered the groundwater table and the relationship between anoxic and aerobic
conditions. This has resulted in sulphides in the soil forming sulphuric acid that mobilises metals in the
soil profile. Refer to Table 5 for pH value of Wandena North (EBN7), Wandena South (EBN8) and
Muchea East (EBN10).
Sawpit Gully (EBN25) and Warren Rd (EBN17) recorded pH values within the ANZECC Guideline on
all occasions. In 2012 these sites were outside the guidline, we though it was just an anomaly and the
2013 results confirm this. This site will contine to be monitored in 2014. to ensure it stays within the
guideline..
Lennard Brook (EBN1) and Yal Yal Brook (EBN5) have been identified in previous Ellen Brook
Snapshot Reports as a potential cause for concern due to low pH values being recorded, below the
ANZECC guidelines, in November 2006. Their respective values were 4.36 and 5.65. Since 2007 pH
levels have remained within the guidelines on nearly all sampling occasions. In 2014 both Lennard
Brook and Yal Yal Brook remained within the ANZECC guidelines on each sampling occasion.
Peters Rd (EBN 23) recorded pH levels above the ANZECC guidelines on one out of three sampling
occasions (Figure 8) This sites have been sampled since 2007 and prior to 2011 had never previously
exceeded ANZECC guidelines on more than one occasion. Increased pH can be caused by a
combination of factors including reduced flow and an increase in temperature resulting in algal growth.
Increased algal growth can result in an increase in pH. This site was closely monitored in the 2014
sampling run and it appears that previous pH results above the guideline were an anomaly.

Ellen Brook Catchment Water Quality Monitoring Snapshot June – September 2014
Ellen Brockman Integrated Catchment Group 34
Figure 8: pH of surface water sampled within the Ellen Brook catchment between July and October 2014. *Note: blanks represent no sample
Table 5: pH levels of Wandena North (EBN7), Wandena South (EBN8), Muchea East (EBN10) between July and October 2012.
Date EBN 7 EBN 8 EBN 10
25/06/14 3.612 5.932 3.505
30/07/14 3.852 6.115 3.748
20/08/14 4.879 6.268 5.026
22/09/14 4.28 6.803 3.966
ANZECC Guideline
Ellen Brook Catchment Water Quality Monitoring Snapshot June – September 2014
Ellen Brockman Integrated Catchment Group 35
7.2.2 Electrical Conductivity
Electrical conductivity (EC) measures the total concentration of inorganic ions (particularly sodium,
chlorides, carbonates, magnesium, calcium, potassium and sulfates). Conductivity is often used as a
measure of salinity. The conductivity level can directly affect the use of the water. For example,
different types of plants have varying tolerance levels to salinity, as does livestock.
Electrical conductivity ranged from 0.352mS/cm at NSP out to 05.95amS/cm at Muchea East. All sites
exceeded ANZECC guidelines for freshwater lowland rivers of 0.12mS/cm to 0.3mS/cm (Figure 9).
Although the sites exceeded the guidelines for ecosystem value, the majority of them were within the
marginal zone (marginal water is between 0.9mS/cm to 2.7mS/cm), anything above 2.7mS/cm is
considered brackish and would be detrimental for irrigation of stone fruit and citrus orchards
(Appendix D). Therefore, the conductivity is acceptable for current land uses (grazing) but
consideration for long term effects on ecological value should also be considered and continued
monitoring is essential. The exceptions to this included Wandena North (EBN7), Wandena South (EBN
8) and Muchea East (EBN10) which exceeded the Marginal Zone on at least 3 sampling occasions.
Conductivity at these three sites was brackish on at least one of the sampling occasions, and ranged
between 3.81mS/cm (EBN10) and 5.95mS/cm (EBN7). High conductivity readings were concentrated
to the central-east of the Ellen Brook catchment, at the Muchea East and Wandena sub-catchments
(Appendix A).
The results showed that nine out of twenty sites were brackish in 2006. In 2007, five out of twenty-
seven sites were brackish. In 2008, eight of the twenty eight sites were brackish. In 2009, ten of the
twenty seven sites were brackish. In 2010 seven of the 27 sites were brackish. In 2011, seven out of the
27 sites were brackish. In 2012 eight out of the 27 sites were brackish. In 2013 only 4 Sites were
brackish, 2014 only 3 sites were consistently brackish, this improvement can be attributed to the high
early winter rainfall. The Ellen Brook main channel had relatively marginal conductivity readings. No
site on any sampling occasion of the Ellen brook recorded a brackish conductivity reading.
Some individual samples taken from Muchea East, Wandena North and Wandena South were
unacceptable for milk cows, poultry, irrigation of olives and figs, grapes, tomatoes and lettuce
(Appendix D). This is unlikely to affect surrounding landholders as the cattle are for beef production
which have a much higher tolerance level, and the nearby chicken farm uses bore water. New urban

Ellen Brook Catchment Water Quality Monitoring Snapshot June – September 2014
Ellen Brockman Integrated Catchment Group 36
developments have occurred throughout the catchment in the past few years and particularly in these
areas of concern, However the land is generally used for small hobby farms, with most landholders
using bore water and rain water tanks.
It is of great concern for environmental value that most sites consistently exceeded ANZECC water
quality guidelines for lowland river systems and certainly warrants further monitoring. Over the four
sampling occasions the conductivity reading for the southern most sampling site of the catchment,
(Belhus Reserve, EBN19), averaged 1.33mS/cm. This shows that the higher concentrations of salts in
the major tributaries are diluted as they flow into the Ellen Brook and through the catchment. However,
this concentration is above the guideline, deemed to be marginal and unacceptable for stone fruit,
citrus, peas, carrot, onion and hot water systems (Appendix D). The most brackish sites were in the
mid-eastern part of the catchment (Horwood, 1997). This trend has been noted in previous water
quality programs.

Ellen Brook Catchment Water Quality Monitoring Snapshot June – September 2014
Ellen Brockman Integrated Catchment Group 37
Figure 9: Electrical Conductivity of surface water within the Ellen Brook Catchment between June and September 2014.*Note blanks represent no
sample
ANZECC Guideline

Ellen Brook Catchment Water Quality Monitoring Snapshot June – September 2014
Ellen Brockman Integrated Catchment Group 38
7.2.3 Total Suspended Solids
Total Suspended Solids (TSS) refers to naturally occurring suspended particles including; silt,
phytoplankton and organic matter within a water body. Natural sources of TSS include water
turbulence from storms, phytoplankton blooms and wind/wave action. However, TSS may also indicate
detrimental environmental conditions such as erosion. This makes levels higher than normal in the
water body and can result in increased deposition of material to the substrate that may smother faunal
communities (McTaggart, 2002).
There are large variations in TSS throughout water bodies and guidelines should be determined by
including information on natural levels in the area. As no ANZECC guideline currently exists for TSS,
this report will use the interim guideline of 6mg/L adopted by the Department of Water and originally
developed by the Waters and Rivers commission for the Wilson Inlet report to community (October
2000).
TSS in the Ellen Brook catchment ranged between less then 1 and 26mg/L at Wandena South (EBN8),
(Figure 10). There was great variation in the TSS recorded at most of the sites. No specific sampling
occasion recorded consistently high TSS concentrations across the sampling sites. However fifteen
sites exceeded the interim guideline on at least one of the sampling occasions, these included, Egerton
(EBN26), Sawpit Gully (EBN25), Gauging station (EBN18) Warren Rd (EBN17), Muchea East
(EBN10), Lower Yal Yal (EBN21), Wandena North (EBN7) Wandena South (EBN8), Bulls Brook
(EBN16), Belhus(EBN19), Rutland Rd (EBN24), Chandala West(EBN3), Roxburghe ave (EBN29) and
Lennard Brook (EBN1), (Figure 10). Concentrations at these sites ranged between 7 and 26mg/L. The
outliers in these results are Wandena South(EBN8) This particular result can be accounted for by the
low flow at this site coupled with a large amount sediment that had been deposited from high rainfall in
the winter months. The other less extreme events were experienced at most subcatchments on various
sampling occasions. They do not appear to be localized, but are probably due to a combination of
influencing factors including peak rainfall events, earthworks and development, stocking rates and
stock access to waterways, clearing of vegetation and increased erosion.

Ellen Brook Catchment Water Quality Monitoring Snapshot June – September 2014
Ellen Brockman Integrated Catchment Group 39
Figure 10: Total Suspended Solid concentrations in surface water within the Ellen Brook Catchment between June and September 2014. *Note
blanks represent not sampled
Interim Guideline

Ellen Brook Catchment Water Quality Monitoring Snapshot June – September 2014
Ellen Brockman Integrated Catchment Group 40
7.3 Nutrient concentrations in water
Most nutrients present in the catchment are stored in the soils and are transported to the Ellen Brook via
surface water (tributaries, drains and general run-off). The original sources of nutrients include;
weathering, leaching from soils particularly in eroded areas, fertiliser run-off, detergents, sewerage,
fixation by some plants, and decomposition of plant matter, animal wastes and other organic wastes
(IEA 2003). Nitrogen and phosphorus are the two major essential elements to plants. Excessive
amounts of nutrients in waterways can result in eutrophication with plant and algae growth, increases in
nuisance insect numbers and unbalanced aquatic ecosystems. Nutrients include nitrogen in the form of
ammonia, nitrate and nitrite, and phosphorus in the form of phosphate either dissolved (soluble reactive
phosphate) or particulate (suspended).
7.3.1 Total Nitrogen
Total nitrogen (TN) refers to all forms of nitrogen present including organic (e.g. plant decay matter)
and inorganic in the forms of ammonia, nitrate and nitrite (McTaggart 2002). Sources of nitrogen
include fertilisers, industrial cleaning operations, feed lots, animal droppings, combustion of fossil fuels
and plant debris.
Most sites except Wandena North (EBN7), Muchea East (EBN10), Ki-it Brook (EBN22),and Wandena
Road (EBN27) were consistently above the ANZECC water quality guideline values of 1.2mg/L for
lowland river systems and ecosystem health on most sampling occasions (Figure 11). These results
were consistent with those from 2013. Generally, TN concentrations at all sites were lowest during
both the June and September sampling occasion which could be accounted for due to the below average
rainfall received those months and therefore lack of flushing
Muchea North (EBN11) consistently recorded the highest TN values between 7.7 and 9.2mg/L on all
sampling occasions. this is over 7 times above the guideline. Sawpit Gully (EBN25), Wandena South
(EBN8), Peters Rd (EBN23) Stock Road (EBN24), Bulls Brook (EBN16), Chandala West (EBN3) and
Lennard Brook (EBN 1) all recorded relatively high TN concentrations and should continue to be
monitored. Sawpit Gully receive runoff from agricultural land uses to the north of The Vines
development and with new land releases in that subcatchment garden establishment may be

Ellen Brook Catchment Water Quality Monitoring Snapshot June – September 2014
Ellen Brockman Integrated Catchment Group 41
contributing to an increase in TN. Stock Road (EBN24) and Bulls Brook (EBN 16) are located
downstream of agricultural and horticultural land located on sandy soils which accounts for increased
nutrients from runoff. Chandala West (EBN3) and Lennard Brook (EBN1) are also located down
stream of agricultural areas where runoff of nutrients is common due to poor soils. Peters Rd is located
downstream of the unsewered townsite of Muchea. Most of these sites are situated on the western half
of the catchment and contribute a significant amount of TN to the Ellen Brook.
As shown in previous Snapshot Reports for the Ellen Brook catchment, there appears to be a general
trend in the data showing that western parts of the catchment have higher levels of nutrients in the run
off than eastern sites, most likely due to a change in soil type. Duplex soils of sand over clay with
higher nutrient retention capabilities and lateritic uplands dominate on the Darling and Dandaragan
Plateaus to the east of the Ellen Brook. These soils are able to retain nutrients in the soil for a longer
period of time than the well drained, porous, sandy soils of the Bassendean sands complex located to
the west (DEBCMP, 2001).

Ellen Brook Catchment Water Quality Monitoring Snapshot June – September 2014
Ellen Brockman Integrated Catchment Group 42
Figure 11: Total Nitrogen concentration in surface water within the Ellen Brook catchment sampled between June and September 2014. * Note, blanks represent no sample.
ANZECC Guideline

Ellen Brook Catchment Water Quality Monitoring Snapshot June – September 2014
Ellen Brockman Integrated Catchment Group 43
7.3.2 Total Oxidised Nitrogen
Total oxidised nitrogen (TON/NOx) is the sum of the oxidised forms of nitrogen, which includes nitrite
(NO2) and nitrate (NO3), and is often referred to as NOx. Nitrite can be converted to nitrogen gas by
denitrifying bacteria and ammonium (NH4) in the form of nitrate; hence plants can easily absorb this
form of nitrogen in a continuous cycle as it is readily soluble in water and is rapidly transported
through the catchment via surface run-off, sub-surface and groundwater flows (Horwood, 1997).
The majority of sites were within the ANZECC water quality guidelines for TON (0.15mg/L) for
lowland river systems and ecosystem health on most sampling occasions, (Figure 12).
Lennard Brook (EBN1), Yal Yal Brook (EBN5), Sawpit Gully(EBN25) Roxburgh ave (EBN29) and
Egerton (EBN26) recorded TON concentrations above the guideline on every sampling occasion. This
is consistent with results from 2013. Lennard Brook TON concentrations ranged between 2.5mg/L and
3.4mg/L. Yal Yal Brook TON concentrations ranged between 1mg/L and 1.3mg/L. Sawpit Gully TON
concentrations ranged between 0.26mg/L and 0.90 mg/L. Egerton TON concentrations ranged between
1.1mg/L and 2.3mg/L. Roxburghe TON concentrations ranged from 0.33mg/L to 1.3mg/L. Rocky
Gully (EBN6) recorded TON concentrations above the guideline on 3 occasions. Airfield Rd (EBN2)
recorded TON Concentrations above the guideline on 2 occasions. Muchea East (EBN10) Muchea
North (EBN11), Chandala West(EBN3), Wandena North (EBN7) Ki-it Brook (EBN22) and Peters Rd
recorded TON concentrations above guidelines on 1 out of 4 occasions sampled and ranged between
0.19mg/L and 0.58Mg/L, which is only slightly above the guideline. Some of these results are high in
comparison to other sampling sites within the Ellen Brook catchment as TON is directly available to
plants and therefore has a direct correlation with algal blooms. These exceedences are potentially a
result of the surrounding intensive land uses (golf course and urban development and agriculture),
(Horwood, 1997).
Lennard Brook (EBN1) recorded TON concentrations twenty two times greater than the guideline
value, and Yal Yal Brook (EBN5) recorded concentrations over eight times greater then the guideline.
These sites are perennial tributaries in the northern half of the catchment (Figure 5). Lennard Brook is
a proclaimed waterway, an important source of water for nearby horticulture, so monitoring of this site
should continue. Potential sources of the elevated TON concentrations are linked to land use including

Ellen Brook Catchment Water Quality Monitoring Snapshot June – September 2014
Ellen Brockman Integrated Catchment Group 44
an abattoir on Lennard Brook, and intensive horticulture further upstream on both waterways which use
high levels of fertiliser.

Ellen Brook Catchment Water Quality Monitoring Snapshot June – September 2014
Ellen Brockman Integrated Catchment Group 45
Figure 12: Total Oxidised Nitrogen (TON) sampled within the Ellen Brook catchment between June and September 2014. *Note blanks
represent no sample.
ANZECC Guideline

Ellen Brook Catchment Water Quality Monitoring Snapshot June – September 2014
Ellen Brockman Integrated Catchment Group 46
7.3.3. Ammonia as NH3N
Most sites were within the ANZECC guideline of 0.08mg/L on at least 1 sampling occasion(Figure 13).
Sawpit Gully (EBN25), Warren Road (EBN17), Wandena North (EBN7), Wandena South(EBN8),
NSP In (EBN14), Chandala West (EBN3), Brand Hwy (EBN9), Muchea North (EBN11) exceeded the
guidelines on more than one occasion. In general levels were higher than in 2013. Possible causes to
the increase at some sites could be increased stocking rates on the surrounding areas or increase in the
use of highly soluble fertilisers. Wandena North did not record levels higher then in previous years. In
2013 we inferred that possible causes of the increase could be a breakdown in the treatment system for
animal manure at the WAMIA saleyards following extreme rainfall events in spring. Due to the decline
in NH3 in 2014 we would assume that the increased NH3 of 2013 was a one off, not an emerging trend.
Other Sources of this Ammonia could include agricultural fertilisers, and the decomposition of organic
wastes. Most of these sites are situated adjacent to or near to agricultural land-uses such as cattle
grazing, cropping, fertiliser storage, stock yards and horticulture.

Ellen Brook Catchment Water Quality Monitoring Snapshot June – September 2014
Ellen Brockman Integrated Catchment Group 47
Figure 13: Ammonia as Nitrogen (NH3N) sampled within the Ellen Brook catchment between June and September 2014. *Note blanks represent
no sample
ANZECC Guideline

Ellen Brook Catchment Water Quality Monitoring Snapshot June – September 2014
Ellen Brockman Integrated Catchment Group 48
7.3.4. Dissolved Organic Nitrogen
Dissolved Organic Nitrogen (Dissolved Organic Nitrogen) is comprised of the organic forms of
nitrogen including amino acids, proteins, urea and humic acid. All sampling sites exceeded the
ANZECC guideline of 0.04mg/L on all sampling occasions. The DON results show a direct correlation
with the Total Nitrogen (TN). Additionally, DON concentrations when compared with total nitrogen,
ammonia and total oxidised nitrogen concentrations showed that nitrogen exists primarily in its soluble
form in the Ellen Brook catchment.

Ellen Brook Catchment Water Quality Monitoring Snapshot June – September 2014
Ellen Brockman Integrated Catchment Group 49
Figure 14: Dissolved Organic Nitrogen (DON) sampled within the Ellen Brook catchment between June and September 2014. *Note blanks
represent no sample
ANZECC Guideline
Ellen Brook Catchment Water Quality Monitoring Snapshot June – September 2014
Ellen Brockman Integrated Catchment Group 50
7.3.3 Total Phosphorous
Total phosphorus (TP) is a measure of all phosphorus in the water including the available and
unavailable (or potentially available) forms of phosphorus including orthophosphates (fertilisers),
organic phosphate (plants & animals) and condensed phosphates (inorganic cleaning agents). Sources
of phosphorus include fertilisers, plant debris, detergents, industrial wastes and lubricants (McTaggart
2002). Phosphorus is naturally occurring in the environment and is usually the limiting factor for plant
growth. The concentration of phosphorous is generally lower than nitrogen in most waterways.
However, an increase in the total P level in freshwater bodies stimulates the production of Chlorophyll
a in phytoplankton and results in an algal bloom (Russell, 2001).
As plants and animals excrete waste or die then decay, the organic phosphate sinks to the bottom where
bacteria convert it back to inorganic phosphate. Inorganic phosphate returns to the water column when
sediments are disturbed, making it available again for uptake by the plants and the cycle continues.
Inorganic phosphate is not as mobile as soluble forms of nutrients and tends to be absorbed by most
soils and particulate material. This results in a steady accumulation of phosphorus that slowly moves
through the soil profile. Holding time of phosphorus in the catchment depends on the recharge rate to
groundwater, rate of adsorption to soil particles and the extent of soil saturation (Gerritse, 1996).
There was no relationship between the time of sampling and the level of TP as concentrations varied at
each sampling site, each month (Figure 15). The majority of sites were consistently higher than the
guideline value of 0.065mg/L on all four sampling occaisions, except for Roxburgh Avenue (EBN27),
Kit-it Brook (EBN22), Wandena Road (ENB27), Muchea East (EBN10), Rocky Gully (EBN6),
YayYal (EBN5) and Wandena North (EBN7). Which were below the guideline on all sampling
occasions. Muchea North (EBN11) however recorded TP concentrations approximately eighty times
higher than the guideline value of 0.065mg/L. This is consistant with the levels recorded in 2012
however more then what was recorded in 2013.
These results are certainly cause for further investigation. Similar to total nitrogen, there appears to be a
general trend in the data showing that sub catchments to the west of the Ellen Brook have higher levels
of nutrients in the runoff than those to the east. This is due to changes in soil type (Figure 3). Duplex
soils of sand over clay with high phosphorous retention capabilities dominate on the Darling and
Dandaragan Plateaus to the east of the Ellen Brook. These soils have a higher nutrient trapping

Ellen Brook Catchment Water Quality Monitoring Snapshot June – September 2014
Ellen Brockman Integrated Catchment Group 51
capability and are able to retain nutrients in the soil for a longer period of time than the well drained,
porous, sandy soils of the Bassendean sands complex located to the west (DEBCMP, 2001).
Muchea North (EBN11) was identified as the highest contributor of TP to the Ellen Brook. This
emerging trend has been identified in every Snapshot report since 2005. As a result of monitoring by
the Ellen Brockman Integrated Catchment Group, Muchea North was identified in the Swan River
Trust’s Drainage Nutrient Intervention Program (DNIP) as a site requiring nutrient
removal/intervention in the Lower Ellen Brook catchment. On-ground works formed a treatment train
approach to nutrient removal and was implemented during 2009 and 2010. The treatment train involved
the installation of a drain diversion to slow the flow before passing through a nutrient filter and into the
Ellen Brook. Continued monitoring is required to determine the effectiveness of this treatment train
approach in this catchment however our initial snapshot results look positive.

Ellen Brook Catchment Water Quality Monitoring Snapshot June – September 2014
Ellen Brockman Integrated Catchment Group 52
Figure 15: Total Phosphorous concentration sampled within the Ellen Brook catchment between June and September 2014.
NB: Roxburgh Ave, Ki-it Brook, Wandena Road, Muchea East, Wandena North, Rocky Gully and Yal Yal recorded very low concentrations
of TP. *Note blanks represent no sample
ANZECC Guideline

Ellen Brook Catchment Water Quality Monitoring Snapshot June – September 2014
Ellen Brockman Integrated Catchment Group 53
7.3.4 Soluble Reactive Phosphorous
Soluble reactive phosphorus (SRP) measures only the dissolved phosphorus in water and provides a
measure of the immediately available phosphate in the system at the time of sampling; it is also
referred to as PO4. As this form of phosphorus is readily available it is more likely to stimulate algal
blooms. This can lead to more decaying vegetation which alters river characteristics including elevated
temperature, reduced oxygen and fish kills. This nutrient enrichment process is known as
eutrophication (McTaggart, 2002).
Most of the sites were significantly above the lowland river system guideline value of 0.04mg/L on one
or more occasions, with the exception of Yal Yal Brook (EBN5), Rocky Gully (EBN6), Wandena north
(EBN7), Muchea East (EBN10), Ki-it Brook (EBN22), Wandena Road (EBN27), and Roxburgh Ave
(EBN29), (Figure 16).
Muchea North (EBN11) recorded the highest concentrations of SRP with values over one hundred and
seven times greater than the guideline. SRP concentrations have been recorded up to one hundred and
thirty two times greater than the ANZECC guideline in 2009 sampling program and one hundred and
seven times greater in 2010. Even considering that the guideline value may be unrealistic for the Ellen
Brook, the magnitude of the concentration at this site compared to others is alarming and requires
further monitoring.
The source of the spikes in SRP at Muchea North was most likely diffuse; the land uses at this site
involve high stocking rates of cattle grazing on flat, deep draining, sandy soils. This area is prone to
being seasonally waterlogged (palusplain), transporting significant amounts of dissolved nutrients to
the Ellen Brook. Again, most of the sites on the western side of the catchment have higher
concentrations than those to the east.

Ellen Brook Catchment Water Quality Monitoring Snapshot June – September 2014
Ellen Brockman Integrated Catchment Group 54
Figure 16: Soluble Reactive Phosphorous concentrations sampled within the Ellen Brook catchment between June and September 2014
*Note blanks represent no sample
ANZECC Guideline

Ellen Brook Catchment Water Quality Monitoring Snapshot June – September 2014
Ellen Brockman Integrated Catchment Group 55
7.3.5. Total Filterable Phosphorous
Total Filterable Phosphorous (Figure 17) was analysed to allow the Swan River Trust to determine the
Filterable Unreactive Phosphorous, also known as Soluble Organic Phosphorous. Total Filterable
Phosphorous minus Soluble Reactive Phosphorous equals Soluble Organic Phosphorous. TFP
compared to Soluable Reactive Phosphorous (Figure 16) shows that TFP is comprised primarily of
soluble reactive phosphorous. Figures 18, 19, 20 & 21 shows each sampling occasion and highlights
the percentage of Soluble Reactive Phosphorous and soluble Organic Phosphorous as part of the Total
Filterable Phosphorous.

Ellen Brook Catchment Water Quality Monitoring Snapshot June – September 2014
Ellen Brockman Integrated Catchment Group 56
Figure 17: Total Filterable Phosphorous (TFP) concentrations sampled within the Ellen Brook catchment between June and September 2014. *Note blanks represent no sample or very low values

Ellen Brook Catchment Water Quality Monitoring Snapshot June – September 2014
Ellen Brockman Integrated Catchment Group 57
Figure 18: Composition of Total Filterable phosphorous in percentages of Soluble Organic P and SRP in June Sampling run 2014. *note that blanks represent no
sample or TFP below LOR

Ellen Brook Catchment Water Quality Monitoring Snapshot June – September 2014
Ellen Brockman Integrated Catchment Group 58
Figure 19: Composition of Total Filterable phosphorous in percentages of Soluble Organic P and SRP in July sampling run 2014. *note that blanks represent no
sample

Ellen Brook Catchment Water Quality Monitoring Snapshot June – September 2014
Ellen Brockman Integrated Catchment Group 59
Figure 20: Composition of Total Filterable phosphorous in percentages of Soluble Organic P and SRP in August sampling run 2014. *note that blanks represent
no sample or TFP below LOR

Ellen Brook Catchment Water Quality Monitoring Snapshot June – September 2014
Ellen Brockman Integrated Catchment Group 60
Figure 21: Composition of Total Filterable phosphorous in percentages of Soluble Organic P and SRP in September sampling run 2014. *note that blanks
represent no sample or TFP below LOR
Ellen Brook Catchment Water Quality Monitoring Snapshot June – September 2014
Ellen Brockman Integrated Catchment Group 61
7.4 Metals in surface water
Metals are found naturally in aquatic ecosystems. However, in excessive amounts they are toxic and
associated with pollution. They are derived from a variety of sources such as industrial waste, refuse
leachate, and corrosion of pipes and roofs (McTaggart, 2002). The most common sources of metal
contaminants in the Ellen Brook are pesticides and fertiliser application. Copper, zinc and cadmium are
often found in fertilisers. In the Ellen Brook most metals would enter via stormwater run-off or
groundwater contamination. Other metals such as aluminium and iron can also reach toxic levels when
mobilised from the soil by acidic groundwater.
Aquatic organisms have varying tolerance levels to different metals. Metals that are essential for
growth can become toxic to aquatic organisms at levels beyond their tolerance which may only be
slightly higher than normal concentrations. Metals may also accumulate in fatty tissues of animals and
in the human body, so repeated exposure to metals can cause toxic levels to build up, this is known as
“bioaccumulation” (IEA 2003).
Metals accumulate through the food chain in a process called “biomagnification” which can result in
animals at the top end of the food chain receiving a high concentration of metals even if the organisms
consumed at lower levels of the food chain have acceptable levels of metals. Tolerance levels of
aquatic organisms to metals and their ability to absorb those metals can be influenced by many factors
including their interaction with other metals, the chemical form of the metal, dissolved oxygen levels,
salinity levels, temperature and hardness of the water.
Samples were taken at eight strategically identified sites and analysed for metals. The sites included
Sawpit Gully (EBN29), Upper Yal Yal (EBN28) – an acidic dam, Warren Road (EBN17 – Ellen Brook
main stem), Muchea East (EBN10), Wandena South (EBN8), Wandena North (EBN7) Chandala South
(EBN3) and Peters Rd (EBN23) on all four sampling occasions.

Ellen Brook Catchment Water Quality Monitoring Snapshot June – September 2014
Ellen Brockman Integrated Catchment Group 62
Metal concentrations in the waters of the Ellen Brook catchment were generally high based on the
ANZECC water quality trigger values for freshwater ecosystems. However, concentrations for
cadmium, nickel, and zinc were below the hardness-modified trigger values (HMTV) (Table 6),
Chromium and Copper was above the HMTV value at one or more sites (Figure 26). Lead was above
the limit of reporting but below the relative HMTV value at one or more sites (Figure 29). Arsenic was
above the limit of reporting but below the relative ANZECC trigger value at one or more sites (Figure
24). Aluminium (Figure 23) and Iron (Figure 28) were well above the ANZECC trigger values for
freshwater ecosystems at one or more sites.

Ellen Brook Catchment Water Quality Monitoring Snapshot June – September 2014
Ellen Brockman Integrated Catchment Group 63
7.4.1 Metals at Upper Yal Yal (EBN28)
Upper Yal Yal (EBN28) is an unregistered contaminated site in the Ellen Brook catchment (Figure 5).
This site was included in the Ellen Brook Water Quality Monitoring Program to provide some baseline
data for remediation works undertaken by the Ellen Brockman Integrated Catchment Group in
cooperation with the Department of Agriculture and Food (Albany Office) and the ARWA Centre for
Eco-hydrology UWA.
This site has not been sampled for pH since 2009 due to the possibility of damaging equipment.
However, it has been tested in the past and recorded pH levels of less than 3. Furthermore, total water
hardness at this site was recorded as extremely hard (Figure 18). Increased mobilisation of metals as a
result of low pH levels could be the cause of elevated concentrations recorded. Results show that
metals at this site exceeded the ANZECC water quality trigger values on more than one sampling
occasion. The ANZECC water quality trigger values for cadmium, chromium, copper, lead, nickel and
zinc were modified to take into account the effect of water hardness on metal toxicity (Figure 22). As a
result copper exceeded the hardness-modified trigger values (HMTV) on more than one sampling
occasion.
EBN28 is a dam which is located on private property and fenced off from stock. There are major acid-
saline scalds situated in the adjacent paddock. The sampling point is situated down slope from a clay
extraction operation and surrounded by agricultural enterprises. Natural occurrences, farming practices,
major earthworks and altered hydrology could be the cause of elevated heavy metal concentrations
recorded at this site. The water table was cut at a point above the dam allowing groundwater to flow
into the retention dam. This groundwater flows through ancient marine deposits resulting in increased
acidity. Furthermore, cadmium, copper and zinc are often found in fertilizer which would have been
applied to the paddocks higher in the sub catchment.
Results show cause for concern to the immediate landholder and those who have access to this water
source in this sub catchment. It is also of concern that this water could potentially contaminate the Yal
Yal Brook (EBN5) which is one of two remaining freshwater perennial streams in the Ellen Brook
catchment. To date monitoring of the Yalyal has not produced any evidence that the Upper Yalyal site
is having any effect on the catchment however ground water movement is extremely slow so there is
still risk of contamination in the future.

Ellen Brook Catchment Water Quality Monitoring Snapshot June – September 2014
Ellen Brockman Integrated Catchment Group 64
7.4.2. Surface Water Hardness
Water described as ‘hard’ is high in dissolved minerals. Hard water is not a health risk, but a nuisance
because of mineral build up on plumbing fixtures, and causes poor soap and detergent performance
(DOW, 2006). Total hardness, expressed as calcium carbonate (CaC03), is the combined concentration
of earth-alkali metals, predominantly magnesium (Mg2+) and calcium (Ca2+), and some strontium
(Sr2+). The source of this hardness is limestone dissolved by water that is rich in carbon dioxide.
Hardness levels range from <60mg/L (soft) to >400 mg/L (extremely hard).
Water hardness can have an effect on the acceptable trigger values for particular metal concentrations
(cadmium, copper, zinc, lead, nickel and chromium). Water samples with higher water hardness need
to have the trigger values for these metals adjusted by hardness-dependent algorithm or the
approximate factors applied to soft water trigger values of varying water hardness provided in
ANZECC and ARMCANZ (2000), (Appendix E).
Four sites sampled recorded ‘Extremely High’ water hardness concentrations on most sampling
occasions which ranged between 330mg/L at Peters Rd (EBN23) and 1500mg/L at Upper yalyal
(EBN28) over the four month sampling period (Figure 22). Three sites sampled Very Hard which
ranged between 140mg/L at Chandala South (EBN4) and 200mg/L at Sawpit Gully(EBN25).
Water hardness at six sites remained relatively the same as those recorded in 2013 in regard to the
hardness category. Hardness Values were highly variable in 2014 sampling occasions. Refer to Table 6
for the calculated hardness-modified trigger values (HMTV) for cadmium, copper, chromium, lead,
nickel and zinc.

Ellen Brook Catchment Water Quality Monitoring Snapshot June – September 2014
Ellen Brockman Integrated Catchment Group 65
Figure 22: Water hardness of surface water within the Ellen Brook Catchment at sites sampled for
metal contamination, between June and September 2014.*Blanks represent no sample
Table 6: Hardness-Modified Trigger Values (HMTV) for Cadmium, Copper, Chromium, Lead, Nickel
and Zinc based on Figure 22 and Appendix E calculations.
Metal ANZECC Trigger
Value
HMTV for extremely
hard water (250 -
>400mg/L)
HMTV for very hard
water (180 – 240).
Cadmium 0.0002 0.002 0.0011
Copper 0.0014 0.0126 0.0072
Chromium 0.001 0.0084 0.005
Nickel 0.011 0.099 0.057
Lead 0.0034 0.09 0.04
Zinc 0.008 0.07 0.04
Extremely Hard
Very Hard
Hard Moderate

Ellen Brook Catchment Water Quality Monitoring Snapshot June – September 2014
Ellen Brockman Integrated Catchment Group 66
7.4.2 Aluminium
All sites tested consistently exceeded the 0.055mg/L ANZECC water quality guideline for freshwater
ecosystems (Figure 23). Upper Yal Yal (EBN21) and Wandena South (EBN8) recorded the highest
aluminium concentrations. It is interesting to note that pH levels at Muchea East (EBN10) were very
similar to those at Wandena North (EBN7) yet the aluminium concentrations at Muchea East were
significantly higher(Figure 8). Wandena North (EBN7), Wandena South (EBN8) and Muchea East
(EBN10) are situated below old clay pits and consistently record low pH levels between 3 and 6.5. This
is potentially due to run off from old clay extraction pits up stream of the tributary where altered
hydrology has resulted in ferrolysis (acid sulphate soil created by the alternating oxidation and
reduction of iron/clays), which has subsequently increased the mobility of aluminium in the soil and
enabled it to be transported downstream. The other contributing factor could be that these streams are
partly groundwater fed. This groundwater flows through ancient marine deposits resulting in increased
acidity which mobilizes the metals within the soil.
Concentrations reached as high as 10mg/L on the June sampling occasion at Upper Yalyal (EBN28).
This is Lower than the 2013 sampling for that site however the decrease in Aluminium could be
attributed to the increased winter rainfall received in 2014. It is of concern that all the sites recorded
levels above the guideline however levels are not so high that they would be detrimental to the
livestock or fauna using the water for drinking. What this also means is that the Ellen Brook is a
contributor of aluminium to the Swan River (Figure 5).

Ellen Brook Catchment Water Quality Monitoring Snapshot June – September 2014
Ellen Brockman Integrated Catchment Group 67
Figure 23: Aluminium concentrations in surface water within the Ellen Brook catchment between June
and September 2014. *please note blanks represent no sample
ANZECC Guideline

Ellen Brook Catchment Water Quality Monitoring Snapshot June – September 2014
Ellen Brockman Integrated Catchment Group 68
7.4.3 Arsenic
All tested sites were recorded with concentration levels of arsenic below the ANZECC water quality
trigger value for freshwater ecosystems of 0.024mg/L (Figure 24). However Peters Rd (EBN23)
recorded Arsenic concentrations of 0.009mg/L on the July sampling run. In 2013 Wandena North
recorded concentrations above the guidelines, this was not the case in 2014. This would more than
likely indicate that the arsenic concentrations that did present in the 2013 snapshot were from the flood
event and not a permanent decline in water quality.
Arsenic is found in pesticides, insecticides, herbicides, fertilisers and various alloys, and occurs
naturally in the environment. The recorded concentrations could be a result of excess fertilisers and
chemicals transported to the waterways via surface water run-off and subsurface flow.
Figure 24: Arsenic concentrations in surface water within the Ellen Brook catchment between June
and September 2014. *please note blanks represent no sample
Limit of Reporting

Ellen Brook Catchment Water Quality Monitoring Snapshot June – September 2014
Ellen Brockman Integrated Catchment Group 69
7.4.4 Cadmium
All sites recorded cadmium levels below the Hardness Modified Trigger Values (HMTV) of
0.002mg/L in very hard water, 0.0011 in extremely hard water.(Figure 21) Sawpit Gully (EBN25),
Chandala South (EBN4) and Warren Rd (EBN17) were well below the HMTV for very hard water
(180-240mg/L) and the remaining sites were well below their HMTV for extremely hard water
(>400mg/L). Upper Yal Yal (EBN28) was the only site with cadmium levels above the limit of
reporting. All other sites are below the limit of reporting on all occasions.
Figure 25: Cadmium concentrations in surface water within the Ellen Brook catchment between June
and September 2014. *please note that blanks represent no sample
Limit of Reporting

Ellen Brook Catchment Water Quality Monitoring Snapshot June – September 2014
Ellen Brockman Integrated Catchment Group 70
7.4.5 Chromium
Most tested sites were well below the hardness-modified trigger values. Sawpit Gully (EBN25),
Chandala South (EBN4) and Warren Road (EBN17) were listed as very hard (Figure 17) and were
below their HMTV of 0.005mg/L. Wandena South (EBN8), Muchea East (EBN10) and Upper Yal Yal
(EBN28) were listed as extremely hard (Figure 17) and were below their HMTV of 0.0084mg/L,
(Figure 26).
Chromium is used in dyes and paints, and is also a naturally occurring and essential trace element in
soil (Wikipedia, 2007).
Figure 26: Chromium concentrations in surface water within the Ellen Brook catchment between June
and September 2014. *Note blanks represent no sample.
ANZECC HMTV

Ellen Brook Catchment Water Quality Monitoring Snapshot June – September 2014
Ellen Brockman Integrated Catchment Group 71
7.4.6 Copper
Most sites were well below the hardness-modified trigger value (HMTV) of 0.0126mg/L for extremely
hard water and 0.0072mg/L for very hard water.(Figure 27). The only site that recorded about the
HMTV was upper yalyal on the September sampling occaision
Six of the sites were above the recommended ANZECC trigger value of 0.0014mg/L. Sawpit Gully
(EBN25) Warren Rd (EBN17), Upper Yal Yal (EBN28) Wandena North (EBN7) Peters Rd (EBN23)
and Chandala South (EBN4) exceeded the ANZECC trigger value on one or more sampling occasions.
The sites are well below the ANZECC values for livestock watering, being 0.5 mg/L for sheep, 5 mg/L
for pigs and poultry and 1mg/L for cattle. (ANZECC and ARMCANZ, 2000)
Copper is used in building material, electrical and heat conductors, and in household products. It is also
an essential trace element; however in sufficient amounts it can be toxic. The proximity of these sites to
the tip site, old clay extraction pits, Pearce RAAF Base, and urban development, accompanied by low
pH levels and extremely/very hard water could have increased the mobilisation of the metal through the
soil and resulted in increased concentrations in the waterways.
Figure 27: Copper concentrations in surface water within the Ellen Brook catchment between June and
September 2014.*note that blanks represent no sample.
ANZECC HMTV
ANZECC trigger

Ellen Brook Catchment Water Quality Monitoring Snapshot June – September 2014
Ellen Brockman Integrated Catchment Group 72
7.4.7 Iron
All sites consistently exceeded the ANZECC guideline trigger value of 0.3mg/L (Figure 28). There is
limited data on the effects of high iron levels for stock drinking purposes; however these sites were
above the agricultural watering guideline of 1mg/L on all occasions (ANZECC and ARMCANZ,
2000).
Iron concentrations have been well above the guideline of 0.3mg/L on all sampling occasions since
2005. Since 2005, iron concentrations appear to have increased at each of the sites. Potential causes of
high iron concentrations in surface waters include the geology and soil type, the time of sampling and
rainfall experienced on the day of sampling, and high acidity enabling the mobilisation of metal ions
into solution. These metal ions are generally trapped in the sediments. The sites with higher
concentrations than the guideline would more likely have a slight odour and cause an iron stain after
irrigating.
Figure 28: Iron concentrations in surface water within the Ellen Brook Catchment between June and
September 2014.*please note blanks represent no sample
ANZECC trigger value
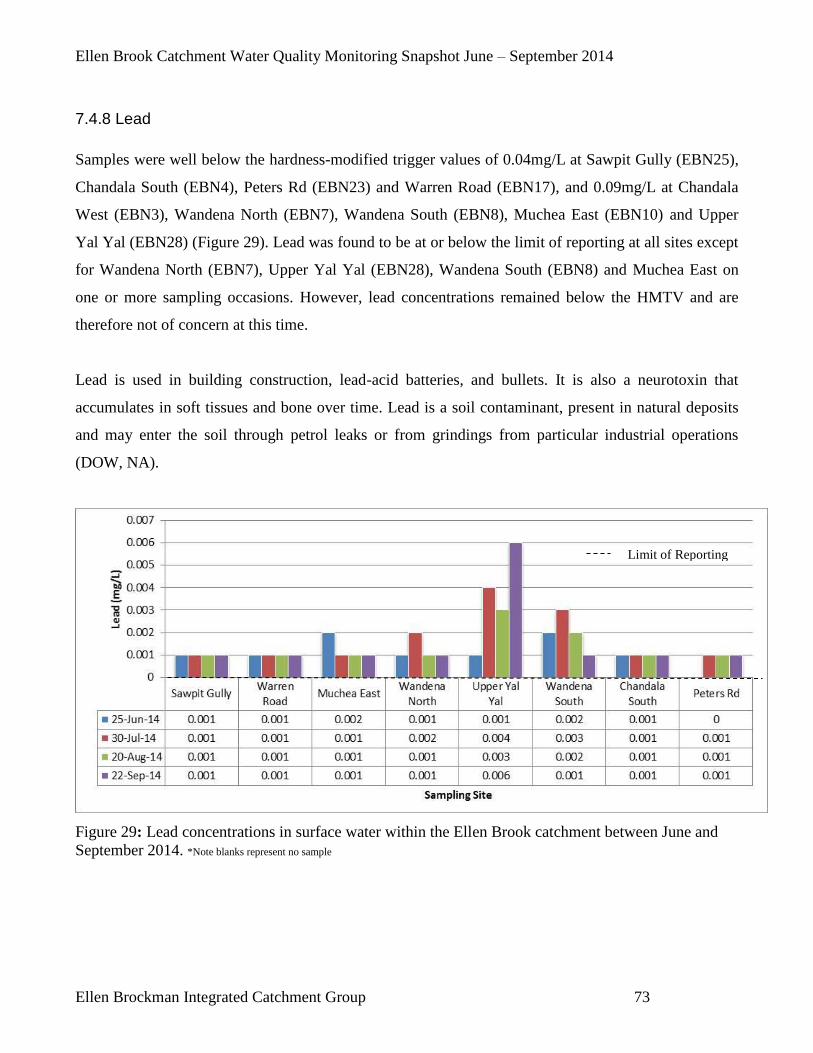
Ellen Brook Catchment Water Quality Monitoring Snapshot June – September 2014
Ellen Brockman Integrated Catchment Group 73
7.4.8 Lead
Samples were well below the hardness-modified trigger values of 0.04mg/L at Sawpit Gully (EBN25),
Chandala South (EBN4), Peters Rd (EBN23) and Warren Road (EBN17), and 0.09mg/L at Chandala
West (EBN3), Wandena North (EBN7), Wandena South (EBN8), Muchea East (EBN10) and Upper
Yal Yal (EBN28) (Figure 29). Lead was found to be at or below the limit of reporting at all sites except
for Wandena North (EBN7), Upper Yal Yal (EBN28), Wandena South (EBN8) and Muchea East on
one or more sampling occasions. However, lead concentrations remained below the HMTV and are
therefore not of concern at this time.
Lead is used in building construction, lead-acid batteries, and bullets. It is also a neurotoxin that
accumulates in soft tissues and bone over time. Lead is a soil contaminant, present in natural deposits
and may enter the soil through petrol leaks or from grindings from particular industrial operations
(DOW, NA).
Figure 29: Lead concentrations in surface water within the Ellen Brook catchment between June and
September 2014. *Note blanks represent no sample
Limit of Reporting

Ellen Brook Catchment Water Quality Monitoring Snapshot June – September 2014
Ellen Brockman Integrated Catchment Group 74
7.4.9 Nickel
All tested sites were well below the hardness-modified trigger values of 0.057mg/L at Sawpit
Gully(EBN25), Peters Rd (EBN23) Chandala South (EBN4) and Warren Road (EBN17), and
0.099mg/L at, Wandena North (EBN7), Wandena South (EBN8), Muchea East (EBN10) and Upper
Yal Yal (EBN28) (Figure 30). All sites were also well below the trigger value of 1mg/L for metals in
livestock drinking water.
Nickel is used in many industrial and consumer products, plating and glass tinting.
Figure 30: Nickel concentrations in surface water within the Ellen Brook catchment between June and
September 2014. *Note blanks represent no sample
ANZECC HMTV
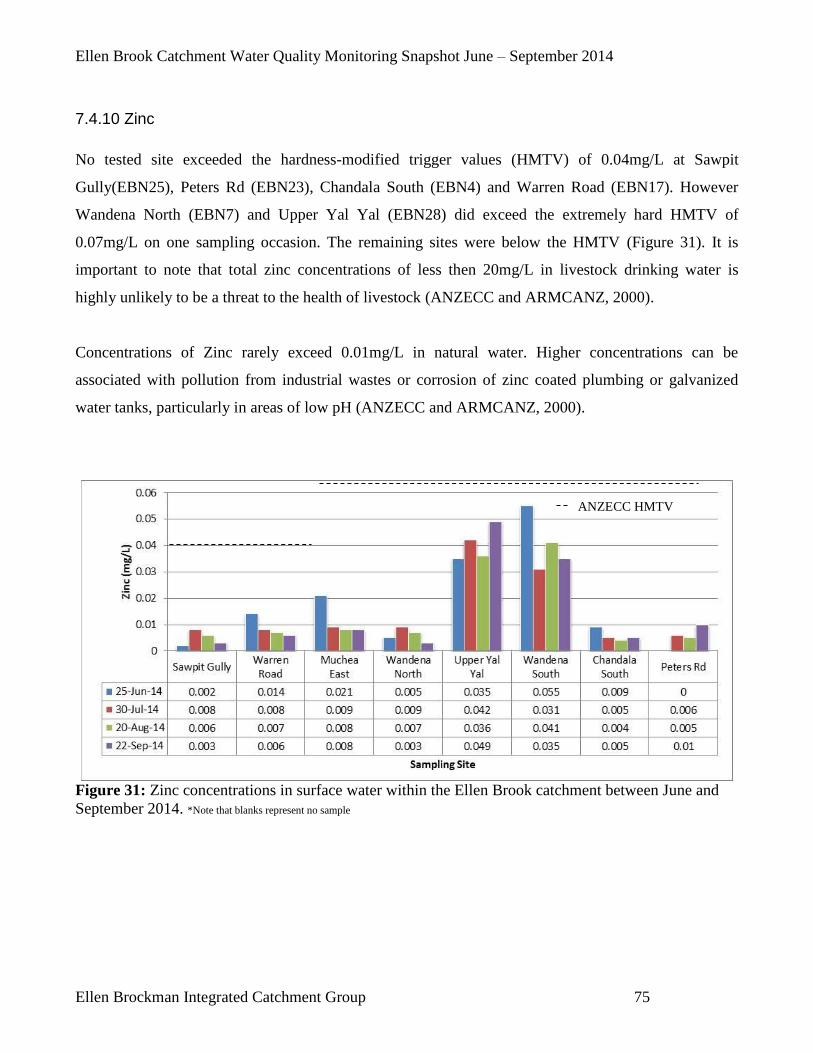
Ellen Brook Catchment Water Quality Monitoring Snapshot June – September 2014
Ellen Brockman Integrated Catchment Group 75
7.4.10 Zinc
No tested site exceeded the hardness-modified trigger values (HMTV) of 0.04mg/L at Sawpit
Gully(EBN25), Peters Rd (EBN23), Chandala South (EBN4) and Warren Road (EBN17). However
Wandena North (EBN7) and Upper Yal Yal (EBN28) did exceed the extremely hard HMTV of
0.07mg/L on one sampling occasion. The remaining sites were below the HMTV (Figure 31). It is
important to note that total zinc concentrations of less then 20mg/L in livestock drinking water is
highly unlikely to be a threat to the health of livestock (ANZECC and ARMCANZ, 2000).
Concentrations of Zinc rarely exceed 0.01mg/L in natural water. Higher concentrations can be
associated with pollution from industrial wastes or corrosion of zinc coated plumbing or galvanized
water tanks, particularly in areas of low pH (ANZECC and ARMCANZ, 2000).
Figure 31: Zinc concentrations in surface water within the Ellen Brook catchment between June and
September 2014. *Note that blanks represent no sample
ANZECC HMTV

Ellen Brook Catchment Water Quality Monitoring Snapshot June – September 2014
Ellen Brockman Integrated Catchment Group 76
8. Comparison with previous results
The Ellen Brook catchment water quality monitoring program has been undertaken on an annual basis
for ten years, with four or five sampling runs conducted each year, commencing in 2005. Enough data
has been collated across the catchment to provide some indication of water quality and emerging
trends. It is imperative that this monitoring program be continued to add to the data collected to date
and identify emerging trends more clearly.
The sampling results are dependent upon the ‘flushing’ of the system and therefore, the amount of
rainfall during that season. Nutrient concentrations in the Ellen Brook originate from sediments on the
river bed and tributaries that result from erosion and surface runoff from the eastern part of the
catchment, and nutrients carried in suspension through surface runoff and sub-surface flow from the
western sub catchments. Therefore, nutrient concentrations represent the amount transported into the
Ellen Brook via sedimentation and surface water runoff.
Nutrient concentrations entering the Ellen Brook will vary each sampling year. Additionally, a
consequence of snapshot sampling is that it only produces data for four to five individual sampling
occasions within the three to four month sampling period, over the ten years (2005, 2006, 2007, 2008,
2009, 2010, 2011, 2012, 2013 & 2014). It does not take into account daily fluxes or extremes.
Therefore, it is imperative that annual monitoring continues in order to determine the significance of
change in concentrations and emerging trends.

Ellen Brook Catchment Water Quality Monitoring Snapshot June – September 2014
Ellen Brockman Integrated Catchment Group 77
8.1 pH
Throughout the duration of the 2005-2014 sampling program, pH generally remained within the
ANZECC water quality guidelines for freshwater ecosystems between 6.5 and 8 at the majority of sites
(Appendix I). However, there are some exceptions.
Subcatchments to the east of the Ellen Brook have been identified as contributors of metals with low
pH values. Wandena North, Wandena South and Muchea East sampling sites are located downstream
of old, current and proposed clay extraction pits which we infer to have resulted in the exposure of acid
clay soils. Parsons Brinckerhoff (2006) found that the overlying gravely sands are slightly acidic with
pH values ranging between 5 and 6. pH was found to decrease with increasing depth to the clay
horizon. At a depth of 2m pH values were recorded around 5. At a depth of 10m pH was recorded as
low as 3.63, therefore, these soils are naturally acidic. Disturbance and excavation works carried out at
these sites has altered the groundwater table and potentially the severity of the acid soils contribution to
acidic water (refer to 7.2 for more details).
Wandena North has recorded pH values between 3.17 and 8.24. Wandena South recorded pH values
between 3.85 and 7.16. Muchea East recorded pH values between 3.15 and 6.95. It is interesting to note
that in 2005 at Muchea East pH values were all above 6.3; however 2006 to 2014 averages being
considerable lower. In 2014 the average pH was 4.29 which is relatively consistant with the years since
2005. There has definitely been a been a drastic fall in pH at Muchea East. The following graph has
been included to illustrate the average pH trends from 2005 through to 2014 for each site(Figure 32). It
is evident that the majority of sites have remained within the guideline. The few sites that have acidity
issues are quite different from the other sites.

Ellen Brook Catchment Water Quality Monitoring Snapshot June – September 2014
Ellen Brockman Integrated Catchment Group 78
Figure 32: Average pH levels in surface water within the Ellen Brook catchment between 2005 and 2013.
Normal pH range

Ellen Brook Catchment Water Quality Monitoring Snapshot June – September 2014
Ellen Brockman Integrated Catchment Group 79
8.2 Conductivity
Throughout the duration of the 2005-2014 sampling program, conductivity (EC) remained above the
ANZECC water quality guidelines for freshwater ecosystems of 0.12-0.3mS/cm at most sites
(Appendix I). Table 8 depicts the subcatchments sampled in the Ellen Brook catchment as fresh,
marginal, brackish or saline based on the seven years of monitoring data.

Ellen Brook Catchment Water Quality Monitoring Snapshot June – September 2014
Ellen Brockman Integrated Catchment Group 80
Table 7: Sub catchment salinity measure based on the average of years of consistent data (2005-2014).
Please note that italicised salinity measurements represent 2-5years of sampling data ONLY.
Sampling Site Salinity Measurement
EBN1 Lennard Brook Fresh to marginal
EBN2 Airfield Road Fresh
EBN3 Chandala West Marginal
EBN4 Chandala South Marginal
EBN5 Yal Yal Brook Fresh to Marginal
EBN6 Rocky Creek Marginal to Brackish
EBN7 Wandena North Brackish
EBN8 Wandena South Brackish
EBN9 Brand Highway Marginal to Brackish
EBN10 Muchea East Brackish
EBN11 Muchea North Fresh to Marginal
EBN12 Muchea South Fresh to Marginal
EBN13 Rutland Road Marginal
EBN14 Nutrient Inflow (Bingham) Fresh
EBN15a Nutrient Outflow (Bingham) Fresh
EBN16 Bulls Brook Fresh
EBN17 Warren Road Marginal
EBN18 Gauging Station Marginal
EBN19 Belhus Reserve Marginal
EBN20 All Saints Marginal
EBN21 Lower Yal Yal Marginal
EBN22 Ki-it Brook Marginal to Fresh
EBN23 Peters Road Marginal
EBN24 Stock Road Fresh
EBN25 Sawpit Gully Fresh to Marginal
EBN26 Egerton Fresh
EBN27 Wandena Road Marginal to Brackish
EBN28 Upper Yal Yal NA
EBN29 Roxburgh Ave Marginal

Ellen Brook Catchment Water Quality Monitoring Snapshot June – September 2014
Ellen Brockman Integrated Catchment Group 81
8.3 Total Nitrogen
Throughout the duration of the 2005-2014 sampling program, total nitrogen (TN) remained above the
ANZECC water quality guidelines for freshwater ecosystems of 1.2mg/L at the majority of sites
(Appendix I). Most sites across the catchment contribute a relatively significant amount of total
nitrogen to the Ellen Brook; however Chandala West (EBN3), Muchea North (EBN11), Lower Yal Yal
(EBN21), Bulls Brook (EBN16) Warren Rd (EBN17) and Lennard Brook (EBN1) were identified as
high contributors with TN concentrations reaching as high as 9.2mg/L at Muchea North.
A number of sites recorded TN concentrations below the ANZECC guideline for the majority of
sampling occasions over the ten years of sampling and included Muchea East (EBN10), Ki-it Brook
(EBN21), and Wandena Road (EBN27). It is also worth mentioning that Wandena North (EBN7) has
recorded TN Concentrations below the ANZECC Guideline on six of the eight sampling years, of
which includes the 2012 samples.

Ellen Brook Catchment Water Quality Monitoring Snapshot June – September 2014
Ellen Brockman Integrated Catchment Group 82
8.4 Total Phosphorous
Throughout the duration of the 2005-2014 sampling program, total phosphorous (TP) remained above
the ANZECC water quality guidelines for freshwater ecosystems of 0.065mg/L at the majority of sites
(Appendix I). Muchea North (EBN11) and Muchea South (EBN12) (no longer sampled) were
identified as relatively significant contributors of total phosphorous to the Ellen Brook with
concentrations ranging between 1.2 and 7.1mg/L, which is over one hundred times greater than the
guideline value.
A number of sites recorded TP concentrations below the ANZECC guideline for the majority of
sampling occasions over the nine years of sampling and included Yal Yal Brook (EBN5), Rocky Gully
(EBN6), Wandena North (EBN7), Wandena South (EBN8), Muchea East (EBN10), Ki-it Brook
(EBN21), Wandena Road (EBN27) Egerton (EBN26) and Roxburgh Ave (EBN29).
TP in the Ellen Brook catchment is composed primarily of the soluble forms of phosphorous which are
bioavailable. This ‘dissolved’ fraction (SRP) measures the immediately available phosphate in the
system at the time of sampling. It is the dissolved (soluble) forms of phosphorous which are readily
available for biological uptake, which is more likely to stimulate algal blooms.

Ellen Brook Catchment Water Quality Monitoring Snapshot June – September 2014
Ellen Brockman Integrated Catchment Group 83
9. Recommendations
Continue the sampling and analysis monitoring program within the Ellen Brook catchment.
Nutrient reduction strategies need to be continued in the catchment. Management actions for
nutrient reduction may include the following;
o Construction of nutrient stripping wetlands
o Construction of nutrient intervention structures
o Promotion of the use of fertiliser alternatives
o Promotion of fertiliser wise in the Vines estate
o Best management practice for fertiliser application through soil and leaf testing
o Best Management practices for deep rooted pasture establishment
o Revegetation and the fencing off of riparian zones along the Ellen Brook and major
tributaries to prevent stock access
o Revegetation and rehabilitation of remnant vegetation
Continue to evaluate the effectiveness of the Bingham road subcatchment, Brand Highway and
Muchea North Drain since the addition of new nutrient intervention technologies by the Swan
River Trust in 2009/2010 under the Drainage Nutrient Intervention Program (DNIP).
Identify areas of future rehabilitation, revegetation and waterway protection based on the results
of the sampling program.
Develop Ellen Brook priority sub catchment scale reports to determine emerging trends in water
quality over the time of sampling (2005 – 2014). These progress reports could be complemented
with an assessment of land use, existing and recommended landcare works in the area.

Ellen Brook Catchment Water Quality Monitoring Snapshot June – September 2014
Ellen Brockman Integrated Catchment Group 84
10. References
ANZECC and ARMCANZ (2000). National Water Quality Management Strategy: Australia and New
Zealand water quality guidelines for freshwater and marine. Australian and New Zealand
Conservation Council, Agriculture and Resource Management Council of Australia and New Zealand.
Bureau of metorology (2012) Climate statistics for Australian Locations, Pearce RAAF, Western
Australia. http://www.bom.gov.au/climate/averages/tables/cw_009053_All.shtml
Banfield, K. (2001). Sustainable Land Management in the Ellen Brook catchment. Department of
Agriculture.
Connell, S (2003). Ellen Brook catchment Vegetation Survey unpublished
CSIRO (1994). Managing nutrient discharge from the Ellen Brook Catchment, Western Australia –
Discussion Paper CSIRO Division of Water Resources, Western Australia.
Deeley DM, Donohue R & Parsons G (1993). Nutrient loads in surface drainage from Ellen Brook
from 1987-1992 – Swan River Trust Report No. 13. Swan River Trust, Perth.
Department of Water. (2006). Water Resources Data – Bureau of Meteorology Rainfall Sites;
HYSITREP – Site Report 009018 – Gingin –Gingin, 009029 – Muchea Tree Farm, 009053 Pearce
RAAF Base. Retrieved on the 28th January 2011 from
portal.water.wa.gov.au/portal/page/portal/WaterManagement/MonitoringAndData/WaterLevelMonitori
ng
Department of Water. (2006a). Water Resources Data – Streamflow Sites; HYSITREP – Site Report
616189 – Ellen Brook Railway Parade. Retrieved on the 10th January 2007 from
portal.water.wa.gov.au/portal/page/portal/WaterManagement/MonitoringAndData/WaterLevelMonitori
ng
Department of Water. (NA). Swan Region Water Quality Monitoring and Evaluation: Background
information for measured parameters. Retrieved on the 22nd February 2011 from
www.water.wa.gov.au/idelve/srwqm/measured.htm
Donohue, R (1994) Phosphorus and Nitrogen in Ellen Brook 1987-1993 Swan River Trust, Perth WA.
Ellen Brockman Integrated Catchment Group (EBICG). (2006). Sampling and Analysis Plan.
Unpublished report.
Environmental Protection Authority (2002). Revised Environmental Quality Criteria Reference
Document (Cockburn Sound) – a supporting document to the draft Environmental Protection
(Cockburn Sound) Policy 2002.

Ellen Brook Catchment Water Quality Monitoring Snapshot June – September 2014
Ellen Brockman Integrated Catchment Group 85
Environmental Protection Authority (2002). Revised Draft Environmental Protection (Cockburn
Sound) Policy 2002 – report to the minister for the environment as required under section 28 of the
Environmental Protection Act, 1986.
Gerritse, R (1996). Leaching of nutrients and pesticides from the Scott River Catchment: A critical
overview of existing data and a comparison with the Harvey River, Ellen Brook and Gingin Brook
Catchments. CSIRO Division of Water Resources Report No. 96-37
Horwood W, Swan River Trust (SRT) (1997). A Walk Through the Ellen Brook Catchment. Swan
River Trust, Perth WA.
http://hermes.erin.gov.au/pls/crg_public/!CRGPPUBLIC.PSTART?strAction=SearchByChemical 2006
National Chemical Reference Guide internet site March 2006
IEA (Institute of Engineers Australia) (2003). Australian Runoff Quality Guidelines (Draft). Institute
of Engineers Australia, Australia.
Kellogg, Brown & Root Pty Ltd (2003). Water Study for the Shire of Chittering Perth, Western
Australia.
McTaggart A, 2002. A Community Guideline to Surface Water Quality Investigations – Version 1.0.
Water and Rivers Commission Aquatic Science Branch.
Micenko, A, 2005. Sourcing contributing areas to river flow in Ellen Brook, Western Australia, using
environmental indicators and mixing models. Centre for water research: University of Western
Australia
NHMRC & ARMCANZ (1996). Australian Drinking Water Quality Guidelines. National Health and
Medical Research Council and Agriculture and Resource Management Council of Australia and New
Zealand.
Parsons Brinckerhoff. (2006). Acid Sulphate Soil Investigation and Management Plan: Lot 6 Wandena
Road, Muchea WA. Midland Brick Company, Perth WA.
PPK Environment and Infrastructure (Australia) Pty Ltd. (2001). Draft Ellen Brook Catchment
Management Plan. Acacia Springs Environmental, Australia.
Russell, J. (2001). Contribution of the particulate fraction to the phosphorous load exported from the
Ellen Brook Catchment. Unpublished bachelor dissertation, University of Western Australia.
Schoknecht, N. (2004). Acidity in the environment of South Western Australia. Department of
Agriculture, Western Australia.
Smith , RA & Shams R (WRC) (2002). Hydrogeological Information for management planning in the
Ellen Brook Catchment. Water & Rivers Commission, Perth WA.
Sharma, ML & Craig, AB (1988). Comparative recharge rates beneath Banksia woodland and two
pine plantations on the Gnangara Mound Western Australia. Balkema Publishing, Boston.

Ellen Brook Catchment Water Quality Monitoring Snapshot June – September 2014
Ellen Brockman Integrated Catchment Group 86
SRT (Swan River Trust) (1999). Swan Canning Cleanup Program Action Plan: An Action Plan to
Clean up the Swan-Canning Rivers and Estuary. Swan River Trust. Perth, WA.
Swan River Trust (2009). Local Water Quality Improvement Plan: Ellen Brook. Swan River Trust.
Perth, WA.
Van Looij, E. (2007). Developing Salt Load Targets for Ellen Brook, Wooroloo Brook and the
Brockman River. Department of Water, Perth WA.
Waters and Rivers Commission (2000) Wilson Inlet report to the community. Summary of the Wilson
Inlet catchment monitoring program. Waters and Rivers Commission and Wilson Inlet Management
Authority, WA.
Water and Rivers Commission (WRC) (2002). Hydrogeological Information for management planning
in the Ellen Brook catchment. Water & Rivers Commission, Perth WA.
Wikipedia. (2007). Copper, Chromium, Cadmium, Iron, Lead, Arsenic, Nickel. Retrieved on the 7th
February 2008 from www.wikipedia.org

Appendix A – Water Quality Results (raw)
Physical Parameters
Site Ref No.
Site Name
Date Collected pH Conductivity Temperature
Total Suspended
Solids
ANZECC 6.5-8 (mS/cm) 7mg/L
EBN19 Belhus 25-Jun-14 7.21 1.19 10.6 2
30-Jul-14 7.35 1.3 14.8 2
20-Aug-14 7.42 1.425 15.7 8
22-Sep-14 7.51 1.41 16.3 4
EBN26 Egerton 25-Jun-14 7.67 0.639 12.2 3
30-Jul-14 7.69 0.614 15.4 2
20-Aug-14 7.78 0.597 16.1 8
22-Sep-14 7.88 0.532 16.4 10
EBN25 Sawpit Gully 25-Jun-14 7.09 0.932 11.8 4
30-Jul-14 7.1 0.877 15.1 8
20-Aug-14 7.13 0.778 15.6 13
22-Sep-14 7.32 0.944 14.4 13
EBN29 Roxburgh
Ave 25-Jun-14 7.68 1.186 12.7 2
30-Jul-14 7.84 1.132 15.8 2
20-Aug-14 8.01 1.206 16.6 6
22-Sep-14 7.92 1.097 17.6 11
EBN18 Gauging Station 25-Jun-14 7.17 1.239 11.5 7
30-Jul-14 7.2 1.222 15.3 14
20-Aug-14 7.45 1.604 16.3 9
22-Sep-14 7.55 1.438 16.2 7
EBN22 Ki-it Brook 25-Jun-14 7.25 0.665 11.3 1
30-Jul-14 7.55 0.761 15.2 1
20-Aug-14 7.55 0.805 16.4 <1
22-Sep-14 7.71 0.387 15.6 3
EBN17 Warren Road 25-Jun-14 6.53 1.233 10.6 7
30-Jul-14 7.17 1.301 15 2
20-Aug-14 7.21 1.83 16.9 8
22-Sep-14 7.41 1.244 15.4 5
EBN13 Rutland Road 25-Jun-14 7.09 1.595 12 3

Ellen Brook Catchment Water Quality Monitoring Snapshot June – September 2014
Ellen Brockman Integrated Catchment Group 88
Site Ref No.
Site Name
Date Collected pH Conductivity Temperature
Total Suspended
Solids
30-Jul-14 7.33 1.459 15.4 4
20-Aug-14 7.32 1.897 16.8 11
22-Sep-14 7.33 1.804 16.7 11
EBN27 Wandena
Road 25-Jun-14 6.44 2.447 11.3 <1
30-Jul-14 6.62 2.645 15 <1
20-Aug-14 6.71 2.72 15.9 1
22-Sep-14 7.03 2.264 15.6 1
EBN10 Muchea
East 25-Jun-14 3.98 5.286 16.3 3
30-Jul-14 4.51 4.102 17.1 8
20-Aug-14 4.35 4.454 19.2 7
22-Sep-14 5.06 3.81 21.8 14
EBN7 Wandena
North 25-Jun-14 3.91 5.954 15.1 7
30-Jul-14 4.26 5.226 16.2 8
20-Aug-14 4.4 5.484 18.9 12
22-Sep-14 4.59 5.038 20 9
EBN6 Rocky Gully 25-Jun-14 6.66 3.13 12.6 1
30-Jul-14 7.31 2.687 15.2 2
20-Aug-14 7.61 2.588 16.5 3
22-Sep-14 7.54 2.184 16.1 5
EBN21 Lower Yal
Yal 25-Jun-14 7.9 2.347 17.7 3
30-Jul-14 8.02 1.991 17.5 2
20-Aug-14 7.78 2.277 19.5 5
22-Sep-14 7.64 1.906 21.6 11
EBN5 Yal Yal 25-Jun-14 6.85 0.897 14.2 6
30-Jul-14 6.94 0.858 15.7 4
20-Aug-14 6.99 0.885 17.8 6
22-Sep-14 7.11 0.904 18.5 5
EBN28 Upper Yal
Yal 25-Jun-14 NA NA NA NA
30-Jul-14 NA NA NA NA
20-Aug-14 NA NA NA NA
22-Sep-14 NA NA NA NA
EBN8 Wandena
South 25-Jun-14 5.75 4.464 14.9 14
30-Jul-14 6.02 4.336 16.5 23
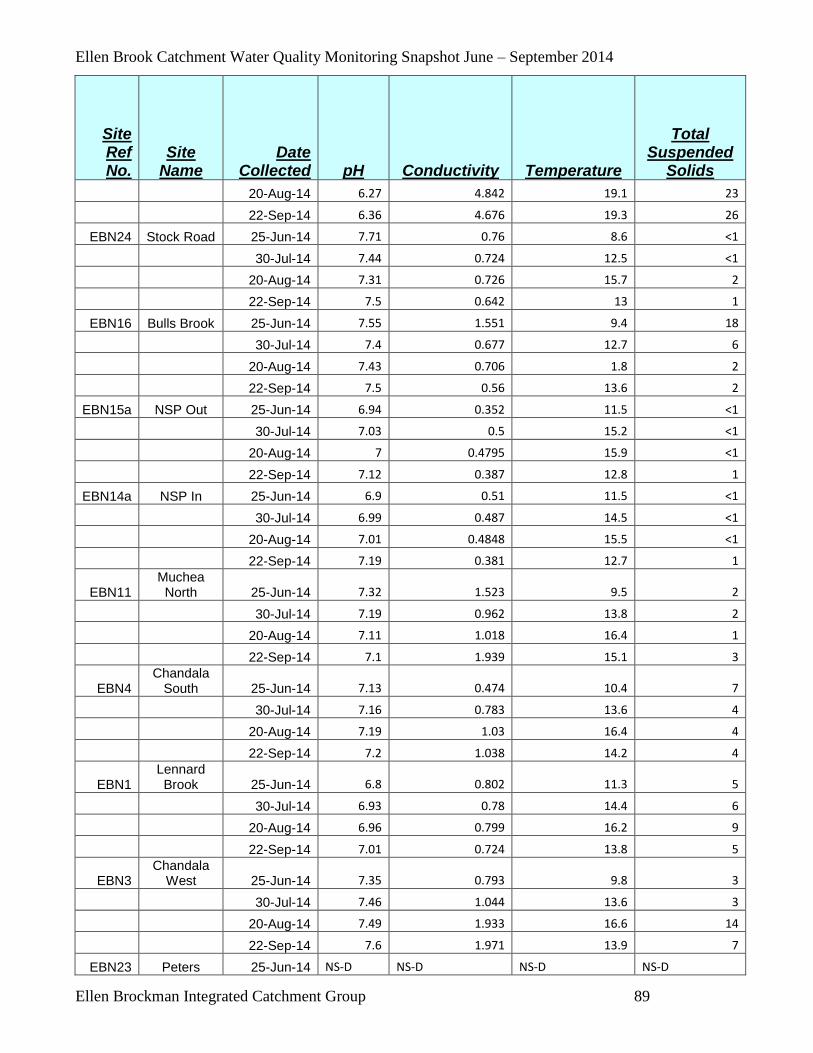
Ellen Brook Catchment Water Quality Monitoring Snapshot June – September 2014
Ellen Brockman Integrated Catchment Group 89
Site Ref No.
Site Name
Date Collected pH Conductivity Temperature
Total Suspended
Solids
20-Aug-14 6.27 4.842 19.1 23
22-Sep-14 6.36 4.676 19.3 26
EBN24 Stock Road 25-Jun-14 7.71 0.76 8.6 <1
30-Jul-14 7.44 0.724 12.5 <1
20-Aug-14 7.31 0.726 15.7 2
22-Sep-14 7.5 0.642 13 1
EBN16 Bulls Brook 25-Jun-14 7.55 1.551 9.4 18
30-Jul-14 7.4 0.677 12.7 6
20-Aug-14 7.43 0.706 1.8 2
22-Sep-14 7.5 0.56 13.6 2
EBN15a NSP Out 25-Jun-14 6.94 0.352 11.5 <1
30-Jul-14 7.03 0.5 15.2 <1
20-Aug-14 7 0.4795 15.9 <1
22-Sep-14 7.12 0.387 12.8 1
EBN14a NSP In 25-Jun-14 6.9 0.51 11.5 <1
30-Jul-14 6.99 0.487 14.5 <1
20-Aug-14 7.01 0.4848 15.5 <1
22-Sep-14 7.19 0.381 12.7 1
EBN11 Muchea North 25-Jun-14 7.32 1.523 9.5 2
30-Jul-14 7.19 0.962 13.8 2
20-Aug-14 7.11 1.018 16.4 1
22-Sep-14 7.1 1.939 15.1 3
EBN4 Chandala
South 25-Jun-14 7.13 0.474 10.4 7
30-Jul-14 7.16 0.783 13.6 4
20-Aug-14 7.19 1.03 16.4 4
22-Sep-14 7.2 1.038 14.2 4
EBN1 Lennard Brook 25-Jun-14 6.8 0.802 11.3 5
30-Jul-14 6.93 0.78 14.4 6
20-Aug-14 6.96 0.799 16.2 9
22-Sep-14 7.01 0.724 13.8 5
EBN3 Chandala
West 25-Jun-14 7.35 0.793 9.8 3
30-Jul-14 7.46 1.044 13.6 3
20-Aug-14 7.49 1.933 16.6 14
22-Sep-14 7.6 1.971 13.9 7
EBN23 Peters 25-Jun-14 NS-D NS-D NS-D NS-D

Ellen Brook Catchment Water Quality Monitoring Snapshot June – September 2014
Ellen Brockman Integrated Catchment Group 90
Site Ref No.
Site Name
Date Collected pH Conductivity Temperature
Total Suspended
Solids Road
30-Jul-14 7.5 1.942 15.3 <1
20-Aug-14 7.51 1.6 17.8 4
22-Sep-14 7.55 1.2 16.3 <1
EBN9 Brand Hwy 25-Jun-14 6.97 1.487 10.8 2
30-Jul-14 7.22 1.346 14.3 4
20-Aug-14 7.1 1.738 16.8 4
22-Sep-14 7.38 1.531 14.5 2
EBN2 Airfield Road 25-Jun-14 NS-D NS-D NS-D NS-D
30-Jul-14 7.03 0.761 13 3
20-Aug-14 7.1 0.853 16.3 3
22-Sep-14 7.38 0.885 13.3 4
NB: ‘NS’ represents ‘no sample taken at this time due to no flow’; ‘NF’ represents ‘no flow’; ‘NA’ represents ‘not
applicable’.
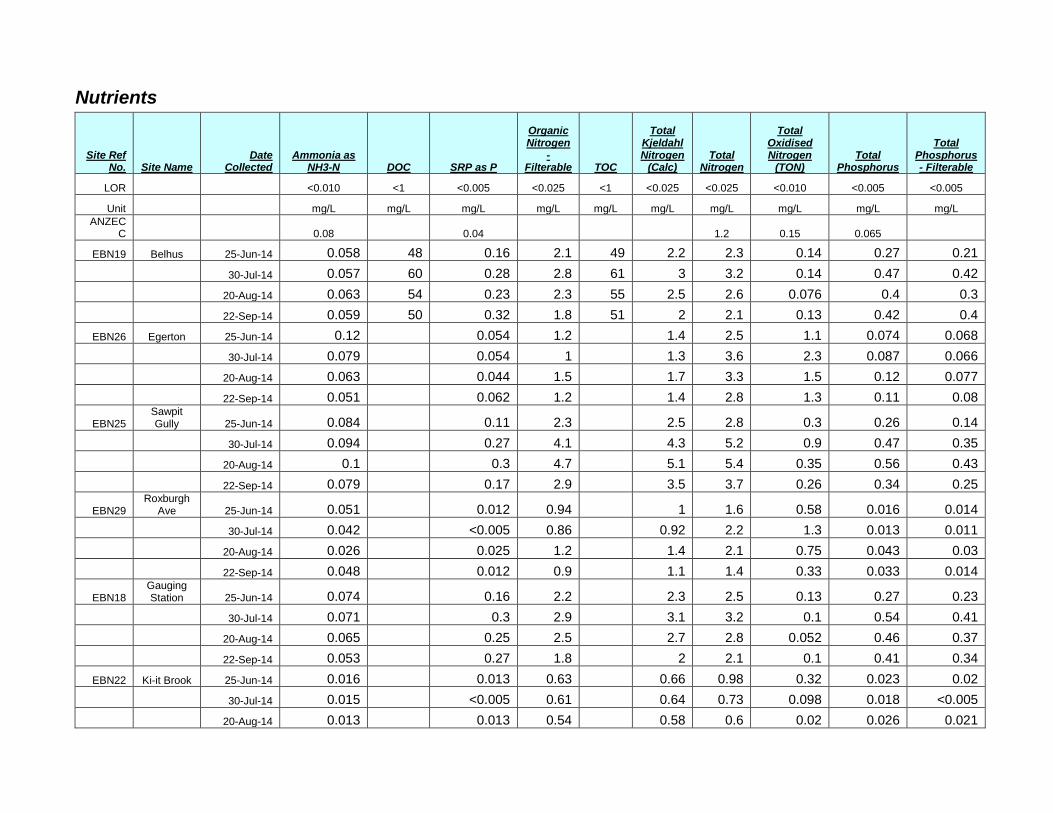
Nutrients
Site Ref No. Site Name
Date Collected
Ammonia as NH3-N DOC SRP as P
Organic Nitrogen
- Filterable TOC
Total Kjeldahl Nitrogen
(Calc) Total
Nitrogen
Total Oxidised Nitrogen
(TON) Total
Phosphorus
Total Phosphorus - Filterable
LOR <0.010 <1 <0.005 <0.025 <1 <0.025 <0.025 <0.010 <0.005 <0.005
Unit mg/L mg/L mg/L mg/L mg/L mg/L mg/L mg/L mg/L mg/L
ANZECC 0.08 0.04 1.2 0.15 0.065
EBN19 Belhus 25-Jun-14 0.058 48 0.16 2.1 49 2.2 2.3 0.14 0.27 0.21
30-Jul-14 0.057 60 0.28 2.8 61 3 3.2 0.14 0.47 0.42
20-Aug-14 0.063 54 0.23 2.3 55 2.5 2.6 0.076 0.4 0.3
22-Sep-14 0.059 50 0.32 1.8 51 2 2.1 0.13 0.42 0.4
EBN26 Egerton 25-Jun-14 0.12 0.054 1.2 1.4 2.5 1.1 0.074 0.068
30-Jul-14 0.079 0.054 1 1.3 3.6 2.3 0.087 0.066
20-Aug-14 0.063 0.044 1.5 1.7 3.3 1.5 0.12 0.077
22-Sep-14 0.051 0.062 1.2 1.4 2.8 1.3 0.11 0.08
EBN25 Sawpit Gully 25-Jun-14 0.084 0.11 2.3 2.5 2.8 0.3 0.26 0.14
30-Jul-14 0.094 0.27 4.1 4.3 5.2 0.9 0.47 0.35
20-Aug-14 0.1 0.3 4.7 5.1 5.4 0.35 0.56 0.43
22-Sep-14 0.079 0.17 2.9 3.5 3.7 0.26 0.34 0.25
EBN29 Roxburgh
Ave 25-Jun-14 0.051 0.012 0.94 1 1.6 0.58 0.016 0.014
30-Jul-14 0.042 <0.005 0.86 0.92 2.2 1.3 0.013 0.011
20-Aug-14 0.026 0.025 1.2 1.4 2.1 0.75 0.043 0.03
22-Sep-14 0.048 0.012 0.9 1.1 1.4 0.33 0.033 0.014
EBN18 Gauging Station 25-Jun-14 0.074 0.16 2.2 2.3 2.5 0.13 0.27 0.23
30-Jul-14 0.071 0.3 2.9 3.1 3.2 0.1 0.54 0.41
20-Aug-14 0.065 0.25 2.5 2.7 2.8 0.052 0.46 0.37
22-Sep-14 0.053 0.27 1.8 2 2.1 0.1 0.41 0.34
EBN22 Ki-it Brook 25-Jun-14 0.016 0.013 0.63 0.66 0.98 0.32 0.023 0.02
30-Jul-14 0.015 <0.005 0.61 0.64 0.73 0.098 0.018 <0.005
20-Aug-14 0.013 0.013 0.54 0.58 0.6 0.02 0.026 0.021
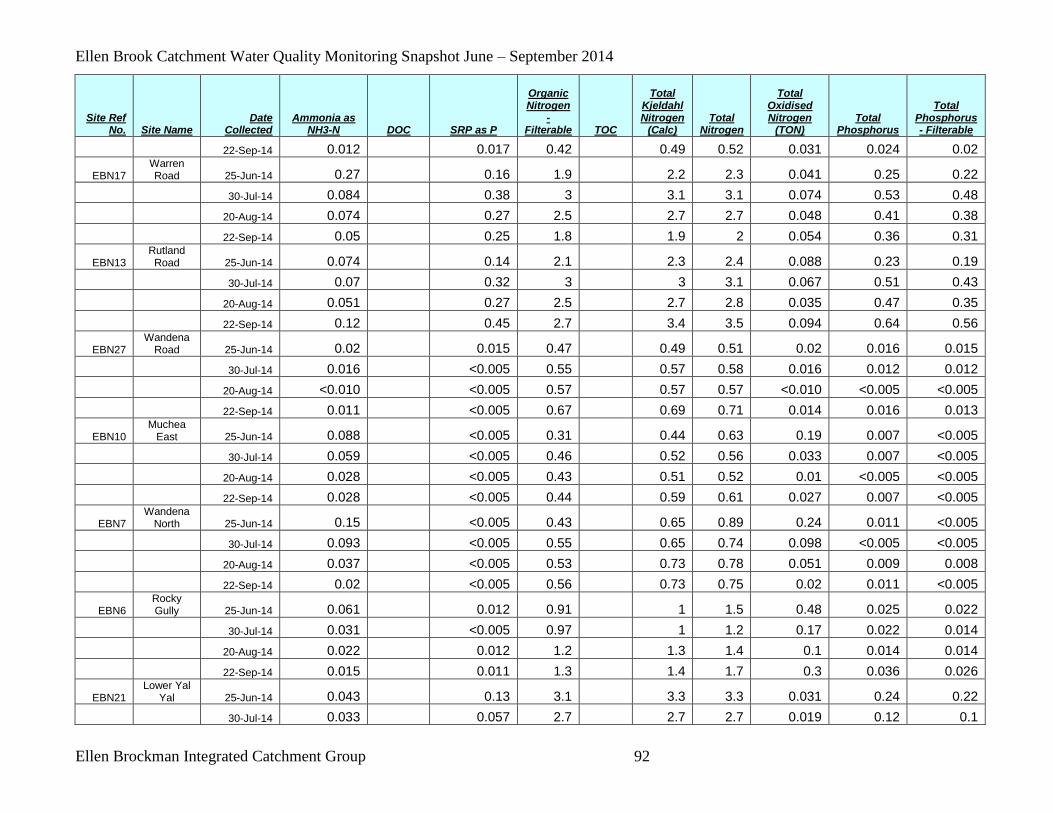
Ellen Brook Catchment Water Quality Monitoring Snapshot June – September 2014
Ellen Brockman Integrated Catchment Group 92
Site Ref No. Site Name
Date Collected
Ammonia as NH3-N DOC SRP as P
Organic Nitrogen
- Filterable TOC
Total Kjeldahl Nitrogen
(Calc) Total
Nitrogen
Total Oxidised Nitrogen
(TON) Total
Phosphorus
Total Phosphorus - Filterable
22-Sep-14 0.012 0.017 0.42 0.49 0.52 0.031 0.024 0.02
EBN17 Warren Road 25-Jun-14 0.27 0.16 1.9 2.2 2.3 0.041 0.25 0.22
30-Jul-14 0.084 0.38 3 3.1 3.1 0.074 0.53 0.48
20-Aug-14 0.074 0.27 2.5 2.7 2.7 0.048 0.41 0.38
22-Sep-14 0.05 0.25 1.8 1.9 2 0.054 0.36 0.31
EBN13 Rutland Road 25-Jun-14 0.074 0.14 2.1 2.3 2.4 0.088 0.23 0.19
30-Jul-14 0.07 0.32 3 3 3.1 0.067 0.51 0.43
20-Aug-14 0.051 0.27 2.5 2.7 2.8 0.035 0.47 0.35
22-Sep-14 0.12 0.45 2.7 3.4 3.5 0.094 0.64 0.56
EBN27 Wandena
Road 25-Jun-14 0.02 0.015 0.47 0.49 0.51 0.02 0.016 0.015
30-Jul-14 0.016 <0.005 0.55 0.57 0.58 0.016 0.012 0.012
20-Aug-14 <0.010 <0.005 0.57 0.57 0.57 <0.010 <0.005 <0.005
22-Sep-14 0.011 <0.005 0.67 0.69 0.71 0.014 0.016 0.013
EBN10 Muchea
East 25-Jun-14 0.088 <0.005 0.31 0.44 0.63 0.19 0.007 <0.005
30-Jul-14 0.059 <0.005 0.46 0.52 0.56 0.033 0.007 <0.005
20-Aug-14 0.028 <0.005 0.43 0.51 0.52 0.01 <0.005 <0.005
22-Sep-14 0.028 <0.005 0.44 0.59 0.61 0.027 0.007 <0.005
EBN7 Wandena
North 25-Jun-14 0.15 <0.005 0.43 0.65 0.89 0.24 0.011 <0.005
30-Jul-14 0.093 <0.005 0.55 0.65 0.74 0.098 <0.005 <0.005
20-Aug-14 0.037 <0.005 0.53 0.73 0.78 0.051 0.009 0.008
22-Sep-14 0.02 <0.005 0.56 0.73 0.75 0.02 0.011 <0.005
EBN6 Rocky Gully 25-Jun-14 0.061 0.012 0.91 1 1.5 0.48 0.025 0.022
30-Jul-14 0.031 <0.005 0.97 1 1.2 0.17 0.022 0.014
20-Aug-14 0.022 0.012 1.2 1.3 1.4 0.1 0.014 0.014
22-Sep-14 0.015 0.011 1.3 1.4 1.7 0.3 0.036 0.026
EBN21 Lower Yal
Yal 25-Jun-14 0.043 0.13 3.1 3.3 3.3 0.031 0.24 0.22
30-Jul-14 0.033 0.057 2.7 2.7 2.7 0.019 0.12 0.1

Ellen Brook Catchment Water Quality Monitoring Snapshot June – September 2014
Ellen Brockman Integrated Catchment Group 93
Site Ref No. Site Name
Date Collected
Ammonia as NH3-N DOC SRP as P
Organic Nitrogen
- Filterable TOC
Total Kjeldahl Nitrogen
(Calc) Total
Nitrogen
Total Oxidised Nitrogen
(TON) Total
Phosphorus
Total Phosphorus - Filterable
20-Aug-14 0.054 0.099 3 3.2 3.2 0.021 0.21 0.17
22-Sep-14 0.029 0.15 2.6 3 3 0.021 0.3 0.24
EBN5 Yal Yal 25-Jun-14 0.051 <0.005 0.35 0.51 1.6 1.1 0.027 0.02
30-Jul-14 0.056 <0.005 0.5 0.57 1.9 1.3 0.026 0.016
20-Aug-14 0.049 0.018 0.48 0.55 1.7 1.1 0.034 0.025
22-Sep-14 0.068 0.024 0.37 0.52 1.5 1 0.029 0.027
EBN28 Upper Yal
Yal 25-Jun-14
30-Jul-14
20-Aug-14
22-Sep-14
EBN8 Wandena
South 25-Jun-14 0.16 0.041 1.4 1.6 1.6 0.03 0.08 0.047
30-Jul-14 0.19 0.035 2.5 3 3 0.035 0.13 0.05
20-Aug-14 0.25 0.068 3.3 3.7 3.8 0.057 0.13 0.11
22-Sep-14 0.21 0.066 2.7 3 3.1 0.054 0.14 0.1
EBN24 Stock Road 25-Jun-14 0.045 0.11 2.4 2.5 2.5 0.014 0.19 0.18
30-Jul-14 0.058 0.24 3.5 3.6 3.6 0.018 0.4 0.36
20-Aug-14 0.069 0.31 3.9 4.2 4.2 0.033 0.51 0.48
22-Sep-14 0.068 0.25 3.4 3.5 3.6 0.033 0.38 0.37
EBN16 Bulls Brook 25-Jun-14 0.044 0.3 2.8 3.1 3.2 0.057 0.44 0.36
30-Jul-14 0.054 0.33 3.7 3.7 3.8 0.027 0.5 0.43
20-Aug-14 0.05 0.33 3.6 3.7 3.7 0.026 0.5 0.47
22-Sep-14 0.049 0.27 3.4 3.6 3.6 0.027 0.4 0.36
EBN15a NSP Out 25-Jun-14 0.055 0.41 2.6 2.7 2.7 0.05 0.71 0.7
30-Jul-14 0.058 0.86 2.5 2.6 2.6 0.033 1.2 1.1
20-Aug-14 0.063 0.88 3.1 3.2 3.2 0.025 1.2 1.1
22-Sep-14 0.13 0.79 2.8 3 3 0.038 0.91 0.9
EBN14a NSP In 25-Jun-14 0.043 0.64 2.5 2.6 2.7 0.065 0.75 0.74
30-Jul-14 0.055 0.78 3 3 3.1 0.035 1.2 1.1

Ellen Brook Catchment Water Quality Monitoring Snapshot June – September 2014
Ellen Brockman Integrated Catchment Group 94
Site Ref No. Site Name
Date Collected
Ammonia as NH3-N DOC SRP as P
Organic Nitrogen
- Filterable TOC
Total Kjeldahl Nitrogen
(Calc) Total
Nitrogen
Total Oxidised Nitrogen
(TON) Total
Phosphorus
Total Phosphorus - Filterable
20-Aug-14 0.056 0.69 3.1 3.2 3.3 0.037 1.3 1.1
22-Sep-14 0.087 0.67 2.7 2.8 2.9 0.035 0.91 0.9
EBN11 Muchea North 25-Jun-14 0.088 4.3 8.3 8.6 9.2 0.58 5.2 5.2
30-Jul-14 0.1 3.1 7.5 7.6 7.7 0.07 3.7 3.5
20-Aug-14 0.13 2.6 8.1 8.3 8.3 0.052 3.6 3.4
22-Sep-14 0.57 3.3 7.9 8.6 8.7 0.11 3.9 3.9
EBN4 Chandala
South 25-Jun-14 0.15 0.27 3 3.3 3.3 0.035 0.4 0.39
30-Jul-14 0.095 0.43 3.1 3.2 3.3 0.045 0.63 0.6
20-Aug-14 0.078 0.33 3.1 3.2 3.3 0.03 0.5 0.45
22-Sep-14 0.061 0.31 2.6 2.7 2.8 0.023 0.48 0.4
EBN1 Lennard Brook 25-Jun-14 0.026 0.08 0.52 0.74 3.7 2.9 0.14 0.13
30-Jul-14 0.021 0.12 <0.025 0.94 4.3 3.4 0.21 0.14
20-Aug-14 0.025 0.13 0.99 1.1 3.7 2.5 0.21 0.17
22-Sep-14 0.032 0.16 0.81 0.96 3.5 2.5 0.21 0.16
EBN3 Chandala
West 25-Jun-14 0.16 0.83 2.9 3.4 3.6 0.23 1 0.9
30-Jul-14 0.13 1.8 4.9 5 5.1 0.095 2.6 2
20-Aug-14 0.18 1.1 6.4 7.1 7.2 0.069 1.7 1.5
22-Sep-14 0.09 0.99 6 6.6 6.7 0.071 1.6 1.2
EBN23 Peters Road 25-Jun-14 NS-D NS-D NS-D NS-D NS-D NS-D NS-D NS-D NS-D
30-Jul-14 0.081 0.43 4.1 4.3 4.5 0.26 0.59 0.56
20-Aug-14 0.066 0.48 4.1 4.2 4.3 0.13 0.73 0.68
22-Sep-14 0.062 0.53 4.4 4.6 4.6 0.056 0.76 0.68
EBN9 Brand Hwy 25-Jun-14 0.087 0.12 1.6 1.8 1.9 0.14 0.16 0.14
30-Jul-14 0.081 0.31 2.7 2.8 2.9 0.1 0.45 0.4
20-Aug-14 0.055 0.21 2.3 2.4 2.5 0.055 0.29 0.27
22-Sep-14 0.054 0.26 2.1 2.2 2.3 0.081 0.37 0.31
EBN2 Airfield Road 25-Jun-14 NS-D NS-D NS-D NS-D NS-D NS-D NS-D NS-D NS-D

Ellen Brook Catchment Water Quality Monitoring Snapshot June – September 2014
Ellen Brockman Integrated Catchment Group 95
Site Ref No. Site Name
Date Collected
Ammonia as NH3-N DOC SRP as P
Organic Nitrogen
- Filterable TOC
Total Kjeldahl Nitrogen
(Calc) Total
Nitrogen
Total Oxidised Nitrogen
(TON) Total
Phosphorus
Total Phosphorus - Filterable
30-Jul-14 0.058 0.9 2.8 3.7 3.9 0.26 1.2 1.2
20-Aug-14 0.077 0.85 3 3 3.1 0.027 1.1 1
22-Sep-14 0.067 0.58 2.5 2.6 2.8 0.13 0.81 0.75
NB: ‘NS-D’ represents ‘no sample taken at this time due to no flow’; ‘NA’ represents ‘not applicable’; ‘<’ represents a value below the limit or reporting (LOR).

Ellen Brook Catchment Water Quality Monitoring Snapshot June – September 2014
Ellen Brockman Integrated Catchment Group 96
Total metal concentrations in surface water within the Ellen Brook catchment 2014.
Site Ref No.
Site Name
Date Collected
Hardness as
CaCO3 (Calc)
Aluminium total
Arsenic total
Cadmium total
Chromium Total
Copper total
Iron total Lead total
Mercury total
Nickel total Zinc total
Unit mg/L mg/L mg/L mg/L mg/L mg/L mg/L mg/L mg/L mg/L mg/L
LOR <5 <0.001 <0.0001 <0.001 <0.001 <0.001 <0.0001 <0.001 <0.001
ANZECC 0.055 0.024 0.0002 0.001 0.0014 0.3 0.0034 0.0006 0.011 0.008
EBN25 Sawpit Gully 25-Jun-14 0.66 <0.001 <0.0001 0.002 0.001 3 <0.001 <0.0001 <0.001 0.002 0.66
30-Jul-14 1.2 0.002 <0.0001 0.004 0.002 3.7 0.001 <0.0001 0.001 0.008 1.2
20-Aug-14 1 0.001 <0.0001 0.002 0.002 3.3 <0.001 <0.0001 <0.001 0.006 1
22-Sep-14 0.77 0.001 <0.0001 0.002 0.001 3.7 0.001 <0.0001 <0.001 0.003 0.77
EBN17 Warren Road 25-Jun-14 0.39 0.001 <0.0001 0.002 0.003 1.9 <0.001 <0.0001 0.002 0.014 0.39
30-Jul-14 0.29 0.001 <0.0001 0.002 0.002 2.1 <0.001 <0.0001 0.003 0.008 0.29
20-Aug-14 0.28 0.001 <0.0001 0.001 0.001 1.8 <0.001 <0.0001 0.001 0.007 0.28
22-Sep-14 0.28 <0.001 <0.0001 <0.001 0.001 2.1 <0.001 <0.0001 0.002 0.006 0.28
EBN10 Muchea
East 25-Jun-14 2 <0.001 <0.0001 <0.001 <0.001 5.1 0.002 <0.0001 0.013 0.021 2
30-Jul-14 1.1 <0.001 <0.0001 0.001 0.001 5.7 0.001 <0.0001 0.009 0.009 1.1
20-Aug-14 0.83 <0.001 <0.0001 <0.001 <0.001 5.6 <0.001 <0.0001 0.007 0.008 0.83
22-Sep-14 0.54 <0.001 <0.0001 <0.001 0.001 7.3 <0.001 <0.0001 0.006 0.008 0.54
EBN8 Wandena
North 25-Jun-14 0.16 <0.001 <0.0001 0.003 <0.001 7.8 <0.001 <0.0001 0.003 0.005 0.16
30-Jul-14 0.22 0.001 <0.0001 0.003 0.001 12 0.002 <0.0001 0.003 0.009 0.22
20-Aug-14 0.19 0.001 <0.0001 0.002 0.001 15 <0.001 <0.0001 0.003 0.007 0.19
22-Sep-14 0.2 0.001 <0.0001 <0.001 0.002 15 0.001 <0.0001 0.003 0.003 0.2
EBN28 Upper Yal
Yal 25-Jun-14 10 <0.001 0.0002 0.007 <0.001 24 0.001 <0.0001 0.042 0.035 10
30-Jul-14 7.7 <0.001 0.0003 0.006 0.006 26 0.004 <0.0001 0.048 0.042 7.7
20-Aug-14 6.5 <0.001 0.0003 0.004 0.004 22 0.003 <0.0001 0.037 0.036 6.5
22-Sep-14 7.8 0.002 0.0004 0.003 0.013 18 0.006 <0.0001 0.049 0.049 7.8
EBN7 Wandena
South 25-Jun-14 8.6 <0.001 <0.0001 0.003 <0.001 8.3 0.002 <0.0001 0.045 0.055 8.6

Ellen Brook Catchment Water Quality Monitoring Snapshot June – September 2014
Ellen Brockman Integrated Catchment Group 97
Site Ref No.
Site Name
Date Collected
Hardness as
CaCO3 (Calc)
Aluminium total
Arsenic total
Cadmium total
Chromium Total
Copper total
Iron total Lead total
Mercury total
Nickel total Zinc total
30-Jul-14 4.6 <0.001 <0.0001 0.002 0.001 6.8 0.003 <0.0001 0.032 0.031 4.6
20-Aug-14 4.8 <0.001 <0.0001 0.001 <0.001 5.9 0.002 <0.0001 0.028 0.041 4.8
22-Sep-14 3 <0.001 <0.0001 <0.001 0.001 4.5 0.001 <0.0001 0.025 0.035 3
EBN4 Chandala
South 25-Jun-14 0.28 0.001 <0.0001 0.001 0.003 1.6 <0.001 <0.0001 0.003 0.009 0.28
30-Jul-14 0.23 0.001 <0.0001 0.002 0.003 1.8 <0.001 <0.0001 0.005 0.005 0.23
20-Aug-14 0.17 0.001 <0.0001 0.001 0.001 1.7 <0.001 <0.0001 0.001 0.004 0.17
22-Sep-14 0.17 0.001 <0.0001 <0.001 0.002 2.1 <0.001 <0.0001 0.002 0.005 0.17
EBN 23 Peters Rd 25-Jun-14 NS-D NS-D NS-D NS-D NS-D NS-D NS-D NS-D NS-D NS-D NS-D
30-Jul-14 0.079 0.009 <0.0001 0.002 0.001 0.73 <0.001 <0.0001 0.001 0.006 0.079
20-Aug-14 0.11 0.005 <0.0001 0.001 <0.001 0.64 <0.001 <0.0001 <0.001 0.005 0.11
22-Sep-14 0.15 0.002 <0.0001 <0.001 0.002 0.75 <0.001 <0.0001 <0.001 0.01 0.15
NB: ‘NS-D’ represents ‘no sample taken at this time due to no flow’; ‘NA’ represents ‘not applicable’; ‘<’ represents a value below the limit or reporting (LOR).

Appendix B – Freshwater Trigger Values and Guidelines
Trigger values and guidelines for nutrient concentrations and physical properties in lowland rivers and freshwater
Guideline EC
mScm
D0 %
Sat
pH Temp oC
TN mg/L NOXN
mg/L
TP
mg/L
FRP
mg/L
ANZECC Water
Quality
Guideline –
Recreational
(2000)
- >80
(>6.5
mg/L)
6.5-8.5 - - 10 - -
ANZECC Water
Quality Trigger
Values -
lowland river
(2000)
0.12-0.3
80-120 6.5-8.0 - 1.2 0.150 0.065 0.04
ANZECC Water
Quality
Guidelines –
Freshwater
(1992)
n/a >80-90
(>6mg/L
)
6.5-9.0 <2
increase 20-30 0.01-0.1 n/a

Ellen Brook Catchment Water Quality Monitoring Snapshot June – September 2014
Ellen Brockman Integrated Catchment Group 99
Trigger values and guidelines for toxicants (metals) in freshwater * Trigger values not corrected for hardness, ID = insufficient data to have ANZECC water quality guideline
Guideline As
mg/L Cr mg/L
Cu*
mg/L
Fe
mg/L
Mo
mg/L
Mn
mg/L
Ni*
mg/L
ANZECC
Water Quality
Guidelines –
Recreational
(2000)
0.05 0.05 1 0.3 ID 0.1 0.1
ANZECC
Water Quality
Trigger Values
Freshwater
99% (2000)
0.001 0.00001 0.001 ID ID 1.2 0.008
ANZECC
Water Quality
Trigger Values
Freshwater
95% (2000)
0.024 0.001 0.0014 ID ID 1.9 0.011
ANZECC
Water Quality
Trigger Values
Freshwater
90% (2000)
0.094 0.006 0.0018 ID ID 2.5 0.013
ANZECC
Water Quality
Trigger Values
Freshwater
80% (2000)
0.360 0.04 0.0025 ID ID 3.6 0.017
ANZECC
Water Quality
Guidelines –
Freshwater
(1992)
0.05 0.01 0.002-
0.005 ID ID ID
0.015-
0.15
Limit of
reporting 0.001 0.001 0.001 0.01 0.005 0.001 0.001

Ellen Brook Catchment Water Quality Monitoring Snapshot June – September 2014
Ellen Brockman Integrated Catchment Group 100
Trigger values and guidelines for toxicants (metals) in freshwater
(continued) * Trigger values not corrected for hardness, ID = insufficient data to have ANZECC water quality guideline
Guideline Pb* mg/L Sn Sr mg/L Ti mg/L V mg/L Zn* mg/L
ANZECC
Water Quality
Guidelines –
Recreational
(2000)
0.05 ID ID ID ID 5
ANZECC
Water Quality
Trigger Values
Freshwater
99% (2000)
0.001 ID ID ID ID 0.0024
ANZECC
Water Quality
Trigger Values
Freshwater
95% (2000)
0.0034 ID ID ID ID 0.008
ANZECC
Water Quality
Trigger Values
Freshwater
90% (2000)
0.0056 ID ID ID ID 0.015
ANZECC
Water Quality
Trigger Values
Freshwater
80% (2000)
0.0094 ID ID ID ID 0.031
ANZECC
Water Quality
Guidelines –
Freshwater
(1992)
0.001-0.005 ID ID ID ID 0.005-
0.05
Limit of
reporting 0.001 0.05 0.001 0.01 0.002 0.001

Ellen Brook Catchment Water Quality Monitoring Snapshot June – September 2014
Ellen Brockman Integrated Catchment Group 101
Appendix C – Photographs of Sample Sites The following pictures were taken in June 2005 (note sites 17-20 are not included):
EBN1- Lennard Brook EBN2 – Airfield Road
EBN3 – Chandala West EBN4 – Chandala south
EBN 5 – Yal Yal Brook EBN7 – Wandena North

Ellen Brook Catchment Water Quality Monitoring Snapshot June – September 2014
Ellen Brockman Integrated Catchment Group 102
EBN8 – Wandena south EBN9 – Brand Hwy south
EBN10 – Muchea East EBN11 – Muchea north
EBN12 – Muchea south EBN 13 – Rutland Road

Ellen Brook Catchment Water Quality Monitoring Snapshot June – September 2014
Ellen Brockman Integrated Catchment Group 103
EBN14 – Bingham Road (NS outflow) EBN15 – Nutrient Stripping Pond inflow
EBN16 – Bulls Brook EBN17 – Warren Road
EBN18 – Gauging Station EBN19 – Belhus Reserve

Ellen Brook Catchment Water Quality Monitoring Snapshot June – September 2014
Ellen Brockman Integrated Catchment Group 104
EBN20 – All Saints EBN21 – Lower Yal Yal
EBN22 – Ki-it Brook EBN23 – Peters Road
EBN24 – Stock Road EBN25 – Sawpit Gully

Ellen Brook Catchment Water Quality Monitoring Snapshot June – September 2014
Ellen Brockman Integrated Catchment Group 105
EBN26 – Egerton EBN27 – Wandena Road
EBN28 – Upper Yal Yal (Dam) EBN29 Roxburgh Ave (The Vines)

Ellen Brook Catchment Water Quality Monitoring Snapshot June – September 2014
Ellen Brockman Integrated Catchment Group 106
Appendix D – Salinity measurements & tolerance limits

Ellen Brook Catchment Water Quality Monitoring Snapshot June – September 2014
Ellen Brockman Integrated Catchment Group 107
Appendix E – Hardness-Modified Trigger Value calculations based on varying water hardness (Table 3.4.4. ANZECC & ARMCANZ, 2000). Hardness
category
(mg/L as
CaCO3)
Water
Hardness
(mg/L as
CaCO3)
Cd Cr(III) Cu Pb Ni Zn
Soft
(0-59)
30 TV TV TV TV TV TV
Moderate
(60-119)
90 *2.7 *2.5 *2.5 *4 *2.5 *2.5
Hard
(120-179)
150 *4.2 *3.7 *3.9 *7.6 *3.9 *3.9
Very
Hard
(180-240)
210 *5.7 *4.9 *5.2 *11.8 *5.2 *5.2
Extremely
Hard
(400)
400 *10 *8.4 *9 *26.7 *9 *9

Appendix F – Daily, monthly and annual Rainfall (mm) recorded at Pearce RAAF Base (http://www.bom.gov.au/jsp/ncc/cdio/weatherData/av?p_nccObsCode=136&p_display_type=dailyDataFile&p_startYear=2012&p_c=-16397241&p_stn_num=009053)Please note that ‘nd’ represents no data at time of sourcing records
Day January February March April May June July August September October November December
1 0 0 0 0.4 0 0 0 0 0 0 0 0
2 0 0 0 0 0 0 3 0 0 1 0 0
3 0 0 0 0 0 0.8 15.6 0 0 0.1 1 0
4 0 0 0 0 0 0 0 0 0 0 0 0
5 0 0 0 0 0.8 0 0 0 0.2 0 0 0
6 0 0 0 0 0 0 0 0 0 15.2 0 0
7 0 0 0 0 5 0 14.8 2.6 0 0 1.6 0
8 0 0 0 0 40 0 10.6 0.6 0 0 0 0
9 0 0 0 0 4.4 0 0.2 0 19.8 1.4 0 0
10 0 0 0 0 0 13.4 0 0 0 0 0 0
11 0 0 0 0 0 1 0 0 0 0 0 0
12 0 0 0 0 4.8 0 0 0 0 0 0 0
13 0 0 0 0 1.1 0 0 0 0 0 0 0
14 0 0 0 0 0 0 9.8 0 0 0 0 0
15 0 0 0 0 0 0 3 0 0 0 0 0
16 0.2 0 0 0 0 0 1.8 0 0 0 0 0
17 0 0 0 0 0 0 0 0 0 0 0 0
18 0 0 0 0 0 45 0 12.5 0 0 0 0
19 0 0 0 0 0.4 1.2 0 12.1 0 0 0 0
20 0 0 0 0 0.4 11.8 0 1.2 0 3.8 0.4 0
21 0 1.4 2.6 0 3 0 6.6 11.8 0 0 0 0
22 0 0 0 0 1.2 0 24 3.5 22.8 0 0 0
23 0 0 0 0 35.4 13.4 2.2 0 0 2 0.4 0
24 0 0 0 0 0 0 0.6 0 0 0 0 0
25 0 0 0 0 0 0 0.4 0 0 0 0 0
26 0 0 0 0 14.6 0 0 0.2 0 0 15.8 0
27 0 0 0 0 2.2 0.8 0 0 0 1.8 1.2 0
28 0 0 0 22.8 10.6 0 8.6 0 0 0 0 0
29 0 0 0 0 0 2.6 0 0 0 0 0
30 0 0 0 0 0 0.2 0 12.8 0 4.8 0
31 0 3.6 0 0 0.6 42.2 0.3 0
Monthly Total 0.2 0 6.2 23.2 123.9 87.4 104.6 86.7 55.6 25.6 20.4 0
Annual Total 533.8

Appendix G – Sampling and Analysis Plan
Sampling and Analysis Plan
Ellen Brook Catchment
Water Quality Monitoring Snapshot
2014
Plate 1: EBN27 Wandena Rd (EBICG, 2012).
Prepared by Ellen Brockman Integrated Catchment group: May 2014
This project is co-funded by the Australian and Western Australian Government's investment in the Caring for Country
administered by the Perth Region NRM.
Ellen Brook Catchment Sampling and Analysis Plan 2014
Ellen Brockman Integrated Catchment Group 110
Table of Contents 1. BACKGROUND .................................................................................................... ERROR! BOOKMARK NOT DEFINED. 2. CHANGES TO THE PROJECT ................................................................................. ERROR! BOOKMARK NOT DEFINED. 3. SAMPLING SITE LOCATION ................................................................................ ERROR! BOOKMARK NOT DEFINED.
Table 1: Location and description of sampling sites in the Ellen Brook catchment. . Error! Bookmark not defined. 4. SAMPLING FREQUENCY ...................................................................................... ERROR! BOOKMARK NOT DEFINED. 5. MEASURED PARAMETERS ................................................................................... ERROR! BOOKMARK NOT DEFINED. 6. QUALITY ASSURANCE AND QUALITY CONTROL ................................................ ERROR! BOOKMARK NOT DEFINED.
6.1. Blank Samples................................................................................................... Error! Bookmark not defined. 6.2. Field Blanks (FB) ............................................................................................. Error! Bookmark not defined. 6.3. Replicates Samples (RS) ................................................................................... Error! Bookmark not defined.
7. STANDARD OPERATING PROCEDURES................................................................ ERROR! BOOKMARK NOT DEFINED. 8. SAMPLING OPERATION REQUIREMENTS .............................................................. ERROR! BOOKMARK NOT DEFINED.
Table 2: Measurement parameters analysed at a given number of EBN sites on five sampling runs. ............. Error!
Bookmark not defined. 9. SAMPLE BOTTLE REQUIREMENTS ....................................................................... ERROR! BOOKMARK NOT DEFINED.
Table 3: Number of bottles required to sample for all identified measurement parameters, field blanks and
replicates. ................................................................................................................... Error! Bookmark not defined. 10. ........................................................................................................................................LABELLING
ERROR! BOOKMARK NOT DEFINED. 11. .............................................................................................................................. PERSONAL SAFETY
ERROR! BOOKMARK NOT DEFINED. 12. .............................................................................. LIMITS OF REPORTING (LORS) FOR NMI LABORATORY
ERROR! BOOKMARK NOT DEFINED. Table 4: Analysis Methods and Limit of Reporting (LOR) for NMI. .......................... Error! Bookmark not defined.
13. ................................................................................................. SENDING SAMPLES TO THE LABORATORY
ERROR! BOOKMARK NOT DEFINED. 14. ................................................................................................ MANAGEMENT AND REPORTING OF DATA
ERROR! BOOKMARK NOT DEFINED. 15. ............................................................................................ COMPARISON OF RESULTS WITH GUIDELINES
ERROR! BOOKMARK NOT DEFINED. 16. ............................................................................................................... ROLES AND RESPONSIBILITIES
ERROR! BOOKMARK NOT DEFINED. Table 5: Costs of water quality analysis of the Ellen Brook catchment 2010 sampling program at NMI. ...... Error!
Bookmark not defined. Table 6: Budget for the 2010 Ellen Brook catchment monitoring project. ................ Error! Bookmark not defined.
17. REFERENCES .................................................................................ERROR! BOOKMARK NOT DEFINED.
APPENDIX A: ANALYTICAL REQUIREMENTS .....................................ERROR! BOOKMARK NOT DEFINED.
APPENDIX B: EQUIPMENT LIST FOR COLLECTING WATER SAMPLES (DOW, 2006B) ...................... ERROR!
BOOKMARK NOT DEFINED.
List of Figures
Figure 1: Location of the Ellen Brook and Brockman River Catchments. . Error! Bookmark not defined.
Figure 2: Ellen Brook Catchment land-use map. ................. Error! Bookmark not defined.

Ellen Brook Catchment Sampling and Analysis Plan 2014
Ellen Brockman Integrated Catchment Group 111
Figure 3: Water Quality sampling sites within the Ellen Brook catchment in 2010. ...... Error! Bookmark not defined.

Ellen Brook Catchment Sampling and Analysis Plan 2014
Ellen Brockman Integrated Catchment Group 112
1. Background
The Ellen Brook catchment is located 20 kilometres north-east of Perth and is the largest coastal
sub-catchment of the Swan-Canning estuary, with an approximate area of 800km² (Error!
Reference source not found.). The Ellen Brook discharges an average of 37 million cubic metres
of water annually into the Swan River, which represents 12% of the Swan’s total flow. Although a
relatively low portion, it contributes 30% of the total phosphorous load and 15% of the total
nitrogen load entering the Swan (SRT, 2009).
The Ellen Brook has been identified by the Swan River Trust as a priority catchment with the
highest concentration of phosphorous of any of the monitored tributory entering the Swan
Riverpark. This makes a significant contribution to the eutrophication and subsequent toxic algal
blooms within the system (Horwood, 1997). As a result, the Swan River Trust produced the “Local
Water Quality Improvement Plan (WQIP): Ellen Brook Catchment” through the Australian
Government’s Coastal Catchments Initiative (CCI) in 2009. The document aims to trace the
pathway of nutrients through the catchment from their source to the discharge point, and to provide
stakeholders with a mechanism to prioritise recommendations and resources, and funding to
improve water quality.
Running north-south, the central portion of the catchment has been extensively cleared for
agriculture, urban and industrial development. According to SRT (2009) land use is predominantly
cattle grazing and horticulture in the north, and small scale light industry including mining and
extractive industries together with an expanding region of urban and rural residential development
to the south (Error! Reference source not found.).
Monitoring involves observations and measurements that are analysed and reported for the purpose
of providing information and knowledge about catchments and waterways (DoW, 2006). With
support from Tronox and the Department of Water (DoW), the Ellen Brockman Integrated
Catchment Group (EBICG) commenced an annual sampling program focusing on nutrients,
physical parameters, total suspended solids and heavy metals at a number of sites within the Ellen
Brook catchment in 2005. Sampling occurred once per month over a four month period
commencing with the first consistent winter flows. As more funding became available, eight
strategically identified sites within the Ellen Brook catchment were added to the program in 2007,
making a total of 27 sampling sites (Error! Reference source not found.).

Ellen Brook Catchment Sampling and Analysis Plan 2014
Ellen Brockman Integrated Catchment Group 113
The water quality monitoring program for 2014 will be funded by the Ellen Brockman Integrated
Catchment Group and the Swan River Trust. Sampling will be undertaken once a month over four
months, and will commence with the first consistent winter flows.
The aim of this sampling and analysis plan is to provide a report on the development of the Ellen
Brook water quality monitoring program, to ensure that sampling is conducted according to the
relevant guidelines, ensuring that data standards are met and data quality continuity maintained
(DoW, 2006). The aim of sampling from twenty-eight strategically identified sites along the Ellen
Brook is to determine and monitor the priority sub-catchments, which are those that are contributing
levels of nutrients and heavy metals in concentrations above the ANZECC Water Quality
Guidelines. The SAP and the sampling program will continue to add to established baseline data for
surface water quality within the catchment.

Ellen Brook Catchment Sampling and Analysis Plan 2014
Ellen Brockman Integrated Catchment Group 114
2. Changes to the project
This project commenced in winter/spring of 2005, please refer to the sampling and analysis plan for
details of the project in 2005.
In 2006 the following changes were made to the project:
All chemical analysis was carried out by NMI in 2006; (in 2005 this was done by MPL, through
TiWest).
The suite of heavy metals was changed to Al, As, Cd, Co, Cr, Cu, Fe, Hg, Mn, Mo, Ni, Pb, Se
and Zn.
Total water harness (as Ca and Mg) was included in the chemical analysis from sites where
samples were collected for heavy metals analysis.
In 2007 the following changes were made to the project:
Muchea South (site EBN 12) was removed from the project, as results were consistently low
and it was decided the money could be better spent investigating a new site.
The heavy metals analysis suite was reduced from 14 to 10 metals, specifically Al, As, Cd, Cr,
Cu, Fe, Hg, Ni, Pb, and Zn.
Eight new sites were added to the project (sites EBN 21-28). Sites 21-27 were sampled for
physical parameter and nutrients only (the same as for the majority of sites included in the
project and water collected from site EBN 28 was analysed for Al, As, Cd, Cr, Cu, Fe, Hg, Ni,
Pb, Zn and total water hardness (as Ca and Mg) only.
Total and dissolved organic carbon were both added to the list of analysed parameters at the
bottom of catchment site only (EBN 20).
The sampling frequency was every three weeks for 4 events (instead of the previous monthly for
4 events).
Dissolved organic nitrogen and nitrogen as ammonia were added to the suite of nutrient
determined from water samples.
In 2008 the following changes were made to the project:
One new site Roxburghe Ave (EBN 29) was added to the project. Water samples from this site
were analysed for the standard suite of nutrients but also for dissolved organic phosphorus.
The method for collection of organic carbon samples was changed. Both total and dissolved
organic samples are now rinsed three times prior to final sample collection and filled to the top
of the bottle with no air bubbles. This is to minimise the differences in collection and sampling
methods between two parameters that are often compared.
In 2009 the following changes were made to the project:
The sampling frequency has returned to monthly over four months.
Total Filterable Phosphorous will be analysed rather than Dissolved Organic Phosphorous.
In 2010 the following changes were made to the project:

Ellen Brook Catchment Sampling and Analysis Plan 2014
Ellen Brockman Integrated Catchment Group 115
Swan River Trust will be funding the project given that their funding applications are approved.
If not, the program will be funded through the Ellen Brockman Integrated Catchment Group and
the Local Government Authorities where possible.
All Saints Church (EBN20) sampling site will not be sampled in 2010 unless access to the site is
reopened to the public. 2009 sampling at this site was cancelled due to the questionable integrity
of the stairway that leads down to the Confluence of the Ellen Brook and Swan River. Sampling
parameters from All Saints will be sampled from Belhus Reserve (EBN19), which is the main
body of the Ellen Brook on Millhouse Road.
Nutrient Inflow (EBN14) and Nutrient Outflow (EBN15) sampling sites have been shifted
further upstream (EBN14A) and further downstream (EBN15). This has been requested by the
Swan River Trust due to the nutrient intervention works that have been undertaken at this site. A
bund and spillway was installed in 2009/2010 to hold back the water and create a seasonal
wetland. New GIS coordinates have been entered in Table 1.
Nutrient Inflow (EBN14) is now referred to as EBN14A because it was moved greater than
100m from its original position. See Table 1for GIS coordinates. It has been re-registered with
WIN database as a ‘new’ sampling site under this program.
In 2011 the following changes were made to the project:
All Saints Church (EBN20) sampling site will not be sampled in 2011 unless access to the site is
reopened to the public. 2009 sampling at this site was cancelled due to the questionable integrity
of the stairway that leads down to the Confluence of the Ellen Brook and Swan River. Sampling
parameters from All Saints will be sampled from Belhus Reserve (EBN19), which is the main
body of the Ellen Brook on Millhouse Road.
Chandala West (EBN3) will not be sampled for metals in 2011, It has not had any significant
pH or metal concentrations in several years.
Chandala South(EBN4) will be sampled for the full suite of metals in 2011 to investigate
potential cause in decreased pH recorded in 2010
In 2012 the following changes were made to the project:
Belhus Reserve (EBN19) will not be sampled for metals in 2012, It has not had any significant
pH or metal concentrations in previous years.
Brand Hwy (EBN9) will be sampled for the full suite of metals in 2012 to investigate whether
the low pH water coming from the Wandena North (EBN7) Subcatchment is contributing any
significant metal concentrations to the main channel of the Ellen Brook.

Ellen Brook Catchment Sampling and Analysis Plan 2014
Ellen Brockman Integrated Catchment Group 116
In 2013 the following changes were made to the project
Brand Hwy (EBN9) will not be sampled for metals in 2013, there were no significant pH or
metal concentrations recorded in 2012
Peters Rd (EBN23) and Sawpit Gully (EBN25) will be sampled for metals in 2013 to
investigate whether pH levels outside the guideline are indicating any significant metal
concentrations in the water.
In 2014 the no changes were made to the project

Ellen Brook Catchment Sampling and Analysis Plan 2014
Ellen Brockman Integrated Catchment Group 117
Figure 33: Location of the Ellen Brook and Brockman River Catchments.

Ellen Brook Catchment Sampling and Analysis Plan 2014
Ellen Brockman Integrated Catchment Group 118
Figure 34: Ellen Brook Catchment land-use map.

Ellen Brook Catchment Sampling and Analysis Plan 2014
Ellen Brockman Integrated Catchment Group 119
3. Sampling Site Location
Water samples will be taken from twenty seven sites within the Ellen Brook catchment (Error!
Reference source not found.). These sites have been selected to be representative of a particular
part of the catchment; to determine their relative nutrient and metal contribution to the Ellen Brook;
and whether they are situated upstream or downstream of potentially high impact land uses or of
likely contaminant sources. Error! Reference source not found. lists the EBN sampling sites by
site number, site name and relative waterway component. Site location is also provided using street
names, northings and eastings. It should be noted that GIS coordinates for Nutrient Outflow
(EBN15) were changed in 2010 due to works undertaken by the Swan River Trust’s Drainage
Nutrient Intervention Program (DNIP). The installation of a bund and native vegetation filter has
caused the original sampling point to be shifted a few metres further east, this continues
indefinately.

Ellen Brook Catchment Sampling and Analysis Plan 2014
Ellen Brockman Integrated Catchment Group 120
Table 8: Location and description of sampling sites in the Ellen Brook catchment.
Site no. Site Name Waterway section/
Component
Location Northing Easting
EBN1 Lennard Brook Lennard Brook Lennard Brook Road 6527771 0396613
EBN2 Airfield Road North Chandala/Ellen Brook
(Bambun Lakes)
Airfield Road 6519428 0397101
EBN3 Chandala West Chandala Brook West Brand Hwy west loc # 853 6511801 0400463
EBN4 Chandala South Chandala Brook South Brand Hwy east / TIWest 6510846 0401302
EBN5 Yal Yal Brook Yal Yal Brook Reserve Road 6514458 0404923
EBN6 Rocky Gully Creek Rocky Gully Creek Old Gingin Rd 6509047 0403714
EBN7 Wandena North Waterway to Ellen Brook Wandena North - Great
Northern Highway
6507384 0404384
EBN8 Wandena South Waterway to Ellen Brook Wandena South - Great Northern Highway
6506686 0404561
EBN9 Brand Highway
Bridge
Ellen Brook - Muchea Central Bridge on Brand Hwy south 6505838 0404093
EBN10 Muchea East Waterway to Ellen Brook
Muchea East
Great Northern/Brand
Highways
6505833 0404780
EBN11 Muchea North Waterway to Ellen Brook - Muchea south /Railway Rd
491 chit/swan sign
6500336 0404611
EBN13 Rutland Road Ellen Brook (upper) Rutland Road bridge 6498117 0406044 EBN14A Nutrient Inflow Waterway – Nutrient
stripping inflow taken at stockcrossing
Bingham Road/ Department
of Defence
6496881 0405499
EBN15 Nutrient Outflow Waterway - Nutrient stripping
Pond outflow
Bingham Road/ Department
of Defence
6496883 0405807
EBN16 Bulls Brook Bullsbrook Sth past Strachan on Railway Rd
6495684 0405054
EBN17 Warren Road Mid Ellen Brook Warren Road 6493379 0406685
EBN18 Gauging Station Ellen Brook - Almeria
Gauging Station
Almeria Parade/Apple Street 6486743 0407638
EBN19 Belhus Reserve Lower Ellen Brook Belhus Reserve Millhouse Rd Bridge
6483685 0406519
EBN21 Lower Yal Yal Yal Yal Brook South Old Gingin Road 6509922 0403110
EBN22 Ki-it Brook Ki-it Brook Warren Road 6493382 0406959
EBN23 Peters Road Waterway to Ellen Brook –
Muchea townsite
Peters Road 6505232 0403580
EBN24 Stock Road Waterway to Ellen Brook West
Railway Parade 6492415 0405221
EBN25 Sawpit Gully Waterway to Ellen Brook –
The Vines north
Lot 4/285 Railway Parade,
Upper Swan
6486777 0407430
EBN26 Egerton Waterway from Egerton
Estate to Ellen Brook
Corona Way 6483859 0405129
EBN27 Wandena Road Waterway to Ellen Brook Corner of Great Northern
Hwy and Wandena Road
6502590 0406553
EBN28 Upper Yal Yal Yal Yal Brook North Great Northern Hwy 6516783 0409421
EBN29 Roxburghe Avenue Drain leading to Ellen Brook
from The Vines east
Roxburghe Avenue 6486603 0406975

Ellen Brook Catchment Sampling and Analysis Plan 2014
Ellen Brockman Integrated Catchment Group 121
Figure 35: Water Quality sampling sites within the Ellen Brook catchment in 2014
.

Ellen Brook Catchment Sampling and Analysis Plan 2014
Ellen Brockman Integrated Catchment Group 122
4. Sampling frequency
Initial sampling will take place from the first consistent winter flows ( June/July) then once every
month over a four month period.
5. Measured parameters
All sites, except EBN 28, will be analysed in the field using pH and salinity meters.
All sites, except EBN 28, will also be sampled for the analysis of total suspended solids and
nutrients including total phosphorous (TP), total filterable phosphorous (TFP), total nitrogen (TN),
Soluble reactive phosphorous (SRP), Soluble organic nitrogen (SOrgN), total oxidised nitrogen
(TON) and nitrogen as ammonia (NH4-N). The confluence of the Ellen Brook and the Swan River
(EBN 20-All Saints) is no longer accessible, therefore Belhus Reserve will be analysed for
dissolved organic carbon (DOC) and total organic carbon (TOC).
Samples will be collected from Upper Yal Yal (EBN28), Chandala South (EBN4), Wandena North
(EBN7), Wandena South (EBN8), Muchea east (EBN10), Warren Road (EBN17), Sawpit Gully
(EBN25) and Peters Rd (EBN23), for analysis of total water hardness and total metals; including
iron, aluminium, copper, arsenic, lead, nickel, zinc, chromium, mercury and cadmium at eight sites.
Refer to Appendix A for a tabular format of the selected parameters to be measured in surface
waters of the sampling sites within the Ellen Brook catchment.
6. Quality Assurance and Quality Control
It is important to collect quality control samples as firm conclusions cannot be drawn from
sampling data unless the quality of the data is known. The number and the types of quality control
samples depend on the final use of the data, as well as the amount of time and money available for
the monitoring program (DOW). This monitoring program will include one field blank and one
replicate taken on two sampling occasions to ensure quality assurance and quality control of water
quality data.

Ellen Brook Catchment Sampling and Analysis Plan 2014
Ellen Brockman Integrated Catchment Group 123
6.1. Blank Samples
Blanks are clean samples of deionised or distilled water, introduced at various stages of sampling.
They are collected to detect and measure contamination in the sampling process as a result of
ineffective field procedures, containers, equipment and transport. Often it is not possible to achieve
absolutely no contamination, but rather only stable, minimal contamination levels. You need to set
acceptable limits for these contamination levels, and when blanks are collected that fall outside this,
you have a contamination issue that will require further investigation (DOW).
6.2. Field Blanks (FB)
Extra containers are taken to the site. Take a stock container of deionised/distilled water. On site,
containers are opened and closed and the contents handled just as if these were normal samples
being collected during transfer and storage, except they are filled with deionised/distilled water
(leave or add appropriate preservative in the bottle if required– depending on which parameters the
field blank is checking). These detect mainly contamination of sample during the collection
procedure. Ideally at least one of these is collected per sampling team, per sampling trip, for all
measured analytes (DOW).
6.3. Replicates Samples (RS)
Replicate samples are two or more samples collected from the same site and time, using exactly the
same method. They can indicate the natural variations in the environment and variations caused by
the field sampling method. It provides the experimental error and thus a measure of sampling
accuracy. Two replicates will only indicate that variation exists (if there is any) but three replicates
will enable some assessment of precision and bias (DOW).

Ellen Brook Catchment Sampling and Analysis Plan 2014
Ellen Brockman Integrated Catchment Group 124
7. Standard Operating Procedures
To reduce contamination of samples with disturbed sediment, sampling is to begin at the most
downstream site within the catchment (Belhus Reserve – EBN19) and to be continued upstream.
Physical parameters will be measured using WTW meters at the same time as the water samples are
collected. Calibration of the meters will need to occur prior to and at the end of the sampling with
all calibration records kept in a logbook.
Grab surface water samples for chemical analysis of nutrients and metals is collected just below the
surface, avoiding any surface scums or debris (DoW, 2006a). Measuring of physical parameters,
direct sampling and taking filtered samples are to be conducted using the ‘Guideline for Field
Sampling for Surface Water Quality Monitoring Programs’, by the Water Science Branch,
Department of Water (2006a).

Ellen Brook Catchment Sampling and Analysis Plan 2014
Ellen Brockman Integrated Catchment Group 125
7.1. Physical Parameter Sampling (DoW, 2009).
Lower the clean, maintained and calibrated data logger into the water body near or at the
same site where the water samples were taken. Minimise disturbance to the sediment.
Ensure that all probes are fully submerged. Ideally the probes should be approximately
10cm under the water surface and 10cm above the sediment.
The probes should be kept in a gentle motion while taking care not to stir up the sediments.
If the probe has a built in circulator ensure this is turned on.
Allow sufficient time for the probe to stabilise, and then take the readings.
Store the physical results electronically on the instrument’s console, or on the Field
Observation Form.
7.2. Grab Pole Sampling (DoW, 2009)
Ensure that labelling on the bottle to be filled is correct and that the sample number matches
the number on the paperwork (Field Observation Form and Chain of Custody form).
Check that the grab pole sampler is clean.
Extend the pole sampler so that it will reach the point that you wish to sample.
Lower the grab sampler into the water with the mouth of the bottle facing upstream into the
flow of water to a depth of 15cm. Keep the bottle moving forwards, into the flow of water
whilst it is filling (Standards Australia AS/NZS 566.6:1998 5.3.1).
Allow to partially fill, take the bottle out of the water, swirl around and tip out the rinsate
downstream of sampling site.
Repeat two more times so that the grab pole sampler has been rinsed three times.
Then, fill the grab sampler at a depth of 15cm, with the mouth of the bottle facing upstream,
slowly moving the bottle forward, into the flow of water.
Use this sample to rinse the labelled sample container three times. Cap, shake well, and pour
the rinsate downstream of yourself.
Remove the cap from the sample container only at the time of sampling and replace the cap
immediately after collection of the sample.
Fill the bottle to the shoulder.

Ellen Brook Catchment Sampling and Analysis Plan 2014
Ellen Brockman Integrated Catchment Group 126
Metal samples do not require nitric acid in the sample bottles as the laboratory nitrifies the
water sample in the lab.
Do not touch the opening of the sample container with any part of the grab pole bottle or
your hands as this can introduce contaminants.
Cap and store the sample container in an ice-esky overnight. The samples will be delivered
(chilled) to NMI laboratory the following day.
7.3. Filtering a Nutrient Sample
Refer to DoW (2006a) for details on setting up a Filter Tower.
Shake the sample gently before filtering.
Pour a small amount of the sample into the top of the cleaned and assembled filter tower.
Use the vacuum pump and the rubber bung.
Swirl the filtered sample by carefully pouring it through both vacuum ports.
Put the rubber bung back on and reattach the pump.
Pour the required amount of sample plus a bit extra (for rinsing the sample container) into
the top of the filter tower.
Use the vacuum pump to filter the sample.
Once the sample is filtered remove the vacuum from the collection chamber.
Pour a small amount of the filtered sample into the pre-labelled sample container.
Remove the cap from the sample container only at the time of sampling and replace the cap
immediately after collection of the sample.
Cap, swirl around the filtrate and discard.
Repeat twice to ensure that the sample container is well rinsed.
Fill the labelled sample container with the filtrate to the required level.
Cap and store the sample container in an esky on ice-bricks.
7.4. DOC/TOC Sampling
Rinse both DOC and TOC sample bottles three times prior to filling
When filling the bottles fill all the way to the top (i.e. leave no air bubble).
As a standard use a filter tower to filter your sample.

Ellen Brook Catchment Sampling and Analysis Plan 2014
Ellen Brockman Integrated Catchment Group 127
8. Sampling operation requirements
Table 9: Measurement parameters analysed at a given number of EBN sites on five sampling runs.
Sample
Run
Field
personnel
Number of sites Measurement parameters
1
Bonny
Dunlop
Megan
O’Grady
Sue
Metcalf
26/27 (EBN 1-11,
13-27, 29)
1/27 (EBN 19)
8/27(EBN 4, 7, 8,
10, 17, 23, 25, 28)
Water
Nutrients, physical properties total suspended solids
TOC/DOC
Metals and total water hardness (from TSS, except site
EBN 28, collected separately)
2
Bonny
Dunlop
Megan
O’Grady
Sue
Metcalf
26/27 (EBN 1-11,
13-27, 29)
1/27 (EBN 19)
8/27 (EBN 4, 7, 8,
10, 17, 23, 25, 28)
1/27 Random site
Water
Nutrients, physical properties and total suspended solids
TOC/DOC
Metals and total water hardness (from TSS, except site
EBN 28, collected separately)
Field Blank and Replicate
3
Bonny
Dunlop
Megan
O’Grady
Sue
Metcalf
26/27 (EBN 1-11,
13-27, 29)
1/27 (EBN 19)
8/27 (EBN 4, 7, 8,
10, 17, 23, 25, 28)
Water
Nutrients, physical properties total suspended solids
TOC/DOC
Metals and total water hardness (from TSS, except site
EBN 28, collected separately)
4
Bonny
Dunlop
Megan
O’Grady
Sue
Metcalf
26/27 (EBN 1-11,
13-27, 29)
1/27 (EBN 19)
8/27 (EBN 4, 7, 8,
10, 17, 23, 25, 28)
1/27 Random site
Water
Nutrients, physical properties and total suspended solids
TOC/DOC
Heavy Metals and total water hardness (from TSS,
except site EBN 28, collected separately)
Field Blank and Replicate

Ellen Brook Catchment Sampling and Analysis Plan 2014
Ellen Brockman Integrated Catchment Group 128
9. Sample bottle requirements
Table 10: Number of bottles required to sample for all identified measurement parameters, field blanks and replicates.
10. Labelling
The sample containers should be labelled with sequential sample registration numbers, the date of
collection, the type of preservation (if any) and the client identification. Water samples are to be
accompanied by field notes, field observation forms and chain of custody forms.
The sample bottle will be labelled prior to the time of sampling and collection in the field to ensure
efficiency and organisation.
Sample number 200638340
Date 22/06/2010
Parameters TN/TP
Agency EBICG
Depth 0.1 meters
Figure 4: Example of bottle label
11. Personal Safety
A separate safety plan will be prepared and approved by the Ellen Brockman Integrated Catchment
Group prior to field sampling. Field sampling should not commence until the safety plan has been
signed off by all parties involved in the sampling. The safety plan will indicate all areas of potential
Matrix Parameters Bottle type Sites Sampling
events
Samples/si
te Replicates
Field
blanks
Total
bottles
Water
Total nutrients 250mL plastic 27 4 1 2 2 112
Dissolved nutrients 250mL plastic 27 4 1 2 2 112
Total heavy metals 125mL plastic,
acidified 8
4 1 2 2 32
TSS and total water
hardness 1L plastic 27
4 1 2 2 112
TOC
125mL dark glass
with Teflon liner
cap
1
4 1 1 1 6
DOC
125mL dark glass
with Teflon liner
cap
1
4 1 1 1 6

Ellen Brook Catchment Sampling and Analysis Plan 2014
Ellen Brockman Integrated Catchment Group 129
risk to personnel before, during and after the sampling, and develop specific strategies to minimise
the risk.

Ellen Brook Catchment Sampling and Analysis Plan 2014
Ellen Brockman Integrated Catchment Group 130
12. Limits of Reporting (LORs) for NMI Laboratory
Table provides the NMI Laboratory method codes and limits of reporting (mg/L) for the
measurement parameters selected for the Ellen Brook catchment sampling program. The
measurement parameters cannot be detected below these limits provided.
Table 4: Analysis Methods and Limit of Reporting (LOR) for NMI.
Method description LOR
(mg/L)
Total phosphorus 0.005
Total nitrogen 0.025
Total organic nitrogen 0.025
Soluble reactive phosphorus 0.005
Total oxidised nitrogen 0.010
Nitrogen as ammonia 0.010
Dissolved organic nitrogen 0.025
Total filterable phosphorous 0.005
Total Suspended Solids 1.0
Total organic carbon 1.0
Dissolved organic carbon 1.0
Total water hardness 1.0
Arsenic – total 0.005
Aluminium – total 0.005
Cadmium – total 0.0001
Chromium – total 0.001
Copper – total 0.001
Iron – total 0.005
Lead – total 0.001
Nickel – total 0.005
Zinc – total 0.005
Mercury – total 0.0001
NMI is an accredited analytical laboratory which has been identified to analyse the water samples
for the Ellen Brook water quality monitoring program. Table provides information on the analytical
methods and limits of reporting used by the laboratory. Following analysis NMI must produce a
laboratory report which must provide details on the following in both electronic and final laboratory
reports:
Date and time of sample analysis
Method code and description

Ellen Brook Catchment Sampling and Analysis Plan 2014
Ellen Brockman Integrated Catchment Group 131
All laboratory Quality Control results including analyte recovery, accepted recovery range, lab
blanks, lab duplicates, lab blank spike recovery, matrix spike recovery.

Ellen Brook Catchment Sampling and Analysis Plan 2014
Ellen Brockman Integrated Catchment Group 132
13. Sending samples to the laboratory
Collected samples will be stored in an esky chilled to 4 oC with ice bricks out in the field and
overnight in a refrigerator, as the sampling will be conducted over 2 days. The samples will be
delivered to NMI in the afternoon of the day after sampling for analysis at the latest. A completed
chain of custody (COC) must be included in the esky for the laboratory and a copy kept at the
Chittering Landcare Centre. Turnaround time is 10 days from sample date to completion of
analysis. Once the samples are received the results will be emailed directly to the Chittering
Landcare Centre.
14. Management and Reporting of data
The sampling program and sampling sites will be registered with the Water Information Branch
(WIN database) of the Department of Water. Water samples collected from the Ellen Brook will be
sent for analysis to the National Measurement Institute (NMI), a laboratory accredited by the
National Association of Testing Authorities (NATA) and independently audited by the Department
of Water. Analytical results will be returned to the Chittering Landcare Centre. Results will be sent
to the Department of Water to be entered onto the publicly accessible Water Information (WIN)
database. However, this is dependent on whether or not it will incur a cost. The water quality
monitoring results will be validated and verified, collated, analysed and published as a water quality
report for the Ellen Brook, where data will be compared to previous years sampling.

Ellen Brook Catchment Sampling and Analysis Plan 2014
Ellen Brockman Integrated Catchment Group 133
15. Comparison of Results with Guidelines
The Australian and New Zealand Water Quality Guidelines for Fresh and Marine Water Quality
(ANZECC & ARMCANZ, 2000) provides trigger values for both ecosystems and human health
protection, as well as the following environmental values: aquatic ecosystems; primary industries;
recreation and aesthetics; and drinking water.
The Guidelines recognise three levels of protection for aquatic ecosystems: areas which high
conservation value, slightly to moderately disturbed ecosystems; and highly disturbed ecosystems.
To assess the level of toxicant contamination in aquatic ecosystems, trigger values were developed
from data using toxicity testing on a range of test species (ANZECC & ARMCANZ, 2000). The
trigger values (99%, 95%, 90% and 80%) approximately correspond to the protection levels
described above. An exceedance of the trigger value indicates that there is the potential for an
impact to occur and should thus trigger a management response such as further investigation and
possible remediation or adaptation of the guidelines according to local conditions (ANZECC &
ARMCANZ, 2000).
The water quality results of the Ellen Brook sampling and analysis program will be compared to the
95% protection level for slight to moderately disturbed ecosystems. This snapshot will compare the
results to the guideline trigger values for aquatic ecosystems and for livestock drinking water where
appropriate.
16. Roles and Responsibilities Ellen Brockman Integrated Catchment Group (EBICG)/Chittering Landcare Centre will have
overall responsibility for this project.
NMI will be responsible for providing the sample bottles and analysing the collected samples.
EBICG, Shire of Chittering and City of Swan will fund the program with support from Swan
River Trust for staff.

Ellen Brook Catchment Sampling and Analysis Plan 2014
Ellen Brockman Integrated Catchment Group 134
Table 5: Costs of water quality analysis of the Ellen Brook catchment 2012 sampling program at NMI.
Parameter Number of Sites Number of Sampling Occasions Cost of Analysis ($) Total Cost of Sampling ($)
Nutrients 2014 Prices Based on 2014 Prices
TSS 27 4 13.93 1504.72
TN 26 4 17.49 1819.27
TP 26 4 14.05 1460.77
Ammonia-N 26 4 10.38 1079.79
NOx-N (Total Ox N) 26 4 8.70 904.29
SRP 26 4 8.70 904.29
DOrganicN 27 4 17.49 1819.27
TorganicN 26 4 0 (Calculated)
TFP 26 4 14.05 1460.77
Setup Cost (fee) 4 0 0
Total Metals
Al 7 4 5.15 164.80
As 7 4 5.15 164.80
Cd 7 4 5.15 164.80
Cr 7 4 5.15 164.80
Cu 7 4 5.15 164.80
Fe 7 4 5.15 164.80
Hg 7 4 5.15 164.80
Ni 7 4 5.15 164.80
Pb 7 4 5.15 164.80
Zn 7 4 5.15 164.80
Setup Cost (fee) 27 4 14.63 58.52
Total Water Hardness 7 4 10.29 329.28
DOC/TOC 2 4 60.04 480.32
DOC Setup 0 0
Blanks 2 118.14 236.28
Replicates 2 118.14 236.28
Admin Fee 4 47.6 190.40
Total (not inc GST) 14132.25
Total (inc GST) 525.13 15545.475

Ellen Brook Catchment Sampling and Analysis Plan 2014
Ellen Brockman Integrated Catchment Group 135
Table 6: Budget for the 2014 Ellen Brook catchment monitoring project.
Item Hours People Hourly Rate Cost
SALARY COSTS
1. Preparation of SAP 15 1 $30.29 $508.36
2. Sampling preparation 30 1 $30.29 $908.70
3. Sample collection 60 2 $30.29 $3634.30
4. Data management (site & program
registration, data entry,
verification/validation)
7.5 2 $30.29 $454.35
5. Preparation/assistance with Report 37.5 2 $30.29 $2271.75
6. Travel costs/courier costs - - - $1200
CONSUMABLE COSTS
1. Analysis costs – Ellen Brook Water Quality
Monitoring Program 2012 (Based on 2012
laboratory analytical prices)
- - - $15545.48
TOTAL (inc GST) $24522.94

Ellen Brook Catchment Sampling and Analysis Plan 2014
Ellen Brockman Integrated Catchment Group 136
17. References
ANZECC and ARMCANZ (2000). National Water Quality Management Strategy: Australia and New
Zealand Water Quality Guidelines for Fresh and Marine Water Quality. Australian and New Zealand
Conservation Council, Agriculture and Resource Management Council of Australia and New Zealand
Department of Water. (2006). Section 1: Water Quality Monitoring Program Design; A Guideline to
the Development of Surface Water Quality Monitoring Programs. Perth, Western Australia: Water
Science Branch, Department of Water.
Department of Water. (2006a). Section 2: Field Sampling Guidelines; A Guideline for Field Sampling
for Surface Water Quality Monitoring Programs. Perth, Western Australia: Water Science Branch,
Department of Water.
Department of Water. (2006b). Section 3: Technical Appendices; Standard Operating Procedures
Water Sampling Methods and Analysis – Parameter Based. Perth, Western Australia: Water Science
Branch, Department of Water.
NHMRC & ARMCANZ (1996). Australian Drinking Water Quality Guidelines. National Health and
Medical Research Council and Agriculture and Resource Management Council of Australia and New
Zealand.
PPK Environment & Infrastructure (2000). Ellen Brook Draft Catchment Management Plan in
association with Acacia Springs Environmental, Land Assessment, Hames Sharley, ERM Mitchell
McCotter and V & C Semeniuk Research Group.
Swan River Trust. (2009). Local Water Quality Improvement Plan: Ellen Brook catchment.

Ellen Brook Catchment Sampling and Analysis Plan 2014
Ellen Brockman Integrated Catchment Group 137
Appendix A: Analytical Requirements (To be attached to all COC forms)
Project: SG-C-Ellen Brook
COC numbers:
Group Analytes Special instructions
A Dissolved Nutrients:
Total Nitrogen
Total oxidised nitrogen
Nitrogen as ammonia
Total Phosphorous
Soluble reactive phosphorus
Total Filterable Phosphorous
Soluble organic nitrogen
To be reported at standard LORs
0.05mg/L
0.01 mg/L
a
0.01 mg/L
0.01mg/L
0.005 mg/L
0.005mg/L
0.025 mg/L
B Total metals:
Cd & Hg
Cr, Cu & Pb
Al, As, Fe, Ni & Zn
To be reported at limits of reporting for
analysis using ANZECC guideline trigger
values:
0.1 µg/L (0.0001 mg/L)
1.0 µg/L (0.001 mg/L)
5.0 µg/L (0.005 mg/L)
C Total Organic Carbon &
Dissolved Organic Carbon
1.0 mg/L (both)
D Total Filterable Phosphorous 0.005 mg/L
Please note:
Total water hardness (TWH) (LOR of 1.0 mg/L) to be extracted from TSS bottle.

Ellen Brook Catchment Sampling and Analysis Plan 2014
Ellen Brockman Integrated Catchment Group 138
Appendix B: Equipment List for Collecting Water Samples (DoW, 2006b)
Twenty-seven 500ml HDPE bottles. Two of the five sampling runs will require two extra for
blanks and replicates. The metal sampling run will require an extra six bottles for Total Water
Hardness.
Calibrated Quanta probe for measurement of in-situ parameters, including the probe cover,
protection cap and surveyor (provided by the Department of Water).
Field filtering equipment – hand pump, filter tower, filter paper and tweezers.
Deionised water for field blanks.
Deionised water spray bottle for cleaning the filter tower.
Tap water for filling the probe protection cap, and drinking water.
Bucket for measurement probes/surveyor.
Sampling and Analysis Plan (SAP)
Safety Plan
Chain of Custody (COC) forms
Field Observation (FOF) forms
Eskies with ice bricks.
Masking tape
Nitrile gloves, gumboots, waders, coveralls, safety glasses, sunscreen, hat, and other protective
gear.
Map of sites.
GPS (if required)
Permanent marker, pencil and pen

Ellen Brook Catchment Sampling and Analysis Plan 2014
Ellen Brockman Integrated Catchment Group 139
Appendix A: Analytical Requirements (To be attached to all COC forms)
Project: SG-C-Ellen Brook
COC numbers:
Group Analytes Special instructions
A Dissolved Nutrients:
Total Nitrogen
Total oxidised nitrogen
Nitrogen as ammonia
Total Phosphorous
Soluble reactive phosphorus
Total Filterable Phosphorous
Soluble organic nitrogen
To be reported at standard LORs
0.05mg/L
0.01 mg/L
0.01 mg/L
0.01mg/L
0.005 mg/L
0.005mg/L
0.025 mg/L
B Total metals:
Cd & Hg
Cr, Cu & Pb
Al, As, Fe, Ni & Zn
To be reported at limits of reporting for
analysis using ANZECC guideline trigger
values:
0.1 µg/L (0.0001 mg/L)
1.0 µg/L (0.001 mg/L)
5.0 µg/L (0.005 mg/L)
C Total Organic Carbon &
Dissolved Organic Carbon
1.0 mg/L (both)
D Total Filterable Phosphorous 0.005 mg/L
Please note:
Total water hardness (TWH) (LOR of 1.0 mg/L) to be extracted from TSS bottle.

Ellen Brook Catchment Sampling and Analysis Plan 2014
Ellen Brockman Integrated Catchment Group 140
Appendix B: Equipment List for Collecting Water Samples (DoW, 2006b)
Twenty-seven 500ml HDPE bottles. Two of the five sampling runs will require two extra for
blanks and replicates. The metal sampling run will require an extra six bottles for Total Water
Hardness.
Calibrated Quanta probe for measurement of in-situ parameters, including the probe cover,
protection cap and surveyor (provided by the Department of Water).
Field filtering equipment – hand pump, filter tower, filter paper and tweezers.
Deionised water for field blanks.
Deionised water spray bottle for cleaning the filter tower.
Tap water for filling the probe protection cap, and drinking water.
Bucket for measurement probes/surveyor.
Sampling and Analysis Plan (SAP)
Safety Plan
Chain of Custody (COC) forms
Field Observation (FOF) forms
Eskies with ice bricks.
Masking tape
Nitrile gloves, gumboots, waders, coveralls, safety glasses, sunscreen, hat, and other protective
gear.
Map of sites.
GPS (if required)
Permanent marker, pencil and pen

Ellen Brook Catchment Sampling and Analysis Plan 2014
Ellen Brockman Integrated Catchment Group 141
Appendix H - Safety Plan Ellen Brook Catchment
Water Quality Monitoring Program
2014
Plate 1: EBN27 Wandena Rd, Muchea (EBICG, 2013)
Prepared by Ellen Brockman Integrated Catchment group:
May 2014
This project is co-funded by the Ellen Brockman Integrated Catchment Group, and the Australian and Western Australian
Government's investment in the Caring for Country administered by the Perth Region NRM.
Ellen Brook Catchment Sampling and Analysis Plan 2014
Ellen Brockman Integrated Catchment Group 142
Table of contents
1. INTRODUCTION ......................................................................................................................................... 142
2. SITE ASSESSMENT .................................................................................................................................... 143
3. SAMPLING SITE LOCATIONS .................................................................................................................. 143
TABLE 1: LOCATION AND DESCRIPTION OF SAMPLING SITES IN THE ELLEN BROOK CATCHMENT ......................... 143
4. PERSONAL PROTECTION AND EQUIPMENT ....................................................................................... 146
5. ACCESS TO MEDICAL HELP .................................................................................................................... 147
6. IMPORTANT CONTACT NUMBERS: ....................................................................................................... 147
TABLE 2: EMERGENCY CONTACT LIST ................................................................................................................. 147
7. HAZARD IDENTIFICATION ...................................................................................................................... 149
TABLE 3: RISK ASSESSMENT ................................................................................................................................ 149
8. EXPERIENCE OF SAMPLING PERSONNEL ........................................................................................... 149
List of Plates
Plate 1: Wetland at the top of rock creek catchment (EBICG 2010)
List of Figures
Figure 1: Location of Sampling Sites within the Ellen Brook catchment. ................... 145

Ellen Brook Catchment Sampling and Analysis Plan 2014
Ellen Brockman Integrated Catchment Group 143
1. Introduction
The purpose of the safety plan is to provide personnel undertaking water quality sampling within the
Ellen Brook catchment with safety and health requirements. The safety plan indicates all potential areas
of risk to personnel before, during and after the sampling and recommends specific strategies to
minimise this risk. Occupational health, safety and welfare in the workplace is a shared responsibility
and the Chittering Landcare Centre relies on consultation, commitment and participation from all
officers.
All employees have the responsibility for ensuring their own health, safety and welfare, reporting
hazards in the work area and following established practices and procedures aimed at providing a safe
and healthy work environment for all. This plan should be used in conjunction with the Chittering
Landcare Centre’s Occupational Health & Safety Policy, particularly the following protocol related to
officers undertaking field work:
Before departing the office for field work, the worker must ensure that they;
o Post their itinerary including specific details of times, location and contact mobile
telephone on the staff notice board. If possible a contact landholder name and phone
number should be provided.
o Are suitably clothed with protective clothing and boots for the task.
o Have all their safety equipment, adequate drinking water and first aid equipment in their
vehicle.
o Have their mobile phone with them and the battery is charged.
o Have adequate fuel in their vehicle for the task.
The worker is to contact a staff member at the Chittering Landcare Centre no later than 1 hour
after their nominated time of return. The details of these checks are to be recorded next to the
worker’s name on the notice board.
If no contact has been made within one (I) hour of the lone worker’s nominated time of return,
Chittering Landcare Centre officers are instructed to attempt to make contact with the worker,
either by using the contact details posted on the notice board, or the designated mobile
telephone.
If no response is received from the worker following attempts to make contact, inform the staff,
Chittering Landcare Centre Manager or a senior officer from the Shire of Chittering (CEO,
Deputy CEO or Shire Ranger) whose contact details are posted on the notice board. A search
will then be initiated using the lone worker’s stated itinerary.

Ellen Brook Catchment Sampling and Analysis Plan 2014
Ellen Brockman Integrated Catchment Group 144
2. Site assessment
All sites involve foreshore environments and are accessed by road, and the issues involved for all sites
are included in the “Hazard Identification” Table within this plan. Most sites are publicly available and
accessible, with the exception of EBN4 (Chandala South) which is located on Tiwest land. As such,
the policies of the mining company must be adhered to whilst sampling at this site. This includes
wearing a safety vest, helmet, protective eyewear and signing in/out at reception when entering &
exiting the site.
3. Sampling site locations
Table 11: Location and description of sampling sites in the Ellen Brook Catchment
Site
no.
Site Name Waterway section/
Component
Location Northing Easting
EBN1 Lennard Brook Lennard Brook Lennard Brook Road 6527771 0396613
EBN2 Airfield Road North Chandala/Ellen Brook
(Bambun Lakes)
Airfield Road 6519428 0397101
EBN3 Chandala West Chandala Brook West Brand Hwy west loc # 853 6511801 0400463
EBN4 Chandala South Chandala Brook South Brand Hwy east / TIWest 6510846 0401302
EBN5 Yal Yal Brook Yal Yal Brook Reserve Road 6514458 0404923
EBN6 Rocky Gully Creek Rocky Gully Creek Old Gingin Rd 6509047 0403714
EBN7 Wandena North Waterway to Ellen Brook Wandena North - Great
Northern Highway
6507384 0404384
EBN8 Wandena South Waterway to Ellen Brook Wandena South - Great
Northern Highway
6506686 0404561
EBN9 Brand Highway Bridge
Ellen Brook - Muchea Central Bridge on Brand Hwy south 6505838 0404093
EBN10 Muchea East Waterway to Ellen Brook
Muchea East
Great Northern/Brand
Highways
6505833 0404780
EBN11 Muchea North Waterway to Ellen Brook - Muchea south /Railway Rd 491 chit/swan sign
6500336 0404611
EBN13 Rutland Road Ellen Brook (upper) Rutland Road bridge 6498117 0406044
EBN14 Nutrient Inflow Waterway – Nutrient
stripping inflow
Bingham Road/ Department
of Defence
6496871 0405690
EBN15a Nutrient Outflow Waterway - Nutrient stripping Pond outflow
Bingham Road/ Department of Defence
6496885 0405757
EBN16a Bulls Brook Bullsbrook South past Strachan on
Railway Rd
6495684 0405054
EBN17 Warren Road Mid Ellen Brook Warren Road 6493379 0406685
EBN18 Gauging Station Ellen Brook - Almeria Gauging Station
Almeria Parade/Apple Street 6486743 0407638
EBN19 Belhus Reserve Lower Ellen Brook Belhus Reserve Millhouse Rd
Bridge
6483685 0406519
EBN21 Lower Yal Yal Yal Yal Brook South Old Gingin Road 6509922 0403110
EBN22 Ki-it Brook Ki-it Brook Warren Road 6493382 0406959
EBN23 Peters Road Waterway to Ellen Brook –Muchea townsite
Peters Road 6505232 0403580
EBN24 Stock Road Waterway to Ellen Brook
West
Railway Parade 6492415 0405221
EBN25 Sawpit Gully Waterway to Ellen Brook –
The Vines north
Lot 4/285 Railway Parade,
Upper Swan
6486777 0407430
EBN26 Egerton Waterway from Egerton
Estate to Ellen Brook
Corona Way 6483859 0405129

Ellen Brook Catchment Sampling and Analysis Plan 2014
Ellen Brockman Integrated Catchment Group 145
EBN27 Wandena Road Waterway to Ellen Brook Corner of Great Northern Hwy and Wandena Road
6502590 0406553
EBN28 Upper Yal Yal Yal Yal Brook North Great Northern Hwy 6516783 0409421
EBN29 Roxburghe Avenue Drain leading to Ellen Brook from The Vines east
Roxburghe Avenue 6486603 0406975

Ellen Brook Catchment Sampling and Analysis Plan 2014
Ellen Brockman Integrated Catchment Group 146
Figure 36: Location of Sampling Sites within the Ellen Brook catchment.

Ellen Brook Catchment Sampling and Analysis Plan 2014
Ellen Brockman Integrated Catchment Group 147
4. Personal protection and equipment
Officers involved in water sampling activities should heed the following to ensure that their personal
safety outside of the office is made a priority.
A mobile phone should be carried so that contact can be made with the office at specified times
or for emergency.
All work vehicles should be equipped with a first aid kit.
All work vehicles should be equipped with a current fire extinguisher.
All workers who work in isolated conditions in the field should have a current Senior First Aid
certificate or first aid training to suit their particular needs.
Workers driving four wheel drive vehicles should be trained in driving in such conditions.
Personnel should wear thin nitrile gloves and eye protection whilst collecting water samples.
If entering the water, waders or gum boots should be worn. The alternative to gum boots if not
entering the water is steel capped, enclosed leather boots.
Normal sun-protection should be adopted (hat, long sleeves and sunscreen) as the sampling is
an outdoor activity. In the case of rain, a raincoat or weatherproof jacket should be worn.
Adequate water (at least 5 litres) should be carried on board the vehicle at all times and is
located in the tray of the Ute. Drinking water regularly when out in the field is vital to prevent
dehydration, particularly in warmer months.
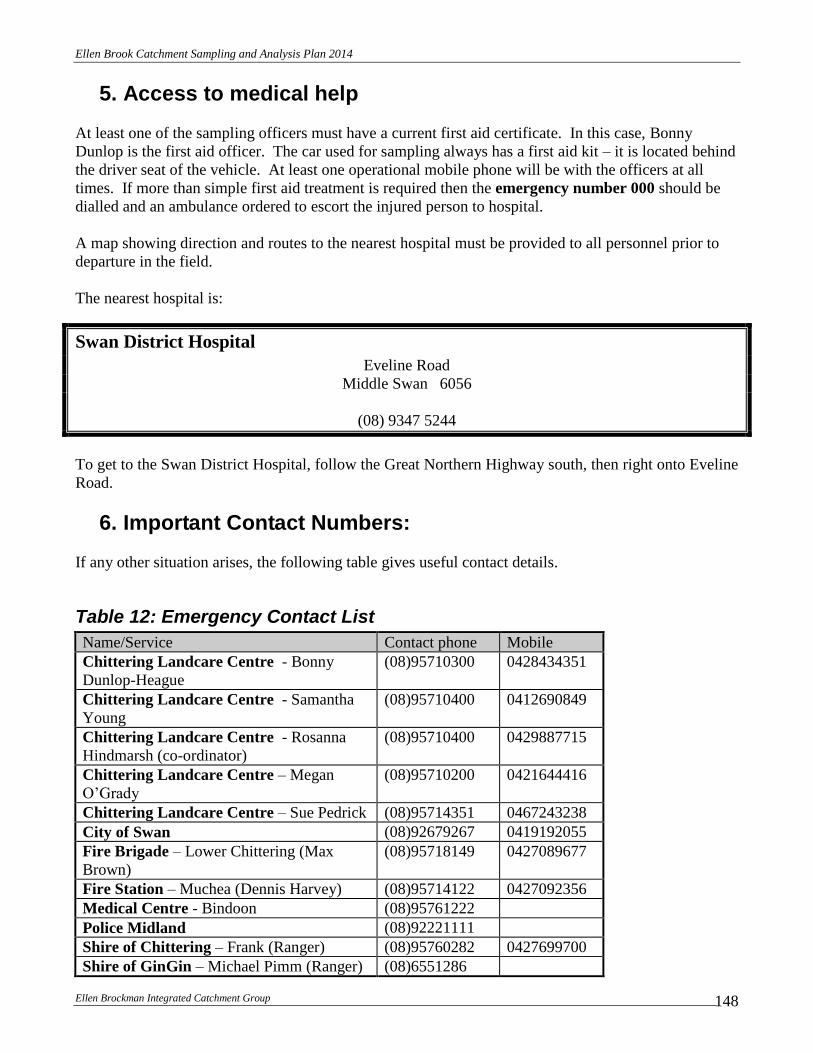
Ellen Brook Catchment Sampling and Analysis Plan 2014
Ellen Brockman Integrated Catchment Group 148
5. Access to medical help
At least one of the sampling officers must have a current first aid certificate. In this case, Bonny
Dunlop is the first aid officer. The car used for sampling always has a first aid kit – it is located behind
the driver seat of the vehicle. At least one operational mobile phone will be with the officers at all
times. If more than simple first aid treatment is required then the emergency number 000 should be
dialled and an ambulance ordered to escort the injured person to hospital.
A map showing direction and routes to the nearest hospital must be provided to all personnel prior to
departure in the field.
The nearest hospital is:
Swan District Hospital
Eveline Road
Middle Swan 6056
(08) 9347 5244
To get to the Swan District Hospital, follow the Great Northern Highway south, then right onto Eveline
Road.
6. Important Contact Numbers:
If any other situation arises, the following table gives useful contact details.
Table 12: Emergency Contact List
Name/Service Contact phone Mobile
Chittering Landcare Centre - Bonny
Dunlop-Heague
(08)95710300 0428434351
Chittering Landcare Centre - Samantha
Young
(08)95710400 0412690849
Chittering Landcare Centre - Rosanna
Hindmarsh (co-ordinator)
(08)95710400 0429887715
Chittering Landcare Centre – Megan
O’Grady
(08)95710200 0421644416
Chittering Landcare Centre – Sue Pedrick (08)95714351 0467243238
City of Swan (08)92679267 0419192055
Fire Brigade – Lower Chittering (Max
Brown)
(08)95718149 0427089677
Fire Station – Muchea (Dennis Harvey) (08)95714122 0427092356
Medical Centre - Bindoon (08)95761222
Police Midland (08)92221111
Shire of Chittering – Frank (Ranger) (08)95760282 0427699700
Shire of GinGin – Michael Pimm (Ranger) (08)6551286

Ellen Brook Catchment Sampling and Analysis Plan 2014
Ellen Brockman Integrated Catchment Group 149
Perth Region NRM – Administration (08)93743333
Tronox – James Owen (Environmental
Officer)
(08)95719246 0439912908
Tiwest – Reception (08)95719333

Ellen Brook Catchment Sampling and Analysis Plan 2014
Ellen Brockman Integrated Catchment Group 150
Hazard identification
All personnel must be trained in identification of potential hazards at a sampling site. This involves
listing potential dangers to sampling personnel when at the sampling site, such as collapse of stream
bank, falling into the stream, and contact with water from the stream, exposure to heat, wind and rain.
All personnel must be briefed of potential hazards at sample sites.
There is a potential for exposure to very acidic waters. Entry into the drains/waterways must be done
wearing protective clothing unless pH has been determined to be within safe limits (pH 5.5-8).
Table 13: Risk Assessment
Identified Risk Precautions
Exposure to chemicals and handling of
contaminated samples & sampling or
entering potentially low pH waters.
Wear protective clothing at all times: field
boots or gum boots, nitrile gloves (waders
if expecting to go into water at above
ankle level).
Physical injury from falling (especially
steep slopes with sandy banks)
Inspect accessibility to site before
transferring equipment from car. If site is
too steep, unstable or otherwise dangerous
do not sample.
Insect, spider, rodent or snake bites. Inspect site prior to sampling, especially
drain culvert openings and wear long pants
and high boots for walking through long
grass.
Traffic on roads near sites Bright safety vest with reflective strip
should be worn when working along road
sides and care should be taken to watch
out for traffic at all times. Hazard lights
should be left on vehicle whilst sampling.
Manual handling of heavy equipment and
eskies/samples
Wear work boots and lift heavy objects
ensuring no risk to back. If necessary, use
two people to lift larger eskies.
Sampling at sites where algal scums are
present
Always wear nitrile gloves when sampling
and avoid contact with water. Take care
when handling food after sampling.
Sunburn, exposure (dehydration and heat
stroke, exposure to cold).
Apply sunscreen, wear hats, rain jackets,
work pants, jumpers as appropriate. Take
plenty of drinking water (labelled as
drinking water and kept separate from
sample bottles).
7. Experience of sampling personnel

Ellen Brook Catchment Sampling and Analysis Plan 2014
Ellen Brockman Integrated Catchment Group 151
Samples should only be collected by personnel who have received training from the Aquatic Science
Branch of the Department of Environment or a recognised authority.