ellipsiz ltd · at ellipsiz, our forward strategy is supported by 3 pillars that underpin our...
TRANSCRIPT

Annual Report 2012
ON TRACK FORPROGRESS...
(Reg. No. 199408329R)
29 Woodlands Industrial Park E1#04-03 NorthTech Lobby 1 Singapore 757716Tel : (65) 6311 8500Fax : (65) 6269 2628Email : [email protected] : www.ellipsiz.com
ELLIP
SIZ
LTD
/ Annual R
eport 2
012

corporate directory
SINGAPORE
Ellipsiz Ltd – Headquarters29 Woodlands Industrial Park E1#04-03 NorthTech Lobby 1 Singapore 757716 Tel: (65) 6311 8500Fax: (65) 6269 2628
Ellipsiz Singapore Pte Ltd29 Woodlands Industrial Park E1#04-03 NorthTech Lobby 1 Singapore 757716 Tel: (65) 6311 8500Fax: (65) 6518 2222
Ellipsiz DSS Pte Ltd29 Woodlands Industrial Park E1#04-03 NorthTech Lobby 1 Singapore 757716 Tel: (65) 6518 2200Fax: (65) 6518 2222
iNETest Resources Pte Ltd 29 Woodlands Industrial Park E1#04-03 NorthTech Lobby 1 Singapore 757716 Tel: (65) 6518 2200Fax: (65) 6518 2222
SV Probe Pte Ltd29 Woodlands Industrial Park E1#04-01 NorthTech Lobby 1 Singapore 757716 Tel: (65) 6769 8233Fax: (65) 6765 8183
Ellipsiz Communications Pte Ltd29 Woodlands Industrial Park E1#04-03 NorthTech Lobby 1 Singapore 757716Tel: (65) 6518 2200Fax: (65) 6518 2222
Ellipsiz TestLab Pte Ltd29 Woodlands Industrial Park E1#04-03 NorthTech Lobby 1 Singapore 757716 Tel: (65) 6518 2200Fax: (65) 6518 2222
FMB Industries Pte Ltd29 Woodlands Industrial Park E1#04-03 NorthTech Lobby 1 Singapore 757716 Tel: (65) 6518 2200Fax: (65) 6518 2222
E+HPS Pte Ltd152 Paya Lebar Road #06-03Citipoint@Paya LebarSingapore 409020Tel: (65) 6841 4833Fax: (65) 6841 0838
MALAYSIA
iNETest Malaysia Sdn Bhd (Penang Headquarters)50 Persiaran Bayan IndahBayan Bay 11900 Bayan Lepas Penang MalaysiaTel: (60) 4 642 5035Fax: (60) 4 642 9035
iNETest Malaysia Sdn Bhd (Kuala Lumpur Offi ce)29A Jalan SS 21/37 Damansara Utama 47400 Petaling JayaSelangor Darul Ehsan MalaysiaTel: (60) 3 7729 2035Fax: (60) 3 7726 6315
iNETest Malaysia Sdn Bhd (Penang Service Centre)Bay Avenue, Block H-8-1,Lorong Bayan Indah Dua, 11900 Bayan LepasPenang MalaysiaTel: (60) 4 642 5282Fax: (60) 4 642 9282
iNETest Malaysia Sdn Bhd(Kuching Offi ce)Lot 9706, 1st Floor Section 64 KTLD,Jalan Pending, Kuching, 93450Sarawak, MalaysiaTel: (60) 8 248 1201 Fax: (60) 8 248 3231
CHINA
Ellipsiz (Shanghai) International Ltd4F No. 2 Jia Li Building201 Keyuan Road Zhang Jiang Hi-Tech ParkPudong Shanghai 201203 ChinaTel: (86) 21 5027 0969Fax: (86) 21 5027 0968
Ellipsiz Semilab (Shanghai) Co., Ltd4F No. 2 Jia Li Building201 Keyuan Road Zhang Jiang Hi-Tech ParkPudong Shanghai 201203 ChinaTel: (86) 21 5027 0969Fax: (86) 21 5027 0968
Suzhou Silicon Information Technology Co., LtdM3#1F Microsystem ParkPeiyuan Road S.N.D SuzhouJiangsu 215163 ChinaTel: (86) 512 6689 4756Fax: (86) 512 6841 6855
E+HPS Engineering (Suzhou) Co., Ltd Unit 14 3F Building A5 Xing Han StreetSuzhou 215021 ChinaTel: (86) 512 6767 2671Fax: (86) 512 6767 2673
HPS Engineering (Suzhou) Co., Ltd Unit 14 3F Building A5 Xing Han StreetSuzhou 215021 ChinaTel: (86) 512 6767 2671Fax: (86) 512 6767 2673
iNETest (Suzhou) Co., LtdUnit 13-14 3F Building A 5 Xing Han StreetSuzhou 215021 ChinaTel: (86) 512 6762 3789Fax: (86) 512 6762 3790
iNETest Resources (China) Co., Ltd (Shanghai Headquarters)Unit K 19F Hua Min Empire PlazaNo. 726 Yan An Road (W) Shanghai 200050 ChinaTel: (86) 21 5238 3300Fax: (86) 21 5238 3301
iNETest Resources (China) Co., Ltd(Shenzhen Rep Offi ce)Room 211, 2nd Floor, Block205,TaiRan Industrial Park,Che Gong Miao Area, FuTian, Shenzhen Shenzhen 518040 ChinaTel: (86) 755 8343 9855Fax: (86) 755 8343 4429
SV Probe (SIP) Co., LtdNo. B1-3 Weiting Industrial Square,Weixin Road, Suzhou Industrial ParkJiangsu Province 215122 ChinaTel: (86) 512 6275 2330Fax: (86) 512 6275 2275
TAIWAN
Ellipsiz Taiwan Inc.No. 251 Jen-Ru Road Junan Miaoli HsienTaiwan 350 R.O.C.Tel: (886) 3 656 1595Fax: (886) 3 552 0347
Ellipsiz Taiwan Second Source Inc. 3F No. 35 Sintai RoadJhubei City Hsin Chu County Taiwan 302 R.O.C. Tel: (886) 3 656 1595Fax: (886) 3 552 0347
Ellipsiz Communications Taiwan Ltd8F No. 96 Section 1 Jianguo North RoadJhongshan District Taipei City Taiwan 10489, R.O.C. Tel: (886) 2 2515 9596Fax: (886) 2 2500 0055
SV Probe Technology Taiwan Co., Ltd3F No. 35 Sintai RoadJhubei City Hsin Chu County Taiwan 302 R.O.C. Tel: (886) 3 656 5188Fax: (886) 3 554 4150
THAILAND
iNETest Resources (Thailand) Ltd(Bangkok Headquarters)719 4th Floor KPN Tower Rama 9 Road Kwaeng Bangkapi KhetHuaykwang Bangkok Thailand 10310Tel: (66) 2 717 1400Fax: (66) 2 717 1422
iRC Technologies Limited719 4th Floor KPN Tower Rama 9 Road Kwaeng Bangkapi KhetHuaykwang Bangkok Thailand 10310Tel: (66) 2 717 1400Fax: (66) 2 717 1422
NEW ZEALAND
Ellipsiz Communications (NZ) LimitedPencarrow House1-3 Willeston Street Level 7Wellington, New ZealandTel: (64) 4 495 8941Fax: (64) 4 495 8950
FRANCE
SV Probe Technology SAS17 Square Edouard VIIParis 75009 FranceTel: +33 (0) 1 4439 9514Fax: +33 (0) 9 7006 4901
USA
SV Probe Inc. (Corporate Headquarters)9185 South Farmer AvenueSuite 105Tempe, AZ 85284 USATel: (480) 635 4700Fax: (480) 558 7440
SV Probe Inc.(Santa Clara Facility)4251 Burton DriveSanta Clara CA 95054 USATel: (408) 727 6341Fax: (408) 492 1424
INDIA
iNETest Technologies India Pvt. Limited (Chennai Headquarters)11th Floor Block C & D Ega Trade Centre809 Poonamallee High Road Kilpauk Chennai 600010 IndiaTel: (91) 44 2661 0171 (91) 44 2640 0779 (91) 44 2640 0781Fax: (91) 44 2661 0172
iNETest Technologies India Pvt. Ltd(Bangalore)304-308 Sophia’s Choice, 3rd Floor7 St. Mark’s RoadBangalore 560001 IndiaTel: (91) 80 4272 0011 to 4272 0040 (91) 80 4272 0000Fax: (91) 80 4272 0010
iNETest Technologies India Pvt. Ltd(Mumbai)702 A - Wing Sagartech Plaza Andheri-Kurla Road Sakinaka Junction Mumbai 400072 IndiaTel: (91) 22 2852 3910Fax: (91) 22 2852 3907
iNETest Technologies India Pvt. Ltd(New Delhi)LB 2 Prakash Deep BuildingNo.7 Tolstoy Marg Connaught PlaceNew Delhi 110001 IndiaTel: (91) 11 2371 7548Fax: (91) 11 2371 7548
iNETest Technologies India Pvt. Ltd(Pune)Destination Centre, T17 3rd FloorMagarpatta City,HadapsarPune 411028 IndiaTel: (91) 20 6600 9804Fax: (91) 20 6600 9808
VIETNAM
SV Probe Vietnam Co., Ltd37A VSIP Street 6Vietnam Singapore Industrial ParkThuan An TownBinh Duong Province Vietnam 72500Tel: (84) 650 3784301/2/3, 3768855/6/7Fax: (84) 650 3784304, 3768858
iNETest Newtek Co. Ltd.(Hanoi Headquarters)Suite 401 Van Phuc Toserco Building, No 1294 Valley Kim Ma, Ba Dinh DistrictHanoi VietnamTel: (84) 4 3 787 5489Fax: (84) 4 3 787 5490
iNETest Newtek Co. Ltd.(Ho Chi Minh City Branch)Unit 0.1 Thanh Quan Building12C1 Nguyen Thi Minh Khai StDaKao Ward District 1HCMC VietnamTel: (84) 8 3 910 7488Fax: (84) 8 3 911 0711
CONTENTS
1 introduction 2 our vision and mission 3 about ellipsiz / our fi nancials at a glance4 our geographical footprint 6 letter to shareholders 8 operations review14 board of directors 16 key executives 17 corporate information 18 corporate governance26 fi nancial review 28 industry outlook 31 risks management 33 fi nancial statements106 statistics of shareholders 107 notice of annual general meeting / proxy form

At Ellipsiz, our forward strategy is supported by 3 pillars that underpin our
ability to stay resilient amid trying conditions: the strategic synergy of
our geographical presence, our ties with and support from our partners and
our perseverance to exceed expectations.

2ELLIP
SIZ
LTD
/ A
nnual
Report
2012
To enable our customers and business partners to achieve their goals optimally, we offer innovative and integrated solutions.
ission
isionTo be the best creator of value for customers, business partners and stakeholders in the markets that we participate in.
ELLIP
SIZ
LTD
/ A
nnual
Report
2012
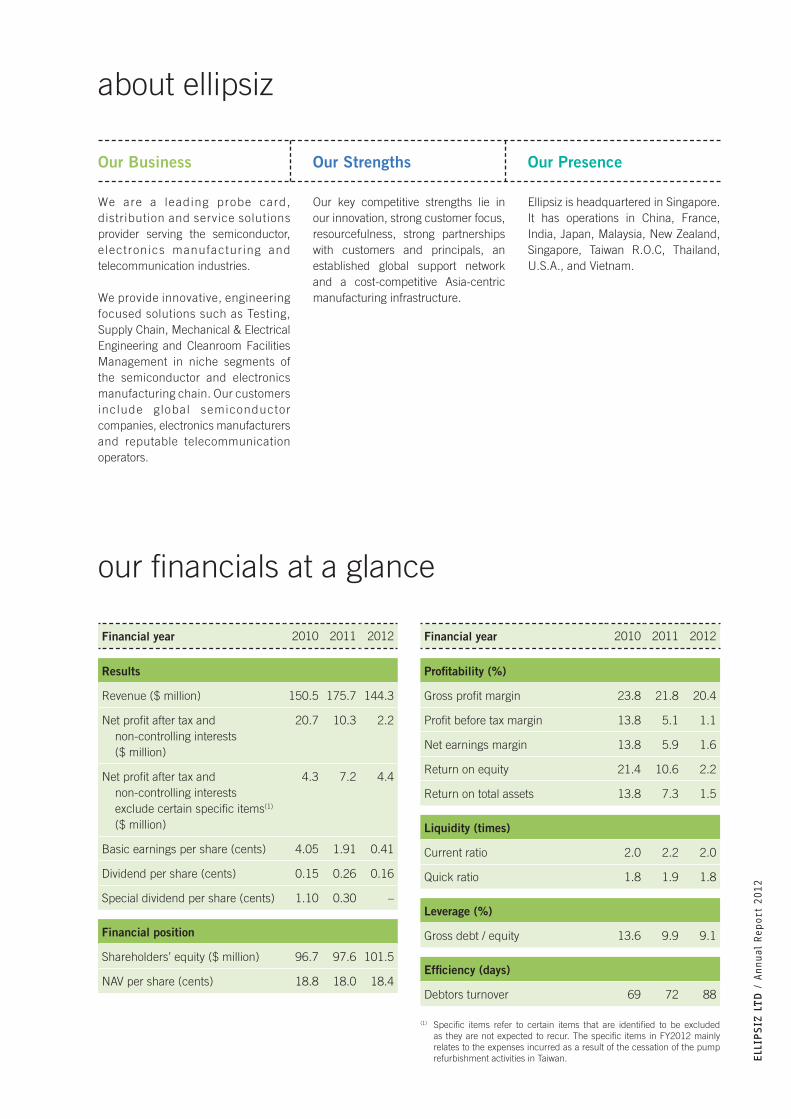
Our Business
We are a leading probe card, distribution and service solutions provider serving the semiconductor, e lectronics manufactur ing and telecommunication industries.
We provide innovative, engineering focused solutions such as Testing, Supply Chain, Mechanical & Electrical Engineering and Cleanroom Facilities Management in niche segments of the semiconductor and electronics manufacturing chain. Our customers include global semiconductor companies, electronics manufacturers and reputable telecommunication operators.
about ellipsiz
Our Strengths
Our key competitive strengths lie in our innovation, strong customer focus, resourcefulness, strong partnerships with customers and principals, an established global support network and a cost-competitive Asia-centric manufacturing infrastructure.
Our Presence
Ellipsiz is headquartered in Singapore. It has operations in China, France, India, Japan, Malaysia, New Zealand, Singapore, Taiwan R.O.C, Thailand, U.S.A., and Vietnam.
our fi nancials at a glance
Financial year 2010 2011 2012
Profi tability (%)
Gross profi t margin 23.8 21.8 20.4
Profi t before tax margin 13.8 5.1 1.1
Net earnings margin 13.8 5.9 1.6
Return on equity 21.4 10.6 2.2
Return on total assets 13.8 7.3 1.5
Liquidity (times)
Current ratio 2.0 2.2 2.0
Quick ratio 1.8 1.9 1.8
Leverage (%)
Gross debt / equity 13.6 9.9 9.1
Effi ciency (days)
Debtors turnover 69 72 88
(1) Specifi c items refer to certain items that are identifi ed to be excluded
as they are not expected to recur. The specifi c items in FY2012 mainly relates to the expenses incurred as a result of the cessation of the pump refurbishment activities in Taiwan.
Financial year 2010 2011 2012
Results
Revenue ($ million) 150.5 175.7 144.3
Net profi t after tax and non-controlling interests ($ million)
20.7 10.3 2.2
Net profi t after tax and non-controlling interests exclude certain specifi c items(1) ($ million)
4.3 7.2 4.4
Basic earnings per share (cents) 4.05 1.91 0.41
Dividend per share (cents) 0.15 0.26 0.16
Special dividend per share (cents) 1.10 0.30 –
Financial position
Shareholders’ equity ($ million) 96.7 97.6 101.5
NAV per share (cents) 18.8 18.0 18.4

4ELLIP
SIZ
LTD
/ A
nnual
Report
2012
Probe Card Solutions
Our probe card business, operated through wholly-owned
subsidiary, SV Probe, is one of the global leaders in the design
and manufacture of custom, engineered-to-order probing
solutions for the semiconductor industry.
Probe cards are used in the electrical testing of semiconductor
wafers before they are diced, packaged and placed into
products such as smart phones, tablets, MP3 players and global
positioning systems. According to VLSI Research, global probe
card market revenue (including spares and services) in 2011
was approximately US$1.2 billion. It is projected to grow at 4.5%
a year to US$1.5 billion in 2016 with majority of the revenue
from advanced probe cards such as vertical, MEMS-based and
spring-pin (VLSI Research, May 2012).
our geographical footprint
SV Probe has a well-diversifi ed portfolio of test solutions
supporting a wide spectrum of Logic and Analog customers.
Its ability to consistently deliver high-quality, cost-competitive
and innovative turnkey probe solutions timely to our customers
is one that has set SV apart from its competitors. Through the
years, its customer-focused strategies, R&D strengths and global
infrastructure have enabled SV to foster strong partnerships
with its customers in developing innovative probe solutions for
fi ne pad pitch applications, high parallelism and WLCSP. These
application-specifi c products not only address the challenges
of shrinking chip geometries, they achieve higher performance
demands as well.
California
Arizona

ELLIP
SIZ
LTD
/ A
nnual
Report
2012
Distribution & Services Solutions
We distribute a wide range of manufacturing, testing and
inspection/measurement equipment to the semiconductor,
electronics manufacturing and telecommunication industries.
Key equipment we distribute includes lithography equipment,
electronic test & measurement instruments and systems,
communications test & measurement tools and systems as well
as failure and reliability testing chambers.
We also provide extensive suite of complementary outsourcing
services that include software programming, equipment
engineering support services, supply chain management of
specialised consumables, reliability testing services, calibration
of test & measurement equipment services, cleanroom facilities
as well as mechanical & electrical engineering services, etc.
Always focusing on delivering innovative and engineering-
focused solutions to meet our customers’ specifi c needs, we
leverage on our knowledge base and extensive network to offer
cost-competitive solutions.
Japan
VietnamThailand
Taiwan
New Zealand
France
India
SuzhouShanghai
Shenzhen
HEADQUARTER MANUFACTURINGFACILITIES
SALES/SERVICE CENTRES
Singapore
Malaysia
6ELLIP
SIZ
LTD
/ A
nnual
Report
2012
letter to shareholders
$144REVENUE
million
$2
NET PROFIT AFTER TAX AND
NON-CONTROLLING INTERESTS
million
0.16TOTAL CASH
DIVIDEND FOR FY2012
cents per share
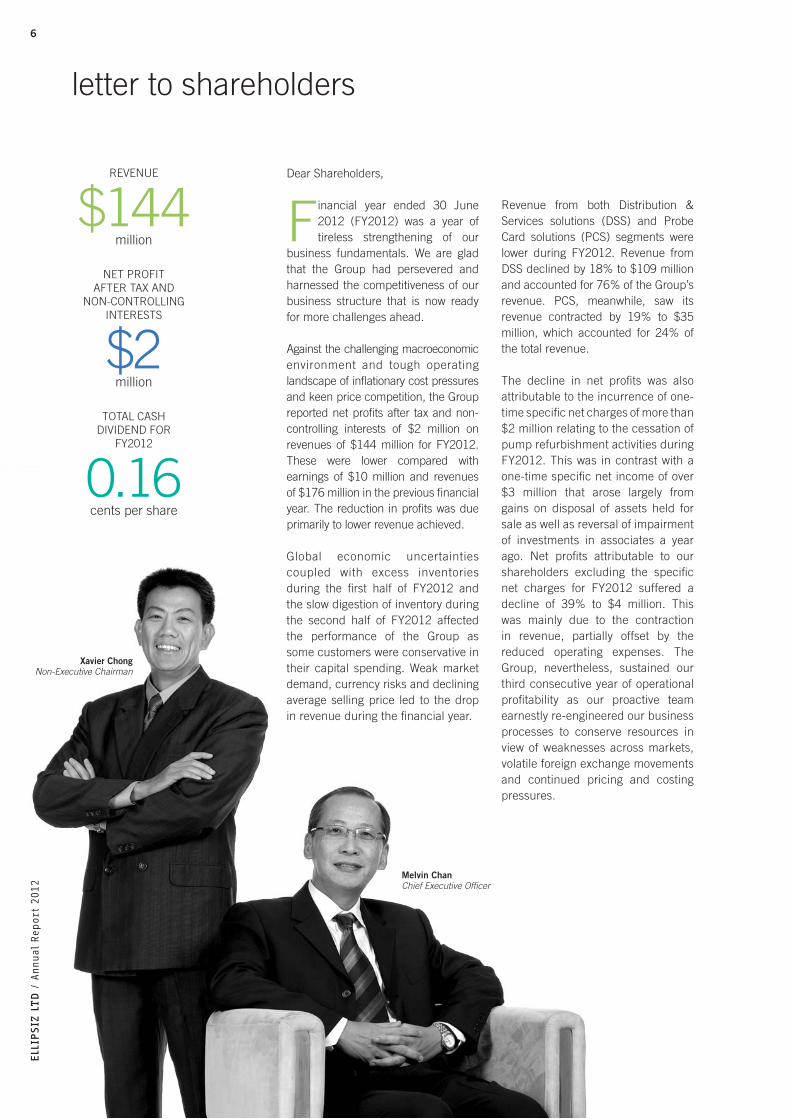
Dear Shareholders,
Financial year ended 30 June 2012 (FY2012) was a year of tireless strengthening of our
business fundamentals. We are glad that the Group had persevered and harnessed the competitiveness of our business structure that is now ready for more challenges ahead.
Against the challenging macroeconomic environment and tough operating landscape of infl ationary cost pressures and keen price competition, the Group reported net profi ts after tax and non-controlling interests of $2 million on revenues of $144 million for FY2012. These were lower compared with earnings of $10 million and revenues of $176 million in the previous fi nancial year. The reduction in profi ts was due primarily to lower revenue achieved.
Global economic uncertainties coupled with excess inventories during the fi rst half of FY2012 and the slow digestion of inventory during the second half of FY2012 affected the performance of the Group as some customers were conservative in their capital spending. Weak market demand, currency risks and declining average selling price led to the drop in revenue during the fi nancial year.
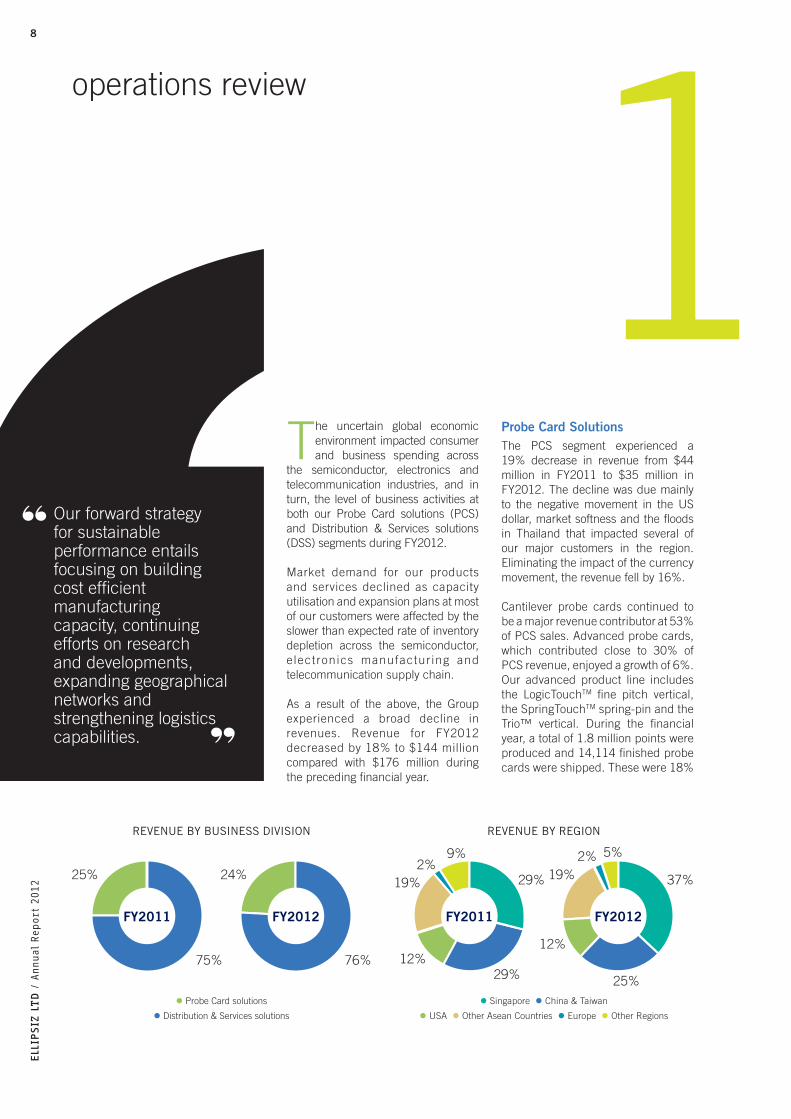
Revenue from both Distribution & Services solutions (DSS) and Probe Card solutions (PCS) segments were lower during FY2012. Revenue from DSS declined by 18% to $109 million and accounted for 76% of the Group’s revenue. PCS, meanwhile, saw its revenue contracted by 19% to $35 million, which accounted for 24% of the total revenue.
The decline in net profi ts was also attributable to the incurrence of one-time specifi c net charges of more than $2 million relating to the cessation of pump refurbishment activities during FY2012. This was in contrast with a one-time specifi c net income of over $3 million that arose largely from gains on disposal of assets held for sale as well as reversal of impairment of investments in associates a year ago. Net profi ts attributable to our shareholders excluding the specifi c net charges for FY2012 suffered a decline of 39% to $4 million. This was mainly due to the contraction in revenue, partially offset by the reduced operating expenses. The Group, nevertheless, sustained our third consecutive year of operational profi tability as our proactive team earnestly re-engineered our business processes to conserve resources in view of weaknesses across markets, volatile foreign exchange movements and continued pricing and costing pressures.
Xavier ChongNon-Executive Chairman
Melvin ChanChief Executive Offi cer
ELLIP
SIZ
LTD
/ A
nnual
Report
2012
7
ELLIP
SIZ
LTD
/ A
nnual
Report
2012
While the search for growth engines continues, the zealous focus to refi ne and redefi ne our operating and business structures remains a cornerstone strategy in staying relevant and nimble, particularly in the capturing of market ripening opportunities in existing, new and emerging industries.
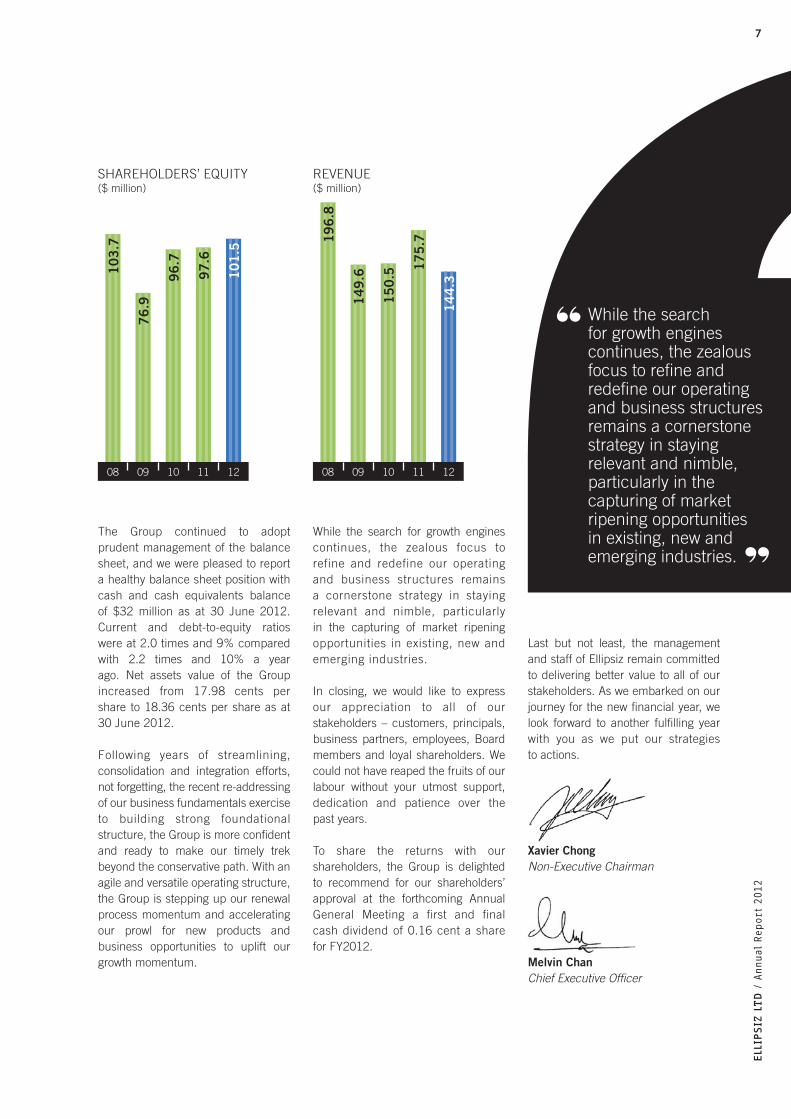
The Group continued to adopt prudent management of the balance sheet, and we were pleased to report a healthy balance sheet position with cash and cash equivalents balance of $32 million as at 30 June 2012. Current and debt-to-equity ratios were at 2.0 times and 9% compared with 2.2 times and 10% a year ago. Net assets value of the Group increased from 17.98 cents per share to 18.36 cents per share as at 30 June 2012.
Following years of streamlining, consolidation and integration efforts, not forgetting, the recent re-addressing of our business fundamentals exercise to building strong foundational structure, the Group is more confi dent and ready to make our timely trek beyond the conservative path. With an agile and versatile operating structure, the Group is stepping up our renewal process momentum and accelerating our prowl for new products and business opportunities to uplift our growth momentum.
While the search for growth engines continues, the zealous focus to refine and redefine our operating and business structures remains a cornerstone strategy in staying relevant and nimble, particularly in the capturing of market ripening opportunities in existing, new and emerging industries.
In closing, we would like to express our appreciation to all of our stakeholders – customers, principals, business partners, employees, Board members and loyal shareholders. We could not have reaped the fruits of our labour without your utmost support, dedication and patience over the past years.
To share the returns with our shareholders, the Group is delighted to recommend for our shareholders’ approval at the forthcoming Annual General Meeting a first and final cash dividend of 0.16 cent a share for FY2012.
Last but not least, the management and staff of Ellipsiz remain committed to delivering better value to all of our stakeholders. As we embarked on our journey for the new fi nancial year, we look forward to another fulfi lling year with you as we put our strategies to actions.
Xavier ChongNon-Executive Chairman
Melvin ChanChief Executive Offi cer
SHAREHOLDERS’ EQUITY($ million)
REVENUE($ million)
08 09 10 11 12 08 09 10 11 12
10
3.7
76
.9
96
.79
7.6 97
.6
10
1.5
19
6.8
14
9.6
15
0.5
17
5.7
14
4.3
8ELLIP
SIZ
LTD
/ A
nnual
Report
2012
operations review
1Our forward strategy for sustainable performance entails focusing on building cost effi cient manufacturing capacity, continuing efforts on research and developments, expanding geographical networks and strengthening logistics capabilities.
The uncertain global economic environment impacted consumer and business spending across
the semiconductor, electronics and telecommunication industries, and in turn, the level of business activities at both our Probe Card solutions (PCS) and Distribution & Services solutions (DSS) segments during FY2012.
Market demand for our products and services declined as capacity utilisation and expansion plans at most of our customers were affected by the slower than expected rate of inventory depletion across the semiconductor, e lectronics manufactur ing and telecommunication supply chain.
As a result of the above, the Group experienced a broad decline in revenues. Revenue for FY2012 decreased by 18% to $144 million compared with $176 million during the preceding fi nancial year.
Probe Card SolutionsThe PCS segment experienced a 19% decrease in revenue from $44 million in FY2011 to $35 million in FY2012. The decline was due mainly to the negative movement in the US dollar, market softness and the fl oods in Thailand that impacted several of our major customers in the region. Eliminating the impact of the currency movement, the revenue fell by 16%.
Cantilever probe cards continued to be a major revenue contributor at 53% of PCS sales. Advanced probe cards, which contributed close to 30% of PCS revenue, enjoyed a growth of 6%. Our advanced product line includes the LogicTouchTM fi ne pitch vertical, the SpringTouchTM spring-pin and the Trio™ vertical. During the fi nancial year, a total of 1.8 million points were produced and 14,114 fi nished probe cards were shipped. These were 18%
FY2012
Probe Card solutions
Distribution & Services solutions
REVENUE BY BUSINESS DIVISION
25%
76%
24%
FY2011
75%
Singapore China & Taiwan
USA Other Asean Countries Europe Other Regions
REVENUE BY REGION
FY2011 FY2012
29%
29%12%
19%2%
9%
37%
25%
12%
19%2% 5%

9
Our focus is to optimise the synergies and effi ciencies of our cross-border network, fully attentive to the demands of and developments in the markets where we operate.
4GlobalPresence
prudentby staying focused and
10ELLIP
SIZ
LTD
/ A
nnual
Report
2012
2operations review
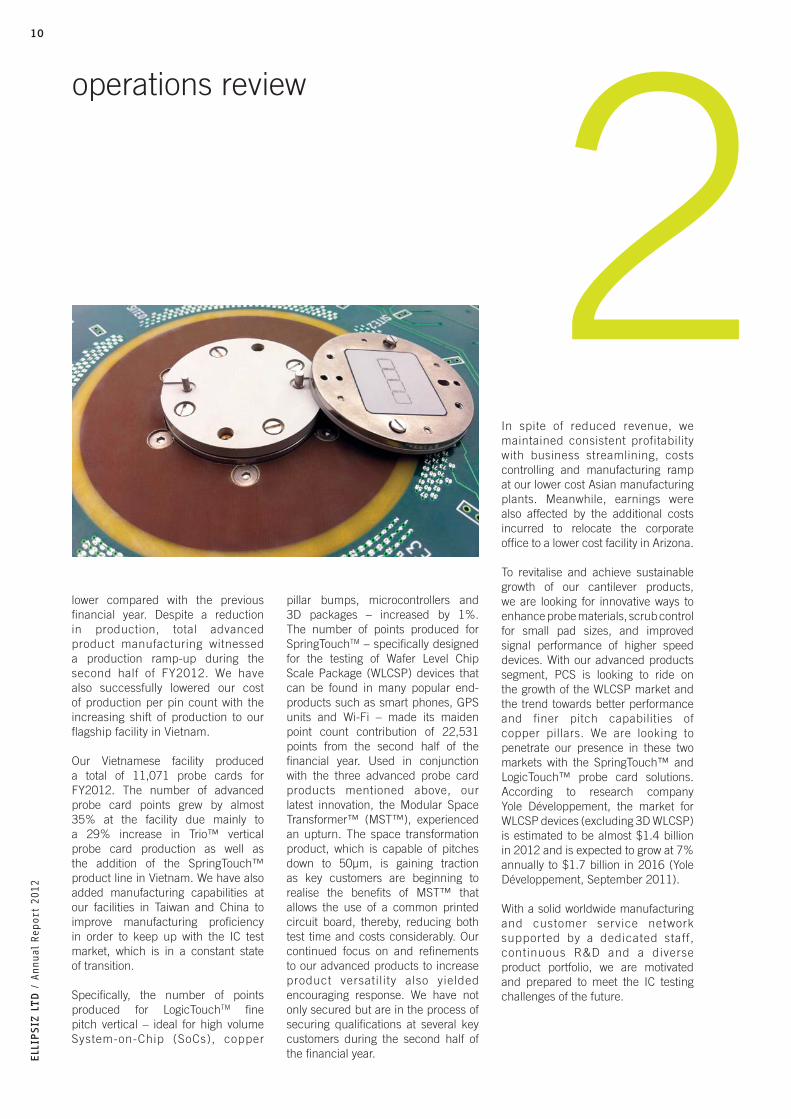
lower compared with the previous fi nancial year. Despite a reduction in production, total advanced product manufacturing witnessed a production ramp-up during the second half of FY2012. We have also successfully lowered our cost of production per pin count with the increasing shift of production to our fl agship facility in Vietnam.
Our Vietnamese facility produced a total of 11,071 probe cards for FY2012. The number of advanced probe card points grew by almost 35% at the facility due mainly to a 29% increase in Trio™ vertical probe card production as well as the addition of the SpringTouch™ product line in Vietnam. We have also added manufacturing capabilities at our facilities in Taiwan and China to improve manufacturing profi ciency in order to keep up with the IC test market, which is in a constant state of transition.
Specifi cally, the number of points produced for LogicTouchTM fi ne pitch vertical – ideal for high volume System-on-Chip (SoCs), copper
pillar bumps, microcontrollers and 3D packages – increased by 1%. The number of points produced for SpringTouchTM – specifi cally designed for the testing of Wafer Level Chip Scale Package (WLCSP) devices that can be found in many popular end-products such as smart phones, GPS units and Wi-Fi – made its maiden point count contribution of 22,531 points from the second half of the fi nancial year. Used in conjunction with the three advanced probe card products mentioned above, our latest innovation, the Modular Space Transformer™ (MST™), experienced an upturn. The space transformation product, which is capable of pitches down to 50µm, is gaining traction as key customers are beginning to realise the benefi ts of MST™ that allows the use of a common printed circuit board, thereby, reducing both test time and costs considerably. Our continued focus on and refi nements to our advanced products to increase product versatil ity also yielded encouraging response. We have not only secured but are in the process of securing qualifi cations at several key customers during the second half of the fi nancial year.
In spite of reduced revenue, we maintained consistent profitability with business streamlining, costs controlling and manufacturing ramp at our lower cost Asian manufacturing plants. Meanwhile, earnings were also affected by the additional costs incurred to relocate the corporate offi ce to a lower cost facility in Arizona.
To revitalise and achieve sustainable growth of our cantilever products, we are looking for innovative ways to enhance probe materials, scrub control for small pad sizes, and improved signal performance of higher speed devices. With our advanced products segment, PCS is looking to ride on the growth of the WLCSP market and the trend towards better performance and finer pitch capabilities of copper pillars. We are looking to penetrate our presence in these two markets with the SpringTouch™ and LogicTouch™ probe card solutions. According to research company Yole Développement, the market for WLCSP devices (excluding 3D WLCSP) is estimated to be almost $1.4 billion in 2012 and is expected to grow at 7% annually to $1.7 billion in 2016 (Yole Développement, September 2011).
With a solid worldwide manufacturing and customer service network supported by a dedicated staff, continuous R&D and a diverse product portfolio, we are motivated and prepared to meet the IC testing challenges of the future.

11
5Production, Sales and Customer Support Centres
Market challenges underscore the importance of our ties with customers, business allies and shareholders. Crucial to our forward strategy – as it has been from the start – is to stay attentive to their expectations and work along shared ideas on sustainable growth.
in adding value.
proactiveby being
12ELLIP
SIZ
LTD
/ A
nnual
Report
2012
1,operations review
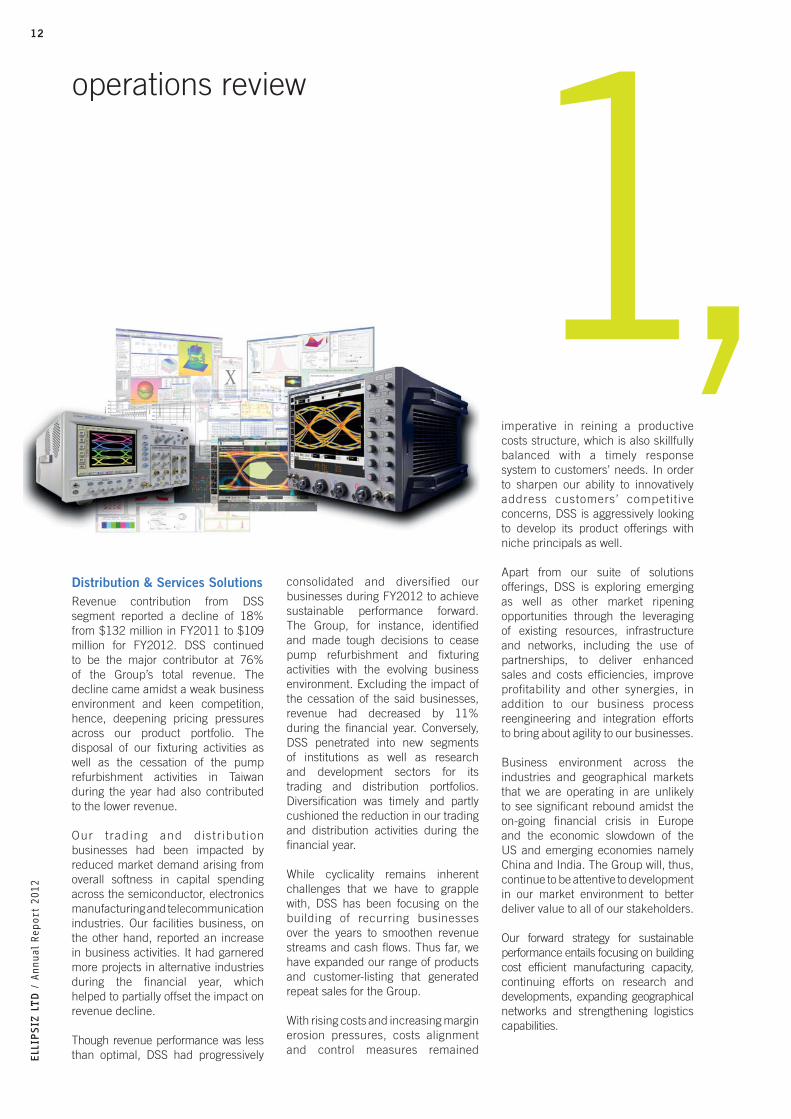
Distribution & Services SolutionsRevenue contribution from DSS segment reported a decline of 18% from $132 million in FY2011 to $109 million for FY2012. DSS continued to be the major contributor at 76% of the Group’s total revenue. The decline came amidst a weak business environment and keen competition, hence, deepening pricing pressures across our product portfolio. The disposal of our fi xturing activities as well as the cessation of the pump refurbishment activities in Taiwan during the year had also contributed to the lower revenue.
Our t rading and distr ibut ion businesses had been impacted by reduced market demand arising from overall softness in capital spending across the semiconductor, electronics manufacturing and telecommunication industries. Our facilities business, on the other hand, reported an increase in business activities. It had garnered more projects in alternative industries during the fi nancial year, which helped to partially offset the impact on revenue decline.
Though revenue performance was less than optimal, DSS had progressively
consolidated and diversified our businesses during FY2012 to achieve sustainable performance forward. The Group, for instance, identifi ed and made tough decisions to cease pump refurbishment and fi xturing activities with the evolving business environment. Excluding the impact of the cessation of the said businesses, revenue had decreased by 11% during the fi nancial year. Conversely, DSS penetrated into new segments of institutions as well as research and development sectors for its trading and distribution portfolios. Diversifi cation was timely and partly cushioned the reduction in our trading and distribution activities during the fi nancial year.
While cyclicality remains inherent challenges that we have to grapple with, DSS has been focusing on the building of recurring businesses over the years to smoothen revenue streams and cash fl ows. Thus far, we have expanded our range of products and customer-listing that generated repeat sales for the Group.
With rising costs and increasing margin erosion pressures, costs alignment and control measures remained
imperative in reining a productive costs structure, which is also skillfully balanced with a timely response system to customers’ needs. In order to sharpen our ability to innovatively address customers’ competitive concerns, DSS is aggressively looking to develop its product offerings with niche principals as well.
Apart from our suite of solutions offerings, DSS is exploring emerging as well as other market ripening opportunities through the leveraging of existing resources, infrastructure and networks, including the use of partnerships, to deliver enhanced sales and costs effi ciencies, improve profitability and other synergies, in addition to our business process reengineering and integration efforts to bring about agility to our businesses.
Business environment across the industries and geographical markets that we are operating in are unlikely to see signifi cant rebound amidst the on-going fi nancial crisis in Europe and the economic slowdown of the US and emerging economies namely China and India. The Group will, thus, continue to be attentive to development in our market environment to better deliver value to all of our stakeholders.
Our forward strategy for sustainable performance entails focusing on building cost effi cient manufacturing capacity, continuing efforts on research and developments, expanding geographical networks and strengthening logistics capabilities.

13
Staff Worldwide
At Ellipsiz, our human capital is united by a commitment to continuously enhance our competitive edge and to improve our prospects of gaining increased market penetration.
100
work mindset that guides all our actions.
perseveringwith a
14ELLIP
SIZ
LTD
/ A
nnual
Report
2012
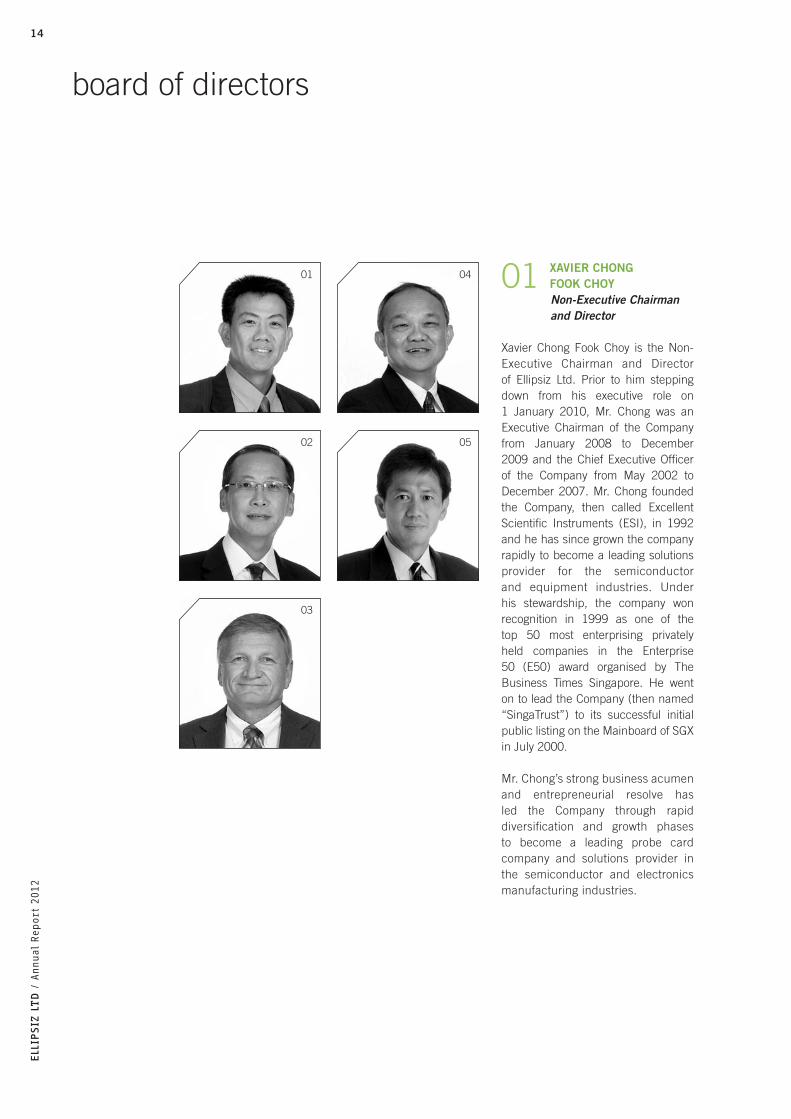
01 XAVIER CHONG FOOK CHOY
Non-Executive Chairman and Director
Xavier Chong Fook Choy is the Non-Executive Chairman and Director of Ellipsiz Ltd. Prior to him stepping down from his executive role on 1 January 2010, Mr. Chong was an Executive Chairman of the Company from January 2008 to December 2009 and the Chief Executive Offi cer of the Company from May 2002 to December 2007. Mr. Chong founded the Company, then called Excellent Scientifi c Instruments (ESI), in 1992 and he has since grown the company rapidly to become a leading solutions provider for the semiconductor and equipment industries. Under his stewardship, the company won recognition in 1999 as one of the top 50 most enterprising privately held companies in the Enterprise 50 (E50) award organised by The Business Times Singapore. He went on to lead the Company (then named “SingaTrust”) to its successful initial public listing on the Mainboard of SGX in July 2000.
Mr. Chong’s strong business acumen and entrepreneurial resolve has led the Company through rapid diversifi cation and growth phases to become a leading probe card company and solutions provider in the semiconductor and electronics manufacturing industries.
board of directors
01 04
02 05
03
15
ELLIP
SIZ
LTD
/ A
nnual
Report
2012
of both the Audit and Remuneration committees. He is presently the President and Chief Executive Offi cer of Volterra Semiconductor Corporation (Nasdaq: VLTR), a leading provider of high-performance analog and mixed-signal power management semiconductors. Prior to joining Volterra in 1999, Mr. Staszak served as Senior Vice President in the Storage Product Group of Texas Instruments Inc. and as Senior Vice President and General Manager of the Storage Products Division of Silicon Systems, Inc.
Mr. Staszak holds a B.S. degree in Industrial Technology from the University of Wisconsin – Stout and a Master of Business Administration degree from Pepperdine University.
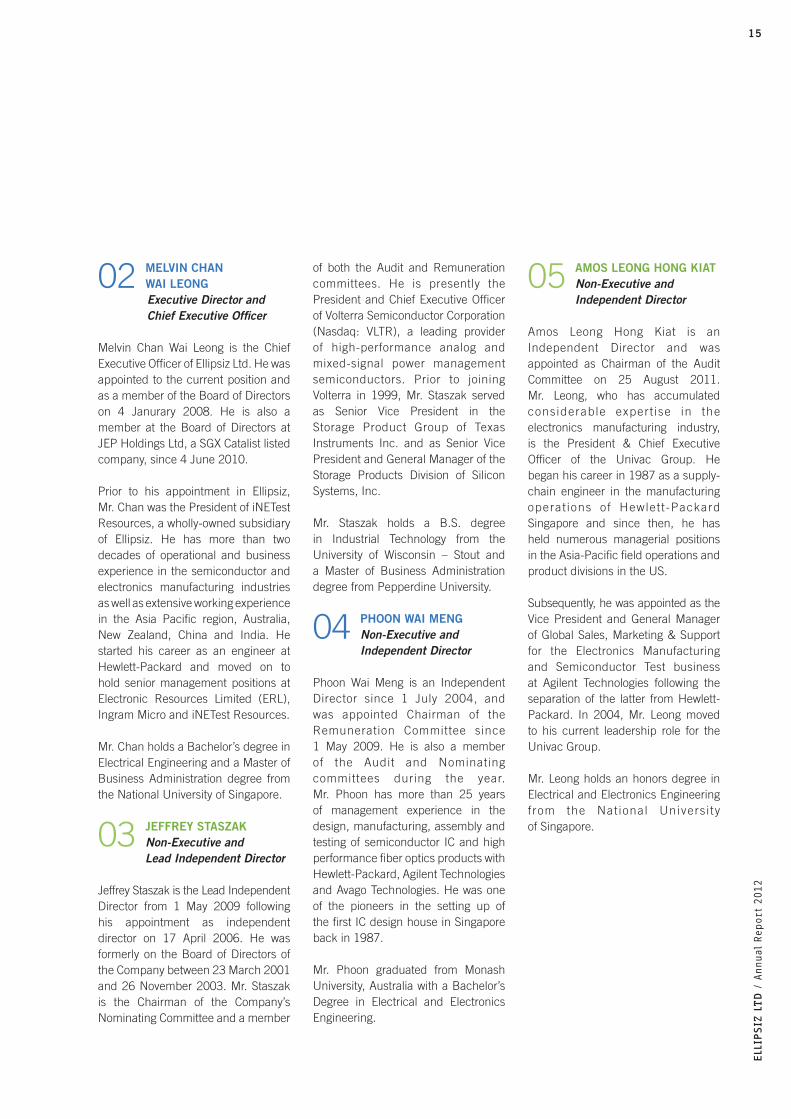
04 PHOON WAI MENGNon-Executive and
Independent Director
Phoon Wai Meng is an Independent Director since 1 July 2004, and was appointed Chairman of the Remuneration Committee since 1 May 2009. He is also a member of the Audit and Nominating committees during the year. Mr. Phoon has more than 25 years of management experience in the design, manufacturing, assembly and testing of semiconductor IC and high performance fi ber optics products with Hewlett-Packard, Agilent Technologies and Avago Technologies. He was one of the pioneers in the setting up of the fi rst IC design house in Singapore back in 1987.
Mr. Phoon graduated from Monash University, Australia with a Bachelor’s Degree in Electrical and Electronics Engineering.
02 MELVIN CHAN WAI LEONG
Executive Director and Chief Executive Offi cer
Melvin Chan Wai Leong is the Chief Executive Offi cer of Ellipsiz Ltd. He was appointed to the current position and as a member of the Board of Directors on 4 Janurary 2008. He is also a member at the Board of Directors at JEP Holdings Ltd, a SGX Catalist listed company, since 4 June 2010.
Prior to his appointment in Ellipsiz, Mr. Chan was the President of iNETest Resources, a wholly-owned subsidiary of Ellipsiz. He has more than two decades of operational and business experience in the semiconductor and electronics manufacturing industries as well as extensive working experience in the Asia Pacifi c region, Australia, New Zealand, China and India. He started his career as an engineer at Hewlett-Packard and moved on to hold senior management positions at Electronic Resources Limited (ERL), Ingram Micro and iNETest Resources.
Mr. Chan holds a Bachelor’s degree in Electrical Engineering and a Master of Business Administration degree from the National University of Singapore.
03 JEFFREY STASZAKNon-Executive and
Lead Independent Director
Jeffrey Staszak is the Lead Independent Director from 1 May 2009 following his appointment as independent director on 17 April 2006. He was formerly on the Board of Directors of the Company between 23 March 2001 and 26 November 2003. Mr. Staszak is the Chairman of the Company’s Nominating Committee and a member
05 AMOS LEONG HONG KIATNon-Executive and
Independent Director
Amos Leong Hong Kiat is an Independent Director and was appointed as Chairman of the Audit Committee on 25 August 2011. Mr. Leong, who has accumulated considerable expert ise in the electronics manufacturing industry, is the President & Chief Executive Offi cer of the Univac Group. He began his career in 1987 as a supply-chain engineer in the manufacturing operat ions of Hewlet t -Packard Singapore and since then, he has held numerous managerial positions in the Asia-Pacifi c fi eld operations and product divisions in the US.
Subsequently, he was appointed as the Vice President and General Manager of Global Sales, Marketing & Support for the Electronics Manufacturing and Semiconductor Test business at Agilent Technologies following the separation of the latter from Hewlett-Packard. In 2004, Mr. Leong moved to his current leadership role for the Univac Group.
Mr. Leong holds an honors degree in Electrical and Electronics Engineering f rom the Nat ional Univers i ty of Singapore.
16ELLIP
SIZ
LTD
/ A
nnual
Report
2012
key executives
ONG SUAT LIANChief Financial Offi cer, Corporate Offi ce
Ong Suat Lian is the Chief Financial Offi cer of Ellipsiz Ltd. She joins Ellipsiz since June 2001 as Finance Manager and was promoted as Group Finance Director in 2004, before she moves to the position recently. Her portfolio spans from operational and manager ia l account ing, treasury and risk management to fi nancial reporting and compliance. With more than 20 years of experience in corporate accounting and fi nance, Suat Lian’s knowledge and experience is invaluable to the Group in ensuring optimal use of fi nancial resources. Previously, Suat Lian held numerous fi nancial and accounting positions at Zagro Asia Limited, Sincere Watch Limited as well as United Leasing and Services Pte Ltd. Suat Lian holds a Bachelor’s Degree in Accountancy from the National University of Singapore.
KEVIN KURTZPresident and CEO, Probe Card Solutions
Kevin Kurtz is the President and CEO of SV Probe, a wholly owned subsidiary of Ellipsiz Ltd. He oversees our Probe Card solutions (PCS) business and counts more than 20 years of experience in the probe card industry. The veteran brings with him knowledge and expertise that benefi ts and positions PCS towards sustainable growth. Prior to joining SV Probe, Kevin was Vice President at Cerprobe Corp., and he also served briefl y as Vice President for Test Operations at Kulicke and Soffa (K&S) after K&S acquired Cerprobe in late 2000. Earlier on, he held various positions in Sales and Marketing with Probe Technology Inc. Kevin holds a B.Sc in Business Administration from San Jose State University, United States.
LIM BENG LAMVice President, Distribution and Services Solutions
Lim Beng Lam is the Vice President for Distribution and Services solutions division in Singapore and Malaysia. He oversees the trading and distribution of wafer fab equipment, specialty chemicals and consumables, electronics measurement tools and the provision of reliability test services businesses. With more than 20 years of industry experience, Beng Lam possesses a good mix of expertise and foresight to drive performances at the respective product segments. He was recently the Vice President of Sales at SV Probe. Previously, he was Sales Director at Lam Research Corp., and served in various management positions at CEI Contract Manufacturing Ltd and Texas Instruments Singapore. Beng Lam holds a B.Sc in Chemistry and Mathematics from the National Univers i ty of S ingapore and a Master of Business Administration from the Oklahoma City University, United States.
TONY GUNG KWUN YUANVice President, Distribution and Services Solutions
Tony Gung Kwun Yuan is the Vice President for our Distribution and Services solutions division in China and Taiwan. His business portfolio covers trading and distribution of electronics test and measurement tools, wafer fab equipment, consumables and the provision of Printed Circuit Board Assembly (PCBA) Test and Inspection services. Tony has accumulated considerable sales, engineering and business management expertise in the electronics manufacturing test industry, particularly in China and Taiwan. Prior to joining the Group, Tony held numerous engineering and managerial positions in Agilent Technologies, Hewlett Packard and one of IBM’s strategically invested R&D company in Taiwan. Tony holds a Master’s as well as Bachelor Degree in Control Engineering from the National CHIAO-TUNG University, Taiwan.
SAM TAN CHONG GINVice President, Distribution and Services Solutions
Sam Tan Chong Gin is the Vice President for our Distribution and Services solutions division for the telecommunications network assurance and support business in Southeast Asia, Taiwan and New Zealand. His portfolio comprises the trading and distribution of network assurances and monitoring systems as well as the provision of integration solutions undertaken by 70%-owned subsidiary, Ellipsiz Communications Pte Ltd. Possessing more than 20 years of experience in sales, business development and management in the electronics industry, Sam offers dynamism critical to the building of growth opportunities. Previously, Sam held numerous engineering, business development and sales positions with IBM Canada, Hewlett Packard and Agilent Technologies. Sam holds a Bachelor’s Degree in Electrical & Electronics Engineering from Queen’s University of Kingston, Canada.
JEFFREY KOH CHOON LENGVice President, Distribution and Services Solutions
Jeffrey Koh Choon Leng is the Vice President for our Distribution and Services solutions division for our facilities business. He has close to 30 years of professional experience in Mechanical Engineering (M&E) building service design, implementation, documentation and project administration, and is overseeing Facilities Engineering solutions and Project Management businesses across diverse industries in Singapore, Malaysia, China and India. Jeffrey started his career as a Project Engineer with Hibiya Engineering Ltd prior to his partnership venture in HPS Engineering (S) Pte Ltd as an executive director. He is also the Managing Director of our 51%-owned subsidiary, E+HPS Pte Ltd. Jeffrey holds a Diploma in Mechanical Engineering from the Singapore Polytechnic.
17
ELL
IPSIZ
LTD
/ A
nnual
Report
2012
corporate information
HEADQUARTER
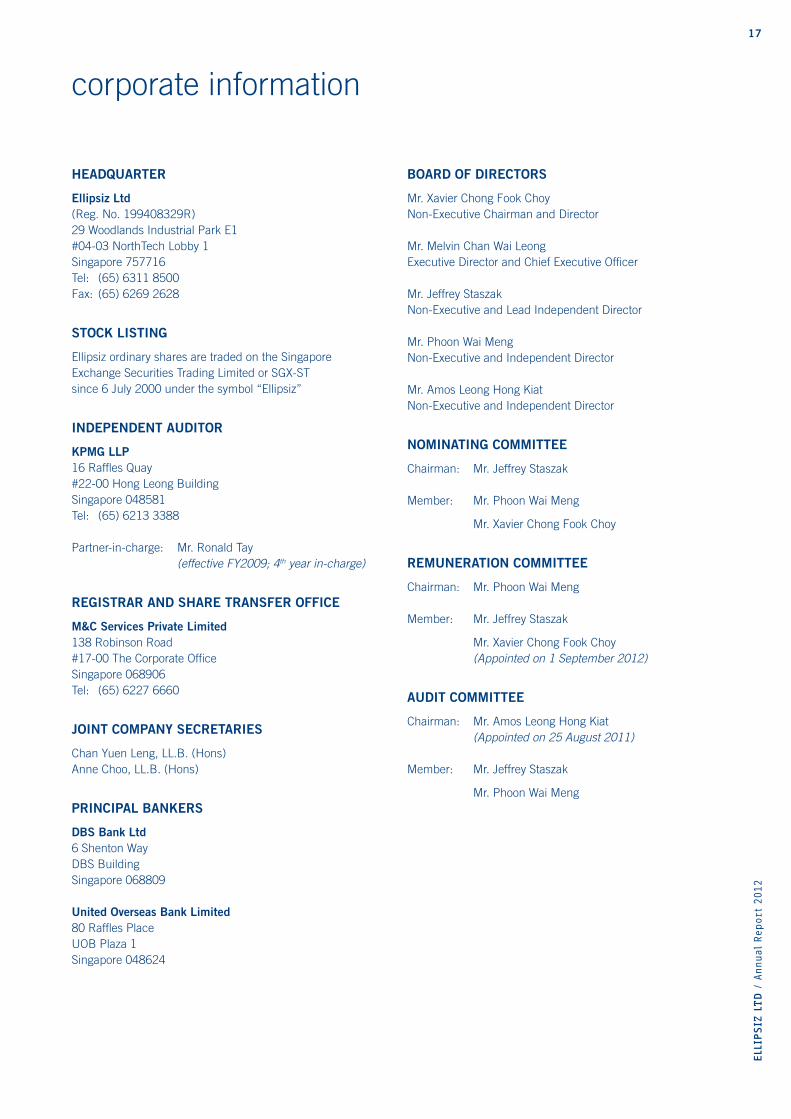
Ellipsiz Ltd(Reg. No. 199408329R)29 Woodlands Industrial Park E1#04-03 NorthTech Lobby 1Singapore 757716Tel: (65) 6311 8500Fax: (65) 6269 2628
STOCK LISTING
Ellipsiz ordinary shares are traded on the Singapore Exchange Securities Trading Limited or SGX-ST since 6 July 2000 under the symbol “Ellipsiz”
INDEPENDENT AUDITOR
KPMG LLP16 Raffl es Quay#22-00 Hong Leong BuildingSingapore 048581Tel: (65) 6213 3388
Partner-in-charge: Mr. Ronald Tay (effective FY2009; 4th year in-charge)
REGISTRAR AND SHARE TRANSFER OFFICE
M&C Services Private Limited138 Robinson Road#17-00 The Corporate Offi ceSingapore 068906Tel: (65) 6227 6660
JOINT COMPANY SECRETARIES
Chan Yuen Leng, LL.B. (Hons)Anne Choo, LL.B. (Hons)
PRINCIPAL BANKERS
DBS Bank Ltd6 Shenton Way DBS BuildingSingapore 068809
United Overseas Bank Limited80 Raffl es PlaceUOB Plaza 1Singapore 048624
BOARD OF DIRECTORS
Mr. Xavier Chong Fook ChoyNon-Executive Chairman and Director
Mr. Melvin Chan Wai LeongExecutive Director and Chief Executive Offi cer
Mr. Jeffrey Staszak Non-Executive and Lead Independent Director
Mr. Phoon Wai MengNon-Executive and Independent Director
Mr. Amos Leong Hong Kiat Non-Executive and Independent Director
NOMINATING COMMITTEE
Chairman: Mr. Jeffrey Staszak
Member: Mr. Phoon Wai Meng
Mr. Xavier Chong Fook Choy
REMUNERATION COMMITTEE
Chairman: Mr. Phoon Wai Meng
Member: Mr. Jeffrey Staszak
Mr. Xavier Chong Fook Choy (Appointed on 1 September 2012)
AUDIT COMMITTEE
Chairman: Mr. Amos Leong Hong Kiat (Appointed on 25 August 2011)
Member: Mr. Jeffrey Staszak
Mr. Phoon Wai Meng
18ELL
IPSIZ
LTD
/ A
nnual
Report
2012
corporate governance
The Board of Directors (the “Board”) of Ellipsiz Ltd (the “Company”) is committed in its continuing efforts to achieve high standards of corporate governance and business conduct to enhance long term shareholder value and safeguard the interests of its stakeholders.
The Company has adopted a framework of corporate governance policies and practices in line with the principles and best practices set out in the Code of Corporate Governance 2005 issued by the Council on Corporate Disclosure and Governance.
The Company’s corporate governance processes and activities for the fi nancial year are outlined below.
BOARD MATTERS
The Board’s Conduct of Affairs
Principle 1: Effective Board to lead and control the Group
The Board is entrusted with the responsibility of overseeing the business and corporate affairs of the Group. Its roles includes, approval of the overall strategies and initiatives of the Group; providing entrepreneurial leadership and setting objectives; regularly reviewing the Group’s fi nancial performance; ensuring the implementation of appropriate systems to manage the principal risks of the Group’s businesses as well as setting standards and values, and ensuring that obligations to shareholders and others are understood and met.
To facilitate effective management, certain functions of the Board have been delegated to various sub-committees and management committees, which review and make recommendations to the Board on specifi c areas.
There are three sub-committees appointed by the Board, namely the Nominating Committee, the Remuneration Committee and the Audit Committee. Most of the members of the sub-committees are non-Executive and Independent Directors.
There are also two investment committees which are management committees that comprise mainly senior executives. The investment committees deliberate and evaluate investment projects and capital expenditure budgets before any recommendation is put forth to the Board for consideration and approval. To ensure alignment with the Group’s strategic direction in the early stage of evaluation of investment and capital expenditure projects, an independent Director sits on each such committee as adviser to the management team. The Company’s internal guidelines stipulate that all strategic investments, divestments and acquisition projects shall be approved by the Board.
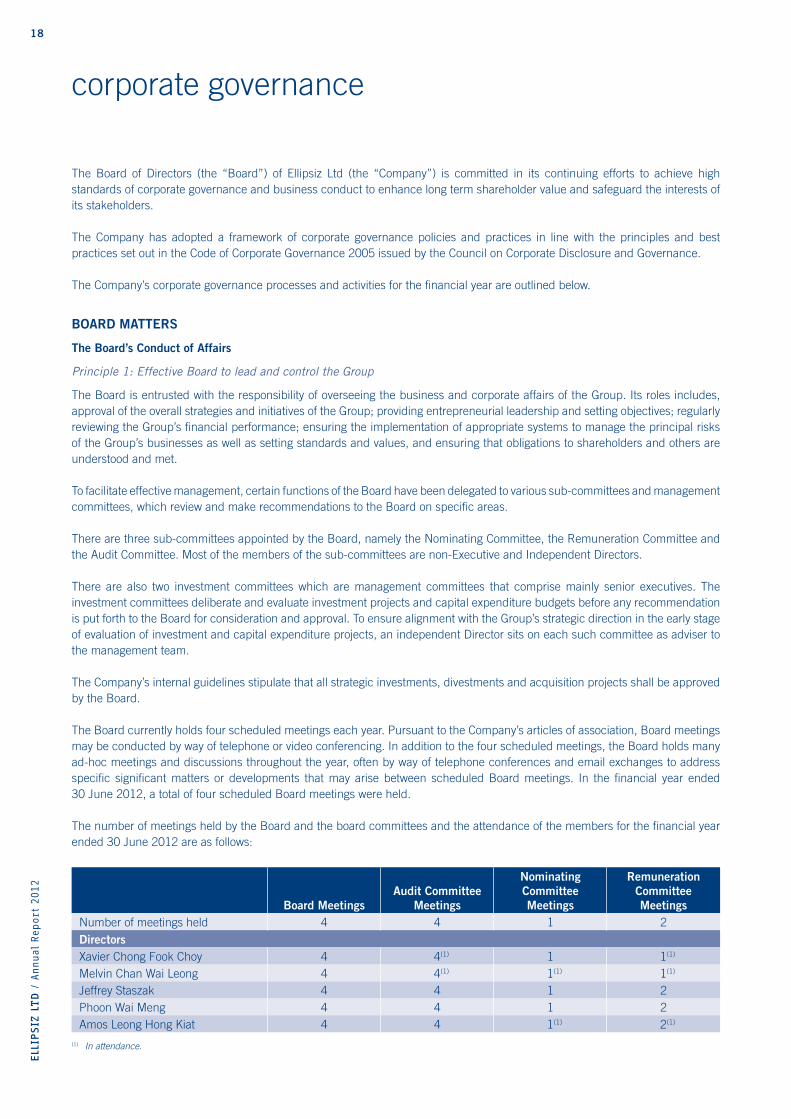
The Board currently holds four scheduled meetings each year. Pursuant to the Company’s articles of association, Board meetings may be conducted by way of telephone or video conferencing. In addition to the four scheduled meetings, the Board holds many ad-hoc meetings and discussions throughout the year, often by way of telephone conferences and email exchanges to address specifi c signifi cant matters or developments that may arise between scheduled Board meetings. In the fi nancial year ended 30 June 2012, a total of four scheduled Board meetings were held.
The number of meetings held by the Board and the board committees and the attendance of the members for the fi nancial year ended 30 June 2012 are as follows:
Board MeetingsAudit Committee
Meetings
Nominating Committee Meetings
Remuneration Committee Meetings
Number of meetings held 4 4 1 2DirectorsXavier Chong Fook Choy 4 4(1) 1 1(1)
Melvin Chan Wai Leong 4 4(1) 1(1) 1(1)
Jeffrey Staszak 4 4 1 2Phoon Wai Meng 4 4 1 2Amos Leong Hong Kiat 4 4 1(1) 2(1)
(1) In attendance.

19
ELL
IPSIZ
LTD
/ A
nnual
Report
2012
corporate governance
New Board members will undergo an orientation programme, which will include briefi ngs by the Chairman of the Nominating Committee, Chief Executive Offi cer and management on the businesses and activities of the Group, its strategic directions as well as its corporate governance practices so as to facilitate the new member’s understanding of the Group. Board members receive updates on relevant developments on fi nance and corporate issues, and the Company will consider further training where necessary.
All new appointees to the Board will receive formal letters of appointment setting out their duties and obligations.
Board Composition and Guidance
Principle 2: Strong and independent Board
The size and composition of the Board are reviewed annually by the Nominating Committee to ensure that the Board has the appropriate mix of expertise and experience and collectively possesses the relevant and necessary skill sets and core competencies for effective decision-making.
During the fi nancial year ended 30 June 2012, the Board comprised the following members:
Mr. Xavier Chong Fook Choy Non- Executive ChairmanMr. Melvin Chan Wai Leong Chief Executive Offi cerMr. Jeffrey Staszak Lead Independent Director Mr. Phoon Wai Meng Independent DirectorMr. Amos Leong Hong Kiat Independent Director
The Nominating Committee assesses the independence of the Directors on an annual basis. For the fi nancial year ended 30 June 2012, the Nominating Committee has determined that save for the Non-Executive Chairman and Chief Executive Offi cer who are executive Directors, all the other three Directors who are non-executive are also independent.
With the independent Directors having the requisite experience, expertise and standing, the Board is able to exercise objective judgment independently, and no individual or small groups of individuals dominate the Board’s decision-making.
The Nominating Committee considers the current size, competence and composition of the Board appropriate, taking into consideration the scope and nature of the Group’s operations.
Chairman and Chief Executive Offi cer
Principle 3: Clear division of responsibilities between Chairman and Chief Executive Offi cer to ensure a balance of power and authority
There is a clear separation of the roles and responsibilities of the Chairman and the Chief Executive Offi cer as the roles are separately held by Mr. Xavier Chong Fook Choy and Mr. Melvin Chan Wai Leong. This is to ensure an appropriate balance of power, increased accountability and greater capacity for independent decision making.
Mr. Xavier Chong Fook Choy, being the Chairman, bears the primary responsibility for the workings of the Board and ensuring its effective function. He also ensures that the Board meetings are held as and when necessary; that Directors receive accurate, clear and timely information; encourages constructive relations between management and the Board, as well as between Executive and non-Executive Directors; and ensures effective communication with shareholders.
Mr. Melvin Chan Wai Leong, the Chief Executive Offi cer, is primarily responsible for the operations and performance of the Group; charting of corporate directions and strategies, including overseeing its fi nancial planning and investment activities; and reporting to the Board on the Group’s operations and performance. Mr. Chan is not related to Mr. Chong.

20ELL
IPSIZ
LTD
/ A
nnual
Report
2012
corporate governance
Board Membership & Performance
Principle 4: Formal and transparent process for appointment of new Directors
Principle 5: Formal assessment of the effectiveness of the Board and contribution of each Director
The independence and effectiveness of the Board are reviewed and assessed annually by the Nominating Committee for continual good governance and relevancy to the changing needs of the Group’s businesses.
During the year, the Nominating Committee comprised:
• Mr. Jeffrey Staszak (Chairman) • Mr. Phoon Wai Meng • Mr. Xavier Chong Fook Choy
Majority of the members of the Committee, including its Chairman, are independent Directors.
The Committee is responsible for nominations for the appointment, re-appointment, election and re-election of Directors and members of the Remuneration Committee and Audit Committee. It assists the Board in ensuring that Directors appointed to the Board and its sub-committees possess the relevant background, experience and knowledge in technology, business, fi nance and management skills critical to the Group’s businesses and that each Director, through his unique contributions, brings to the Board an independent objective perspective to enable balanced and well-considered decisions to be made.
When the need for a new Director arises, either to replace a Director who has resigned or to enhance the Board’s composition, the Nominating Committee will short-list potential candidates. The Committee will evaluate, amongst others, the skills and expertise of the candidates and the value that each can contribute to the Board before making any recommendation to the Board. It also reviews and approves nominations for senior management positions in the Group, including that of the Chief Executive Offi cer and other senior executives.
In accordance with the Company’s articles of association, one-third of the Board, including the Chief Executive Offi cer, is subject to retirement by rotation and re-election at Annual General Meetings. A newly appointed Director must also submit himself to retirement and re-election at the annual general meeting immediately following his appointment by the Board.
The Nominating Committee also considered, and is satisfi ed that three out of four of its existing non-Executive Directors of the Board, namely, Mr. Phoon Wai Meng, Mr. Jeffrey Staszak and Mr. Amos Leong Hong Kiat are independent Directors.
The Nominating Committee has set objective criteria for evaluating the Board’s as well as each individual Director’s effectiveness during the fi nancial year. The assessment is based on evaluation questionnaires that contain both qualitative and quantitative performance criteria. To ensure that each Director has suffi cient and adequate time on affairs of the Company, the Board has set guidelines that each Director shall not have more than fi ve listed company board representations unless prior consensus is obtained from the Chairman of the Board and the Nominating Committee, after considering the principal commitments of the Director.
The key information regarding Directors such as academic and professional qualifi cations and directorships are set out on pages 14 and 15.
Access to Information
Principle 6: Provision of complete, adequate and timely information prior to Board meetings and on an on-going basis
The Board receives relevant, complete and timely information prior to the Board meetings and on an on-going basis. Senior management is invited to participate at the Board meetings to provide the Board members with background and explanatory information relating to matters brought before the Board. Information presented to the Board includes explanatory information relating to matters to be discussed such as business plan, budgets, forecasts and quarterly internal fi nancial statements. In respect of budgets, any material variances between projections and actual results are always disclosed and explained.
The Company Secretary attends all scheduled Board and Audit Committee meetings in the fi nancial year. The Company Secretary advises the Company on procedures and relevant company legislation, rules and regulations, which are applicable to the Company.
21
ELL
IPSIZ
LTD
/ A
nnual
Report
2012
corporate governance
All Directors have separate and independent access to the senior management team and independent professional advisers such as lawyers, external auditors, and the Company Secretary at all times.
REMUNERATION MATTERS
Procedures for Developing Remuneration Policies
Principle 7: Formal and transparent procedure for developing policy and fi xing remuneration packages of Directors
Level and Mix of Remuneration
Principle 8: Appropriate remuneration to attract, retain and motivate Directors
Disclosure on Remuneration
Principle 9: Clear disclosure on remuneration policy, level and mix
The Remuneration Committee plays a crucial role in the recruitment and retention of the best talents to drive the Group’s businesses forward. It sets the remuneration guidelines of the Group for each annual period.
The framework of remuneration for the Board and key executives is linked to the development of management bench strength and key executives to ensure continual development of talent and renewal of strong leadership for the continued success of the Company. In determining remuneration packages, the Remuneration Committee takes into consideration industry practices and norms in compensation.
Remuneration Committee
The Remuneration Committee during the fi nancial year comprised:
Mr. Phoon Wai Meng (Chairman)Mr. Jeffrey Staszak
Mr. Xavier Chong was appointed as member of the Committee on 1 September 2012. With his appointment, the Committee has three members, out of which majority, including the Chairman of the Committee, are independent Directors. The Committee is responsible for reviewing and recommending to the Board a framework on all aspects of remuneration of Directors, Chief Executive Offi cer and other senior management executives of the Group, including director’s fees, salaries, allowances, bonuses and benefi ts in kind. The Committee reviews policies governing compensation and promotion of executive offi cers of the Company and its subsidiaries to ensure that these are consistent with the Group’s strategy and performance. The Committee’s recommendations are made in consultation with the Chairman of the Board, and submitted for endorsement by the entire Board. The members of the Remuneration Committee do not decide on their own remuneration.
The Committee also oversees the implementation of the Ellipsiz Share Option Plan.
Remuneration Information
The Executive Directors have employment contracts with the Company that can be terminated by either party serving the requisite prior notices. There is no contractual provision for payment of compensation upon such termination of service. The Executive Directors are assessed based on their individual performance and the performance of the Group.
The Non-Executive Directors have no service contracts with the Company and are not entitled to any compensation upon termination of directorship.
In line with past practice, the Directors are paid director’s fees, subject to shareholders’ approval at the annual general meeting. No individual Director fi xes his own remuneration.
As may be noted from the table below, the performance related elements of remuneration (that are bonuses, options exercised and awards) form a signifi cant proportion of the Executive Director’s total remuneration. His performance was evaluated by the Remuneration Committee based on a formal employee evaluation process.
22ELL
IPSIZ
LTD
/ A
nnual
Report
2012
corporate governance
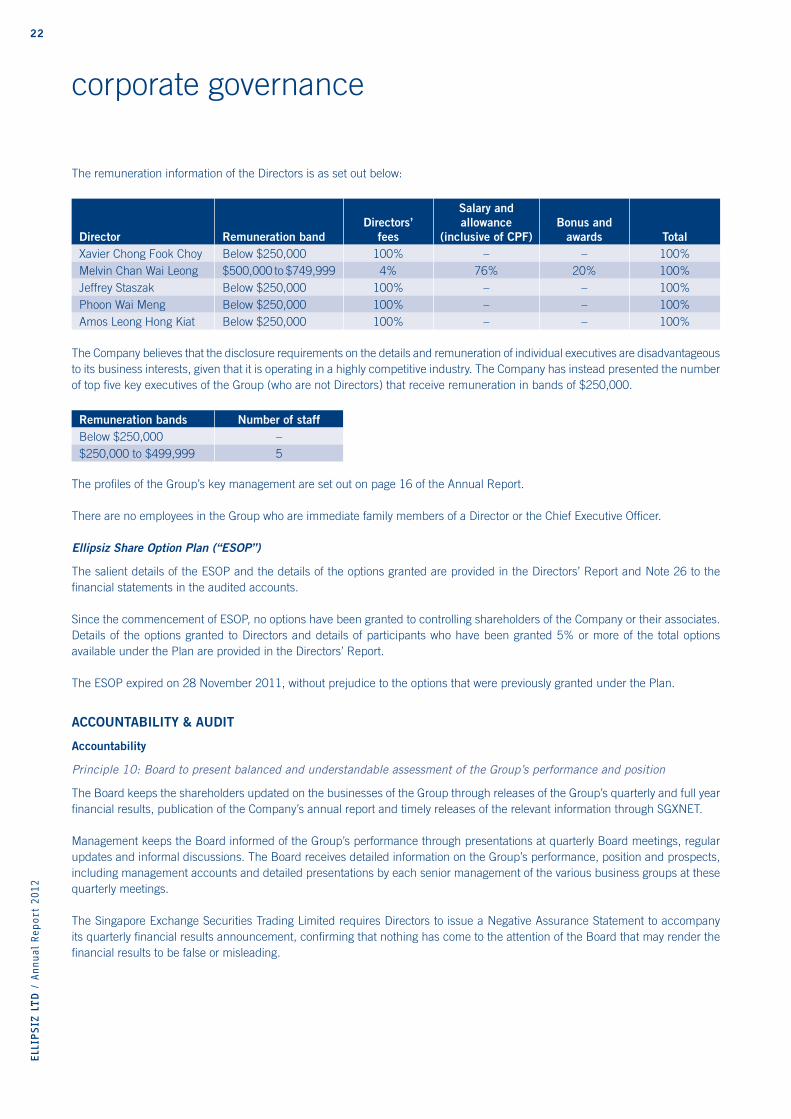
The remuneration information of the Directors is as set out below:
Director Remuneration bandDirectors’
fees
Salary and allowance
(inclusive of CPF)Bonus and
awards TotalXavier Chong Fook Choy Below $250,000 100% – – 100%Melvin Chan Wai Leong $500,000 to $749,999 4% 76% 20% 100%Jeffrey Staszak Below $250,000 100% – – 100%Phoon Wai Meng Below $250,000 100% – – 100%Amos Leong Hong Kiat Below $250,000 100% – – 100%
The Company believes that the disclosure requirements on the details and remuneration of individual executives are disadvantageous to its business interests, given that it is operating in a highly competitive industry. The Company has instead presented the number of top fi ve key executives of the Group (who are not Directors) that receive remuneration in bands of $250,000.
Remuneration bands Number of staffBelow $250,000 –$250,000 to $499,999 5
The profi les of the Group’s key management are set out on page 16 of the Annual Report.
There are no employees in the Group who are immediate family members of a Director or the Chief Executive Offi cer.
Ellipsiz Share Option Plan (“ESOP”)
The salient details of the ESOP and the details of the options granted are provided in the Directors’ Report and Note 26 to the fi nancial statements in the audited accounts.
Since the commencement of ESOP, no options have been granted to controlling shareholders of the Company or their associates. Details of the options granted to Directors and details of participants who have been granted 5% or more of the total options available under the Plan are provided in the Directors’ Report.
The ESOP expired on 28 November 2011, without prejudice to the options that were previously granted under the Plan.
ACCOUNTABILITY & AUDIT
Accountability
Principle 10: Board to present balanced and understandable assessment of the Group’s performance and position
The Board keeps the shareholders updated on the businesses of the Group through releases of the Group’s quarterly and full year fi nancial results, publication of the Company’s annual report and timely releases of the relevant information through SGXNET.
Management keeps the Board informed of the Group’s performance through presentations at quarterly Board meetings, regular updates and informal discussions. The Board receives detailed information on the Group’s performance, position and prospects, including management accounts and detailed presentations by each senior management of the various business groups at these quarterly meetings.
The Singapore Exchange Securities Trading Limited requires Directors to issue a Negative Assurance Statement to accompany its quarterly fi nancial results announcement, confi rming that nothing has come to the attention of the Board that may render the fi nancial results to be false or misleading.

23
ELL
IPSIZ
LTD
/ A
nnual
Report
2012
corporate governance
Audit Committee
Principle 11: Establishment of an Audit Committee with written terms of reference
The Nominating Committee is of the view that the members of the Audit Committee have suffi cient fi nancial management expertise and experience to discharge the Audit Committee’s functions in view of their experience as directors and/or senior management in accounting and fi nancial fi elds.
The Audit Committee comprises the following members:
Mr. Amos Leong Hong Kiat (Chairman)Mr. Jeffrey Staszak Mr. Phoon Wai Meng
All members of the Audit Committee are independent Directors.
The Committee, in assisting the Board to fulfi ll its responsibilities for the Group’s fi nancial statements and external fi nancial reporting, meets periodically with the management and external auditors to:
• review the fi nancial statements of the Company and the consolidated fi nancial statements of the Group before submission to the Board for approval;
• review the quarterly and full year announcements of the Company and the Group before they are submitted to the Board for approval;
• review and discuss with external auditors the overall scope of work of the audit and its effectiveness, the results of the audit and the evaluation of the internal control system, external auditors’ management letter and the responses from management;
• review the nature and extent of non-audit services provided by the external auditors of the Company;
• review the independence and objectivity of external auditors annually; and
• review interested person transactions between the Group and interested persons, if any.
The Committee is also tasked with advising the Board on the appointment and re-appointment of external auditors of the Company at each annual general meeting, and approving their remuneration and terms of engagement. In accordance with Chapter 12 of the Singapore Exchange Listing Manual, the Audit Committee also undertakes to review the non-audit services provided by the auditors and ensures that the non-audit services shall not affect the independence of the external auditors.
The Company has complied with Listing Manual Rules 712 and 715 during this fi nancial year. With regards to the Listing Manual Rule 716, the Committee is satisfi ed that the appointment of different auditors for its subsidiaries or signifi cant associated companies during the year would not compromise the standards and effectiveness of the audit of the Group.
The Audit Committee has full access to and co-operation from the Group’s management. It has also been given the resources required to discharge its function properly and has full discretion to invite any Director or executive offi cer to attend its meetings. The auditors have unrestricted access to the Audit Committee and meet with the members of the Audit Committee without the presence of the management at least once a year.
The Audit Committee has recommended to the Board the nomination of KPMG for re-appointment as external auditors of the Company at its forthcoming annual general meeting.

24ELL
IPSIZ
LTD
/ A
nnual
Report
2012
corporate governance
Internal Controls
Principle 12: Sound system of internal controls
The Group has put in place a system of internal controls to ensure that proper accounting records are kept, information is reliable, the Group’s assets are safeguarded and business risks identifi ed and contained.
Based on the internal controls established and maintained by the Group, work performed by the external and internal auditors, self assessment and actions taken by the Group’s management, its on-going reviews and continuing efforts at enhancing controls and processes, the Board, with the concurrence of Audit Committee, is of the opinion that the Group’s internal controls, addressing fi nancial, operational and compliance risks, were adequate as at 30 June 2012. The Board, however, recognises that no cost effective system of internal controls could provide absolute assurance against the occurrence of errors and irregularities.
The Group has put in place certain processes and a whistle-blowing program by which staff of the Group may, in confi dence, raise concerns about the possible improprieties in matters of fi nancial reporting or other matters.
Risk Management
As the Company does not have a risk management committee, the Audit Committee assumes the supervisory responsibility of the Group’s risk management function.
The Audit Committee and senior management seek to identify areas of signifi cant business risks, including revenue loss, property loss and breach of information security, as well as appropriate measures to control and mitigate these risks. In determining the appropriate measures, the cost of control and the impact of risks occurring will be balanced with the benefi ts of reducing risks.
Internal Audit
Principle 13: Establishment of an internal audit function that is independent of the functions it audits
The Company outsources its internal audit function to a professional internal audit fi rm. The internal audit fi rm reports directly to the Audit Committee and is independent of the activities that it audits. The internal audit fi rm reviews the Group’s material internal controls including fi nancial, operational and compliance controls as well as risk management.
COMMUNICATION WITH SHAREHOLDERS
Principle 14: Regular, effective and fair communication with shareholders
Principle 15: Greater shareholder participation at AGMs
To maintain a high level of transparency, the Board aims to ensure timely disclosure of all material business and price-sensitive information through announcements made via SGXNET. Quarterly fi nancial results are published through the SGXNET, news releases and the Company’s corporate website.
At annual general meetings, shareholders are given opportunity to express their views and make enquiries regarding the operations of the Group. Board members and management are present at these meetings to address any question that shareholders may have concerning the Group. The external auditors are also present to answer any relevant queries from shareholders.
Under the Company’s articles of association, a registered shareholder may appoint one or two proxies to attend an annual general meeting, to speak and vote in place of the shareholder. Voting in absentia by mail, facsimile or email has yet to be introduced because such voting methods will need to be carefully reviewed in terms of costs and feasibility to ensure that there is no compromise to either the integrity of the information or proper authentication of the identity of the shareholders.
25
ELL
IPSIZ
LTD
/ A
nnual
Report
2012
corporate governance
Separate resolutions are tabled at general meetings on each substantially separate issue. The Company treats shareholders’ issues, particularly those that require shareholders’ approval, such as re-election of Directors and approval of Directors’ fees, as distinct subjects and submits them to the annual general meeting as separate resolutions.
All information presented by the Chief Executive Offi cer on the Group’s performance, prospects and plans during the annual general meeting are posted on SGXNET. The minutes of an annual general meeting will be given to shareholders upon request.
SECURITIES TRADING
In line with the SGX-ST Listing Rule 1207(19), the Group has issued guidelines on share dealings to all employees of the Group, setting out the implications of insider trading, prohibiting securities dealings by Directors and employees whilst in possession of unpublished price sensitive information, and during the periods commencing one month before the announcements of full year results and two weeks before the announcement of quarterly results, and ending on the day after the said announcement of the relevant results. Under the guidelines, Directors and employees are not allowed to deal in the Company’s securities on short-term considerations.
INTERESTED PERSON TRANSACTIONS
The Company does not have any general mandate from shareholders for interested person transaction. All interested person transactions are subject to review by the Chairman of the Board and the Audit Committee to ensure that the transactions are conducted on an arm’s length basis and are not prejudicial to the interests of the shareholders. During the fi nancial year ended 30 June 2012, there was no interested person transaction that requires disclosure or shareholders’ approval under Chapter 9 of the Rules of the Listing Manual.
26ELL
IPSIZ
LTD
/ A
nnual
Report
2012
fi nancial review
The following discussion is based on and should be read in conjunction with, the consolidated fi nancial statements of Ellipsiz Ltd and its subsidiaries (the Group), including the notes thereto.
RESULTS OF OPERATIONS
Revenue and gross profi ts
The Group had revenue of $144.3 million for the year ended 30 June 2012 (FY2012). This was a decline of 18% compared to the previous fi nancial year (FY2011). Both business segments attained lower revenue in FY2012 with Probe Card solutions (PCS) experiencing a decrease of 19% and Distribution & Services solutions (DSS) had a decline of 18%.
The macroeconomic uncertainties, especially in the US and Europe; the excess inventories built up after the tight capacity situation in 2010; and the adoption of more conservative capital spending by some customers in view of the global uncertainties, had affected the performance of the Group and led to lower revenue from operations in most of the regions. Keen price competition and currency risk continue to pose challenges to the Group. Other than Singapore and Europe, most of the regions that the Group operates in experienced declines of more than 10%.
Gross profi t attained in FY2012 was $29.4 million, a drop of 23% over $38.3 million in FY2011. Gross profi t margin decreased by 2% to 20%. During the year, the Group made the decision to cease one of its less profi table activities, the pump refurbishment activities in Taiwan. This resulted in the recording of a one-time impairment expense of $2.0 million on the carrying amounts of related inventory as well as plant and equipment and the recording of warranty compensation and severance cost in the cost of sales. Excluding this one-time expense, the gross profi t margin for the year was 22%, fl at compared with the gross profi t margin in FY2011.
Other income
Other income decreased by 77% from $4.9 million in FY2011 to $1.1 million in FY2012 mainly due to the non-recurrence of FY2011’s gain of $1.7 million from the disposal of asset classifi ed as held for sale and reversal of impairment of investment in an associate of $1.9 million.
Operating expenses
Total operating expenses decreased by 17% from $34.7 million to $28.7 million in FY2012. The lower expenses resulted from the disposal of fi xturing businesses in December 2011 and the cessation of pump refurbishment activities in January 2012, the capitalisation of higher development costs, the incurrence of lower exchange losses (FY2012: $0.5 million and FY2011: $1.7 million) and lower share-based payment expenses.
Net fi nance expenses
Net fi nance expenses in FY2012 were $68,000, a decrease of 79% as compared to FY2011’s net expenses of $318,000. The recording of higher fi nance income and the incurrence of lower fi nance expenses in FY2012 were the causes for the drop in net fi nance expenses.
Share of results of associates and joint ventures
The Group recorded profi ts of $0.3 million from share of results from associates and losses of $0.5 million from share of results from its joint ventures in FY2012.
Income taxes
In FY2012, the Group had tax credit of $0.7 million, which comprised mainly the deferred tax credit of $1.4 million, partially offset by tax expenses of $0.7 million.
27
ELL
IPSIZ
LTD
/ A
nnual
Report
2012
fi nancial review
Net profi t attributable to Owners of the Company
The Group had net profi t after taxes and non-controlling interests of $2.2 million for the year as compared to the net profi ts of $10.3 million in FY2011.
Current year’s net profi ts included one-time expenses relating to the cessation of the Group’s pump refurbishment activities in Taiwan that amounted to approximately $2.2 million. Excluding the one-time expenses, the Group’s net profi t was $4.4 million in FY2012. Net profi ts for the previous fi nancial year was $7.2 million, after excluding certain one-time net income of $3.1 million, mainly from gain on disposal of asset classifi ed as held for sale, reversal of impairment on investment in an associate, partially offset by impairment provision on carrying amounts of plant and machinery as well as goodwill. The lower gross profi ts mainly resulting from the decline in revenue, partially offset by the decrease in operating expenses, were the main causes that led to the negative variance of $2.8 million in net profi ts.
FINANCIAL CONDITIONS
Non-current assets
The non-current assets increased by 13% from $59.4 million to $67.0 million. This is attributable to share of results and translation gains relating to the Group’s investment in associates, increase in trade and other receivables (non-current portion), additional investment in fi nancial assets as well as increase in deferred tax assets of the Group during the fi nancial year. The increase in trade and other receivables was caused mainly by the increase in sundry receivables. During the year, the Group disposed one of its 51% owned subsidiaries and consequentially the intercompany balances which were eliminated prior to the disposal of these subsidiary were now recorded as sundry receivables.
Current assets
Total current asset as at 30 June 2012 was $81.6 million, a marginal drop of 2% from $82.9 million as at 30 June 2011. Lower inventories (mainly due to the provision of stock obsolescence of inventory arising from the decision to cease the pump refurbishment activities) and the decreased cash and cash equivalents, partially offset by higher project-in-progress as of balance sheet date were the main causes for the 2% decline in current assets. The decrease in cash and cash equivalents was mainly due to the purchase of fi nancial assets and payment of dividend.
Current liabilities and non-current liabilities
Total liabilities as at 30 June 2012 stood at $45.4 million, a 5% increase from $43.1 million as at 30 June 2011. The increase was mainly attributed to the increase in trade and other payables, partially offset by lower interest-bearing borrowings and current tax payable.
LIQUIDITY AND CAPITAL RESERVES
The net cash outfl ow of the Group for the year ended 30 June 2012 was $3.1 million. This can be accounted by:
(a) cash infl ow of $4.5 million for operating activities;(b) cash outfl ow of $5.6 million for investing activities; and(c) cash outfl ow of $2.0 million for fi nancing activities.
The operating profi t before working capital changes in the year, coupled with the decrease in inventories and increase in payables, partially offset by the increase in project-in-progress and payment of tax during the year, led to the cash infl ow from operating activities of $4.5 million.
The purchase of additional plant and equipment, intangible assets and fi nancial assets were the key reasons for the negative cashfl ow of $5.6 million for investing activities, while payment of dividend during the year and net repayment of interest-bearing borrowings were the main reasons for the outfl ow of cash for fi nancing activities. As at 30 June 2012, the Group’s cash and cash equivalents position (including fi xed deposits held as securities) was $32.3 million.

28ELL
IPSIZ
LTD
/ A
nnual
Report
2012
Following a tepid growth for 2011, the worldwide semiconductor industry is expected to record another year of uninspiring growth for 2012.
According to the World Semiconductor Trade Statistics (WSTS) Spring 2012 forecast, the global semiconductor revenue is expected to grow by a mere 0.4% to US$301 billion in 2012 as optimism continued to be tempered by macroeconomic factors. Regionally, growth rate of 3.2% is expected in the Americas, with projection of 1.7% in Japan, 0.1% in the Asia Pacifi c region and a slight downturn of 3.5% in Europe this year. The industry is, however, expected to grow healthily at 7.2% to US$322 billion in 2013 and 4.4% to US$337 billion in 2014.
In its August market report on global semiconductor market, IHS iSuppli had downgraded its forecast for 2012. It had cut its projection from a growth of 3% to a slight contraction of 0.1% to mark the fi rst annual decline since 2009.
Downgrade was triggered by the weakening of economic conditions which are impacting demand for personal computers (PC) and related electronic components. The worsening deceleration of the PC semiconductor market is expected to outweigh semiconductor demand forecast for expanded wireless communications and the small industrial electronics segments. Similarly, IHS iSuppli expects growth to pick up in 2013 on better macroeconomic environment, positive spillover effects from the introduction and shipment of exciting new products like ultrabooks and other ultrathin PC platforms in the second half of 2012.
DSS BUSINESS OUTLOOK
The Distribution & Services solutions (DSS) business distributes a wide range of manufacturing, testing and inspection equipment, tools and consumables and provides complementary outsourcing services including facilities management service to the semiconductor, electronics contract manufacturing and telecommunication industries. Hence, the prospect of our DSS business is dependent on that of the semiconductor, electronics manufacturing and telecommunication industries.
industry outlook
336.5
Chart 1: Global Semiconductor Revenue Forecast (US$ billions)
0
50
100
150
200
250
300
350
400
2008 2009 2010 2011 2012F 2013F 2014F
Source: World Semiconductor Trade Statistics (WSTS), June 2012
248.6226.3
298.3 299.5 300.9322.4
29
ELL
IPSIZ
LTD
/ A
nnual
Report
2012
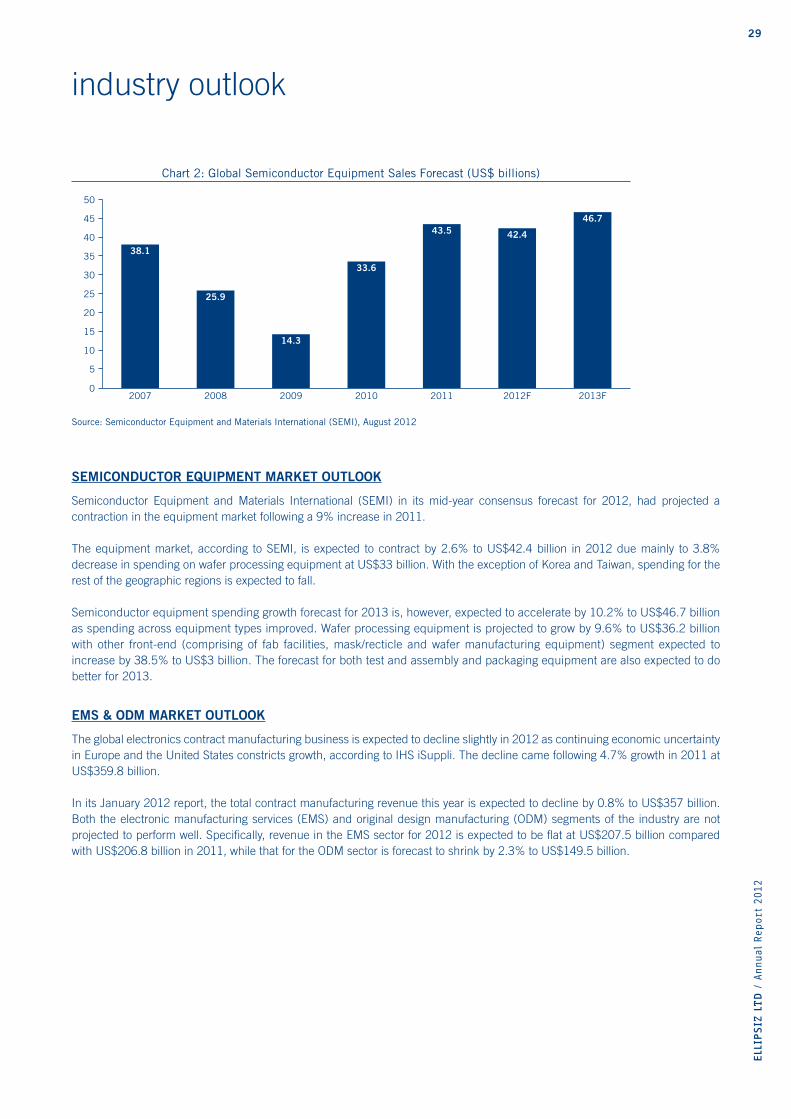
SEMICONDUCTOR EQUIPMENT MARKET OUTLOOK
Semiconductor Equipment and Materials International (SEMI) in its mid-year consensus forecast for 2012, had projected a contraction in the equipment market following a 9% increase in 2011.
The equipment market, according to SEMI, is expected to contract by 2.6% to US$42.4 billion in 2012 due mainly to 3.8% decrease in spending on wafer processing equipment at US$33 billion. With the exception of Korea and Taiwan, spending for the rest of the geographic regions is expected to fall.
Semiconductor equipment spending growth forecast for 2013 is, however, expected to accelerate by 10.2% to US$46.7 billion as spending across equipment types improved. Wafer processing equipment is projected to grow by 9.6% to US$36.2 billion with other front-end (comprising of fab facilities, mask/recticle and wafer manufacturing equipment) segment expected to increase by 38.5% to US$3 billion. The forecast for both test and assembly and packaging equipment are also expected to do better for 2013.
EMS & ODM MARKET OUTLOOK
The global electronics contract manufacturing business is expected to decline slightly in 2012 as continuing economic uncertainty in Europe and the United States constricts growth, according to IHS iSuppli. The decline came following 4.7% growth in 2011 at US$359.8 billion.
In its January 2012 report, the total contract manufacturing revenue this year is expected to decline by 0.8% to US$357 billion. Both the electronic manufacturing services (EMS) and original design manufacturing (ODM) segments of the industry are not projected to perform well. Specifi cally, revenue in the EMS sector for 2012 is expected to be fl at at US$207.5 billion compared with US$206.8 billion in 2011, while that for the ODM sector is forecast to shrink by 2.3% to US$149.5 billion.
industry outlook
46.7
Chart 2: Global Semiconductor Equipment Sales Forecast (US$ billions)
2007 2008 2009 2010 2011 2012F 2013F
Source: Semiconductor Equipment and Materials International (SEMI), August 2012
38.1
25.9
14.3
33.6
43.5 42.4
0
10
20
25
30
35
40
45
50
5
15
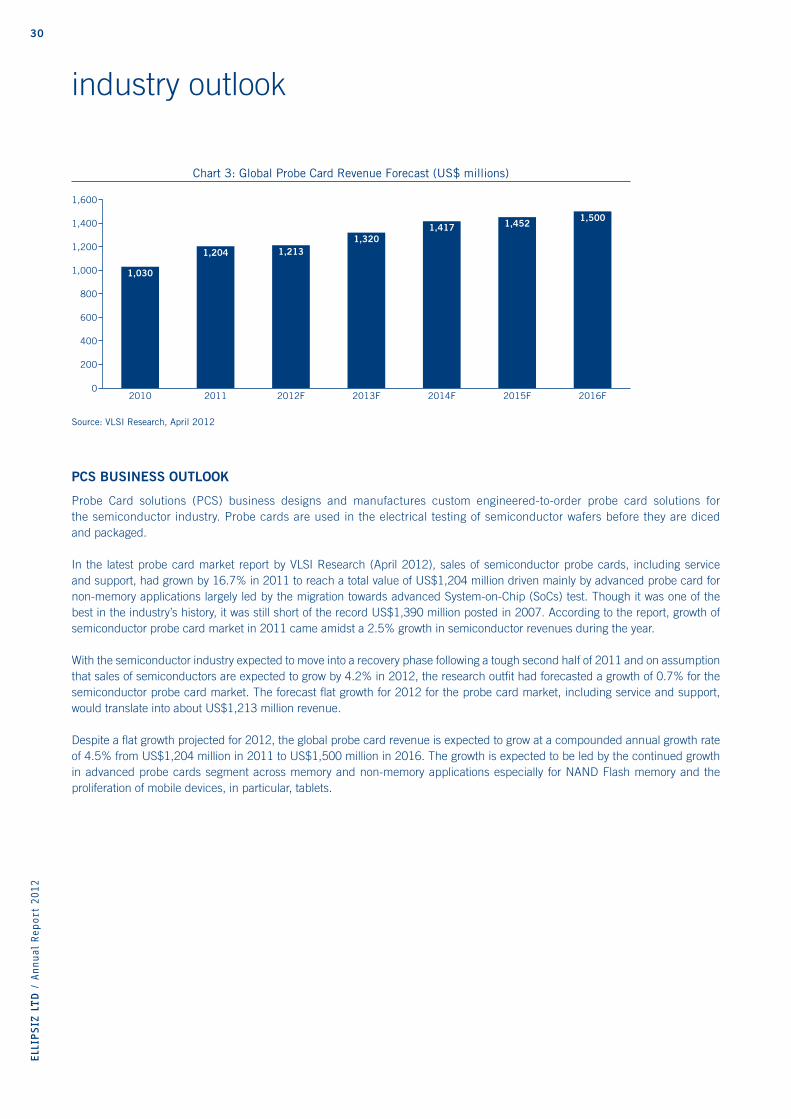
30ELL
IPSIZ
LTD
/ A
nnual
Report
2012
PCS BUSINESS OUTLOOK
Probe Card solutions (PCS) business designs and manufactures custom engineered-to-order probe card solutions for the semiconductor industry. Probe cards are used in the electrical testing of semiconductor wafers before they are diced and packaged.
In the latest probe card market report by VLSI Research (April 2012), sales of semiconductor probe cards, including service and support, had grown by 16.7% in 2011 to reach a total value of US$1,204 million driven mainly by advanced probe card for non-memory applications largely led by the migration towards advanced System-on-Chip (SoCs) test. Though it was one of the best in the industry’s history, it was still short of the record US$1,390 million posted in 2007. According to the report, growth of semiconductor probe card market in 2011 came amidst a 2.5% growth in semiconductor revenues during the year.
With the semiconductor industry expected to move into a recovery phase following a tough second half of 2011 and on assumption that sales of semiconductors are expected to grow by 4.2% in 2012, the research outfi t had forecasted a growth of 0.7% for the semiconductor probe card market. The forecast fl at growth for 2012 for the probe card market, including service and support, would translate into about US$1,213 million revenue.
Despite a fl at growth projected for 2012, the global probe card revenue is expected to grow at a compounded annual growth rate of 4.5% from US$1,204 million in 2011 to US$1,500 million in 2016. The growth is expected to be led by the continued growth in advanced probe cards segment across memory and non-memory applications especially for NAND Flash memory and the proliferation of mobile devices, in particular, tablets.
industry outlook
1,500
Chart 3: Global Probe Card Revenue Forecast (US$ millions)
2010 2011 2012F 2013F 2014F 2015F 2016F
Source: VLSI Research, April 2012
1,030
1,204 1,2131,320
1,417 1,452
0
200
400
600
800
1,000
1,200
1,400
1,600
31
ELL
IPSIZ
LTD
/ A
nnual
Report
2012
risks management
The Audit Committee assumes the supervisory responsibility for the Group’s risk management function. The objective of risk management is to safeguard the Group’s assets and our stakeholders’ investment so as to steer the Group to the next level of growth whilst operating within the Group’s risk parameters. The Committee works with the management team to identify the key risk areas and establishes the appropriate mitigating controls. Risks are reviewed and managed at each level of reporting and consolidated for review at overall Group level. Together with on-going reviews and assessments by the Board, the Committee, management and internal auditors, continuing efforts will be made at enhancing controls and processes that need improvement. Note 29 to the fi nancial statements provided further information on the management of the key fi nancial risks.
Risks identifi ed by the Group can broadly be categorised into strategic, operational, fi nancial and compliance risks. During the year, the key risks faced by the Group are summarised as follows:
GEOPOLITICAL & MACROECONOMIC RISKS
We operate in, and sell our products and services to customers in various countries, including Singapore, Malaysia, China, Thailand, Taiwan R.O.C., Vietnam, India, Japan, New Zealand, Europe and the United States. As a result, our business and its future growth are dependent on the political, economic, regulatory and social conditions of these countries. Any change in the policies implemented by the governments of any of these countries which result in currency and interest rate fl uctuations, capital restrictions, and changes in duties and tax that are detrimental to our business could materially and adversely affect our operations, fi nancial performance and future growth.
Our businesses are also affected by macroeconomic factors such as the performance of the US economy and major economies in Asia as they have an impact on the end market consumption, consumer sentiment and consequently the market demand for our products and services.
The uncertain global economic environment had affected the demand for and consumption of electronic gadgets, which in turn, led to uncertainties in the capital spending by our customers. Success rate on the implementation of policies to rebuild confi dence and stability, particularly in the Euro area, and policy efforts including fi scal consolidation would continue to pose signifi cant macroeconomic risks to the operating performance of our businesses.
OBSOLESCENCE & INTELLECTUAL PROPERTY RISKS
The technologies in the industries we operate in are subject to constant change and innovation, this might shorten the life span of our inventory and render them obsolete. Any inability to anticipate demand fl uctuations could potentially lead to obsolescence of inventory, and hence, leading to longer cash conversion cycle and other related costs that could adversely affect our fi nancial position.
In addition to obsolescence risk, the inability to obtain patents and other intellectual property rights that are crucial to the protection of our technological know-how and competitive advantage would adversely impact our operations and fi nancial performance.
LOSS OF KEY PRODUCTS DISTRIBUTORSHIPS & SERVICE CONTRACTS
We are constantly facing intense competition from other leading players, and it is imperative that we identify, expand and secure exclusive distributorships for leading products and/or brands crucial to the manufacturing processes of the semiconductor and electronics manufacturing services (“EMS”) industries, and provide unparalleled services to our customers through service contracts. Loss of key product distributorships and service contracts as well as the inability to boost our product and service offerings would have a material adverse impact on our businesses as well as fi nancial results.
MANPOWER RISK
Success of our business depends on the continued efforts and abilities of our management team and technical personnel. Should any of our key employees voluntarily terminate their employment and we are unable to retain or replace with a suitably qualifi ed personnel, this could have a material adverse effect on our business and results. Similarly, should we be unable to attract suitably qualifi ed personnel for our expansion programme, this could also have an adverse impact on our future operations.
32ELL
IPSIZ
LTD
/ A
nnual
Report
2012
CYCLICALITY OF THE SEMICONDUCTOR AND EMS INDUSTRIES
We operate mainly in the semiconductor and EMS sectors. The semiconductor industry is highly cyclical due to the abrupt fl uctuations in supply and demand of semiconductors. The timing, length and severity of such fl uctuations are becoming increasingly diffi cult to predict. In addition, the industry faces constant pricing pressure due to continued intense competition. In the event of a prolong change, especially downturn, in the semiconductor industry, the Group’s operating results could be materially affected.
The EMS industry is deemed to be less cyclical compared to the semiconductor industry, but it is highly seasonal with the second half of the calendar year typically stronger than the fi rst. Pricing is also under constant pressure in this industry and the product life cycles are short. Similar to the semiconductor industry, orders can be deferred, modifi ed or cancelled by customers and under such event, there could be adverse impact on our fi nancial performance.
FOREIGN EXCHANGE RISK
As the Group is involved in international trading, it is exposed to foreign exchange risks for its sales, purchases, trade receivables, trade payables and cash and cash equivalents denominated in foreign currencies. The currency giving rise to this risk is primarily the US Dollar. Currently, the Group relies on natural hedging between its sales and purchases, its trade receivables and trade payables. However, there are still risks arising from foreign exchange exposure especially if there are sharp movements in exchange rates. Our fi nancial performance could be adversely affected under those circumstances.
REGULATORY AND COMPLIANCE RISKS
The Group’s global operations are subject to government laws and regulations of the countries it operates in. This may impact or limit our fl exibility to respond to market conditions, competition, new technologies or changes in cost structures. The new government legislation, regulations and policies may also increase our compliance costs and in turn may adversely affect our operating results.
risks management

fi nancial statements
CONTENTS
34 directors’ report 40 statement by directors 41 independent auditors’ report42 statements of fi nancial position 43 statements of comprehensive income 44 consolidated statement of changes in equity 46 statement of changes in equity 47 consolidated statement of cash fl ows 50 notes to the fi nancial statements
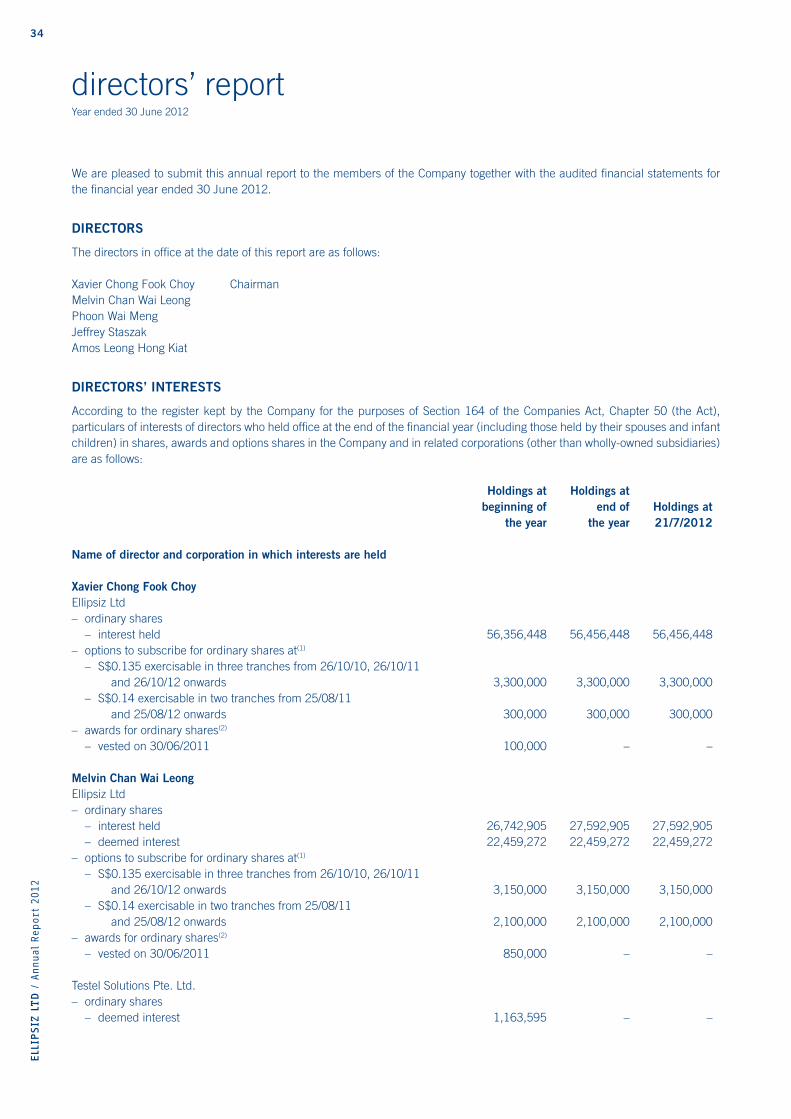
34ELL
IPSIZ
LTD
/ A
nnual
Report
2012
We are pleased to submit this annual report to the members of the Company together with the audited fi nancial statements for the fi nancial year ended 30 June 2012.
DIRECTORS
The directors in offi ce at the date of this report are as follows:
Xavier Chong Fook Choy ChairmanMelvin Chan Wai Leong Phoon Wai Meng Jeffrey Staszak Amos Leong Hong Kiat
DIRECTORS’ INTERESTS
According to the register kept by the Company for the purposes of Section 164 of the Companies Act, Chapter 50 (the Act), particulars of interests of directors who held offi ce at the end of the fi nancial year (including those held by their spouses and infant children) in shares, awards and options shares in the Company and in related corporations (other than wholly-owned subsidiaries) are as follows:
Holdings at Holdings at beginning of end of Holdings at the year the year 21/7/2012
Name of director and corporation in which interests are held
Xavier Chong Fook ChoyEllipsiz Ltd– ordinary shares – interest held 56,356,448 56,456,448 56,456,448– options to subscribe for ordinary shares at(1)
– S$0.135 exercisable in three tranches from 26/10/10, 26/10/11 and 26/10/12 onwards 3,300,000 3,300,000 3,300,000 – S$0.14 exercisable in two tranches from 25/08/11 and 25/08/12 onwards 300,000 300,000 300,000– awards for ordinary shares(2)
– vested on 30/06/2011 100,000 – –
Melvin Chan Wai LeongEllipsiz Ltd– ordinary shares – interest held 26,742,905 27,592,905 27,592,905 – deemed interest 22,459,272 22,459,272 22,459,272– options to subscribe for ordinary shares at(1)
– S$0.135 exercisable in three tranches from 26/10/10, 26/10/11 and 26/10/12 onwards 3,150,000 3,150,000 3,150,000 – S$0.14 exercisable in two tranches from 25/08/11 and 25/08/12 onwards 2,100,000 2,100,000 2,100,000– awards for ordinary shares(2)
– vested on 30/06/2011 850,000 – –
Testel Solutions Pte. Ltd.– ordinary shares – deemed interest 1,163,595 – –
directors’ reportYear ended 30 June 2012
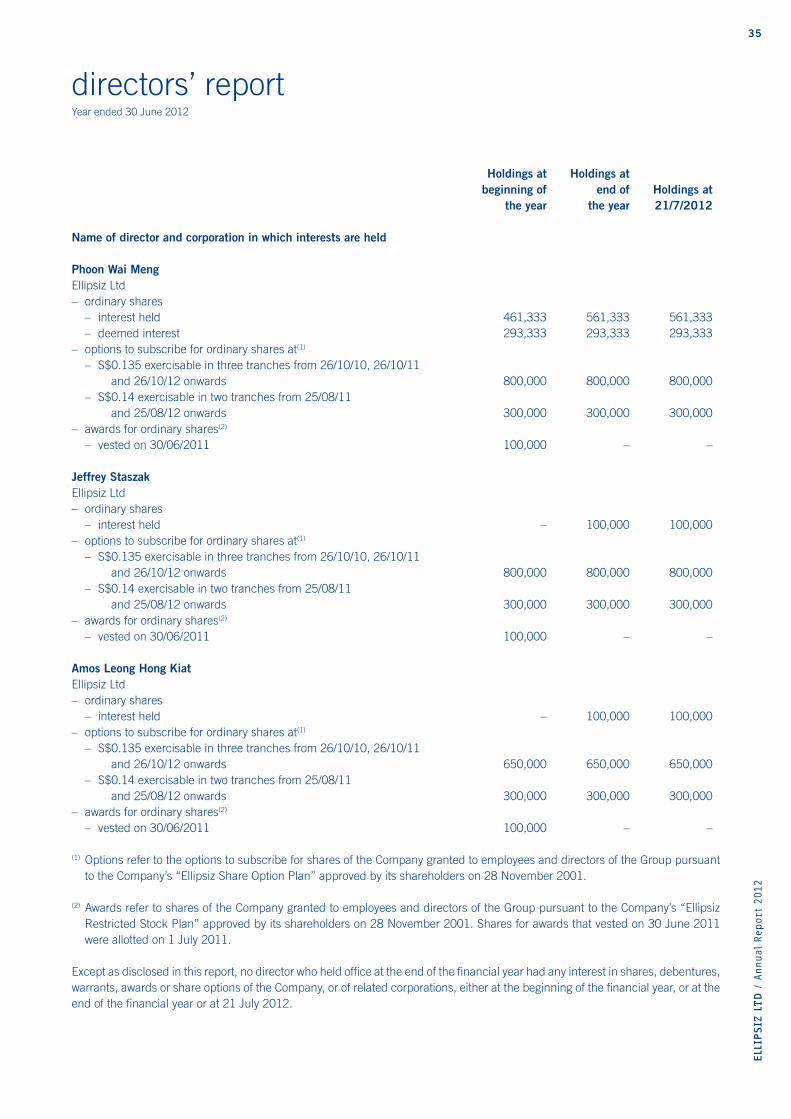
35
ELL
IPSIZ
LTD
/ A
nnual
Report
2012
Holdings at Holdings at beginning of end of Holdings at the year the year 21/7/2012
Name of director and corporation in which interests are held
Phoon Wai MengEllipsiz Ltd– ordinary shares – interest held 461,333 561,333 561,333 – deemed interest 293,333 293,333 293,333– options to subscribe for ordinary shares at(1)
– S$0.135 exercisable in three tranches from 26/10/10, 26/10/11 and 26/10/12 onwards 800,000 800,000 800,000 – S$0.14 exercisable in two tranches from 25/08/11 and 25/08/12 onwards 300,000 300,000 300,000– awards for ordinary shares(2)
– vested on 30/06/2011 100,000 – –
Jeffrey StaszakEllipsiz Ltd– ordinary shares – interest held – 100,000 100,000– options to subscribe for ordinary shares at(1)
– S$0.135 exercisable in three tranches from 26/10/10, 26/10/11 and 26/10/12 onwards 800,000 800,000 800,000 – S$0.14 exercisable in two tranches from 25/08/11 and 25/08/12 onwards 300,000 300,000 300,000– awards for ordinary shares(2)
– vested on 30/06/2011 100,000 – –
Amos Leong Hong KiatEllipsiz Ltd– ordinary shares – interest held – 100,000 100,000– options to subscribe for ordinary shares at(1)
– S$0.135 exercisable in three tranches from 26/10/10, 26/10/11 and 26/10/12 onwards 650,000 650,000 650,000 – S$0.14 exercisable in two tranches from 25/08/11 and 25/08/12 onwards 300,000 300,000 300,000– awards for ordinary shares(2)
– vested on 30/06/2011 100,000 – –
(1) Options refer to the options to subscribe for shares of the Company granted to employees and directors of the Group pursuant to the Company’s “Ellipsiz Share Option Plan” approved by its shareholders on 28 November 2001.
(2) Awards refer to shares of the Company granted to employees and directors of the Group pursuant to the Company’s “Ellipsiz Restricted Stock Plan” approved by its shareholders on 28 November 2001. Shares for awards that vested on 30 June 2011 were allotted on 1 July 2011.
Except as disclosed in this report, no director who held offi ce at the end of the fi nancial year had any interest in shares, debentures, warrants, awards or share options of the Company, or of related corporations, either at the beginning of the fi nancial year, or at the end of the fi nancial year or at 21 July 2012.
directors’ reportYear ended 30 June 2012

36ELL
IPSIZ
LTD
/ A
nnual
Report
2012
Except as disclosed under the “Share Plans” section of this report, neither at the end of, nor at any time during the fi nancial year, was the Company a party to any arrangement whose objects are, or one of whose objects is, to enable the directors of the Company to acquire benefi ts by means of the acquisition of shares in or debentures of the Company or any other body corporate.
Except for salaries, bonuses, fees and those benefi ts that are disclosed in the notes 22 and 27 to the fi nancial statements, since the end of the last fi nancial year, no director has received or become entitled to receive a benefi t by reason of a contract made by the Company or a related corporation with the director, or with a fi rm in which he is a member, or with a company in which he has a substantial fi nancial interest.
SHARE PLANS
On 28 November 2001, the Company approved the “Ellipsiz Share Option Plan” and the “Ellipsiz Restricted Stock Plan”, collectively known as the “Plans”. The “Ellipsiz Share Option Plan” (“ESOP”) enables selected employees and non-executive directors of the Group to subscribe for shares in the Company. The “Ellipsiz Restricted Stock Plan” (“ERSP”) enables selected employees and non-executive directors of the Group, other than controlling shareholders or their associates, to receive awards in the form of fully paid shares, their equivalent cash value or combination thereof, free of charge. The Plans expired on 28 November 2011, without prejudice to the options and awards that were previously granted under the Plans.
There are no awards outstanding under the ERSP.
On 26 October 2009 and 25 August 2010, the Company approved and granted options under the ESOP. Details of outstanding options granted on the unissued ordinary shares of the Company during the fi nancial year, are set out in note 26 to the fi nancial statements.
The Plans are administered by the Remuneration Committee.
Other salient details regarding the ESOP are set out below:
(a) The total number of new shares over which options may be granted pursuant to the ESOP, when added to the number of new shares issued and issuable in respect of all options granted, and all awards granted under the ERSP, shall not exceed 15% of the issued share capital of the Company (or such other limit that may be imposed by the Companies Act or the Singapore Exchange Securities Trading Limited (SGX-ST) Listing Manual) on the day preceding the relevant date of grant.
(b) The subscription price of the option shares is the price equal to the volume-weighted average price of the Company’s shares on SGX-ST over 7 consecutive trading days immediately preceding the date of grant of the relevant options or such higher price as may be determined by the Remuneration Committee. Options may be exercised one year after the grant date and will expire on the 5th anniversary of the grant date, and in accordance with a vesting schedule and the conditions (if any) to be determined by the Remuneration Committee on such option’s grant date, unless they are cancelled or have lapsed.
Details of options and awards granted to directors of the Company under the Plans are as follows:
Options granted Aggregate options Aggregate options for fi nancial granted since exercised since Aggregate options Aggregate options year ended commencement to commencement to expired as at outstanding as atDirector 30 June 2012 30 June 2012 30 June 2012 30 June 2012 30 June 2012 No. of No. of No. of No. of No. of share share share share share options % options % options % options % options %
Xavier Chong Fook Choy – – 3,840,000 0.69 165,200 0.03 74,800 0.01 3,600,000 0.65Melvin Chan Wai Leong – – 5,250,000 0.95 – – – – 5,250,000 0.95Phoon Wai Meng – – 1,100,000 0.20 – – – – 1,100,000 0.20Jeffrey Staszak – – 1,100,000 0.20 – – – – 1,100,000 0.20Amos Leong Hong Kiat – – 950,000 0.17 – – – – 950,000 0.17
directors’ reportYear ended 30 June 2012
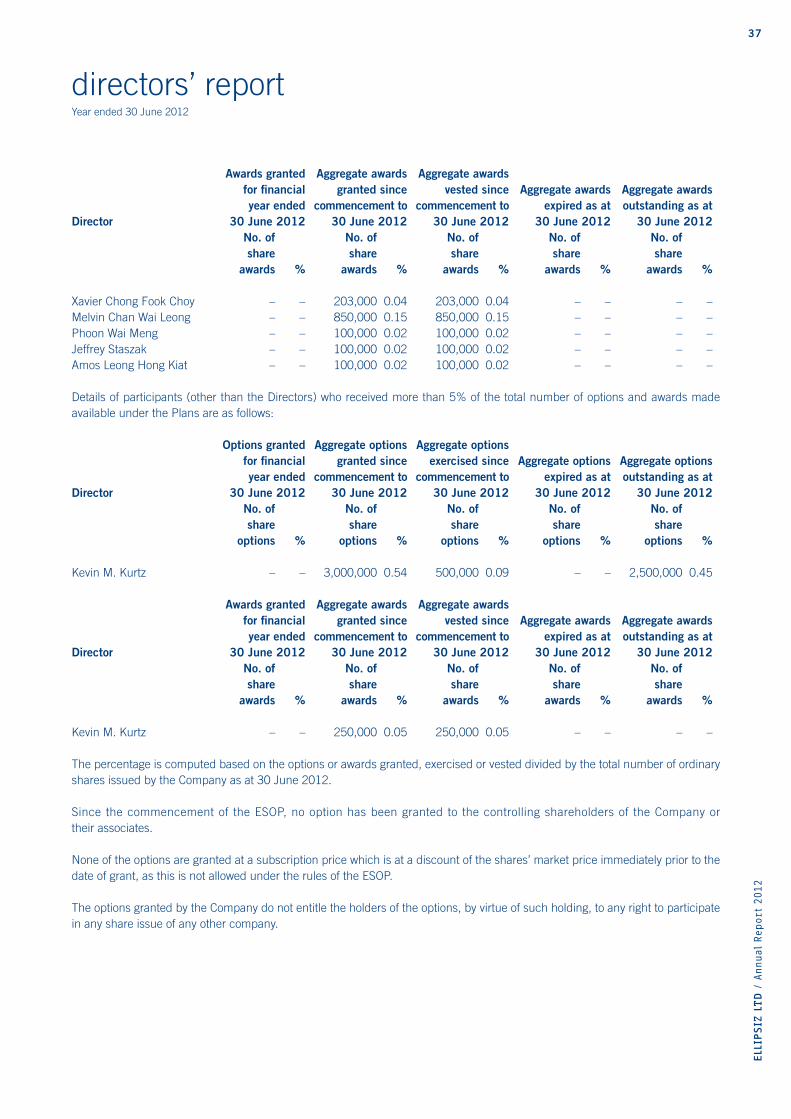
37
ELL
IPSIZ
LTD
/ A
nnual
Report
2012
Awards granted Aggregate awards Aggregate awards for fi nancial granted since vested since Aggregate awards Aggregate awards year ended commencement to commencement to expired as at outstanding as atDirector 30 June 2012 30 June 2012 30 June 2012 30 June 2012 30 June 2012 No. of No. of No. of No. of No. of share share share share share awards % awards % awards % awards % awards %
Xavier Chong Fook Choy – – 203,000 0.04 203,000 0.04 – – – –Melvin Chan Wai Leong – – 850,000 0.15 850,000 0.15 – – – –Phoon Wai Meng – – 100,000 0.02 100,000 0.02 – – – –Jeffrey Staszak – – 100,000 0.02 100,000 0.02 – – – –Amos Leong Hong Kiat – – 100,000 0.02 100,000 0.02 – – – –
Details of participants (other than the Directors) who received more than 5% of the total number of options and awards made available under the Plans are as follows:
Options granted Aggregate options Aggregate options for fi nancial granted since exercised since Aggregate options Aggregate options year ended commencement to commencement to expired as at outstanding as atDirector 30 June 2012 30 June 2012 30 June 2012 30 June 2012 30 June 2012 No. of No. of No. of No. of No. of share share share share share options % options % options % options % options %
Kevin M. Kurtz – – 3,000,000 0.54 500,000 0.09 – – 2,500,000 0.45
Awards granted Aggregate awards Aggregate awards for fi nancial granted since vested since Aggregate awards Aggregate awards year ended commencement to commencement to expired as at outstanding as atDirector 30 June 2012 30 June 2012 30 June 2012 30 June 2012 30 June 2012 No. of No. of No. of No. of No. of share share share share share awards % awards % awards % awards % awards %
Kevin M. Kurtz – – 250,000 0.05 250,000 0.05 – – – –
The percentage is computed based on the options or awards granted, exercised or vested divided by the total number of ordinary shares issued by the Company as at 30 June 2012.
Since the commencement of the ESOP, no option has been granted to the controlling shareholders of the Company or their associates.
None of the options are granted at a subscription price which is at a discount of the shares’ market price immediately prior to the date of grant, as this is not allowed under the rules of the ESOP.
The options granted by the Company do not entitle the holders of the options, by virtue of such holding, to any right to participate in any share issue of any other company.
directors’ reportYear ended 30 June 2012
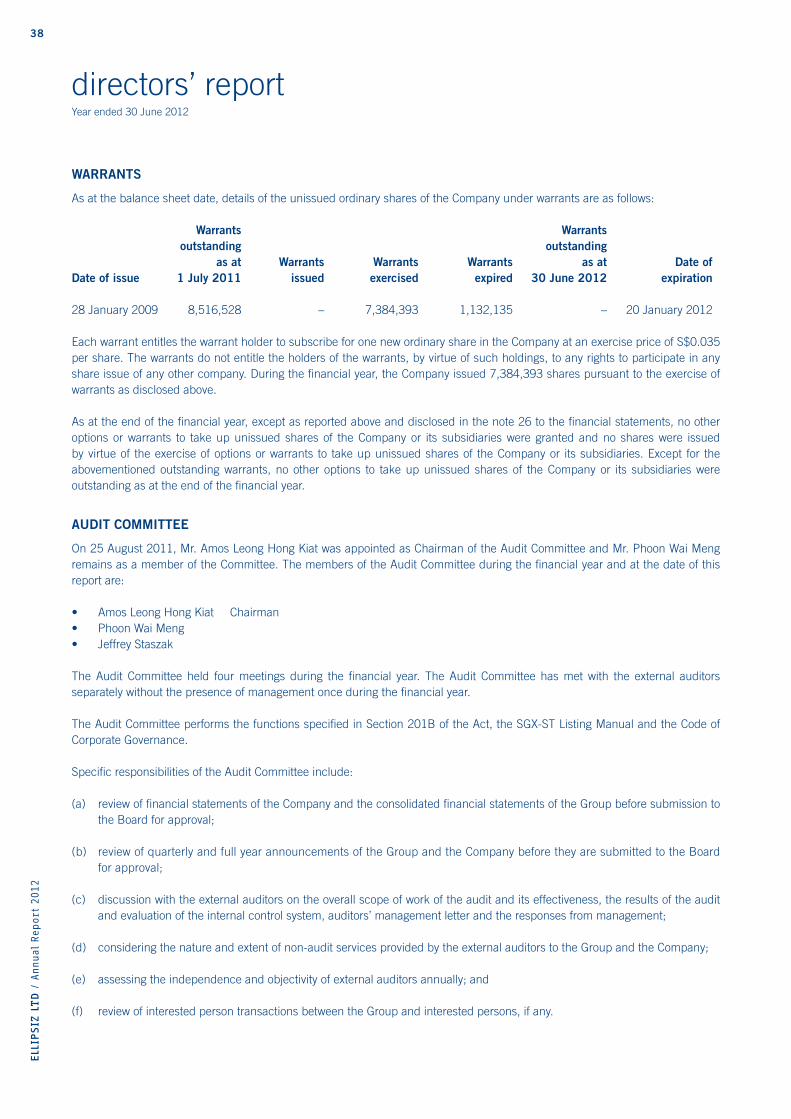
38ELL
IPSIZ
LTD
/ A
nnual
Report
2012
WARRANTS
As at the balance sheet date, details of the unissued ordinary shares of the Company under warrants are as follows:
Warrants Warrants outstanding outstanding as at Warrants Warrants Warrants as at Date ofDate of issue 1 July 2011 issued exercised expired 30 June 2012 expiration
28 January 2009 8,516,528 – 7,384,393 1,132,135 – 20 January 2012
Each warrant entitles the warrant holder to subscribe for one new ordinary share in the Company at an exercise price of S$0.035 per share. The warrants do not entitle the holders of the warrants, by virtue of such holdings, to any rights to participate in any share issue of any other company. During the fi nancial year, the Company issued 7,384,393 shares pursuant to the exercise of warrants as disclosed above.
As at the end of the fi nancial year, except as reported above and disclosed in the note 26 to the fi nancial statements, no other options or warrants to take up unissued shares of the Company or its subsidiaries were granted and no shares were issued by virtue of the exercise of options or warrants to take up unissued shares of the Company or its subsidiaries. Except for the abovementioned outstanding warrants, no other options to take up unissued shares of the Company or its subsidiaries were outstanding as at the end of the fi nancial year.
AUDIT COMMITTEE
On 25 August 2011, Mr. Amos Leong Hong Kiat was appointed as Chairman of the Audit Committee and Mr. Phoon Wai Meng remains as a member of the Committee. The members of the Audit Committee during the fi nancial year and at the date of this report are:
• Amos Leong Hong Kiat Chairman • Phoon Wai Meng • Jeffrey Staszak
The Audit Committee held four meetings during the fi nancial year. The Audit Committee has met with the external auditors separately without the presence of management once during the fi nancial year.
The Audit Committee performs the functions specifi ed in Section 201B of the Act, the SGX-ST Listing Manual and the Code of Corporate Governance.
Specifi c responsibilities of the Audit Committee include:
(a) review of fi nancial statements of the Company and the consolidated fi nancial statements of the Group before submission to the Board for approval;
(b) review of quarterly and full year announcements of the Group and the Company before they are submitted to the Board for approval;
(c) discussion with the external auditors on the overall scope of work of the audit and its effectiveness, the results of the audit and evaluation of the internal control system, auditors’ management letter and the responses from management;
(d) considering the nature and extent of non-audit services provided by the external auditors to the Group and the Company;
(e) assessing the independence and objectivity of external auditors annually; and
(f) review of interested person transactions between the Group and interested persons, if any.
directors’ reportYear ended 30 June 2012
39
ELL
IPSIZ
LTD
/ A
nnual
Report
2012
In accordance with Chapter 9 of the SGX-ST Listing Manual, the Audit Committee has reviewed the requirements for approval and disclosure of interested person transactions, and reviewed the internal procedures set up by the Company to identify and report and when necessary, seek approval for interested person transactions.
In accordance with Chapter 12 of the SGX-ST Listing Manual, the Audit Committee has undertaken a review of all non-audit services provided by the external auditors and is satisfi ed these services would not, in the Audit Committee’s opinion, affect the independence of the external auditors.
The Audit Committee has full access to management and is given the resources required for it to discharge its functions. It has full authority and discretion to invite any director or executive offi cer to attend its meetings. The Audit Committee also recommends the appointment of the external auditors and reviews the level of audit and non-audit fees.
The Audit Committee is satisfi ed with the independence and objectivity of the external auditors and has recommended to the Board of Directors that the auditors, KPMG LLP, be nominated for re-appointment as auditors at the forthcoming Annual General Meeting of the Company.
AUDITORS
The auditors, KPMG LLP, have indicated their willingness to accept re-appointment.
On behalf of the Board of Directors
Xavier Chong Fook ChoyDirector
Melvin Chan Wai LeongDirector
Singapore11 September 2012
directors’ reportYear ended 30 June 2012

40ELL
IPSIZ
LTD
/ A
nnual
Report
2012
statement by directorsYear ended 30 June 2012
In our opinion:
(a) the fi nancial statements set out on pages 42 to 105 are drawn up so as to give a true and fair view of the state of affairs of the Group and of the Company as at 30 June 2012 and the results, changes in equity of the Group and the Company and cash fl ows of the Group for the year ended on that date in accordance with the provisions of the Singapore Companies Act, Chapter 50 and Singapore Financial Reporting Standards; and
(b) at the date of this statement, there are reasonable grounds to believe that the Company will be able to pay its debts as and when they fall due.
The Board of Directors has, on the date of this statement, authorised these fi nancial statements for issue.
On behalf of the Board of Directors
Xavier Chong Fook ChoyDirector
Melvin Chan Wai LeongDirector
Singapore11 September 2012

41
ELL
IPSIZ
LTD
/ A
nnual
Report
2012
independent auditors’ reportMembers of the CompanyEllipsiz Ltd
REPORT ON THE FINANCIAL STATEMENTS
We have audited the accompanying fi nancial statements of Ellipsiz Ltd (the Company) and its subsidiaries (the Group), which comprise the statements of fi nancial position of the Group and the Company as at 30 June 2012, the statements of comprehensive income, statements of changes in equity of the Group and the Company and statement of cash fl ows of the Group for the year then ended, and a summary of signifi cant accounting policies and other explanatory information, as set out on pages 42 to 105.
Management’s responsibility for the fi nancial statements
Management is responsible for the preparation of fi nancial statements that give a true and fair view in accordance with the provisions of the Singapore Companies Act, Chapter 50 (the Act) and Singapore Financial Reporting Standards, and for devising and maintaining a system of internal accounting controls suffi cient to provide a reasonable assurance that assets are safeguarded against loss from unauthorised use or disposition; and transactions are properly authorised and that they are recorded as necessary to permit the preparation of true and fair profi t and loss accounts and balance sheets and to maintain accountability of assets.
Auditors’ responsibility
Our responsibility is to express an opinion on these fi nancial statements based on our audit. We conducted our audit in accordance with Singapore Standards on Auditing. Those standards require that we comply with ethical requirements and plan and perform the audit to obtain reasonable assurance about whether the fi nancial statements are free from material misstatement.
An audit involves performing procedures to obtain audit evidence about the amounts and disclosures in the fi nancial statements. The procedures selected depend on the auditor’s judgement, including the assessment of the risks of material misstatement of the fi nancial statements, whether due to fraud or error. In making those risk assessments, the auditor considers internal control relevant to the entity’s preparation of fi nancial statements that give a true and fair view in order to design audit procedures that are appropriate in the circumstances, but not for the purpose of expressing an opinion on the effectiveness of the entity’s internal control. An audit also includes evaluating the appropriateness of accounting policies used and the reasonableness of accounting estimates made by management, as well as evaluating the overall presentation of the fi nancial statements.
We believe that the audit evidence we have obtained is suffi cient and appropriate to provide a basis for our audit opinion.
Opinion
In our opinion, the consolidated fi nancial statements of the Group and the statement of fi nancial position, the statement of comprehensive income and statement of changes in equity of the Company are properly drawn up in accordance with the provisions of the Act and Singapore Financial Reporting Standards to give a true and fair view of the state of affairs of the Group and of the Company as at 30 June 2012 and the results, changes in equity and cash fl ows of the Group and the results and changes in equity of the Company for the year ended on that date.
REPORT ON OTHER LEGAL AND REGULATORY REQUIREMENTS
In our opinion, the accounting and other records required by the Act to be kept by the Company and by those subsidiaries incorporated in Singapore of which we are the auditors have been properly kept in accordance with the provisions of the Act.
KPMG LLPPublic Accountants andCertifi ed Public Accountants
Singapore11 September 2012
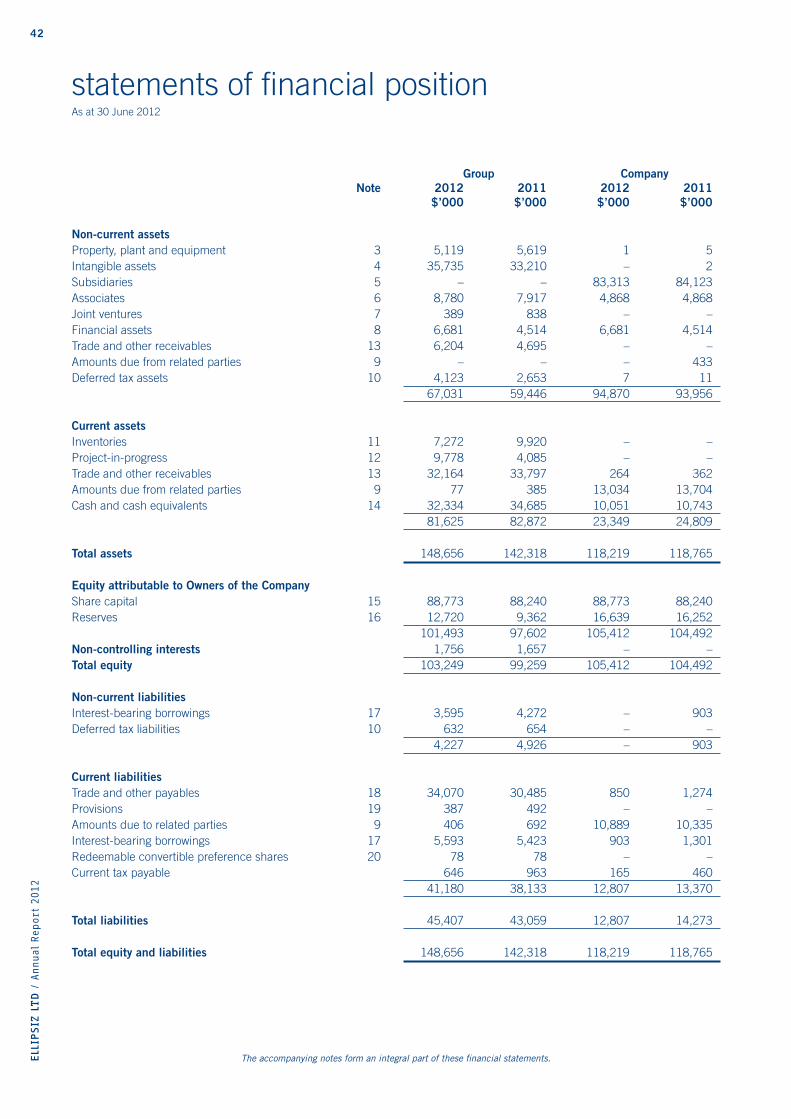
42ELL
IPSIZ
LTD
/ A
nnual
Report
2012
statements of fi nancial positionAs at 30 June 2012
Group Company Note 2012 2011 2012 2011 $’000 $’000 $’000 $’000
Non-current assetsProperty, plant and equipment 3 5,119 5,619 1 5Intangible assets 4 35,735 33,210 – 2Subsidiaries 5 – – 83,313 84,123Associates 6 8,780 7,917 4,868 4,868Joint ventures 7 389 838 – –Financial assets 8 6,681 4,514 6,681 4,514Trade and other receivables 13 6,204 4,695 – –Amounts due from related parties 9 – – – 433Deferred tax assets 10 4,123 2,653 7 11 67,031 59,446 94,870 93,956
Current assetsInventories 11 7,272 9,920 – –Project-in-progress 12 9,778 4,085 – –Trade and other receivables 13 32,164 33,797 264 362Amounts due from related parties 9 77 385 13,034 13,704Cash and cash equivalents 14 32,334 34,685 10,051 10,743 81,625 82,872 23,349 24,809
Total assets 148,656 142,318 118,219 118,765 Equity attributable to Owners of the CompanyShare capital 15 88,773 88,240 88,773 88,240Reserves 16 12,720 9,362 16,639 16,252 101,493 97,602 105,412 104,492Non-controlling interests 1,756 1,657 – –Total equity 103,249 99,259 105,412 104,492
Non-current liabilitiesInterest-bearing borrowings 17 3,595 4,272 – 903Deferred tax liabilities 10 632 654 – – 4,227 4,926 – 903
Current liabilitiesTrade and other payables 18 34,070 30,485 850 1,274Provisions 19 387 492 – –Amounts due to related parties 9 406 692 10,889 10,335Interest-bearing borrowings 17 5,593 5,423 903 1,301Redeemable convertible preference shares 20 78 78 – –Current tax payable 646 963 165 460 41,180 38,133 12,807 13,370
Total liabilities 45,407 43,059 12,807 14,273
Total equity and liabilities 148,656 142,318 118,219 118,765
The accompanying notes form an integral part of these fi nancial statements.
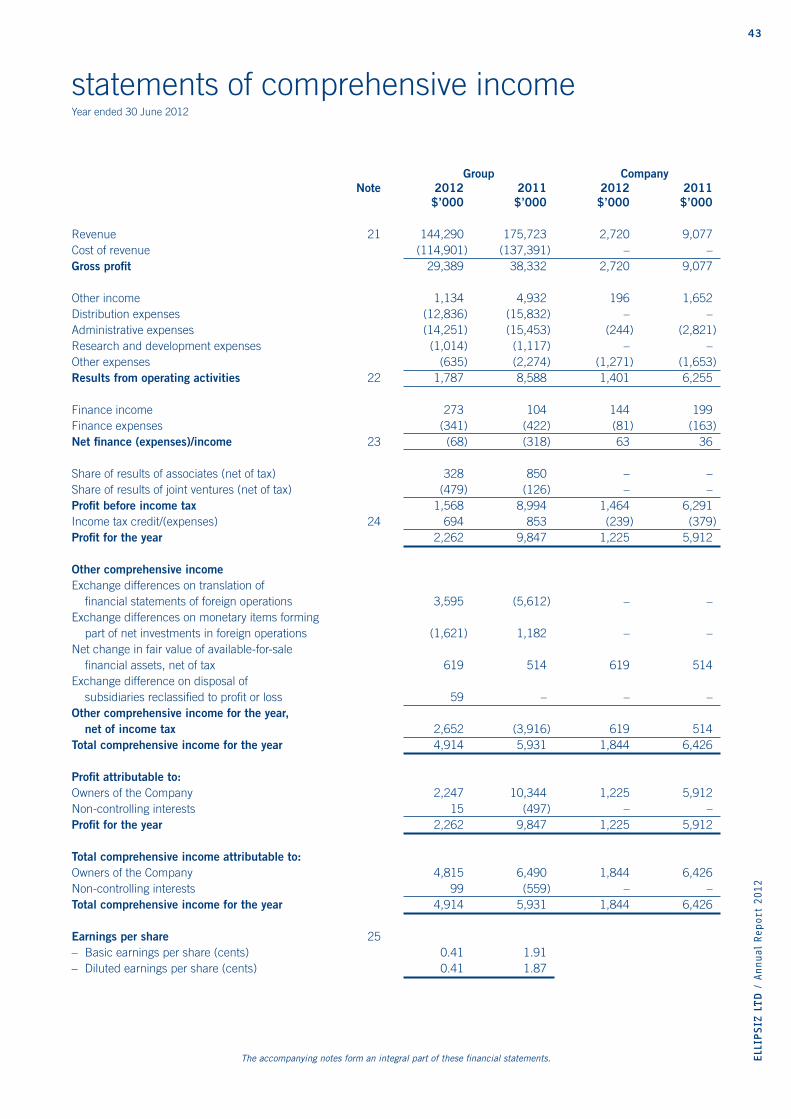
43
ELL
IPSIZ
LTD
/ A
nnual
Report
2012
Group Company Note 2012 2011 2012 2011 $’000 $’000 $’000 $’000
Revenue 21 144,290 175,723 2,720 9,077Cost of revenue (114,901) (137,391) – –Gross profi t 29,389 38,332 2,720 9,077
Other income 1,134 4,932 196 1,652Distribution expenses (12,836) (15,832) – –Administrative expenses (14,251) (15,453) (244) (2,821)Research and development expenses (1,014) (1,117) – –Other expenses (635) (2,274) (1,271) (1,653)Results from operating activities 22 1,787 8,588 1,401 6,255
Finance income 273 104 144 199Finance expenses (341) (422) (81) (163)Net fi nance (expenses)/income 23 (68) (318) 63 36
Share of results of associates (net of tax) 328 850 – –Share of results of joint ventures (net of tax) (479) (126) – –Profi t before income tax 1,568 8,994 1,464 6,291Income tax credit/(expenses) 24 694 853 (239) (379)Profi t for the year 2,262 9,847 1,225 5,912
Other comprehensive incomeExchange differences on translation of fi nancial statements of foreign operations 3,595 (5,612) – –Exchange differences on monetary items forming part of net investments in foreign operations (1,621) 1,182 – –Net change in fair value of available-for-sale fi nancial assets, net of tax 619 514 619 514Exchange difference on disposal of subsidiaries reclassifi ed to profi t or loss 59 – – –Other comprehensive income for the year, net of income tax 2,652 (3,916) 619 514Total comprehensive income for the year 4,914 5,931 1,844 6,426
Profi t attributable to:Owners of the Company 2,247 10,344 1,225 5,912Non-controlling interests 15 (497) – –Profi t for the year 2,262 9,847 1,225 5,912
Total comprehensive income attributable to:Owners of the Company 4,815 6,490 1,844 6,426Non-controlling interests 99 (559) – –Total comprehensive income for the year 4,914 5,931 1,844 6,426
Earnings per share 25– Basic earnings per share (cents) 0.41 1.91 – Diluted earnings per share (cents) 0.41 1.87
statements of comprehensive incomeYear ended 30 June 2012
The accompanying notes form an integral part of these fi nancial statements.
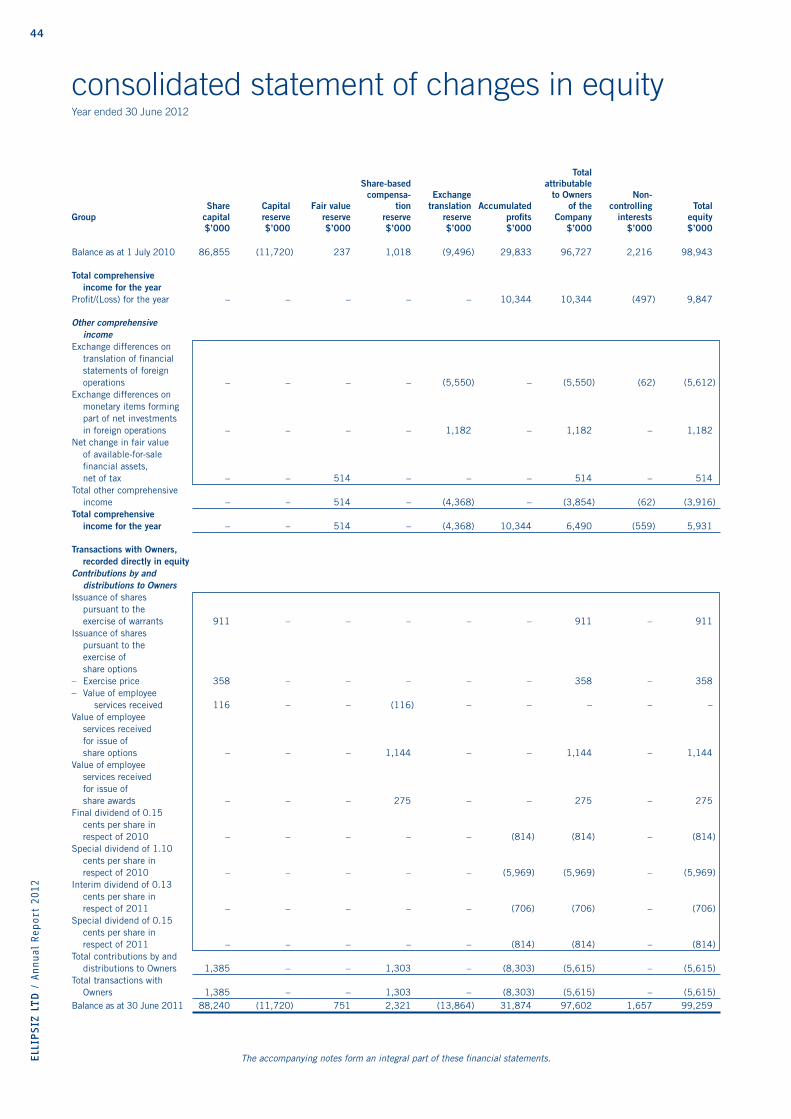
44ELL
IPSIZ
LTD
/ A
nnual
Report
2012
Total Share-based attributable compensa- Exchange to Owners Non- Share Capital Fair value tion translation Accumulated of the controlling Total Group capital reserve reserve reserve reserve profi ts Company interests equity $’000 $’000 $’000 $’000 $’000 $’000 $’000 $’000 $’000
Balance as at 1 July 2010 86,855 (11,720) 237 1,018 (9,496) 29,833 96,727 2,216 98,943
Total comprehensive income for the yearProfi t/(Loss) for the year – – – – – 10,344 10,344 (497) 9,847
Other comprehensive incomeExchange differences on translation of fi nancial statements of foreign operations – – – – (5,550) – (5,550) (62) (5,612)Exchange differences on monetary items forming part of net investments in foreign operations – – – – 1,182 – 1,182 – 1,182Net change in fair value of available-for-sale fi nancial assets, net of tax – – 514 – – – 514 – 514Total other comprehensive income – – 514 – (4,368) – (3,854) (62) (3,916)Total comprehensive income for the year – – 514 – (4,368) 10,344 6,490 (559) 5,931
Transactions with Owners, recorded directly in equityContributions by and distributions to OwnersIssuance of shares pursuant to the exercise of warrants 911 – – – – – 911 – 911Issuance of shares pursuant to the exercise of share options– Exercise price 358 – – – – – 358 – 358– Value of employee services received 116 – – (116) – – – – –Value of employee services received for issue of share options – – – 1,144 – – 1,144 – 1,144Value of employee services received for issue of share awards – – – 275 – – 275 – 275Final dividend of 0.15 cents per share in respect of 2010 – – – – – (814) (814) – (814)Special dividend of 1.10 cents per share in respect of 2010 – – – – – (5,969) (5,969) – (5,969)Interim dividend of 0.13 cents per share in respect of 2011 – – – – – (706) (706) – (706)Special dividend of 0.15 cents per share in respect of 2011 – – – – – (814) (814) – (814)Total contributions by and distributions to Owners 1,385 – – 1,303 – (8,303) (5,615) – (5,615)Total transactions with Owners 1,385 – – 1,303 – (8,303) (5,615) – (5,615)Balance as at 30 June 2011 88,240 (11,720) 751 2,321 (13,864) 31,874 97,602 1,657 99,259
consolidated statement of changes in equityYear ended 30 June 2012
The accompanying notes form an integral part of these fi nancial statements.

45
ELL
IPSIZ
LTD
/ A
nnual
Report
2012
Total Share-based attributable compensa- Exchange to Owners Non- Share Capital Fair value tion translation Accumulated of the controlling Total Group capital reserve reserve reserve reserve profi ts Company interests equity $’000 $’000 $’000 $’000 $’000 $’000 $’000 $’000 $’000
Balance as at 1 July 2011 88,240 (11,720) 751 2,321 (13,864) 31,874 97,602 1,657 99,259
Total comprehensive income for the yearProfi t for the year – – – – – 2,247 2,247 15 2,262
Other comprehensive incomeExchange differences on translation of fi nancial statements of foreign operations – – – – 3,530 – 3,530 65 3,595Exchange differences on monetary items forming part of net investments in foreign operations – – – – (1,621) – (1,621) – (1,621)Net change in fair value of available-for-sale fi nancial assets, net of tax – – 619 – – – 619 – 619Exchange difference on disposal of subsidiaries reclassifi ed to profi t or loss – – – – 40 – 40 19 59Total other comprehensive income – – 619 – 1,949 – 2,568 84 2,652Total comprehensive income for the year – – 619 – 1,949 2,247 4,815 99 4,914
Transactions with Owners, recorded directly in equityContributions by and distributions to OwnersIssuance of shares pursuant to the exercise of warrants 258 – – – – – 258 – 258Issuance of shares pursuant to the vesting of share awards – Value of employee services received 275 – – (275) – – – – –Value of employee services received for issue of share options – – – 347 – – 347 – 347Final dividend of 0.13 cents per share in respect of 2011 – – – – – (710) (710) – (710)Special dividend of 0.15 cents per share in respect of 2011 – – – – – (819) (819) – (819)Total contributions by and distributions to Owners 533 – – 72 – (1,529) (924) – (924)Total transactions with Owners 533 – – 72 – (1,529) (924) – (924)Balance as at 30 June 2012 88,773 (11,720) 1,370 2,393 (11,915) 32,592 101,493 1,756 103,249
consolidated statement of changes in equityYear ended 30 June 2012
The accompanying notes form an integral part of these fi nancial statements.
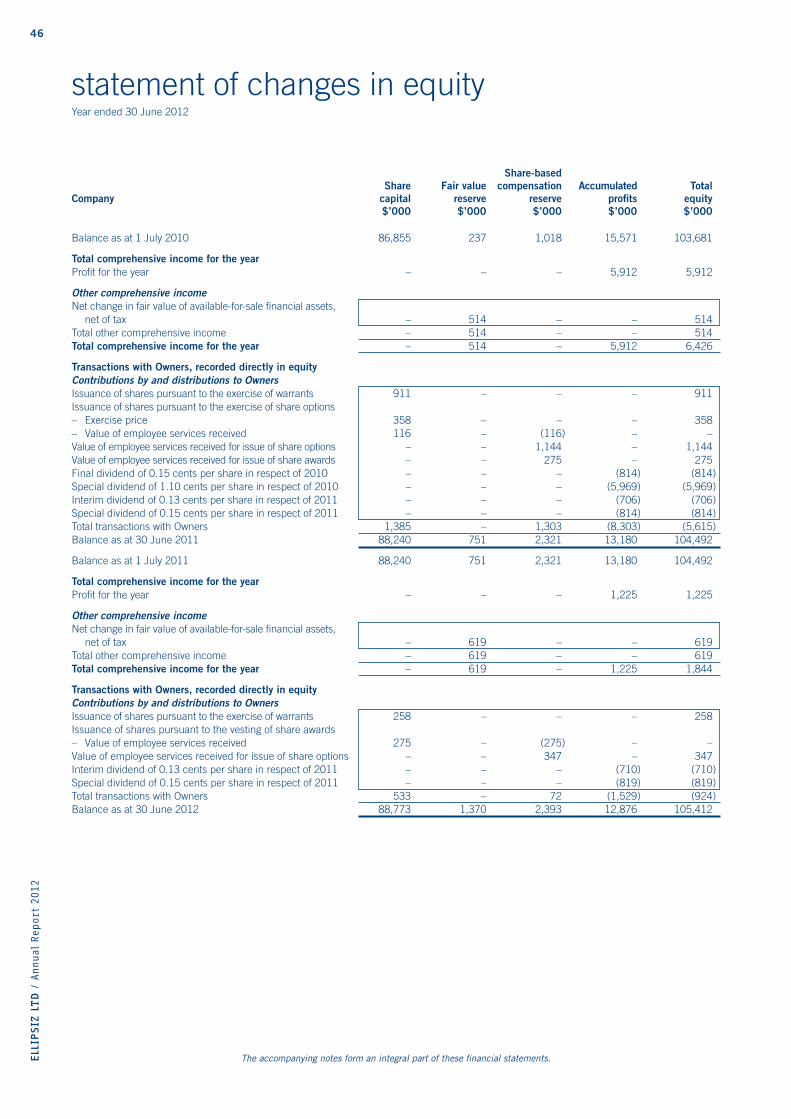
46ELL
IPSIZ
LTD
/ A
nnual
Report
2012
Share-based Share Fair value compensation Accumulated Total Company capital reserve reserve profi ts equity $’000 $’000 $’000 $’000 $’000
Balance as at 1 July 2010 86,855 237 1,018 15,571 103,681
Total comprehensive income for the yearProfi t for the year – – – 5,912 5,912
Other comprehensive incomeNet change in fair value of available-for-sale fi nancial assets, net of tax – 514 – – 514Total other comprehensive income – 514 – – 514Total comprehensive income for the year – 514 – 5,912 6,426
Transactions with Owners, recorded directly in equity Contributions by and distributions to OwnersIssuance of shares pursuant to the exercise of warrants 911 – – – 911Issuance of shares pursuant to the exercise of share options– Exercise price 358 – – – 358– Value of employee services received 116 – (116) – –Value of employee services received for issue of share options – – 1,144 – 1,144Value of employee services received for issue of share awards – – 275 – 275Final dividend of 0.15 cents per share in respect of 2010 – – – (814) (814)Special dividend of 1.10 cents per share in respect of 2010 – – – (5,969) (5,969)Interim dividend of 0.13 cents per share in respect of 2011 – – – (706) (706)Special dividend of 0.15 cents per share in respect of 2011 – – – (814) (814)Total transactions with Owners 1,385 – 1,303 (8,303) (5,615)Balance as at 30 June 2011 88,240 751 2,321 13,180 104,492
Balance as at 1 July 2011 88,240 751 2,321 13,180 104,492
Total comprehensive income for the yearProfi t for the year – – – 1,225 1,225
Other comprehensive incomeNet change in fair value of available-for-sale fi nancial assets, net of tax – 619 – – 619Total other comprehensive income – 619 – – 619Total comprehensive income for the year – 619 – 1,225 1,844
Transactions with Owners, recorded directly in equityContributions by and distributions to OwnersIssuance of shares pursuant to the exercise of warrants 258 – – – 258Issuance of shares pursuant to the vesting of share awards– Value of employee services received 275 – (275) – –Value of employee services received for issue of share options – – 347 – 347Interim dividend of 0.13 cents per share in respect of 2011 – – – (710) (710)Special dividend of 0.15 cents per share in respect of 2011 – – – (819) (819)Total transactions with Owners 533 – 72 (1,529) (924)Balance as at 30 June 2012 88,773 1,370 2,393 12,876 105,412
statement of changes in equityYear ended 30 June 2012
The accompanying notes form an integral part of these fi nancial statements.

47
ELL
IPSIZ
LTD
/ A
nnual
Report
2012
Group 2012 2011 $’000 $’000
Operating activitiesProfi t for the year 2,262 9,847
Adjustments for:Allowance/(Reversal of allowance) for:– doubtful debts from trade receivables 138 (5)– inventory obsolescence 1,394 86Amortisation of intangible assets 513 440Bad debts written off 4 4Depreciation of property, plant and equipment 1,930 3,504Government grant – Jobs Credit Scheme – (8)Gain on disposals of: – property, plant and equipment (340) (64)– asset classifi ed as held for sale – (1,681)Gain on disposal of subsidiaries (49) –Interest income (273) (104)Interest expenses 341 422Property, plant and equipment written off – 7Inventories written off 42 51Impairment/(Reversal of impairment) losses on:– property, plant and equipment 160 596– intangible assets 2 3– investment in associate – (1,850)Impairment of goodwill – 360(Reversal of)/Provision for:– restructuring cost (12) (160)– retrenchments benefi ts 142 (20)– other liabilities arising from fi re incident – (378)Grant income – (150)Share-based payment expense 347 1,419Share of results of associates and joint ventures (net of tax) 151 (724)Income tax credit (694) (853)Operating profi t before working capital changes 6,058 10,742
Changes in working capital:Inventories 708 (19)Project-in-progress (6,876) (1,622)Trade and other receivables 183 (1,922)Amounts due from related parties (trade) 11 (3)Trade and other payables 5,799 (1,038)Amounts due to related parties (trade) – (1)Restructuring cost paid (24) (276)Retrenchment benefi ts paid (142) –Other liabilities arising from fi re incident paid (40) (223)Insurance claim received – 2,751Placement of pledged deposits with fi nancial institutions (71) (7)Cash generated from operations 5,606 8,382Interest received 273 104Interest paid (156) (259)Income taxes paid (1,158) (1,995)Cash fl ows generated from operating activities 4,565 6,232
consolidated statement of cash fl owsYear ended 30 June 2012
The accompanying notes form an integral part of these fi nancial statements.
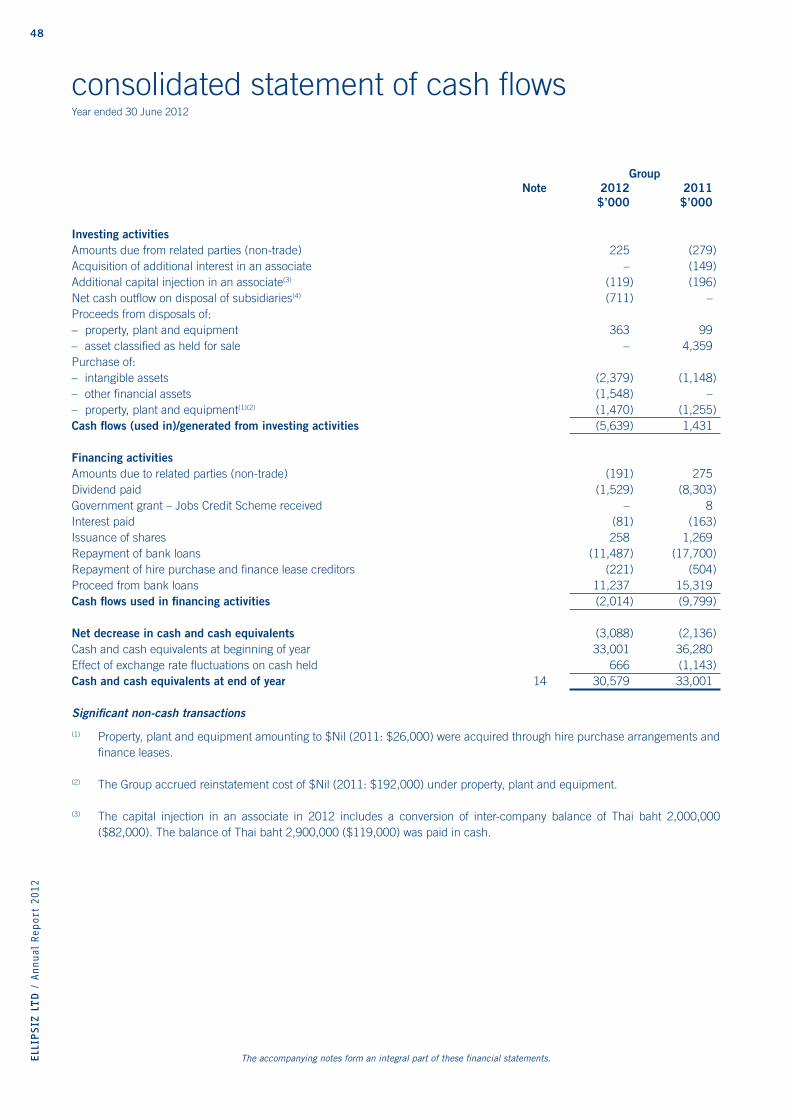
48ELL
IPSIZ
LTD
/ A
nnual
Report
2012
Group Note 2012 2011 $’000 $’000
Investing activitiesAmounts due from related parties (non-trade) 225 (279)Acquisition of additional interest in an associate – (149)Additional capital injection in an associate(3) (119) (196)Net cash outfl ow on disposal of subsidiaries(4) (711) –Proceeds from disposals of:– property, plant and equipment 363 99– asset classifi ed as held for sale – 4,359Purchase of:– intangible assets (2,379) (1,148)– other fi nancial assets (1,548) –– property, plant and equipment(1)(2) (1,470) (1,255)Cash fl ows (used in)/generated from investing activities (5,639) 1,431
Financing activitiesAmounts due to related parties (non-trade) (191) 275Dividend paid (1,529) (8,303)Government grant – Jobs Credit Scheme received – 8Interest paid (81) (163)Issuance of shares 258 1,269Repayment of bank loans (11,487) (17,700)Repayment of hire purchase and fi nance lease creditors (221) (504)Proceed from bank loans 11,237 15,319Cash fl ows used in fi nancing activities (2,014) (9,799)
Net decrease in cash and cash equivalents (3,088) (2,136)Cash and cash equivalents at beginning of year 33,001 36,280Effect of exchange rate fl uctuations on cash held 666 (1,143)Cash and cash equivalents at end of year 14 30,579 33,001
Signifi cant non-cash transactions
(1) Property, plant and equipment amounting to $Nil (2011: $26,000) were acquired through hire purchase arrangements and fi nance leases.
(2) The Group accrued reinstatement cost of $Nil (2011: $192,000) under property, plant and equipment.
(3) The capital injection in an associate in 2012 includes a conversion of inter-company balance of Thai baht 2,000,000 ($82,000). The balance of Thai baht 2,900,000 ($119,000) was paid in cash.
consolidated statement of cash fl owsYear ended 30 June 2012
The accompanying notes form an integral part of these fi nancial statements.

49
ELL
IPSIZ
LTD
/ A
nnual
Report
2012
Signifi cant non-cash transactions (continued)
(4) The effect of disposal of subsidiaries is set out below:
Group 2012 2011 $’000 $’000
Inventories 582 –Trade and other receivables 1,956 –Cash and cash equivalents 712 –Trade and other payables (1,257) –Amounts due to related parties (2,100) –Non-controlling interests 19 –Net identifi able assets disposed (88) –Realisation of exchange translation reserves 40 –Gain on disposal of subsidiaries 49 –Cash proceed from disposal of subsidiaries 1 –Less: Cash and cash equivalents disposed (712) –Net cash outfl ow on disposal of subsidiaries (711) –
consolidated statement of cash fl owsYear ended 30 June 2012
The accompanying notes form an integral part of these fi nancial statements.
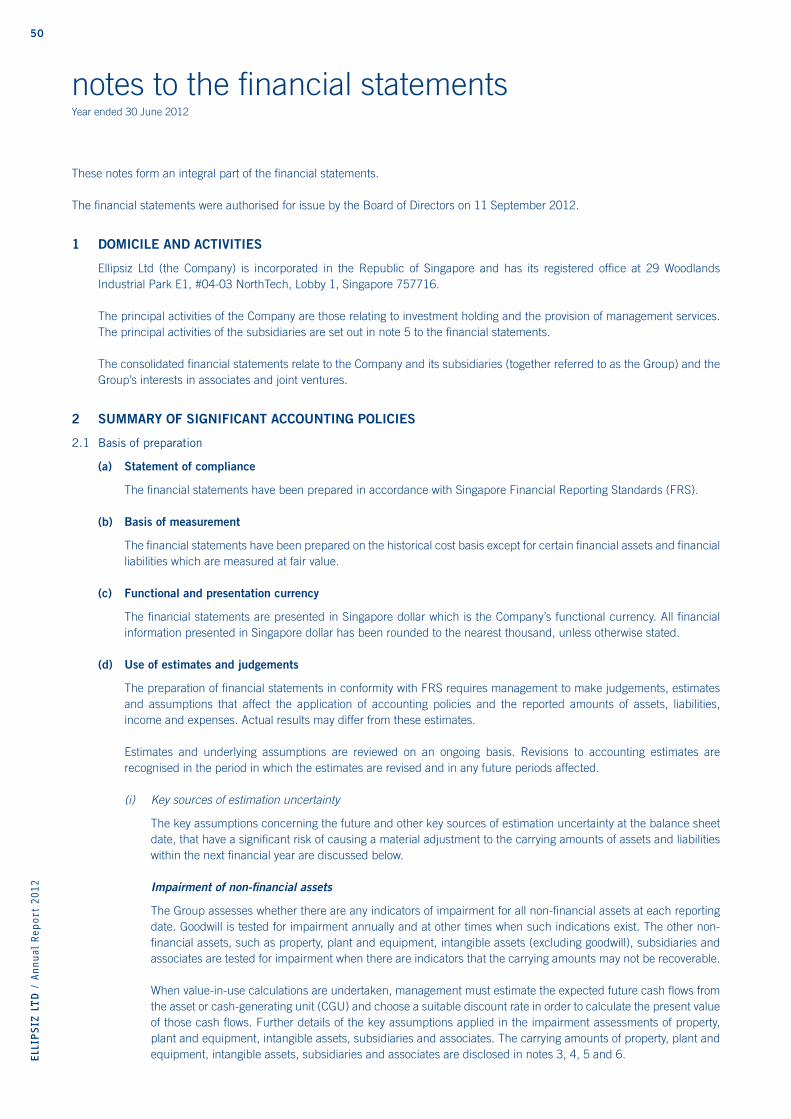
50ELL
IPSIZ
LTD
/ A
nnual
Report
2012
These notes form an integral part of the fi nancial statements.
The fi nancial statements were authorised for issue by the Board of Directors on 11 September 2012.
1 DOMICILE AND ACTIVITIES
Ellipsiz Ltd (the Company) is incorporated in the Republic of Singapore and has its registered offi ce at 29 Woodlands Industrial Park E1, #04-03 NorthTech, Lobby 1, Singapore 757716.
The principal activities of the Company are those relating to investment holding and the provision of management services. The principal activities of the subsidiaries are set out in note 5 to the fi nancial statements.
The consolidated fi nancial statements relate to the Company and its subsidiaries (together referred to as the Group) and the Group’s interests in associates and joint ventures.
2 SUMMARY OF SIGNIFICANT ACCOUNTING POLICIES
2.1 Basis of preparation
(a) Statement of compliance
The fi nancial statements have been prepared in accordance with Singapore Financial Reporting Standards (FRS).
(b) Basis of measurement
The fi nancial statements have been prepared on the historical cost basis except for certain fi nancial assets and fi nancial liabilities which are measured at fair value.
(c) Functional and presentation currency
The fi nancial statements are presented in Singapore dollar which is the Company’s functional currency. All fi nancial information presented in Singapore dollar has been rounded to the nearest thousand, unless otherwise stated.
(d) Use of estimates and judgements
The preparation of fi nancial statements in conformity with FRS requires management to make judgements, estimates and assumptions that affect the application of accounting policies and the reported amounts of assets, liabilities, income and expenses. Actual results may differ from these estimates.
Estimates and underlying assumptions are reviewed on an ongoing basis. Revisions to accounting estimates are recognised in the period in which the estimates are revised and in any future periods affected. (i) Key sources of estimation uncertainty
The key assumptions concerning the future and other key sources of estimation uncertainty at the balance sheet date, that have a signifi cant risk of causing a material adjustment to the carrying amounts of assets and liabilities within the next fi nancial year are discussed below.
Impairment of non-fi nancial assets
The Group assesses whether there are any indicators of impairment for all non-fi nancial assets at each reporting date. Goodwill is tested for impairment annually and at other times when such indications exist. The other non-fi nancial assets, such as property, plant and equipment, intangible assets (excluding goodwill), subsidiaries and associates are tested for impairment when there are indicators that the carrying amounts may not be recoverable.
When value-in-use calculations are undertaken, management must estimate the expected future cash fl ows from the asset or cash-generating unit (CGU) and choose a suitable discount rate in order to calculate the present value of those cash fl ows. Further details of the key assumptions applied in the impairment assessments of property, plant and equipment, intangible assets, subsidiaries and associates. The carrying amounts of property, plant and equipment, intangible assets, subsidiaries and associates are disclosed in notes 3, 4, 5 and 6.
notes to the fi nancial statementsYear ended 30 June 2012
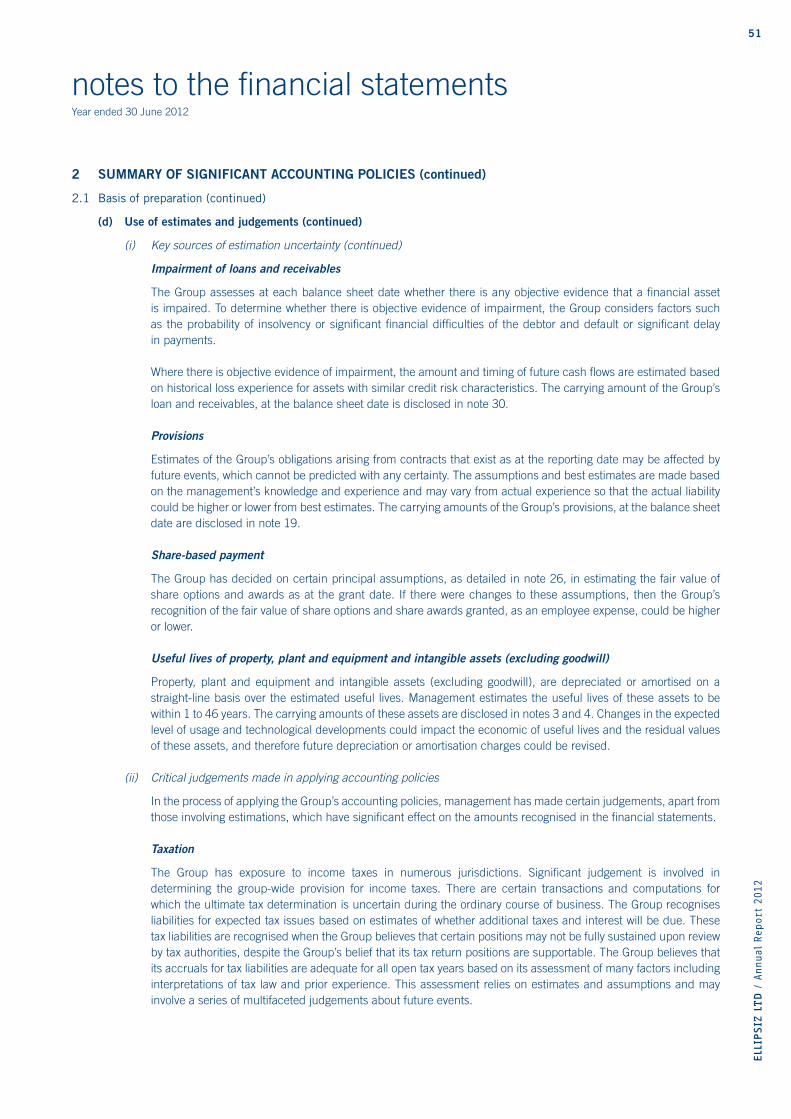
51
ELL
IPSIZ
LTD
/ A
nnual
Report
2012
notes to the fi nancial statementsYear ended 30 June 2012
2 SUMMARY OF SIGNIFICANT ACCOUNTING POLICIES (continued)
2.1 Basis of preparation (continued)
(d) Use of estimates and judgements (continued)
(i) Key sources of estimation uncertainty (continued)
Impairment of loans and receivables
The Group assesses at each balance sheet date whether there is any objective evidence that a fi nancial asset is impaired. To determine whether there is objective evidence of impairment, the Group considers factors such as the probability of insolvency or signifi cant fi nancial diffi culties of the debtor and default or signifi cant delay in payments.
Where there is objective evidence of impairment, the amount and timing of future cash fl ows are estimated based on historical loss experience for assets with similar credit risk characteristics. The carrying amount of the Group’s loan and receivables, at the balance sheet date is disclosed in note 30.
Provisions
Estimates of the Group’s obligations arising from contracts that exist as at the reporting date may be affected by future events, which cannot be predicted with any certainty. The assumptions and best estimates are made based on the management’s knowledge and experience and may vary from actual experience so that the actual liability could be higher or lower from best estimates. The carrying amounts of the Group’s provisions, at the balance sheet date are disclosed in note 19.
Share-based payment
The Group has decided on certain principal assumptions, as detailed in note 26, in estimating the fair value of share options and awards as at the grant date. If there were changes to these assumptions, then the Group’s recognition of the fair value of share options and share awards granted, as an employee expense, could be higher or lower.
Useful lives of property, plant and equipment and intangible assets (excluding goodwill)
Property, plant and equipment and intangible assets (excluding goodwill), are depreciated or amortised on a straight-line basis over the estimated useful lives. Management estimates the useful lives of these assets to be within 1 to 46 years. The carrying amounts of these assets are disclosed in notes 3 and 4. Changes in the expected level of usage and technological developments could impact the economic of useful lives and the residual values of these assets, and therefore future depreciation or amortisation charges could be revised.
(ii) Critical judgements made in applying accounting policies
In the process of applying the Group’s accounting policies, management has made certain judgements, apart from those involving estimations, which have signifi cant effect on the amounts recognised in the fi nancial statements.
Taxation
The Group has exposure to income taxes in numerous jurisdictions. Signifi cant judgement is involved in determining the group-wide provision for income taxes. There are certain transactions and computations for which the ultimate tax determination is uncertain during the ordinary course of business. The Group recognises liabilities for expected tax issues based on estimates of whether additional taxes and interest will be due. These tax liabilities are recognised when the Group believes that certain positions may not be fully sustained upon review by tax authorities, despite the Group’s belief that its tax return positions are supportable. The Group believes that its accruals for tax liabilities are adequate for all open tax years based on its assessment of many factors including interpretations of tax law and prior experience. This assessment relies on estimates and assumptions and may involve a series of multifaceted judgements about future events.
52ELL
IPSIZ
LTD
/ A
nnual
Report
2012
notes to the fi nancial statementsYear ended 30 June 2012
2 SUMMARY OF SIGNIFICANT ACCOUNTING POLICIES (continued)
2.1 Basis of preparation (continued)
(d) Use of estimates and judgements (continued)
(ii) Critical judgements made in applying accounting policies (continued)
In addition, certain subsidiaries of the Group have potential tax benefi ts arising from unutilised tax losses, unabsorbed wear and tear allowances and other temporary differences, which are available for set-off against future taxable profi ts. Signifi cant judgement is involved in determining the availability of future taxable profi ts against which the Group can utilise the tax benefi ts therefrom. The use of the potential tax benefi ts is also subject to the agreement of the tax authorities and compliance with certain provisions of the tax legislation of the respective countries in which the subsidiaries operate.
Where the fi nal outcome of these matters is different from the amounts that were initially recognised, such differences will impact the income tax provision and recognised deferred tax assets relating to the potential tax benefi ts in the period in which such determination is made.
The carrying amounts of the Group’s deferred tax assets are $4,123,000 (2011: $2,653,000), deferred tax liabilities are $632,000 (2011: $654,000), tax receivables are $131,000 (2011: $42,000) and current tax payable are $646,000 (2011: $963,000).
(e) Changes in accounting policies
(i) Measurement of non-controlling interests in business combinations
From 1 July 2011, the Group has adopted the amendments to FRS 103 Business Combinations to measure certain non-controlling interests at the acquisition date (see note 2.2). Non-controlling interests that are not present ownership interests and do not entitle their holders to share the acquiree’s net assets proportionately in the event of liquidation, are to be measured at fair value. Previously, the Group measured such non-controlling interests at the non-controlling interests’ proportionate share of the acquiree’s recognised identifi able net assets at the acquisition date. This change in accounting policy has been applied prospectively from 1 July 2011 and has no impact on earnings per share.
(ii) Identifi cation of related party relationships and related party disclosures
From 1 July 2011, the Group has applied the revised FRS 24 Related Party Disclosures (2010) to identify parties that are related to the Group and to determine the disclosures to be made on transactions and outstanding balances, including commitments, between the Group and its related parties. FRS 24 (2010) improved the defi nition of a related party in order to eliminate inconsistencies and ensure symmetrical identifi cation of relationships between two parties.
The adoption of FRS 24 (2010) has resulted in additional parties being identifi ed as related to the Group. Transactions and outstanding balances, including commitments, with these related parties for the current and comparative years have been disclosed accordingly in note 27 to the fi nancial statements. The adoption of FRS 24 (2010) affects only the disclosures made in the fi nancial statements. There is no fi nancial effect on the results and fi nancial position of the Group for the current and previous fi nancial years. Accordingly, the adoption of FRS 24 (2010) has no impact on earnings per share.
(iii) New standards and interpretations not adopted
A number of new standards, amendments to standards and interpretations have been issued but not yet effective and have not been applied in preparing these fi nancial statements. At the reporting date, none of these are expected to have a signifi cant effect on the fi nancial statements of the Group.
The accounting policies set out below have been applied consistently to all periods presented in these fi nancial statements, and have been applied consistently by Group entities, except as explained in note 2.1(e), which addresses changes in accounting policies.

53
ELL
IPSIZ
LTD
/ A
nnual
Report
2012
notes to the fi nancial statementsYear ended 30 June 2012
2 SUMMARY OF SIGNIFICANT ACCOUNTING POLICIES (continued)
2.2 Basis of consolidation
Business combinations
Business combinations are accounted for using the acquisition method as at the acquisition date, which is the date on which control is transferred to the Group. Control is the power to govern the fi nancial and operating policies of an entity so as to obtain benefi ts from its activities. In assessing control, the Group takes into consideration potential voting rights that are currently exercisable.
The consideration transferred does not include amounts related to the settlement of pre-existing relationships. Such amounts are generally recognised in profi t or loss. Costs related to the acquisition, other than those associated with the issue of debt or equity securities, that the Group incurs in connection with a business combination are expensed as incurred.
Any contingent consideration payable is recognised at fair value at the acquisition date. If the contingent consideration is classifi ed as equity, it is not remeasured and settlement is accounted for within equity. Otherwise, subsequent changes to the fair value of the contingent consideration are recognised in profi t or loss.
For non-controlling interests that are present ownership interests and entitle their holders to a proportionate share of the acquiree’s net assets in the event of liquidation, the Group elects on a transaction-by-transaction basis whether to measure them at fair value, or at the non-controlling interests’ share of the recognised amounts of the acquiree’s identifi able net assets, at the acquisition date. All other non-controlling interests are measured at acquisition-date fair value or, when applicable, on the basis specifi ed in another standard.
When share-based payment awards (replacement awards) are required to be exchanged for awards held by the acquiree’s employees (acquiree’s awards) and relate to past services, then all or a portion of the amount of the acquirer’s replacement awards is included in measuring the consideration transferred in the business combination. This determination is based on the market-based value of the replacement awards compared with the market-based value of the acquiree’s awards and the extent to which the replacement awards relate to past and/or future service.
Subsidiaries
Subsidiaries are entities controlled by the Group. The fi nancial statements of subsidiaries are included in the consolidated fi nancial statements from the date that control commences until the date that control ceases. The accounting policies of subsidiaries have been changed where necessary to align them with the policies adopted by the Group. Losses applicable to the non-controlling interests in a subsidiary are allocated to the non-controlling interests even if doing so causes the non-controlling interests to have a defi cit balance.
Loss of control
Upon the loss of control, the Group derecognises the assets and liabilities of the subsidiary, any non-controlling interests and the other components of equity related to the subsidiary. Any surplus or defi cit arising on the loss of control is recognised in profi t or loss.
Associates and joint ventures
Associates are those entities in which the Group has signifi cant infl uence, but not control, over their fi nancial and operating policies. Signifi cant infl uence is presumed to exist when the Group holds between 20% and 50% of the voting power of another entity.
Joint ventures are the entities over whose activities the Group has joint control, established by contractual agreement and requiring unanimous consent for strategic fi nancial and operating decisions.
Associates and joint ventures are accounted for using the equity method.
54ELL
IPSIZ
LTD
/ A
nnual
Report
2012
notes to the fi nancial statementsYear ended 30 June 2012
2 SUMMARY OF SIGNIFICANT ACCOUNTING POLICIES (continued)
2.2 Basis of consolidation (continued)
Associates and joint ventures (continued)
The consolidated fi nancial statements include the Group’s share of the profi t or loss and other comprehensive income of associates and joint ventures, after adjustments to align the accounting policies with those of the Group, from the date that signifi cant infl uence or joint control commences until the date that signifi cant infl uence or joint control ceases. When the Group’s share of losses exceeds its interest in an associate or a joint venture, the carrying amount of that interest (including any long-term investments) is reduced to zero and the recognition of further losses is discontinued except to the extent that the Group has an obligation or has made payments on behalf of the investee.
Transactions eliminated on consolidation
Intra-group balances and transactions, and any unrealised income or expenses arising from intra-group transactions, are eliminated in preparing the consolidated fi nancial statements. Unrealised gains arising from transactions with associates and joint ventures are eliminated against the investment to the extent of the Group’s interest in the investee. Unrealised losses are eliminated in the same way as unrealised gains, but only to the extent that there is no evidence of impairment.
Accounting for subsidiaries, associates and joint ventures by the Company
Investments in subsidiaries, associates and joint ventures are stated in the Company’s balance sheet at cost less accumulated impairment losses.
2.3 Foreign currencies
Foreign currency transactions
Transactions in foreign currencies are translated to the respective functional currencies of Group entities at the exchange rate at the date of the transaction. Monetary assets and liabilities denominated in foreign currencies at the reporting date are retranslated to the functional currency at the exchange rate at the reporting date. Non-monetary assets and liabilities denominated in foreign currencies that are measured at fair value are retranslated to the functional currency at the exchange rate at the date that the fair value was determined. Non-monetary items that are measured in terms of historical cost in foreign currency are translated using the exchange rate at the dates of the transactions.
Foreign currency differences arising on retranslation are recognised in profi t or loss, except for differences arising on the retranslation of monetary items that in substance form part of the Group’s net investment in a foreign operation (see below), available-for-sale equity instruments and fi nancial liabilities designated as hedges of the net investment in a foreign operation (note 2.7), which are recognised in other comprehensive income.
Foreign operations
The assets and liabilities of foreign operations, excluding goodwill and fair value adjustments are translated to Singapore dollar at exchange rates at the end of the reporting date. The income and expenses of foreign operations are translated to Singapore dollar at exchange rates at the dates of the transactions. Goodwill and fair value adjustments arising on the acquisition of a foreign operation on or after 1 January 2005 are treated as assets and liabilities of the foreign operation and translated at the closing rate. For acquisition prior to 1 January 2005, the exchange rates at the date of acquisitions were used.
Foreign currency differences are recognised in other comprehensive income, and presented in the foreign currency translation reserve in equity. When a foreign operation is disposed off such that control, signifi cant infl uence or joint control is lost, the cumulative amount in the exchange translation reserve related to that disposed foreign operation is transferred to profi t or loss, as part of the gain or loss on disposal.
When the settlement of a monetary item receivable from or payable to a foreign operation is neither planned or likely in the foreseeable future, foreign exchange gains or losses arising from such a monetary item are considered to form part of a net investment in a foreign operation and are recognised in other comprehensive income, and are presented in the foreign currency translation reserve in equity. When the foreign operation is disposed off, the cumulative amount in equity is transferred to the profi t or loss as an adjustment to the profi t or loss arising on disposal.

55
ELL
IPSIZ
LTD
/ A
nnual
Report
2012
notes to the fi nancial statementsYear ended 30 June 2012
2 SUMMARY OF SIGNIFICANT ACCOUNTING POLICIES (continued)
2.4 Property, plant and equipment
Property, plant and equipment are measured at cost less accumulated depreciation and impairment losses.
Cost includes expenditure that is directly attributable to the acquisition of the asset. The cost of self-constructed assets includes the cost of materials and direct labour, any other costs directly attributable to bringing the asset to a working condition for its intended use, and the costs of dismantling and removing the items and restoring the site on which they are located. Purchased software that is integral to the functionality of the related equipment is capitalised as part of that equipment. When parts of an item of property, plant and equipment have different useful lives, they are accounted for as separate items (major components) of property, plant and equipment.
The cost of replacing part of an item of property, plant and equipment is recognised in the carrying amount of the item if it is probable that the future economic benefi ts embodied within the part will fl ow to the Group and its cost can be measured reliably. The costs of the day-to-day servicing of property, plant and equipment are recognised in the profi t or loss as incurred.
The gain or loss on disposal of an item of property, plant and equipment is determined by comparing the proceeds from disposal with the carrying amount of the property, plant and equipment and is recognised net within other income/other expenses in profi t or loss.
Assets under construction are not depreciated. Depreciation on other property, plant and equipment is recognised in the profi t or loss on a straight-line basis over the estimated useful lives (or lease term, if shorter) of each part of an item of property, plant and equipment.
The estimated useful lives are as follows:
Leasehold land and building 46 yearsLeasehold improvements shorter of 3 to 46 years and remaining lease periodFurniture and fi ttings 3 to 10 yearsOffi ce equipment 1 to 10 yearsComputers 1 to 6 yearsMotor vehicles 2 to 10 yearsPlant and machinery 3 to 11 yearsMechanical and electrical facilities 3 to 10 years
Depreciation methods, useful lives and residual values are reviewed, and adjusted as appropriate, at each reporting date.
2.5 Intangible assets
Computer software
Computer software which has useful life and does not form an integral part of related hardware is measured at cost less accumulated amortisation and impairment losses.
Computer software is amortised in the profi t or loss on the straight-line basis over its estimated useful life of 1 to 5 years, from the date on which they are available for use.
Research and development expenditure
Expenditure on research activities, undertaken with the prospect of gaining new scientifi c or technical knowledge and understanding, is recognised in the profi t or loss as an expense when it is incurred.
56ELL
IPSIZ
LTD
/ A
nnual
Report
2012
notes to the fi nancial statementsYear ended 30 June 2012
2 SUMMARY OF SIGNIFICANT ACCOUNTING POLICIES (continued)
2.5 Intangible assets (continued)
Research and development expenditure (continued)
Development activities involve a plan or design for the production of new or substantially improved products and processes. Development expenditure is capitalised only if development costs can be measured reliably, the products or process is technically and commercially feasible, future economic benefi ts are probable, and the Group intends to and has suffi cient resources to complete development and to use or sell the asset. The expenditure capitalised includes the cost of materials, direct labour and overhead costs that are directly attributable to preparing the asset for its intended use. Other development expenditure is recognised in the profi t or loss as an expense when it is incurred. Amortisation is calculated on a straight-line method over the estimated useful life of 5 to 20 years, from the date on which they are available for use. Capitalised development expenditure is measured at cost less accumulated amortisation and impairment losses.
Technology licence and intellectual properties
Technology licence and intellectual properties represent patents, registered designs, technical data, know-how, and other intellectual property rights related to or connected with the processing, manufacturing, repair, rework and sale of probe cards.
Technology licence and intellectual properties are measured at cost less accumulated amortisation and impairment losses. The cost of intangible assets acquired in the business combination is their fair values at the date of acquisition. Technology licence and intellectual properties are amortised in the profi t or loss on a straight-line basis over their estimated economic useful lives of 20 years from the date on which they are available for use.
Goodwill
Goodwill arising on the acquisition of subsidiaries is presented in intangible assets. Goodwill arising on the acquisition of associates and joint ventures is presented together with investments in associates and joint ventures.
Goodwill represents the excess of the fair value of the consideration transferred, the recognised amount of any non-controlling interests in the acquiree and the fair value of the existing equity interest in the acquiree, if the business combination is achieved in stages, over the net recognised amount (generally fair value) of the identifi able assets acquired and liabilities assumed. When the excess is negative, a bargain purchase gain is recognised immediately in profi t or loss.
Goodwill is measured at cost less accumulated impairment losses. Goodwill is tested for impairment as described in note 2.9.
2.6 Affi liates
An affi liate is defi ned as one, other than a related corporation, which has common direct or indirect shareholders or common directors with the Company.
2.7 Financial instruments
Non-derivative fi nancial assets
The Group initially recognises loans and receivables and deposits on the date that are originated. All other fi nancial assets (including assets designated at fair value through profi t or loss) are recognised initially on the trade date, which is the date that the Group becomes a party to the contractual provisions of the instrument.
Financial assets are derecognised if the Group’s contractual rights to the cash fl ows from the fi nancial assets expire or if the Group transfers the fi nancial asset to another party without retaining control or transfers substantially all the risks and rewards of the asset. Purchases and sales of fi nancial assets are accounted for at trade date, that is, the date that the Group commits itself to purchase or sell the asset.
The Group classifi es its non-derivative fi nancial assets into the following categories: loans and receivables and available-for-sale fi nancial assets.
57
ELL
IPSIZ
LTD
/ A
nnual
Report
2012
notes to the fi nancial statementsYear ended 30 June 2012
2 SUMMARY OF SIGNIFICANT ACCOUNTING POLICIES (continued)
2.7 Financial instruments (continued)
Non-derivative fi nancial assets (continued)
Loans and receivables
Loans and receivables are fi nancial assets with fi xed or determinable payments that are not quoted in an active market. Such assets are recognised initially at fair value plus any directly attributable transaction costs. Subsequent to initial recognition, loans and receivables are measured at amortised cost using the effective interest method, less any impairment losses.
Loans and receivables comprise trade and other receivables (excluding prepayment), amounts due from related parties and cash and cash equivalents.
Cash and cash equivalents comprise cash balances and bank deposits. For the purposes of the cash fl ow statement, cash and cash equivalents exclude short-term deposits which are pledged to the bank as security and cannot be withdrawn on demand. Bank overdraft that is repayable on demand and that forms an integral part of the Group’s cash management is included as a component of cash and cash equivalents.
Available-for-sale fi nancial assets
The Group’s investments in certain equity securities and debt security are classifi ed as available-for-sale fi nancial assets. Available-for-sale fi nancial assets are recognised initially at fair values plus any attributable transaction costs. Subsequent to initial recognition, they are measured at fair value and changes therein, other than for impairment losses, and foreign exchange gains and losses on available-for-sale monetary items (note 2.3), are recognised directly in other comprehensive income and presented in the fair value reserve in equity. When an investment is derecognised, the cumulative gain or loss in other comprehensive income and presented within equity in the fair value reserve is transferred to profi t or loss.
Non-derivative fi nancial liabilities
Financial liabilities (including liabilities designated at fair value through profi t or loss) are recognised initially on the trade date at which the Group becomes a party to the contractual provisions of the instrument.
The Group derecognises a fi nancial liability when the contractual obligations are discharged, cancelled or expired.
The Group classifi es its non-derivative fi nancial liabilities into other fi nancial liabilities, which comprise: trade and other payables (excluding excess of progress billings over project-in-progress, liabilities for short-term accumulated compensated absences and deferred income), amounts due to related parties, redeemable preference shares, interest-bearing borrowings and other fi nancial liabilities. These are recognised initially at fair value plus any directly attributable transaction costs. Subsequent to initial recognition, these fi nancial liabilities are measured at amortised cost using the effective interest method.
Offsetting of fi nancial assets and liabilities
Financial assets and liabilities are offset and the net amount presented in the statement of fi nancial position when, and only when, the Group has a legal right to offset the amounts and intends either to settle on a net basis or to realise the asset and settle the liability simultaneously. Derivative fi nancial instruments and hedging activities
The Group holds derivative fi nancial instruments to hedge its foreign currency exposures should the need arise.
Derivatives are recognised initially at fair value; attributable transaction costs are recognised in profi t or loss when incurred. Subsequent to initial recognition, derivatives are measured at fair value, and changes therein are accounted for as described below.
58ELL
IPSIZ
LTD
/ A
nnual
Report
2012
notes to the fi nancial statementsYear ended 30 June 2012
2 SUMMARY OF SIGNIFICANT ACCOUNTING POLICIES (continued)
2.7 Financial instruments (continued)
Derivative fi nancial instruments and hedging activities (continued)
Hedge of net investment in a foreign operation
Foreign currency differences arising on the retranslation of a fi nancial liability designated as a hedge of a net investment in a foreign operation are recognised in the Group entities’ other comprehensive income. On consolidation, such differences are recognised directly in equity, in the exchange translation reserve, to the extent that the hedge is effective. To the extent that the hedge is ineffective, such differences are recognised in profi t or loss. When the hedged net investment is disposed off, the cumulative amount in equity is transferred to profi t or loss as an adjustment to the profi t or loss on disposal.
Economic hedges
Hedge accounting is not applied to derivative instruments that economically hedge monetary assets and liabilities denominated in foreign currencies. Changes in the fair values of such derivatives are recognised in profi t or loss as part of foreign currency gains and losses.
Intra-group fi nancial guarantees
Financial guarantee contracts are accounted for as insurance contract and treated as contingent liabilities until such time as they become probable that the Company will be required to make a payment under the guarantee. A provision is recognised based on the Group’s estimate of the ultimate cost of settling all claims incurred but unpaid at the reporting date. The provision is assessed by reviewing individual claims and tested for adequacy by comparing the amount recognised and the amount that would be required to settle the guarantee contract.
Share capital
Ordinary shares are classifi ed as equity.
Incremental costs directly attributable to the issue of ordinary shares, warrants and share options are recognised as a deduction from equity.
2.8 Leases
When entities within the Group are lessees of a fi nance lease
Leased assets in which the Group assumes substantially all the risks and rewards of ownership are classifi ed as fi nance leases. Upon initial recognition, property, plant and equipment acquired through fi nance leases are capitalised at the lower of its fair value and the present value of the minimum lease payments. Subsequent to initial recognition, the asset is accounted for in accordance with the accounting policy applicable to that asset. Leased assets are depreciated over the shorter of the lease term and their useful lives. Lease payments are apportioned between fi nance expense and reduction of the lease liability. The fi nance expense is allocated to each period during the lease term so as to produce a constant periodic rate of interest on the remaining balance of the liability. Contingent lease payments are accounted for by revising the minimum lease payments over the remaining term of the lease when the lease adjustment is confi rmed.
When entities within the Group are lessees of an operating lease
Where the Group has the use of assets under operating leases, payments made under the leases are recognised in profi t or loss on a straight-line basis over the term of the lease. Lease incentives received are recognised in profi t or loss as an integral part of the total lease payments made. Contingent rentals are charged to profi t or loss in the accounting period in which they are incurred.
When entities within the Group are lessors of an operating lease
Assets subject to operating leases are included in property, plant and equipment and are accounted for as described in note 2.4. Rental income is recognised on a straight-line basis over the lease term.
59
ELL
IPSIZ
LTD
/ A
nnual
Report
2012
notes to the fi nancial statementsYear ended 30 June 2012
2 SUMMARY OF SIGNIFICANT ACCOUNTING POLICIES (continued)
2.9 Impairment
Non-derivative fi nancial assets
A fi nancial asset is assessed at each reporting date to determine whether there is any objective evidence that it is impaired. A fi nancial asset is considered to be impaired if objective evidence indicates that one or more events have had a negative effect on the estimated future cash fl ows of that asset.
Objective evidence that fi nancial assets (including equity securities) are impaired can include default or delinquency by a debtor, restructuring of an amount due to the Group on terms that the Group would not consider otherwise, indications that a debtor or issuer will enter bankruptcy, adverse changes in the payment status of borrowers or issuers in the Group and economic conditions that correlate with defaults or the disappearance of an active market for a security. In addition, for an investment in an equity security, a signifi cant or prolonged decline in its fair value below its cost is objective evidence of impairment.
Loans and receivables
Signifi cant fi nancial assets are tested for impairment on an individual basis. The remaining fi nancial assets are assessed collectively in groups that share similar credit risk characteristics. In assessing collective impairment, the Group uses historical trends of the probability of default, the timing of recoveries and the amount of loss incurred, adjusted for management’s judgement as to whether current economic and credit conditions are such that the actual losses are likely to be greater or less than suggested by historical trends.
An impairment loss in respect of a fi nancial asset measured at amortised cost is calculated as the difference between its carrying amount, and the present value of the estimated future cash fl ows discounted at the original effective interest rate.
All impairment losses are recognised in profi t or loss.
Impairment losses in respect of fi nancial assets measured at amortised costs are reversed if the subsequent increase in fair value can be related objectively to an event occurring after the impairment loss was recognised.
Available-for-sale fi nancial assets
An impairment loss in respect of an available-for-sale fi nancial asset is calculated by reference to its current fair value.
Any cumulative loss in respect of an available-for-sale fi nancial asset is recognised by transferring the cumulative loss that has been recognised in other comprehensive income, to profi t or loss.
Impairment losses once recognised in profi t or loss in respect of available-for-sale equity securities are not reversed through profi t or loss. Any subsequent increase in fair value of such assets is recognised directly in other comprehensive income.
Non-fi nancial assets
The carrying amounts of the Group’s non-fi nancial assets, other than inventories and deferred tax assets, are reviewed at each reporting date to determine whether there is any indication of impairment. If any such indication exists, the assets’ recoverable amounts are estimated. For goodwill, recoverable amount is estimated annually.
The recoverable amount of an asset or cash-generating unit is the greater of its value-in-use and its fair value less costs to sell. In assessing value-in-use, the estimated future cash fl ows are discounted to their present value using a pre-tax discount rate that refl ects current market assessments of the time value of money and the risks specifi c to the asset. For the purpose of impairment testing, assets that cannot be tested individually are grouped together into the smallest group of assets that generates cash infl ows from continuing use that are largely independent from other assets or groups of assets (the “cash-generating unit, or CGU”). Subject to an operating segment ceiling test, for the purposes of goodwill impairment testing, CGUs to which goodwill has been allocated are aggregated so that the level at which impairment is tested refl ects the lowest level at which goodwill is monitored for internal reporting purposes. Goodwill acquired in a business combination is allocated to groups of CGUs that are expected to benefi t from the synergies of the combination.
60ELL
IPSIZ
LTD
/ A
nnual
Report
2012
notes to the fi nancial statementsYear ended 30 June 2012
2 SUMMARY OF SIGNIFICANT ACCOUNTING POLICIES (continued)
2.9 Impairment (continued)
Non-fi nancial assets (continued)
The Group’s corporate assets do not generate separate cash infl ows. If there is an indication that a corporate asset may be impaired, then the recoverable amount is determined for the CGU to which the corporate asset belongs.
An impairment loss is recognised if the carrying amount of an asset or its CGU exceeds its estimated recoverable amount. Impairment losses are recognised in profi t or loss. Impairment losses recognised in respect of CGUs are allocated fi rst to reduce the carrying amount of any goodwill allocated to the units, and then to reduce the carrying amount of the other assets in the unit (group of units) on a pro-rata basis.
An impairment loss in respect of goodwill is not reversed. In respect of other assets, impairment losses recognised in prior periods are assessed at each reporting date for any indications that the loss has decreased or no longer exists. An impairment loss is reversed if there has been a change in the estimates used to determine the recoverable amount. An impairment loss is reversed only to the extent that the asset’s carrying amount does not exceed the carrying amount that would have been determined, net of depreciation or amortisation, if no impairment loss had been recognised.
2.10 Inventories
Inventories are stated at the lower of cost and net realisable value. Cost is calculated using the weighted average cost formula and comprises all costs of purchase, costs of conversion and other costs incurred in bringing the inventories to their present location and condition, except for those inventories relating to certain equipment, where costs are determined on fi rst-in-fi rst-out method.
In the case of manufactured inventories and work-in-progress, cost includes an appropriate share of production overheads based on normal operating capacity. Net realisable value is the estimated selling price in the ordinary course of business, less the estimated costs of completion and selling expenses.
When inventories are sold, the carrying amount of those inventories is recognised as an expense in the period in which the related revenue is recognised. The amount of any allowance for write-down of inventories to net realisable value and all losses of inventories are recognised as an expense in the period the write-down or loss occurs. The amount of any reversal of any allowance for write-down of inventories, arising from an increase in net realisable value, is recognised as a reduction in the amount of inventories recognised as an expense in the period in which the reversal occurs.
2.11 Project-in-progress
Project-in-progress represents the gross unbilled amount expected to be collected from customers for contract work performed to date.
Project-in-progress is measured at cost plus profi t recognised to date less progress billings and recognised losses. Cost includes all expenditure related directly to specifi c projects and an allocation of fi xed and variable overheads incurred in the Group’s contract activities based on normal operating capacity.
If payments received from customers exceed the income recognised, the difference is presented as part of trade and other payables in the balance sheet.
2.12 Non-current assets held for sale
Non-current assets or disposal group comprising assets and liabilities, that are expected to be recovered primarily through sale rather than through continuing use, are classifi ed as held for sale. Immediately before classifi cation as held for sale, the assets, or components of a disposal group, are remeasured in accordance with the Group’s accounting policies. Thereafter generally the assets, or disposal group, are measured at the lower of their carrying amount and fair value less cost to sell. Any impairment loss on disposal group fi rst is allocated to goodwill, and then to remaining assets and liabilities on pro-rata basis, except that no loss is allocated to inventories, fi nancial assets, deferred tax assets and employee benefi t assets, which continue to be measured in accordance with the Group’s accounting policies. Impairment losses on initial classifi cation as held for sale and subsequent gains or losses on remeasurement are recognised in profi t or loss. Gains are not recognised in excess of any cumulative impairment loss.
Intangible assets and property, plant and equipment once classifi ed as held for sale are not amortised or depreciated.
61
ELL
IPSIZ
LTD
/ A
nnual
Report
2012
notes to the fi nancial statementsYear ended 30 June 2012
2 SUMMARY OF SIGNIFICANT ACCOUNTING POLICIES (continued)
2.13 Government grants
Government grants are recognised initially as deferred income when there is reasonable assurance that they will be received and that the Group will comply with the conditions attaching to them. Grants that compensate the Group for expenses incurred are recognised as revenue in profi t or loss on a systematic basis in the same periods in which the expenses are incurred. Grants that compensate the Group for the cost of an asset are recognised in profi t or loss as revenue on a systematic basis over the useful life of the asset.
Government grant – Jobs Credit Scheme
Cash grant received from the government in relation to the Jobs Credit Scheme are recognised as income upon receipt.
2.14 Employee benefi ts
Defi ned contribution plans
Obligations for contributions to defi ned contribution plans are recognised as an expense in profi t or loss in the periods during which services are rendered by employees.
Employee leave entitlement
Employee entitlements to annual leave are recognised when they accrue to employees. A provision is made for the estimated liability for annual leave as a result of service rendered by employees up to the balance sheet date.
Short-term benefi ts
Short-term employee benefi t obligations are measured on an undiscounted basis and are expensed as the related service is provided.
A provision is recognised for the amount expected to be paid under short-term cash bonus or profi t-sharing plans if the Group has a present legal or constructive obligation to pay this amount as a result of past service provided by the employee and the obligation can be estimated reliably.
Share-based payments
The “Ellipsiz Share Option Plan” and “Ellipsiz Restricted Stock Plan” have been put in place to grant share options and award shares to eligible employees and participants, respectively. Details of the “Ellipsiz Share Option Plan” and “Ellipsiz Restricted Stock Plan” are disclosed in the Directors’ Report.
The fair value of share options and share awards granted is recognised as an employee expense with a corresponding increase in equity in the Group’s fi nancial statements. The fair value is measured at grant date and spread over the period during which the employees become unconditionally entitled to the options and awards. At each reporting date, the Group revises its estimates of the number of options and awards that are expected to become exercisable. It recognises the impact of the revision of original estimates in employee expense and in a corresponding adjustment to equity over the remaining vesting period.
In the Company’s fi nancial statements, the fair value of share options and share awards granted to employees of the subsidiaries is recognised as investments in subsidiaries, with a corresponding increase in the share-based compensation reserve in the Company’s fi nancial statements.
When the option is exercised or the award has vested, the amount from the share-based compensation reserve is transferred to share capital. The proceeds received net of any directly attributable transactions costs are credited to share capital when the options are exercised.
62ELL
IPSIZ
LTD
/ A
nnual
Report
2012
notes to the fi nancial statementsYear ended 30 June 2012
2 SUMMARY OF SIGNIFICANT ACCOUNTING POLICIES (continued)
2.15 Provision
A provision is recognised if, as a result of a past event, the Group has a present legal or constructive obligation that can be estimated reliably, and it is probable that an outfl ow of economic benefi ts will be required to settle the obligation. Provisions are determined by discounting the expected future cash fl ows at a pre-tax rate that refl ects current market assessments of the time value of money and the risks specifi c to the liability. The unwinding of the discount is recognised as fi nance expense.
Warranties
A provision for warranties is recognised when the underlying products or services are sold. The provision is based on historical warranty date and a weighting of all possible outcomes against their associated probabilities.
Restructuring/Retrenchment
A provision for restructuring/retrenchment is recognised when the Group has approved a detailed and formal restructuring/retrenchment plan, and the plan has either commenced or has been announced publicly. Future operating costs are not provided for.
2.16 Revenue recognition
Revenue from the sale of goods is measured at the fair value of the consideration received or receivable, net of returns and allowances, goods and services taxes or other sales taxes, trade discounts and volume rebates. Revenue is recognised when the signifi cant risks and rewards of ownership have been transferred to the buyer, recovery of the consideration is probable, the associated costs and possible return of goods can be estimated reliably, and there is no continuing management involvement with the goods.
Revenue from the sale of equipment is recognised upon completion of installation. Recognition of revenue pertaining to the provision of warranty and maintenance services is deferred and recognised over the period of warranty or services provision.
Service income is recognised over the period in which the services are rendered. Revenue from service contracts are recognised based on the percentage-of-completion method. The stage of completion is determined by reference to the percentage of actual costs incurred to date to estimated total costs to completion for each contract. Costs incurred which have not been invoiced to customers are recorded in the project-in-progress account. All known or anticipated losses are provided for as soon as they are known.
Rental income receivable under operating leases is recognised in profi t or loss on a straight-line basis over the term of the lease. Contingent rentals are recognised as income in the accounting period in which they are earned.
Commission income and management fees are recognised on an accrual basis.
Dividend income is recognised in profi t or loss when the right to receive payment is established.
2.17 Key management personnel
Key management personnel of the Company and the Group are those persons having the authority and responsibility for the planning, directing and controlling the activities of the Company and the Group respectively. These include the directors, chief executive offi cer, presidents, vice presidents and offi cers who hold equivalent position at the Company and the Group.
2.18 Finance income and expenses
Finance income comprises interest income on funds invested. Interest income is recognised as it accrues, using the effective interest method.
Finance expenses comprise interest expense on borrowings and unwinding of the discount on provisions. All borrowing costs are recognised in profi t or loss using the effective interest method, except to the extent that they are capitalised as being directly attributable to the acquisition, construction or production of an asset which necessarily takes a substantial period of time to be prepared for its intended use or sale.
63
ELL
IPSIZ
LTD
/ A
nnual
Report
2012
2 SUMMARY OF SIGNIFICANT ACCOUNTING POLICIES (continued)
2.19 Income tax expense
Income tax expense comprises current and deferred tax. Income tax expense is recognised in profi t or loss except to the extent that it relates to a business combination, or items recognised directly in equity or in other comprehensive income.
Current tax is the expected tax payable on the taxable income for the year, using tax rates enacted or substantively enacted at the reporting date, and any adjustment to tax payable in respect of previous years.
Deferred tax is recognised in respect of temporary differences between the carrying amounts of assets and liabilities for fi nancial reporting purposes and the amounts used for taxation purposes. Deferred tax is not recognised for the following temporary differences: the initial recognition of goodwill, the initial recognition of assets or liabilities in a transaction that is not a business combination and that affects neither accounting nor taxable profi t or loss, and differences relating to investments in subsidiaries and joint ventures to the extent that they will not reverse in the foreseeable future. Deferred tax is measured at the tax rates that are expected to be applied to the temporary differences when they reverse, based on the laws that have been enacted or substantively enacted by the reporting date.
Deferred tax assets and liabilities are offset if there is a legally enforceable right to offset current tax liabilities and assets, and they relate to income taxes levied by the same tax authority on the same taxable entity, or on different tax entities, but they intend to settle current tax liabilities and assets on a net basis or their tax assets and liabilities will be realised simultaneously.
A deferred tax asset is recognised to the extent that it is probable that future taxable profi ts will be available against which temporary differences can be utilised. Deferred tax assets are reviewed at each reporting date and are reduced to the extent that it is no longer probable that the related tax benefi t will be realised.
2.20 Dividends
Dividends on ordinary shares are recognised as a liability in the period when there is an obligation to pay the shareholders.
2.21 Segment reporting
An operating segment is a component of the Group that engages in business activities from which it may earn revenues and incur expenses, including revenues and expenses that relate to transactions with any of the Group’s other components. All operating segments’ operating results are reviewed regularly by the Group’s chief executive offi cer (CEO) to make decisions about resources to be allocated to the segment and assess its performance, and for which discrete fi nancial information is available.
Segment results that are reported to the CEO include items directly attributable to a segment as well as those that can be allocated on a reasonable basis. Unallocated items comprise mainly corporate assets (primarily the Company’s headquarters), head offi ce expenses, and income tax assets and liabilities.
Segment capital expenditure is the total cost incurred during the year to acquire property, plant and equipment, and intangible assets other than goodwill.
2.22 Earnings per share
The Group presents basic and diluted earnings per share data for its ordinary shares. Basic earnings per share is calculated by dividing the profi t or loss attributable to ordinary shareholders of the Company by the weighted average number of ordinary shares outstanding during the year, adjusted for own shares held. Diluted earnings per share is determined by adjusting the profi t or loss attributable to ordinary shareholders and the weighted average number of ordinary shares outstanding, adjusted for own shares held, for the effects of all dilutive potential ordinary shares, which comprise warrants, share options and awards granted to directors and employees.
notes to the fi nancial statementsYear ended 30 June 2012

64ELL
IPSIZ
LTD
/ A
nnual
Report
2012
notes to the fi nancial statementsYear ended 30 June 2012
3 PROPERTY, PLANT AND EQUIPMENT Mechanical Assets Leasehold Leasehold Furniture Offi ce Plant and under land and improve- and equip- Motor and electrical construct- Group building ments fi ttings ment Computers vehicles machinery facilities ion Total $’000 $’000 $’000 $’000 $’000 $’000 $’000 $’000 $’000 $’000
CostAt 1 July 2010 1,991 4,226 607 1,023 4,240 295 34,854 353 – 47,589Additions 3 313 63 42 226 44 771 10 1 1,473Disposals/Write off – (33) (2) (141) (42) (24) (331) (172) – (745)Reclassifi cation – – – – 205 – (205) – – –Translation difference on consolidation (217) (268) (40) (35) (309) (16) (2,998) – – (3,883)At 30 June 2011 1,777 4,238 628 889 4,320 299 32,091 191 1 44,434Additions 160 161 7 34 207 29 872 – – 1,470Disposals/Write off – (1,492) (67) (57) (74) (78) (1,740) (191) (1) (3,700)Arising from disposal of subsidiaries – (107) (62) (56) (115) (43) (2,280) – – (2,663)Reclassifi cation to intangible assets – – – – (266) – – – – (266)Translation difference on consolidation 86 82 13 – 89 6 964 – – 1,240At 30 June 2012 2,023 2,882 519 810 4,161 213 29,907 – – 40,515
Accumulated depreciation and impairment lossesAt 1 July 2010 146 3,447 527 892 3,680 241 29,376 327 – 38,636Depreciation charge for the year 54 442 35 65 333 30 2,544 1 – 3,504Impairment losses – 57 – 5 7 – 527 – – 596Disposals/Write off – (29) (2) (138) (37) (22) (318) (157) – (703)Reclassifi cation – – – – 198 – (198) – – –Translation difference on consolidation (19) (222) (36) (35) (280) (12) (2,614) – – (3,218)At 30 June 2011 181 3,695 524 789 3,901 237 29,317 171 – 38,815Depreciation charge for the year 62 310 26 35 219 30 1,248 – – 1,930Impairment losses – 28 – 2 – 3 127 – – 160Disposals/Write off – (1,503) (51) (49) (63) (48) (1,792) (171) – (3,677)Arising from disposal of subsidiaries – (107) (62) (56) (115) (43) (2,280) – – (2,663)Reclassifi cation to intangible assets – – – – (260) – – – – (260)Translation difference on consolidation 17 75 13 – 83 5 898 – – 1,091At 30 June 2012 260 2,498 450 721 3,765 184 27,518 – – 35,396
Carrying amountAt 1 July 2010 1,845 779 80 131 560 54 5,478 26 – 8,953
At 30 June 2011 1,596 543 104 100 419 62 2,774 20 1 5,619
At 30 June 2012 1,763 384 69 89 396 29 2,389 – – 5,119
Leasehold land and building and plant and machinery of the Group with carrying amounts of $Nil (2011: $1,518,000) and $Nil (2011: $589,000), respectively, have been pledged to banks as securities for certain bank loans (note 17).
The carrying amount of property, plant and equipment includes amounts totalling $151,000 (2011: $308,000) for the Group in respect of assets acquired under hire purchase agreements and fi nance leases (note 17).
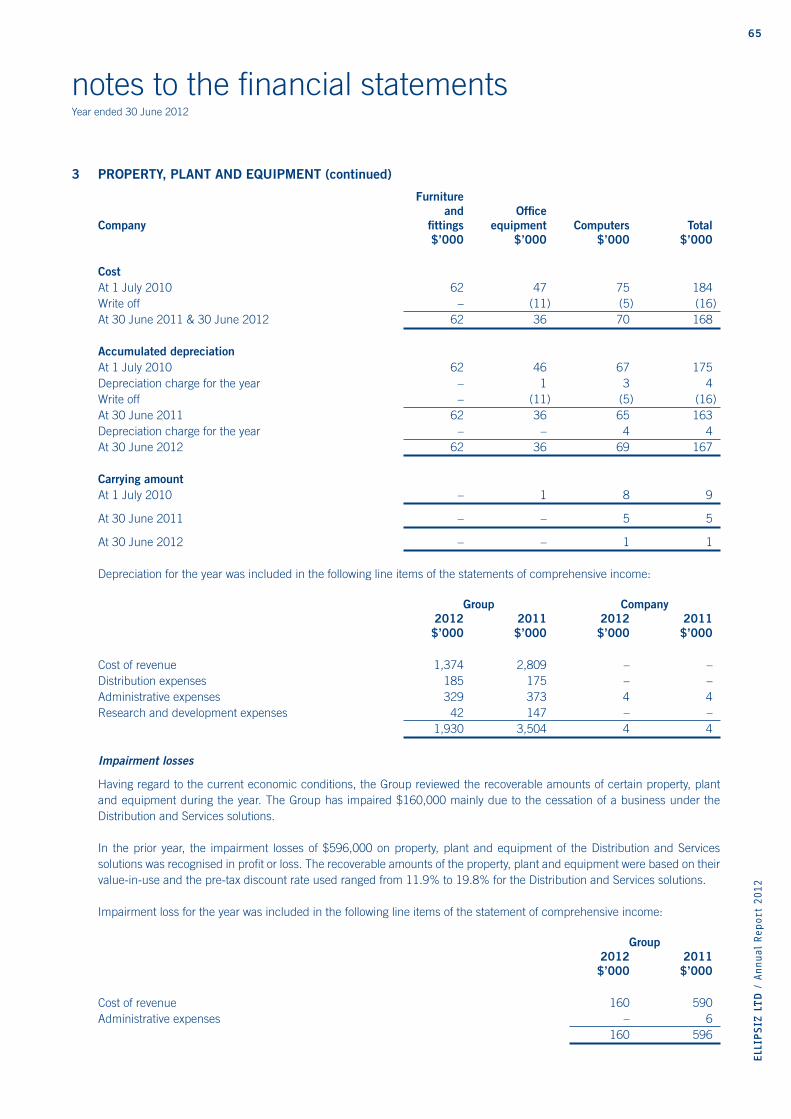
65
ELL
IPSIZ
LTD
/ A
nnual
Report
2012
notes to the fi nancial statementsYear ended 30 June 2012
3 PROPERTY, PLANT AND EQUIPMENT (continued)
Furniture and Offi ceCompany fi ttings equipment Computers Total $’000 $’000 $’000 $’000
CostAt 1 July 2010 62 47 75 184Write off – (11) (5) (16)At 30 June 2011 & 30 June 2012 62 36 70 168
Accumulated depreciationAt 1 July 2010 62 46 67 175Depreciation charge for the year – 1 3 4Write off – (11) (5) (16)At 30 June 2011 62 36 65 163Depreciation charge for the year – – 4 4At 30 June 2012 62 36 69 167
Carrying amountAt 1 July 2010 – 1 8 9
At 30 June 2011 – – 5 5
At 30 June 2012 – – 1 1
Depreciation for the year was included in the following line items of the statements of comprehensive income:
Group Company 2012 2011 2012 2011 $’000 $’000 $’000 $’000
Cost of revenue 1,374 2,809 – –Distribution expenses 185 175 – –Administrative expenses 329 373 4 4Research and development expenses 42 147 – – 1,930 3,504 4 4
Impairment losses
Having regard to the current economic conditions, the Group reviewed the recoverable amounts of certain property, plant and equipment during the year. The Group has impaired $160,000 mainly due to the cessation of a business under the Distribution and Services solutions.
In the prior year, the impairment losses of $596,000 on property, plant and equipment of the Distribution and Services solutions was recognised in profi t or loss. The recoverable amounts of the property, plant and equipment were based on their value-in-use and the pre-tax discount rate used ranged from 11.9% to 19.8% for the Distribution and Services solutions.
Impairment loss for the year was included in the following line items of the statement of comprehensive income:
Group 2012 2011 $’000 $’000
Cost of revenue 160 590Administrative expenses – 6 160 596
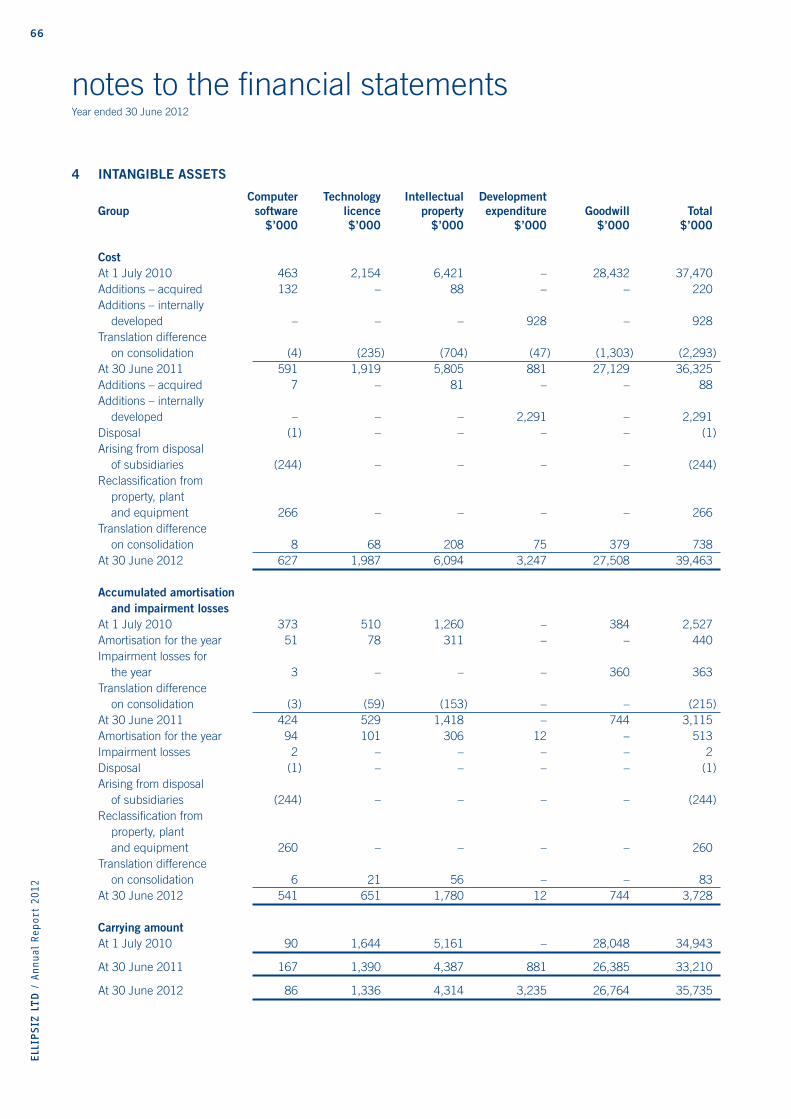
66ELL
IPSIZ
LTD
/ A
nnual
Report
2012
notes to the fi nancial statementsYear ended 30 June 2012
4 INTANGIBLE ASSETS
Computer Technology Intellectual DevelopmentGroup software licence property expenditure Goodwill Total $’000 $’000 $’000 $’000 $’000 $’000
CostAt 1 July 2010 463 2,154 6,421 – 28,432 37,470Additions – acquired 132 – 88 – – 220Additions – internally developed – – – 928 – 928Translation difference on consolidation (4) (235) (704) (47) (1,303) (2,293)At 30 June 2011 591 1,919 5,805 881 27,129 36,325Additions – acquired 7 – 81 – – 88Additions – internally developed – – – 2,291 – 2,291Disposal (1) – – – – (1)Arising from disposal of subsidiaries (244) – – – – (244)Reclassifi cation from property, plant and equipment 266 – – – – 266Translation difference on consolidation 8 68 208 75 379 738At 30 June 2012 627 1,987 6,094 3,247 27,508 39,463 Accumulated amortisation and impairment lossesAt 1 July 2010 373 510 1,260 – 384 2,527Amortisation for the year 51 78 311 – – 440Impairment losses for the year 3 – – – 360 363Translation difference on consolidation (3) (59) (153) – – (215)At 30 June 2011 424 529 1,418 – 744 3,115Amortisation for the year 94 101 306 12 – 513Impairment losses 2 – – – – 2Disposal (1) – – – – (1)Arising from disposal of subsidiaries (244) – – – – (244)Reclassifi cation from property, plant and equipment 260 – – – – 260Translation difference on consolidation 6 21 56 – – 83At 30 June 2012 541 651 1,780 12 744 3,728 Carrying amountAt 1 July 2010 90 1,644 5,161 – 28,048 34,943
At 30 June 2011 167 1,390 4,387 881 26,385 33,210
At 30 June 2012 86 1,336 4,314 3,235 26,764 35,735
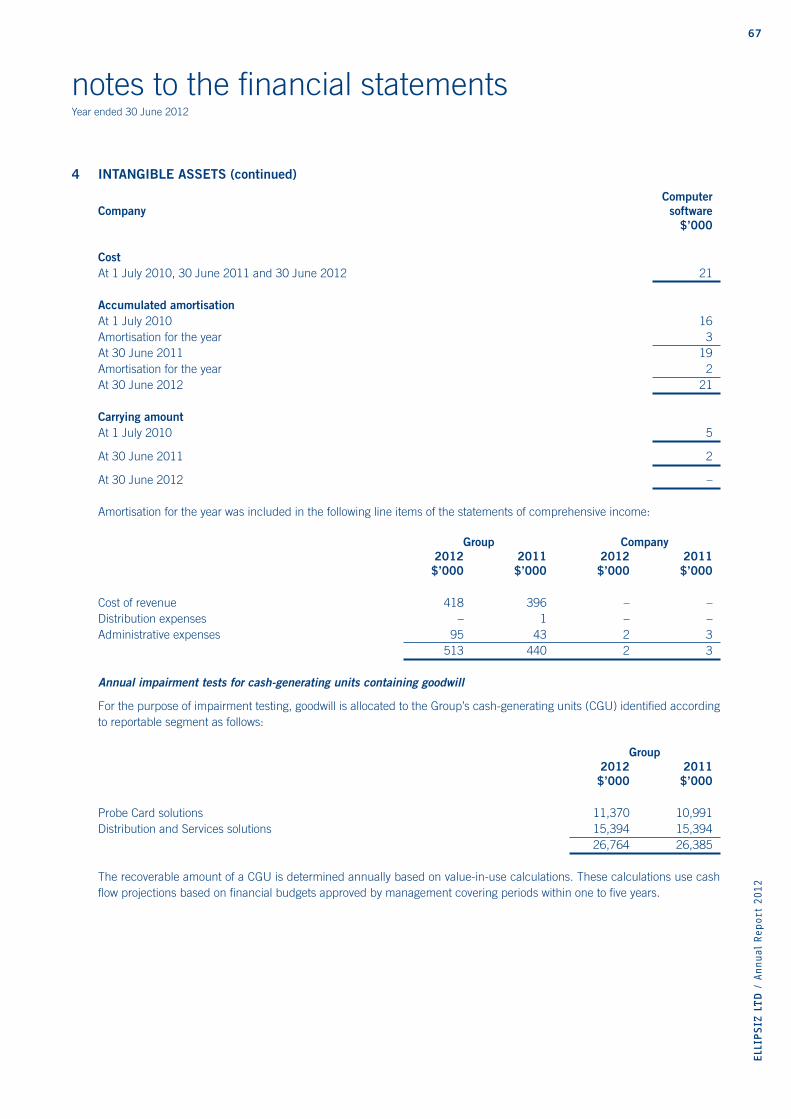
67
ELL
IPSIZ
LTD
/ A
nnual
Report
2012
notes to the fi nancial statementsYear ended 30 June 2012
4 INTANGIBLE ASSETS (continued)
ComputerCompany software $’000
CostAt 1 July 2010, 30 June 2011 and 30 June 2012 21
Accumulated amortisationAt 1 July 2010 16Amortisation for the year 3At 30 June 2011 19Amortisation for the year 2At 30 June 2012 21
Carrying amountAt 1 July 2010 5
At 30 June 2011 2
At 30 June 2012 –
Amortisation for the year was included in the following line items of the statements of comprehensive income:
Group Company 2012 2011 2012 2011 $’000 $’000 $’000 $’000
Cost of revenue 418 396 – –Distribution expenses – 1 – –Administrative expenses 95 43 2 3 513 440 2 3
Annual impairment tests for cash-generating units containing goodwill
For the purpose of impairment testing, goodwill is allocated to the Group’s cash-generating units (CGU) identifi ed according to reportable segment as follows:
Group 2012 2011 $’000 $’000
Probe Card solutions 11,370 10,991Distribution and Services solutions 15,394 15,394 26,764 26,385
The recoverable amount of a CGU is determined annually based on value-in-use calculations. These calculations use cash fl ow projections based on fi nancial budgets approved by management covering periods within one to fi ve years.
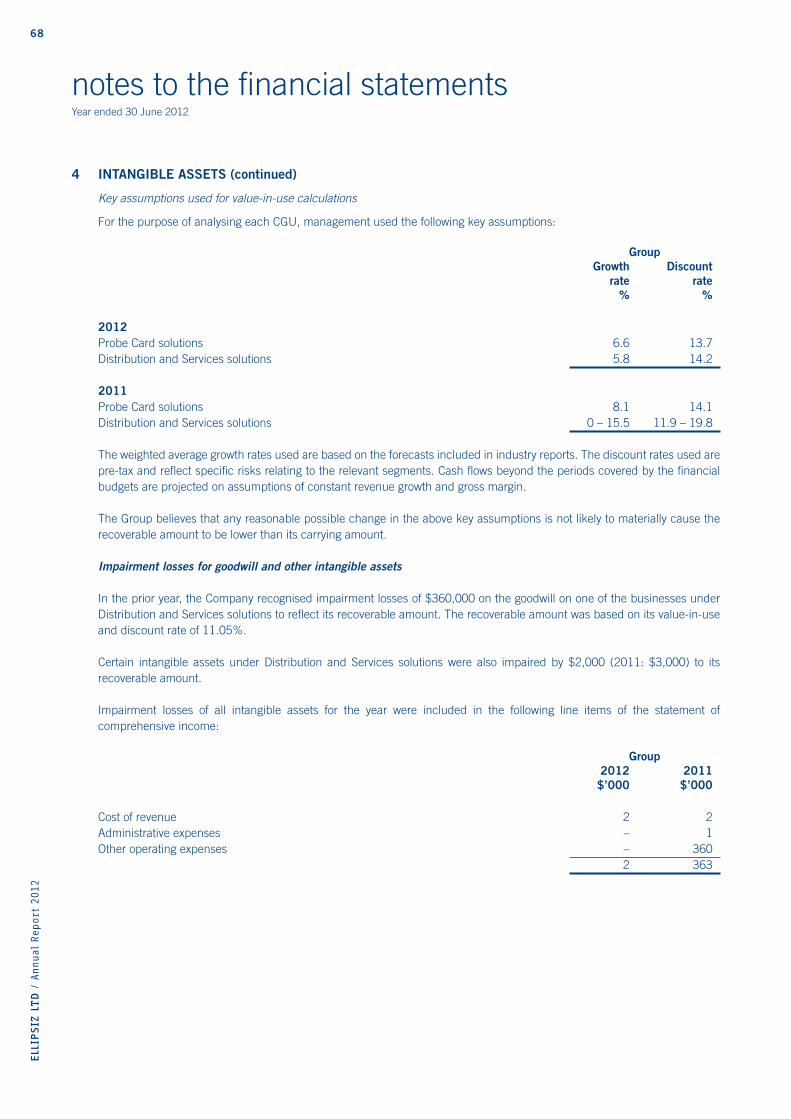
68ELL
IPSIZ
LTD
/ A
nnual
Report
2012
notes to the fi nancial statementsYear ended 30 June 2012
4 INTANGIBLE ASSETS (continued)
Key assumptions used for value-in-use calculations
For the purpose of analysing each CGU, management used the following key assumptions:
Group Growth Discount rate rate % %
2012Probe Card solutions 6.6 13.7Distribution and Services solutions 5.8 14.2
2011Probe Card solutions 8.1 14.1Distribution and Services solutions 0 – 15.5 11.9 – 19.8
The weighted average growth rates used are based on the forecasts included in industry reports. The discount rates used are pre-tax and refl ect specifi c risks relating to the relevant segments. Cash fl ows beyond the periods covered by the fi nancial budgets are projected on assumptions of constant revenue growth and gross margin.
The Group believes that any reasonable possible change in the above key assumptions is not likely to materially cause the recoverable amount to be lower than its carrying amount.
Impairment losses for goodwill and other intangible assets
In the prior year, the Company recognised impairment losses of $360,000 on the goodwill on one of the businesses under Distribution and Services solutions to refl ect its recoverable amount. The recoverable amount was based on its value-in-use and discount rate of 11.05%.
Certain intangible assets under Distribution and Services solutions were also impaired by $2,000 (2011: $3,000) to its recoverable amount.
Impairment losses of all intangible assets for the year were included in the following line items of the statement of comprehensive income:
Group 2012 2011 $’000 $’000
Cost of revenue 2 2Administrative expenses – 1Other operating expenses – 360 2 363
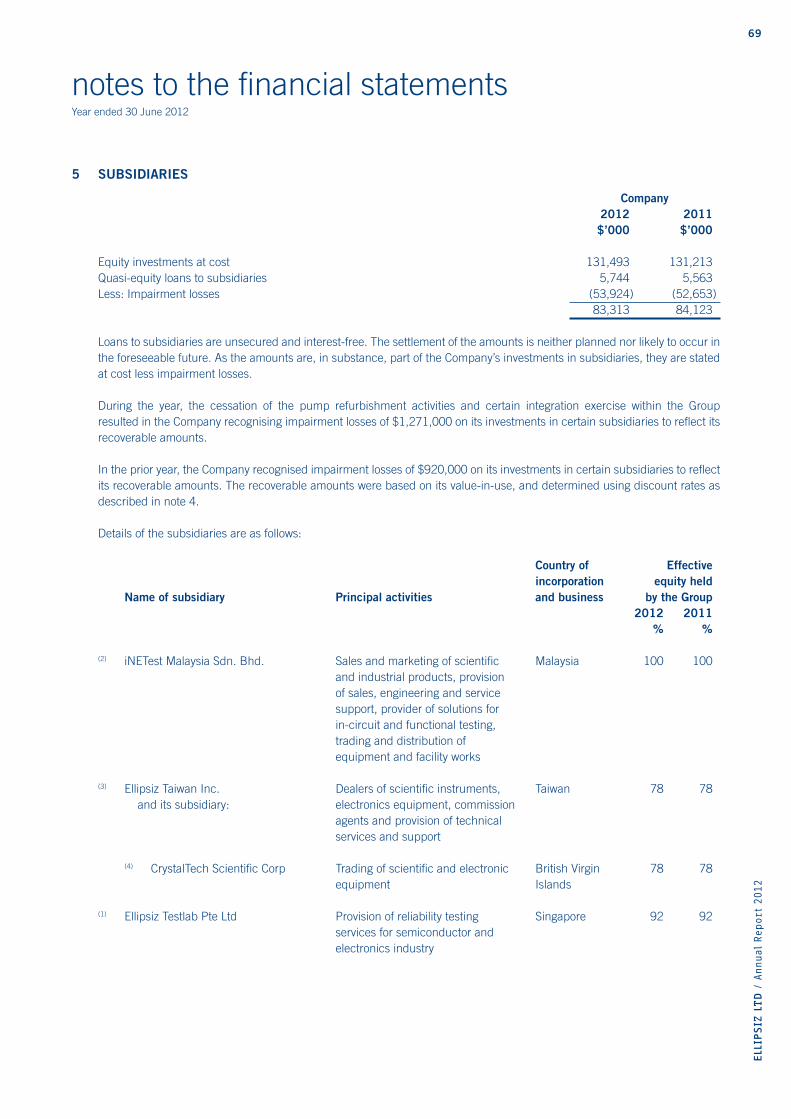
69
ELL
IPSIZ
LTD
/ A
nnual
Report
2012
notes to the fi nancial statementsYear ended 30 June 2012
5 SUBSIDIARIES
Company 2012 2011 $’000 $’000
Equity investments at cost 131,493 131,213Quasi-equity loans to subsidiaries 5,744 5,563Less: Impairment losses (53,924) (52,653) 83,313 84,123
Loans to subsidiaries are unsecured and interest-free. The settlement of the amounts is neither planned nor likely to occur in the foreseeable future. As the amounts are, in substance, part of the Company’s investments in subsidiaries, they are stated at cost less impairment losses.
During the year, the cessation of the pump refurbishment activities and certain integration exercise within the Group resulted in the Company recognising impairment losses of $1,271,000 on its investments in certain subsidiaries to refl ect its recoverable amounts.
In the prior year, the Company recognised impairment losses of $920,000 on its investments in certain subsidiaries to refl ect its recoverable amounts. The recoverable amounts were based on its value-in-use, and determined using discount rates as described in note 4.
Details of the subsidiaries are as follows:
Country of Effective incorporation equity held Name of subsidiary Principal activities and business by the Group 2012 2011 % %
(2) iNETest Malaysia Sdn. Bhd. Sales and marketing of scientifi c Malaysia 100 100 and industrial products, provision of sales, engineering and service support, provider of solutions for in-circuit and functional testing, trading and distribution of equipment and facility works
(3) Ellipsiz Taiwan Inc. Dealers of scientifi c instruments, Taiwan 78 78 and its subsidiary: electronics equipment, commission agents and provision of technical services and support
(4) CrystalTech Scientifi c Corp Trading of scientifi c and electronic British Virgin 78 78 equipment Islands
(1) Ellipsiz Testlab Pte Ltd Provision of reliability testing Singapore 92 92 services for semiconductor and electronics industry
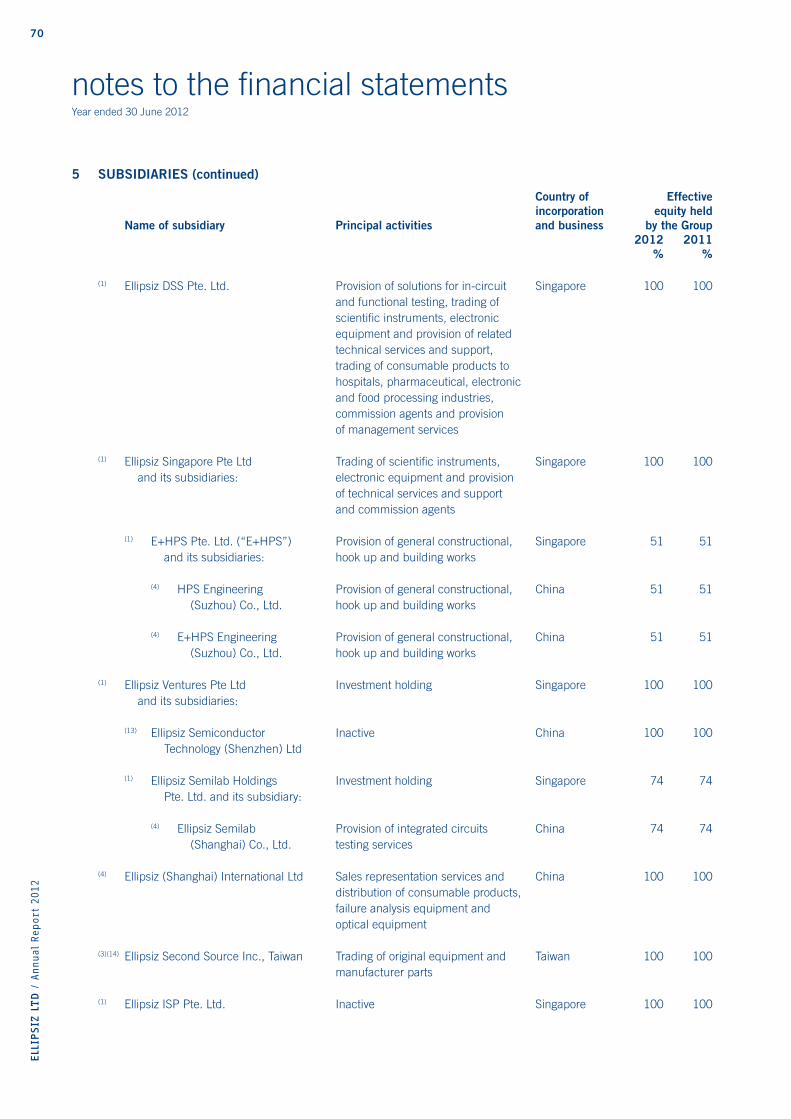
70ELL
IPSIZ
LTD
/ A
nnual
Report
2012
notes to the fi nancial statementsYear ended 30 June 2012
5 SUBSIDIARIES (continued)
Country of Effective incorporation equity held Name of subsidiary Principal activities and business by the Group 2012 2011 % %
(1) Ellipsiz DSS Pte. Ltd. Provision of solutions for in-circuit Singapore 100 100 and functional testing, trading of scientifi c instruments, electronic equipment and provision of related technical services and support, trading of consumable products to hospitals, pharmaceutical, electronic and food processing industries, commission agents and provision of management services
(1) Ellipsiz Singapore Pte Ltd Trading of scientifi c instruments, Singapore 100 100 and its subsidiaries: electronic equipment and provision of technical services and support and commission agents
(1) E+HPS Pte. Ltd. (“E+HPS”) Provision of general constructional, Singapore 51 51 and its subsidiaries: hook up and building works
(4) HPS Engineering Provision of general constructional, China 51 51 (Suzhou) Co., Ltd. hook up and building works
(4) E+HPS Engineering Provision of general constructional, China 51 51 (Suzhou) Co., Ltd. hook up and building works
(1) Ellipsiz Ventures Pte Ltd Investment holding Singapore 100 100 and its subsidiaries:
(13) Ellipsiz Semiconductor Inactive China 100 100 Technology (Shenzhen) Ltd
(1) Ellipsiz Semilab Holdings Investment holding Singapore 74 74 Pte. Ltd. and its subsidiary:
(4) Ellipsiz Semilab Provision of integrated circuits China 74 74 (Shanghai) Co., Ltd. testing services
(4) Ellipsiz (Shanghai) International Ltd Sales representation services and China 100 100 distribution of consumable products, failure analysis equipment and optical equipment
(3)(14) Ellipsiz Second Source Inc., Taiwan Trading of original equipment and Taiwan 100 100 manufacturer parts
(1) Ellipsiz ISP Pte. Ltd. Inactive Singapore 100 100
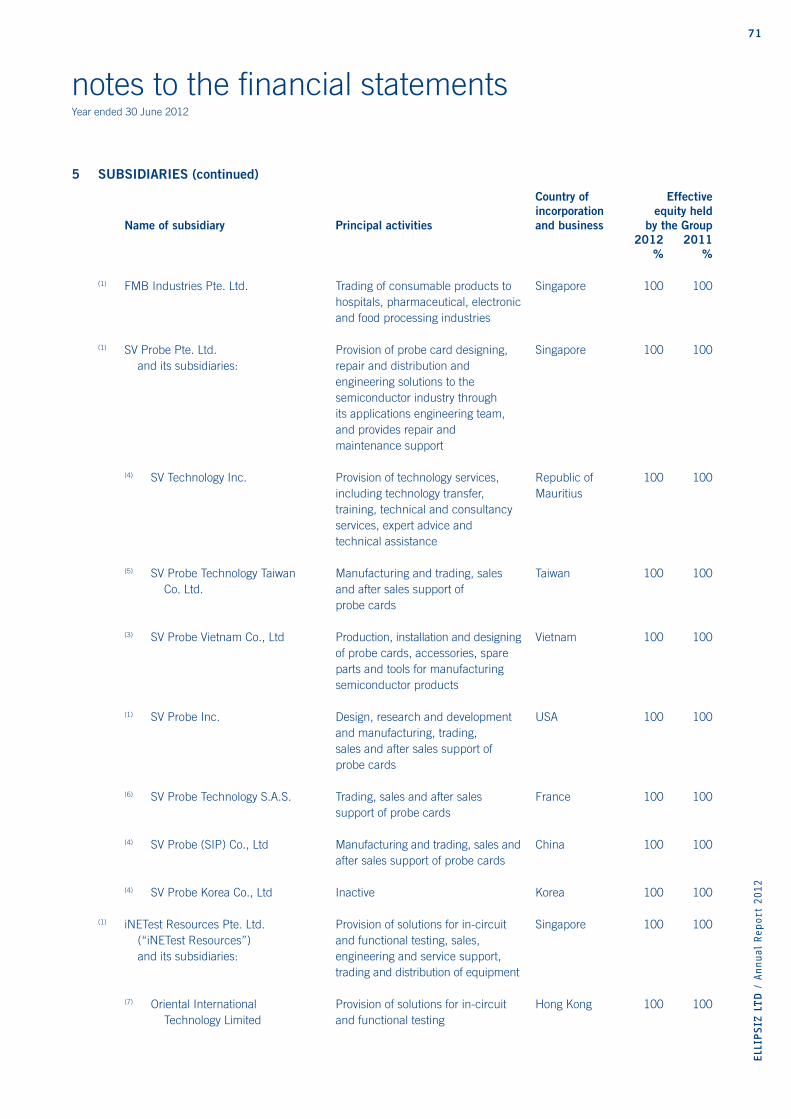
71
ELL
IPSIZ
LTD
/ A
nnual
Report
2012
notes to the fi nancial statementsYear ended 30 June 2012
5 SUBSIDIARIES (continued)
Country of Effective incorporation equity held Name of subsidiary Principal activities and business by the Group 2012 2011 % %
(1) FMB Industries Pte. Ltd. Trading of consumable products to Singapore 100 100 hospitals, pharmaceutical, electronic and food processing industries
(1) SV Probe Pte. Ltd. Provision of probe card designing, Singapore 100 100 and its subsidiaries: repair and distribution and engineering solutions to the semiconductor industry through its applications engineering team, and provides repair and maintenance support
(4) SV Technology Inc. Provision of technology services, Republic of 100 100 including technology transfer, Mauritius training, technical and consultancy services, expert advice and technical assistance
(5) SV Probe Technology Taiwan Manufacturing and trading, sales Taiwan 100 100 Co. Ltd. and after sales support of probe cards
(3) SV Probe Vietnam Co., Ltd Production, installation and designing Vietnam 100 100 of probe cards, accessories, spare parts and tools for manufacturing semiconductor products
(1) SV Probe Inc. Design, research and development USA 100 100 and manufacturing, trading, sales and after sales support of probe cards
(6) SV Probe Technology S.A.S. Trading, sales and after sales France 100 100 support of probe cards
(4) SV Probe (SIP) Co., Ltd Manufacturing and trading, sales and China 100 100 after sales support of probe cards
(4) SV Probe Korea Co., Ltd Inactive Korea 100 100
(1) iNETest Resources Pte. Ltd. Provision of solutions for in-circuit Singapore 100 100 (“iNETest Resources”) and functional testing, sales, and its subsidiaries: engineering and service support, trading and distribution of equipment
(7) Oriental International Provision of solutions for in-circuit Hong Kong 100 100 Technology Limited and functional testing
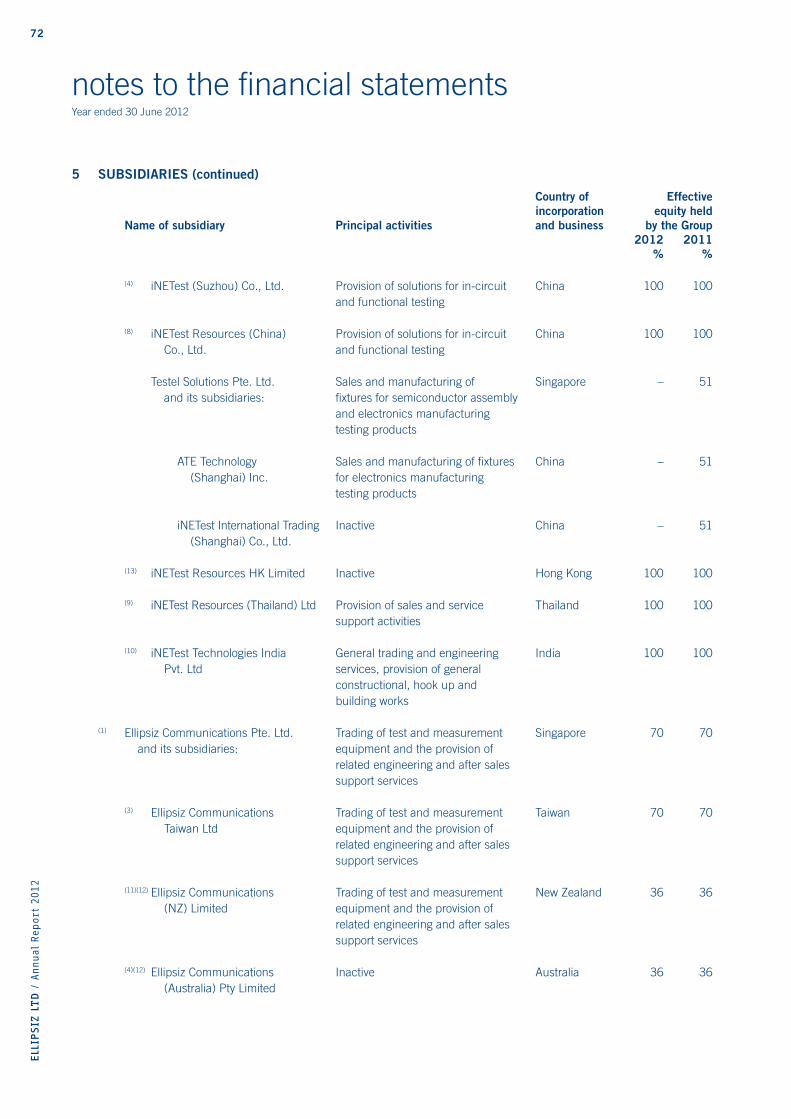
72ELL
IPSIZ
LTD
/ A
nnual
Report
2012
notes to the fi nancial statementsYear ended 30 June 2012
5 SUBSIDIARIES (continued)
Country of Effective incorporation equity held Name of subsidiary Principal activities and business by the Group 2012 2011 % %
(4) iNETest (Suzhou) Co., Ltd. Provision of solutions for in-circuit China 100 100 and functional testing
(8) iNETest Resources (China) Provision of solutions for in-circuit China 100 100 Co., Ltd. and functional testing
Testel Solutions Pte. Ltd. Sales and manufacturing of Singapore – 51 and its subsidiaries: fi xtures for semiconductor assembly and electronics manufacturing testing products
ATE Technology Sales and manufacturing of fi xtures China – 51 (Shanghai) Inc. for electronics manufacturing testing products
iNETest International Trading Inactive China – 51 (Shanghai) Co., Ltd.
(13) iNETest Resources HK Limited Inactive Hong Kong 100 100
(9) iNETest Resources (Thailand) Ltd Provision of sales and service Thailand 100 100 support activities
(10) iNETest Technologies India General trading and engineering India 100 100 Pvt. Ltd services, provision of general constructional, hook up and building works
(1) Ellipsiz Communications Pte. Ltd. Trading of test and measurement Singapore 70 70 and its subsidiaries: equipment and the provision of related engineering and after sales support services
(3) Ellipsiz Communications Trading of test and measurement Taiwan 70 70 Taiwan Ltd equipment and the provision of related engineering and after sales support services
(11)(12) Ellipsiz Communications Trading of test and measurement New Zealand 36 36 (NZ) Limited equipment and the provision of related engineering and after sales support services
(4)(12) Ellipsiz Communications Inactive Australia 36 36 (Australia) Pty Limited
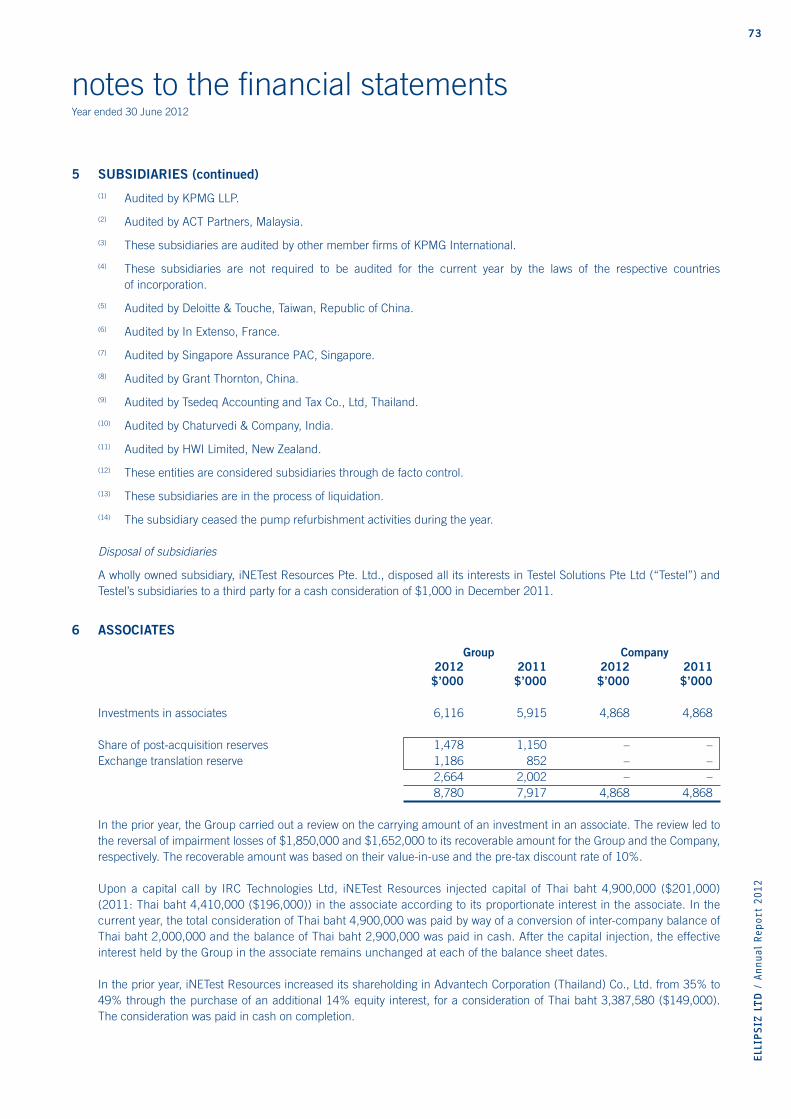
73
ELL
IPSIZ
LTD
/ A
nnual
Report
2012
notes to the fi nancial statementsYear ended 30 June 2012
5 SUBSIDIARIES (continued)(1) Audited by KPMG LLP.
(2) Audited by ACT Partners, Malaysia.
(3) These subsidiaries are audited by other member fi rms of KPMG International.
(4) These subsidiaries are not required to be audited for the current year by the laws of the respective countries of incorporation.
(5) Audited by Deloitte & Touche, Taiwan, Republic of China.
(6) Audited by In Extenso, France.
(7) Audited by Singapore Assurance PAC, Singapore.
(8) Audited by Grant Thornton, China.
(9) Audited by Tsedeq Accounting and Tax Co., Ltd, Thailand.
(10) Audited by Chaturvedi & Company, India.
(11) Audited by HWI Limited, New Zealand.
(12) These entities are considered subsidiaries through de facto control.
(13) These subsidiaries are in the process of liquidation.
(14) The subsidiary ceased the pump refurbishment activities during the year.
Disposal of subsidiaries
A wholly owned subsidiary, iNETest Resources Pte. Ltd., disposed all its interests in Testel Solutions Pte Ltd (“Testel”) and Testel’s subsidiaries to a third party for a cash consideration of $1,000 in December 2011.
6 ASSOCIATES
Group Company 2012 2011 2012 2011 $’000 $’000 $’000 $’000
Investments in associates 6,116 5,915 4,868 4,868
Share of post-acquisition reserves 1,478 1,150 – –Exchange translation reserve 1,186 852 – – 2,664 2,002 – – 8,780 7,917 4,868 4,868
In the prior year, the Group carried out a review on the carrying amount of an investment in an associate. The review led to the reversal of impairment losses of $1,850,000 and $1,652,000 to its recoverable amount for the Group and the Company, respectively. The recoverable amount was based on their value-in-use and the pre-tax discount rate of 10%.
Upon a capital call by IRC Technologies Ltd, iNETest Resources injected capital of Thai baht 4,900,000 ($201,000) (2011: Thai baht 4,410,000 ($196,000)) in the associate according to its proportionate interest in the associate. In the current year, the total consideration of Thai baht 4,900,000 was paid by way of a conversion of inter-company balance of Thai baht 2,000,000 and the balance of Thai baht 2,900,000 was paid in cash. After the capital injection, the effective interest held by the Group in the associate remains unchanged at each of the balance sheet dates.
In the prior year, iNETest Resources increased its shareholding in Advantech Corporation (Thailand) Co., Ltd. from 35% to 49% through the purchase of an additional 14% equity interest, for a consideration of Thai baht 3,387,580 ($149,000). The consideration was paid in cash on completion.
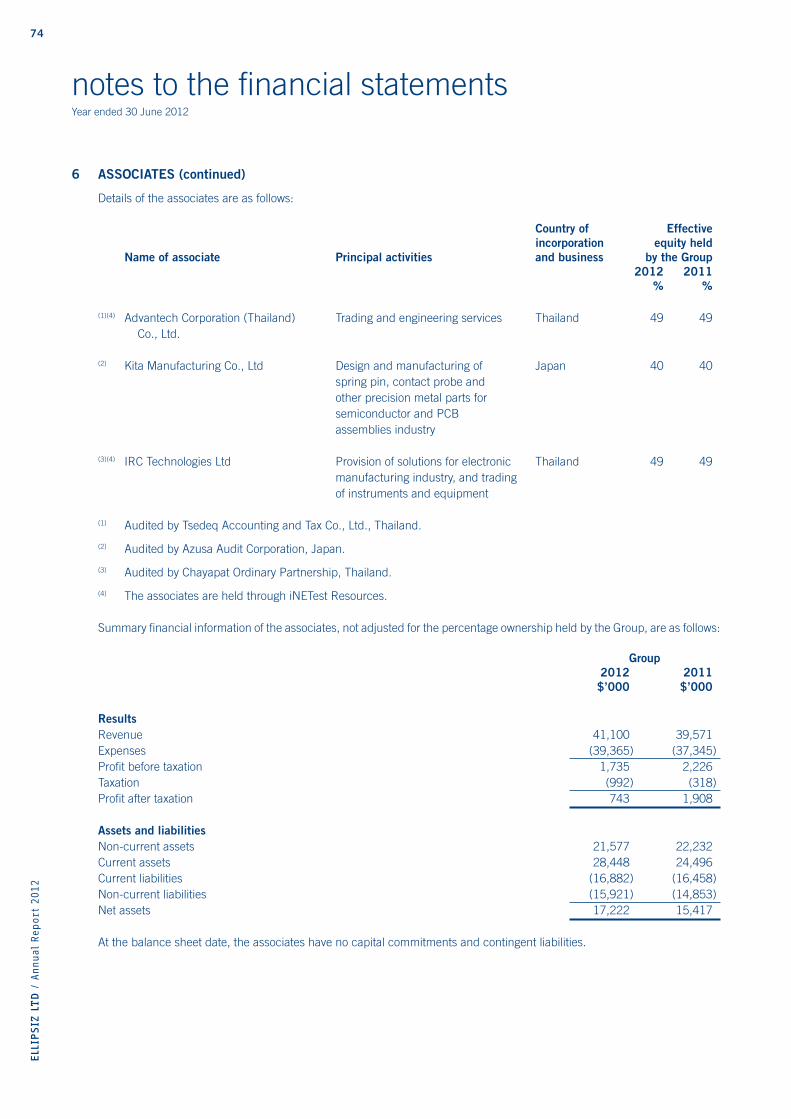
74ELL
IPSIZ
LTD
/ A
nnual
Report
2012
notes to the fi nancial statementsYear ended 30 June 2012
6 ASSOCIATES (continued)
Details of the associates are as follows:
Country of Effective incorporation equity held Name of associate Principal activities and business by the Group 2012 2011 % %
(1)(4) Advantech Corporation (Thailand) Trading and engineering services Thailand 49 49 Co., Ltd.
(2) Kita Manufacturing Co., Ltd Design and manufacturing of Japan 40 40 spring pin, contact probe and other precision metal parts for semiconductor and PCB assemblies industry
(3)(4) IRC Technologies Ltd Provision of solutions for electronic Thailand 49 49 manufacturing industry, and trading of instruments and equipment
(1) Audited by Tsedeq Accounting and Tax Co., Ltd., Thailand.
(2) Audited by Azusa Audit Corporation, Japan.
(3) Audited by Chayapat Ordinary Partnership, Thailand.
(4) The associates are held through iNETest Resources.
Summary fi nancial information of the associates, not adjusted for the percentage ownership held by the Group, are as follows:
Group 2012 2011 $’000 $’000
ResultsRevenue 41,100 39,571Expenses (39,365) (37,345)Profi t before taxation 1,735 2,226Taxation (992) (318)Profi t after taxation 743 1,908
Assets and liabilitiesNon-current assets 21,577 22,232Current assets 28,448 24,496Current liabilities (16,882) (16,458)Non-current liabilities (15,921) (14,853)Net assets 17,222 15,417
At the balance sheet date, the associates have no capital commitments and contingent liabilities.
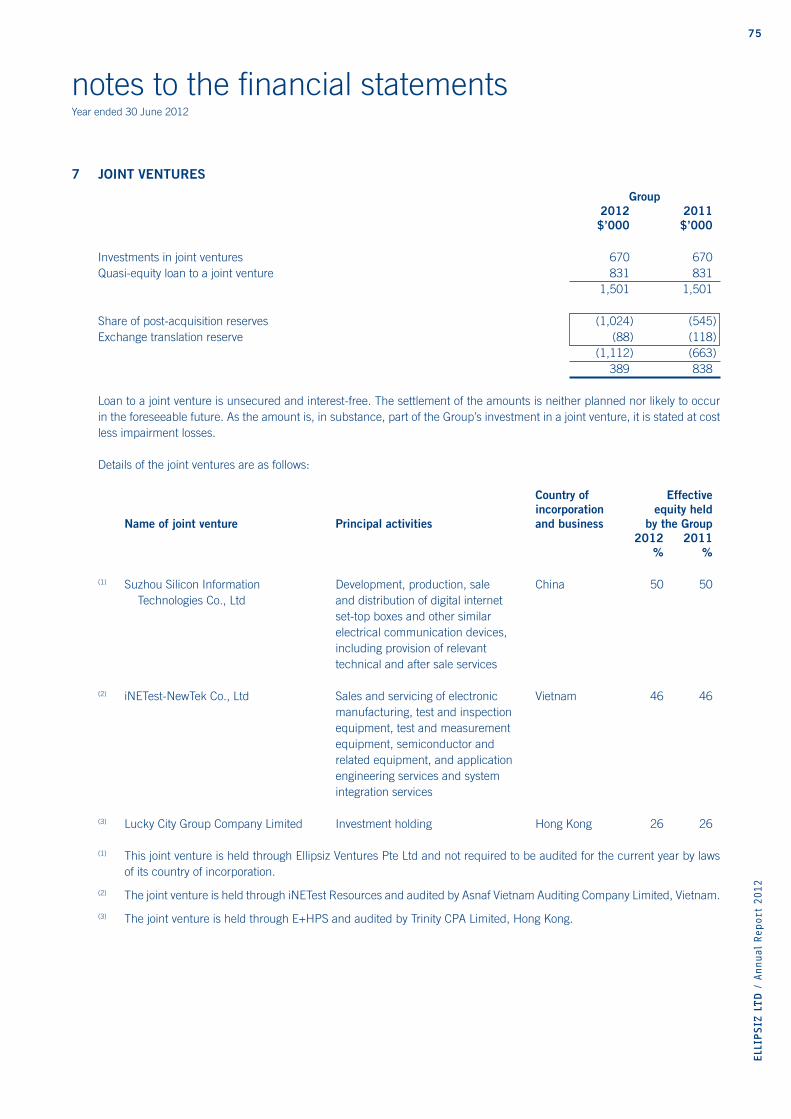
75
ELL
IPSIZ
LTD
/ A
nnual
Report
2012
notes to the fi nancial statementsYear ended 30 June 2012
7 JOINT VENTURES
Group 2012 2011 $’000 $’000
Investments in joint ventures 670 670Quasi-equity loan to a joint venture 831 831 1,501 1,501
Share of post-acquisition reserves (1,024) (545)Exchange translation reserve (88) (118) (1,112) (663) 389 838
Loan to a joint venture is unsecured and interest-free. The settlement of the amounts is neither planned nor likely to occur in the foreseeable future. As the amount is, in substance, part of the Group’s investment in a joint venture, it is stated at cost less impairment losses.
Details of the joint ventures are as follows:
Country of Effective incorporation equity held Name of joint venture Principal activities and business by the Group 2012 2011 % %
(1) Suzhou Silicon Information Development, production, sale China 50 50 Technologies Co., Ltd and distribution of digital internet set-top boxes and other similar electrical communication devices, including provision of relevant technical and after sale services
(2) iNETest-NewTek Co., Ltd Sales and servicing of electronic Vietnam 46 46 manufacturing, test and inspection equipment, test and measurement equipment, semiconductor and related equipment, and application engineering services and system integration services
(3) Lucky City Group Company Limited Investment holding Hong Kong 26 26
(1) This joint venture is held through Ellipsiz Ventures Pte Ltd and not required to be audited for the current year by laws of its country of incorporation.
(2) The joint venture is held through iNETest Resources and audited by Asnaf Vietnam Auditing Company Limited, Vietnam.
(3) The joint venture is held through E+HPS and audited by Trinity CPA Limited, Hong Kong.
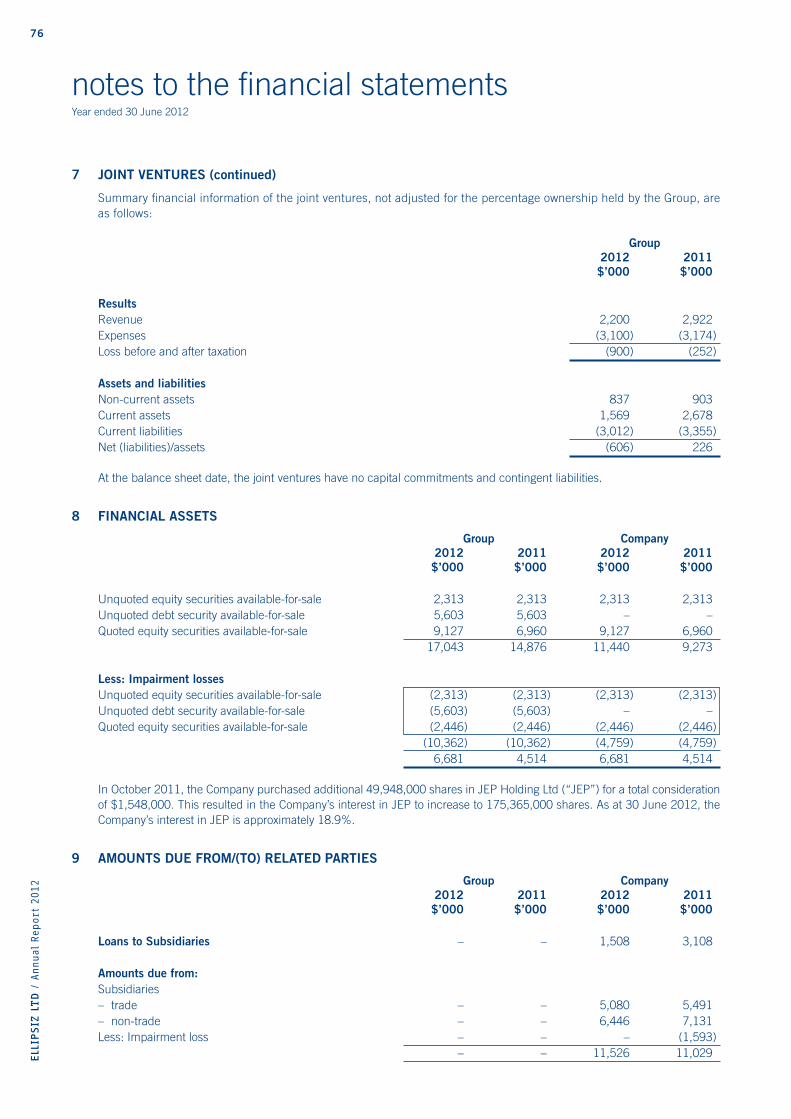
76ELL
IPSIZ
LTD
/ A
nnual
Report
2012
notes to the fi nancial statementsYear ended 30 June 2012
7 JOINT VENTURES (continued)
Summary fi nancial information of the joint ventures, not adjusted for the percentage ownership held by the Group, are as follows:
Group 2012 2011 $’000 $’000
ResultsRevenue 2,200 2,922Expenses (3,100) (3,174)Loss before and after taxation (900) (252)
Assets and liabilitiesNon-current assets 837 903Current assets 1,569 2,678Current liabilities (3,012) (3,355)Net (liabilities)/assets (606) 226
At the balance sheet date, the joint ventures have no capital commitments and contingent liabilities.
8 FINANCIAL ASSETS
Group Company 2012 2011 2012 2011 $’000 $’000 $’000 $’000
Unquoted equity securities available-for-sale 2,313 2,313 2,313 2,313Unquoted debt security available-for-sale 5,603 5,603 – –Quoted equity securities available-for-sale 9,127 6,960 9,127 6,960 17,043 14,876 11,440 9,273
Less: Impairment lossesUnquoted equity securities available-for-sale (2,313) (2,313) (2,313) (2,313)Unquoted debt security available-for-sale (5,603) (5,603) – –Quoted equity securities available-for-sale (2,446) (2,446) (2,446) (2,446) (10,362) (10,362) (4,759) (4,759) 6,681 4,514 6,681 4,514
In October 2011, the Company purchased additional 49,948,000 shares in JEP Holding Ltd (“JEP”) for a total consideration of $1,548,000. This resulted in the Company’s interest in JEP to increase to 175,365,000 shares. As at 30 June 2012, the Company’s interest in JEP is approximately 18.9%.
9 AMOUNTS DUE FROM/(TO) RELATED PARTIES
Group Company 2012 2011 2012 2011 $’000 $’000 $’000 $’000
Loans to Subsidiaries – – 1,508 3,108
Amounts due from:Subsidiaries– trade – – 5,080 5,491– non-trade – – 6,446 7,131Less: Impairment loss – – – (1,593) – – 11,526 11,029
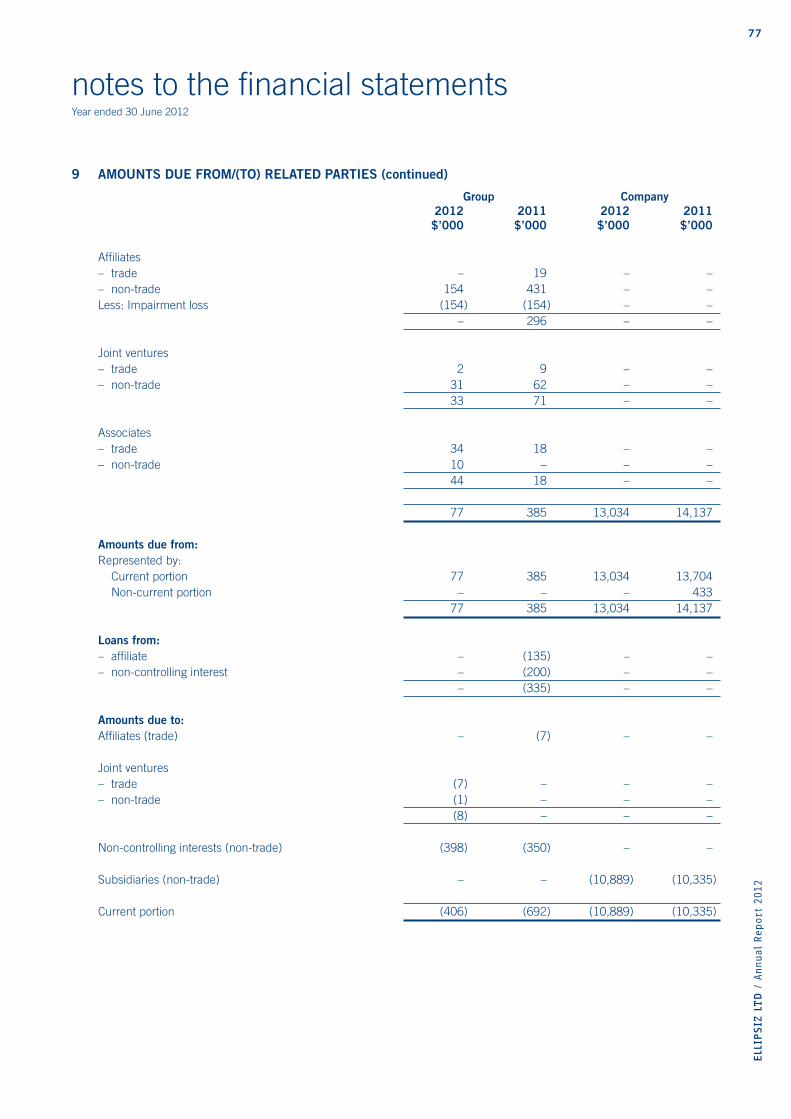
77
ELL
IPSIZ
LTD
/ A
nnual
Report
2012
notes to the fi nancial statementsYear ended 30 June 2012
9 AMOUNTS DUE FROM/(TO) RELATED PARTIES (continued)
Group Company 2012 2011 2012 2011 $’000 $’000 $’000 $’000
Affi liates– trade – 19 – –– non-trade 154 431 – –Less: Impairment loss (154) (154) – – – 296 – –
Joint ventures– trade 2 9 – –– non-trade 31 62 – – 33 71 – –
Associates– trade 34 18 – –– non-trade 10 – – – 44 18 – –
77 385 13,034 14,137
Amounts due from:Represented by: Current portion 77 385 13,034 13,704 Non-current portion – – – 433 77 385 13,034 14,137
Loans from:– affi liate – (135) – –– non-controlling interest – (200) – – – (335) – –
Amounts due to:Affi liates (trade) – (7) – –
Joint ventures– trade (7) – – –– non-trade (1) – – – (8) – – –
Non-controlling interests (non-trade) (398) (350) – –
Subsidiaries (non-trade) – – (10,889) (10,335)
Current portion (406) (692) (10,889) (10,335)
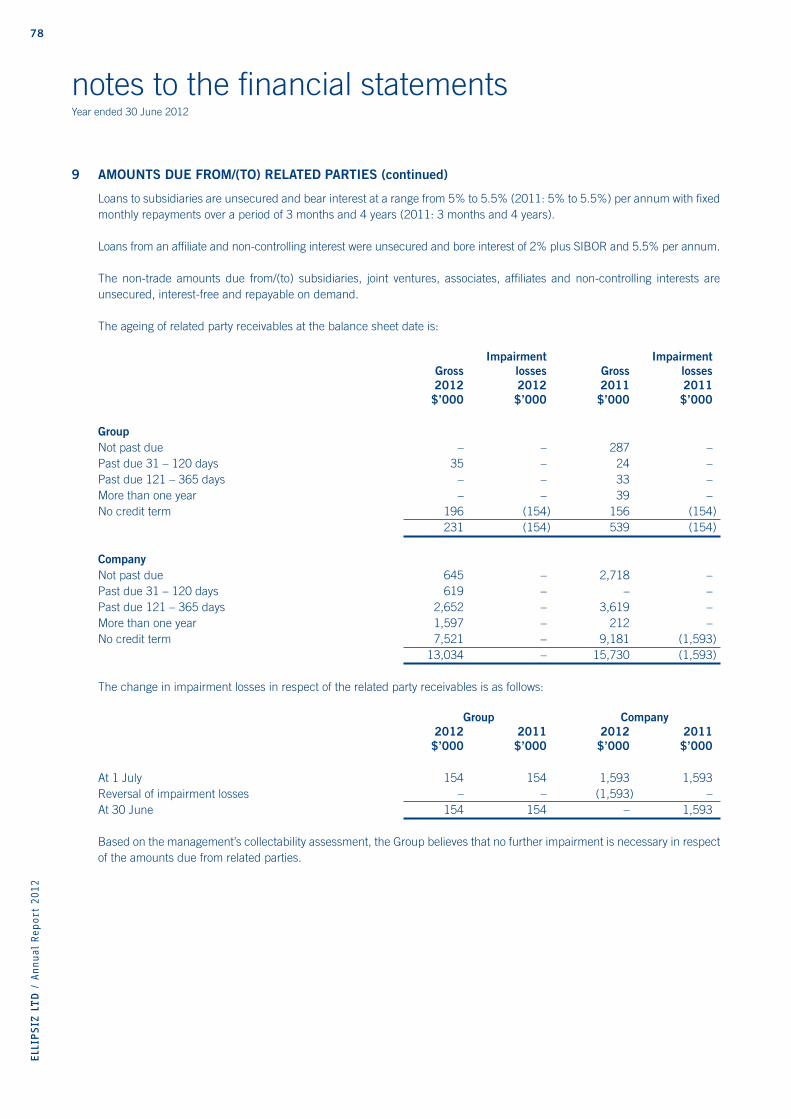
78ELL
IPSIZ
LTD
/ A
nnual
Report
2012
notes to the fi nancial statementsYear ended 30 June 2012
9 AMOUNTS DUE FROM/(TO) RELATED PARTIES (continued)
Loans to subsidiaries are unsecured and bear interest at a range from 5% to 5.5% (2011: 5% to 5.5%) per annum with fi xed monthly repayments over a period of 3 months and 4 years (2011: 3 months and 4 years).
Loans from an affi liate and non-controlling interest were unsecured and bore interest of 2% plus SIBOR and 5.5% per annum.
The non-trade amounts due from/(to) subsidiaries, joint ventures, associates, affi liates and non-controlling interests are unsecured, interest-free and repayable on demand.
The ageing of related party receivables at the balance sheet date is:
Impairment Impairment Gross losses Gross losses 2012 2012 2011 2011 $’000 $’000 $’000 $’000
GroupNot past due – – 287 –Past due 31 – 120 days 35 – 24 –Past due 121 – 365 days – – 33 –More than one year – – 39 –No credit term 196 (154) 156 (154) 231 (154) 539 (154)
CompanyNot past due 645 – 2,718 –Past due 31 – 120 days 619 – – –Past due 121 – 365 days 2,652 – 3,619 –More than one year 1,597 – 212 –No credit term 7,521 – 9,181 (1,593) 13,034 – 15,730 (1,593)
The change in impairment losses in respect of the related party receivables is as follows:
Group Company 2012 2011 2012 2011 $’000 $’000 $’000 $’000
At 1 July 154 154 1,593 1,593Reversal of impairment losses – – (1,593) –At 30 June 154 154 – 1,593 Based on the management’s collectability assessment, the Group believes that no further impairment is necessary in respect of the amounts due from related parties.
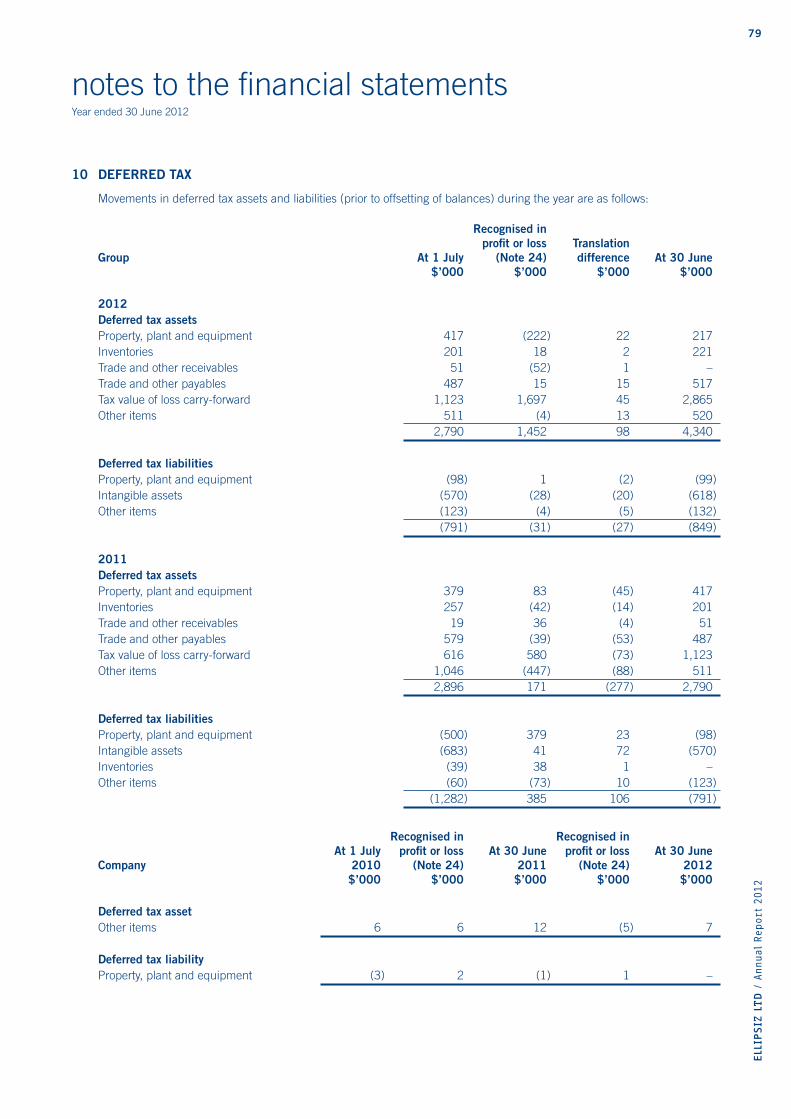
79
ELL
IPSIZ
LTD
/ A
nnual
Report
2012
notes to the fi nancial statementsYear ended 30 June 2012
10 DEFERRED TAX
Movements in deferred tax assets and liabilities (prior to offsetting of balances) during the year are as follows:
Recognised in profi t or loss TranslationGroup At 1 July (Note 24) difference At 30 June $’000 $’000 $’000 $’000
2012Deferred tax assetsProperty, plant and equipment 417 (222) 22 217Inventories 201 18 2 221Trade and other receivables 51 (52) 1 –Trade and other payables 487 15 15 517Tax value of loss carry-forward 1,123 1,697 45 2,865Other items 511 (4) 13 520 2,790 1,452 98 4,340
Deferred tax liabilitiesProperty, plant and equipment (98) 1 (2) (99)Intangible assets (570) (28) (20) (618)Other items (123) (4) (5) (132) (791) (31) (27) (849)
2011Deferred tax assetsProperty, plant and equipment 379 83 (45) 417Inventories 257 (42) (14) 201Trade and other receivables 19 36 (4) 51Trade and other payables 579 (39) (53) 487Tax value of loss carry-forward 616 580 (73) 1,123Other items 1,046 (447) (88) 511 2,896 171 (277) 2,790
Deferred tax liabilitiesProperty, plant and equipment (500) 379 23 (98)Intangible assets (683) 41 72 (570)Inventories (39) 38 1 –Other items (60) (73) 10 (123) (1,282) 385 106 (791)
Recognised in Recognised in At 1 July profi t or loss At 30 June profi t or loss At 30 JuneCompany 2010 (Note 24) 2011 (Note 24) 2012 $’000 $’000 $’000 $’000 $’000
Deferred tax assetOther items 6 6 12 (5) 7
Deferred tax liabilityProperty, plant and equipment (3) 2 (1) 1 –
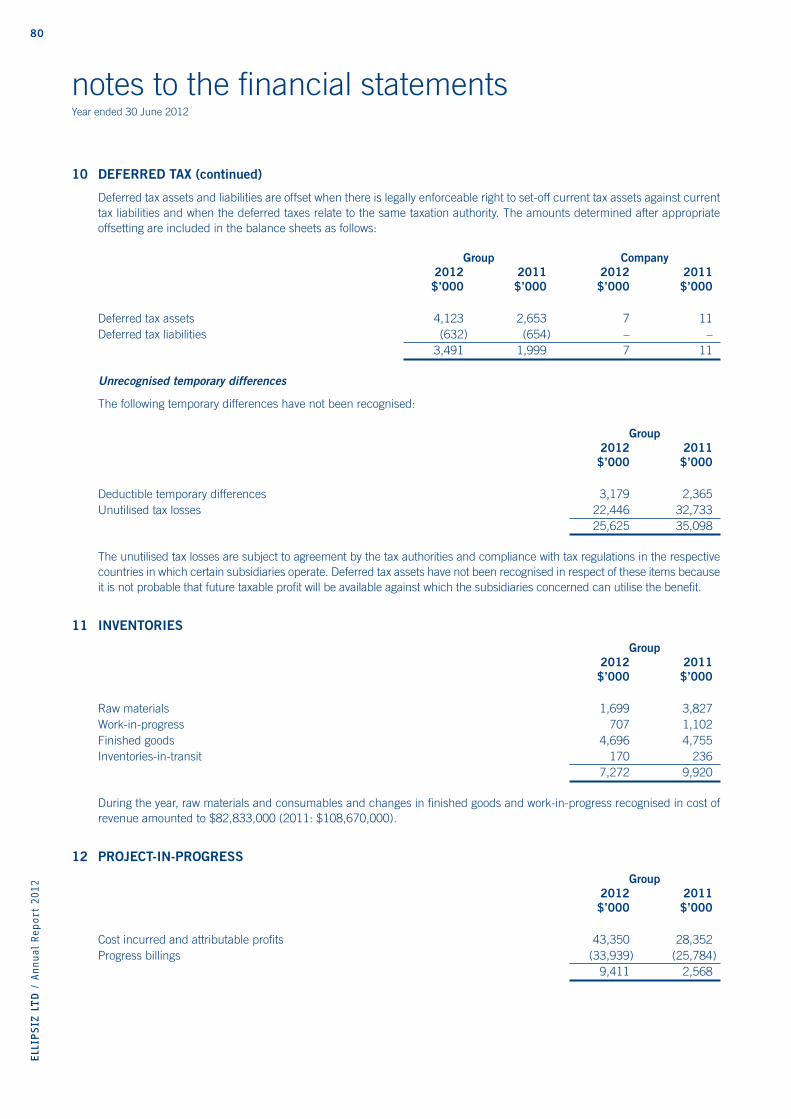
80ELL
IPSIZ
LTD
/ A
nnual
Report
2012
notes to the fi nancial statementsYear ended 30 June 2012
10 DEFERRED TAX (continued)
Deferred tax assets and liabilities are offset when there is legally enforceable right to set-off current tax assets against current tax liabilities and when the deferred taxes relate to the same taxation authority. The amounts determined after appropriate offsetting are included in the balance sheets as follows:
Group Company 2012 2011 2012 2011 $’000 $’000 $’000 $’000
Deferred tax assets 4,123 2,653 7 11Deferred tax liabilities (632) (654) – – 3,491 1,999 7 11
Unrecognised temporary differences
The following temporary differences have not been recognised:
Group 2012 2011 $’000 $’000
Deductible temporary differences 3,179 2,365Unutilised tax losses 22,446 32,733 25,625 35,098
The unutilised tax losses are subject to agreement by the tax authorities and compliance with tax regulations in the respective countries in which certain subsidiaries operate. Deferred tax assets have not been recognised in respect of these items because it is not probable that future taxable profi t will be available against which the subsidiaries concerned can utilise the benefi t.
11 INVENTORIES
Group 2012 2011 $’000 $’000
Raw materials 1,699 3,827Work-in-progress 707 1,102Finished goods 4,696 4,755Inventories-in-transit 170 236 7,272 9,920
During the year, raw materials and consumables and changes in fi nished goods and work-in-progress recognised in cost of revenue amounted to $82,833,000 (2011: $108,670,000).
12 PROJECT-IN-PROGRESS
Group 2012 2011 $’000 $’000
Cost incurred and attributable profi ts 43,350 28,352Progress billings (33,939) (25,784) 9,411 2,568

81
ELL
IPSIZ
LTD
/ A
nnual
Report
2012
notes to the fi nancial statementsYear ended 30 June 2012
12 PROJECT-IN-PROGRESS (continued)
Group Note 2012 2011 $’000 $’000
Comprising:Project-in-progress 9,778 4,085Excess of progress billings over project-in-progress 18 (367) (1,517) 9,411 2,568
13 TRADE AND OTHER RECEIVABLES
Group Company 2012 2011 2012 2011 $’000 $’000 $’000 $’000
Trade receivablesTrade receivables 34,557 35,906 – –Less: Impairment losses (250) (448) – –Net trade receivables 34,307 35,458 – –
Other receivablesTax receivables 131 42 – –Refundable deposits 918 1,003 21 20Sundry receivables 1,713 1,144 239 339Less: Impairment losses – (110) – –Net sundry receivables 1,713 1,034 239 339Prepayments 1,299 955 4 3 38,368 38,492 264 362
Represented by: Current portion 32,164 33,797 264 362 Non-current portion 6,204 4,695 – – 38,368 38,492 264 362 Concentration of credit risk relating to trade and other receivables is limited due to the Group’s varied customers base. The Group’s customers are globally dispersed, engage in a wide spectrum of activities, and sell in a variety of end markets.
Impairment losses
The ageing of trade and other receivables at the balance sheet date is:
Impairment Impairment Gross losses Gross losses 2012 2012 2011 2011 $’000 $’000 $’000 $’000
GroupTrade receivablesNot past due 22,647 – 22,175 –Past due 0 – 30 days 6,973 – 8,803 –Past due 31 – 120 days 3,051 – 2,877 (9)Past due 121 – 365 days 1,484 (6) 1,481 –More than one year 402 (244) 570 (439) 34,557 (250) 35,906 (448)
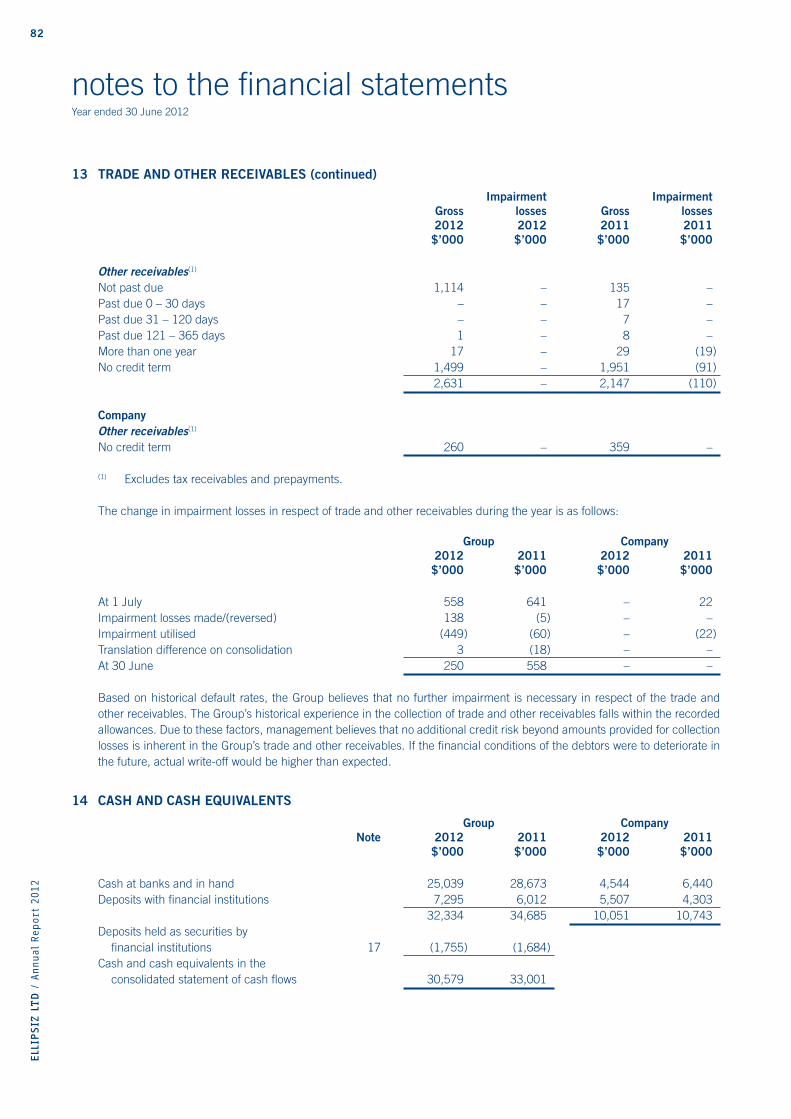
82ELL
IPSIZ
LTD
/ A
nnual
Report
2012
notes to the fi nancial statementsYear ended 30 June 2012
13 TRADE AND OTHER RECEIVABLES (continued)
Impairment Impairment Gross losses Gross losses 2012 2012 2011 2011 $’000 $’000 $’000 $’000
Other receivables(1)
Not past due 1,114 – 135 –Past due 0 – 30 days – – 17 –Past due 31 – 120 days – – 7 –Past due 121 – 365 days 1 – 8 –More than one year 17 – 29 (19)No credit term 1,499 – 1,951 (91) 2,631 – 2,147 (110)
CompanyOther receivables(1)
No credit term 260 – 359 –
(1) Excludes tax receivables and prepayments.
The change in impairment losses in respect of trade and other receivables during the year is as follows:
Group Company 2012 2011 2012 2011 $’000 $’000 $’000 $’000
At 1 July 558 641 – 22Impairment losses made/(reversed) 138 (5) – –Impairment utilised (449) (60) – (22)Translation difference on consolidation 3 (18) – –At 30 June 250 558 – –
Based on historical default rates, the Group believes that no further impairment is necessary in respect of the trade and other receivables. The Group’s historical experience in the collection of trade and other receivables falls within the recorded allowances. Due to these factors, management believes that no additional credit risk beyond amounts provided for collection losses is inherent in the Group’s trade and other receivables. If the fi nancial conditions of the debtors were to deteriorate in the future, actual write-off would be higher than expected.
14 CASH AND CASH EQUIVALENTS
Group Company Note 2012 2011 2012 2011 $’000 $’000 $’000 $’000
Cash at banks and in hand 25,039 28,673 4,544 6,440Deposits with fi nancial institutions 7,295 6,012 5,507 4,303 32,334 34,685 10,051 10,743Deposits held as securities by fi nancial institutions 17 (1,755) (1,684)Cash and cash equivalents in the consolidated statement of cash fl ows 30,579 33,001
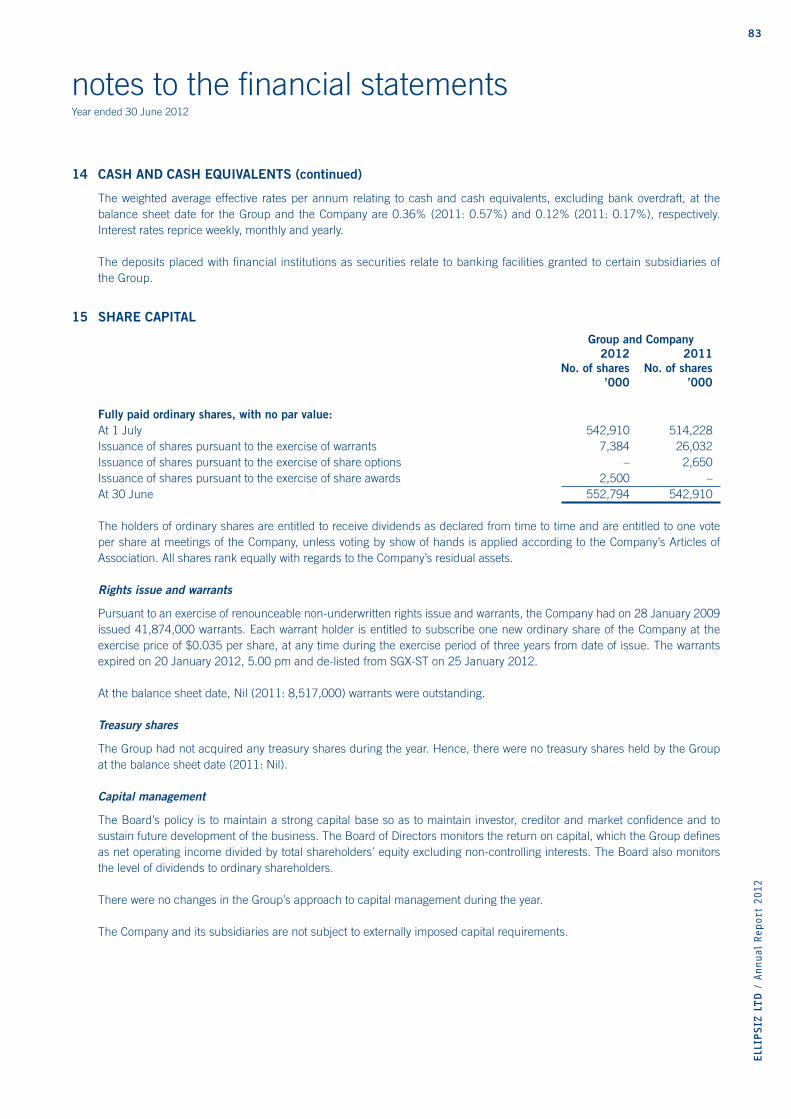
83
ELL
IPSIZ
LTD
/ A
nnual
Report
2012
notes to the fi nancial statementsYear ended 30 June 2012
14 CASH AND CASH EQUIVALENTS (continued)
The weighted average effective rates per annum relating to cash and cash equivalents, excluding bank overdraft, at the balance sheet date for the Group and the Company are 0.36% (2011: 0.57%) and 0.12% (2011: 0.17%), respectively. Interest rates reprice weekly, monthly and yearly.
The deposits placed with fi nancial institutions as securities relate to banking facilities granted to certain subsidiaries of the Group.
15 SHARE CAPITAL
Group and Company 2012 2011 No. of shares No. of shares ’000 ’000
Fully paid ordinary shares, with no par value:At 1 July 542,910 514,228Issuance of shares pursuant to the exercise of warrants 7,384 26,032Issuance of shares pursuant to the exercise of share options – 2,650Issuance of shares pursuant to the exercise of share awards 2,500 –At 30 June 552,794 542,910 The holders of ordinary shares are entitled to receive dividends as declared from time to time and are entitled to one vote per share at meetings of the Company, unless voting by show of hands is applied according to the Company’s Articles of Association. All shares rank equally with regards to the Company’s residual assets.
Rights issue and warrants
Pursuant to an exercise of renounceable non-underwritten rights issue and warrants, the Company had on 28 January 2009 issued 41,874,000 warrants. Each warrant holder is entitled to subscribe one new ordinary share of the Company at the exercise price of $0.035 per share, at any time during the exercise period of three years from date of issue. The warrants expired on 20 January 2012, 5.00 pm and de-listed from SGX-ST on 25 January 2012.
At the balance sheet date, Nil (2011: 8,517,000) warrants were outstanding.
Treasury shares
The Group had not acquired any treasury shares during the year. Hence, there were no treasury shares held by the Group at the balance sheet date (2011: Nil).
Capital management
The Board’s policy is to maintain a strong capital base so as to maintain investor, creditor and market confi dence and to sustain future development of the business. The Board of Directors monitors the return on capital, which the Group defi nes as net operating income divided by total shareholders’ equity excluding non-controlling interests. The Board also monitors the level of dividends to ordinary shareholders.
There were no changes in the Group’s approach to capital management during the year.
The Company and its subsidiaries are not subject to externally imposed capital requirements.
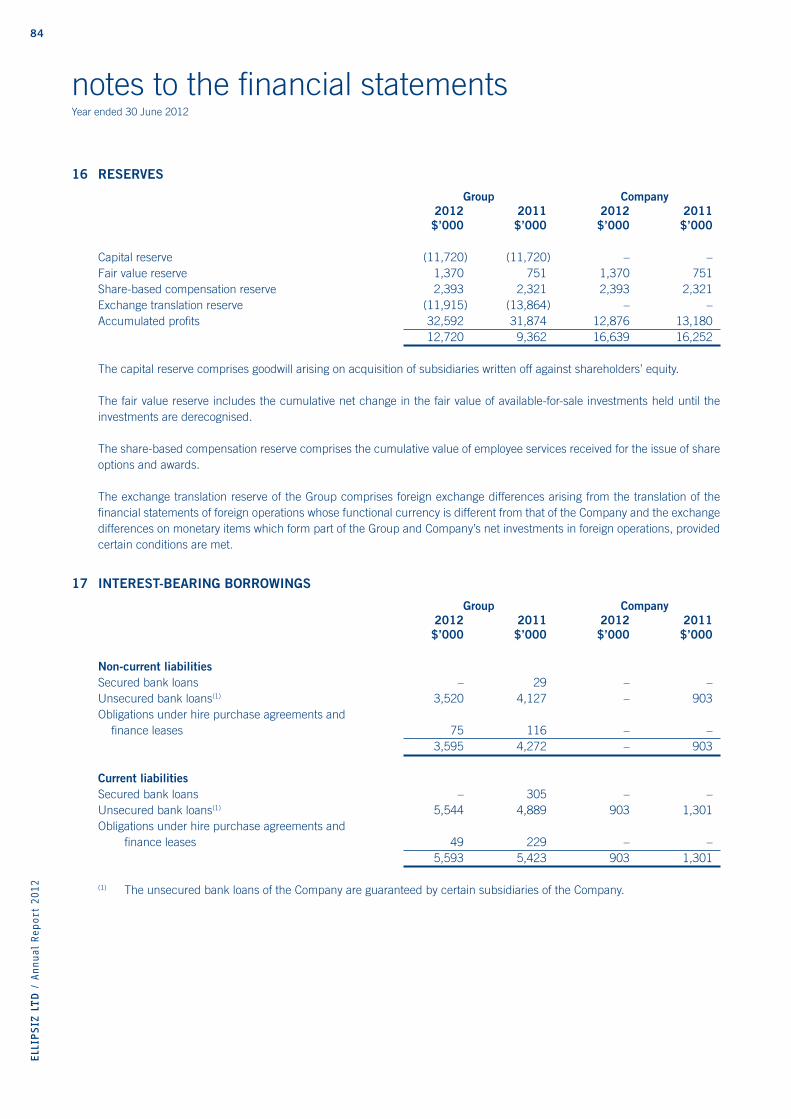
84ELL
IPSIZ
LTD
/ A
nnual
Report
2012
notes to the fi nancial statementsYear ended 30 June 2012
16 RESERVES
Group Company 2012 2011 2012 2011 $’000 $’000 $’000 $’000
Capital reserve (11,720) (11,720) – –Fair value reserve 1,370 751 1,370 751Share-based compensation reserve 2,393 2,321 2,393 2,321Exchange translation reserve (11,915) (13,864) – –Accumulated profi ts 32,592 31,874 12,876 13,180 12,720 9,362 16,639 16,252
The capital reserve comprises goodwill arising on acquisition of subsidiaries written off against shareholders’ equity.
The fair value reserve includes the cumulative net change in the fair value of available-for-sale investments held until the investments are derecognised.
The share-based compensation reserve comprises the cumulative value of employee services received for the issue of share options and awards.
The exchange translation reserve of the Group comprises foreign exchange differences arising from the translation of the fi nancial statements of foreign operations whose functional currency is different from that of the Company and the exchange differences on monetary items which form part of the Group and Company’s net investments in foreign operations, provided certain conditions are met.
17 INTEREST-BEARING BORROWINGS
Group Company 2012 2011 2012 2011 $’000 $’000 $’000 $’000
Non-current liabilitiesSecured bank loans – 29 – –Unsecured bank loans(1) 3,520 4,127 – 903Obligations under hire purchase agreements and fi nance leases 75 116 – – 3,595 4,272 – 903
Current liabilitiesSecured bank loans – 305 – –Unsecured bank loans(1) 5,544 4,889 903 1,301Obligations under hire purchase agreements and fi nance leases 49 229 – – 5,593 5,423 903 1,301
(1) The unsecured bank loans of the Company are guaranteed by certain subsidiaries of the Company.

85
ELL
IPSIZ
LTD
/ A
nnual
Report
2012
notes to the fi nancial statementsYear ended 30 June 2012
17 INTEREST-BEARING BORROWINGS (continued)
Maturity of liabilities (excluding fi nance lease liabilities)
Group Company 2012 2011 2012 2011 $’000 $’000 $’000 $’000
Within 1 year 5,544 5,194 903 1,301After 1 year but within 5 years 3,520 4,156 – 903 9,064 9,350 903 2,204
The borrowings are secured on the following assets:
Group Company Note 2012 2011 2012 2011 $’000 $’000 $’000 $’000
Leasehold land and building 3 – 1,518 – –Plant and machinery 3 – 589 – –Deposits with fi nancial institutions 14 1,755 1,684 – –Total carrying amount 1,755 3,791 – –
Obligations under hire purchase agreements and fi nance leases
2012 2011Group Principal Interest Payments Principal Interest Payments $’000 $’000 $’000 $’000 $’000 $’000
Payable within 1 year 49 7 56 229 13 242Payable after 1 year but within 5 years 75 5 80 116 22 138Total 124 12 136 345 35 380
Terms and debt repayment schedule
Terms and conditions of outstanding loans and borrowings are as follows:
Nominal Financial interest year of 2012 2011 rate maturity $’000 $’000
GroupS$ fi xed rate loans 1.94% to 5.75% 2011 to 2013 2,616 3,919US$ fi xed rate loans 1.25% to 7.50% 2011 to 2013 1,346 1,148MYR fi xed rate loans 4.45% to 5.66% 2011 to 2013 1,354 1,384INR fi xed rate loans 12.75% to 13.00% 2013 247 –NTD fl oating rate loan 2.75% + bank’s cost of fund 2014 3,501 2,899S$ fi nance lease liabilities 3.50% 2012 – 60US$ fi nance lease liabilities 5.50% to 7.70% 2011 to 2012 – 116MYR fi nance lease liability 4.00% 2015 116 149NTD fi nance lease liability 7.04% 2013 8 20 9,188 9,695
CompanyS$ fi xed rate loan 5.00% 2013 903 2,204
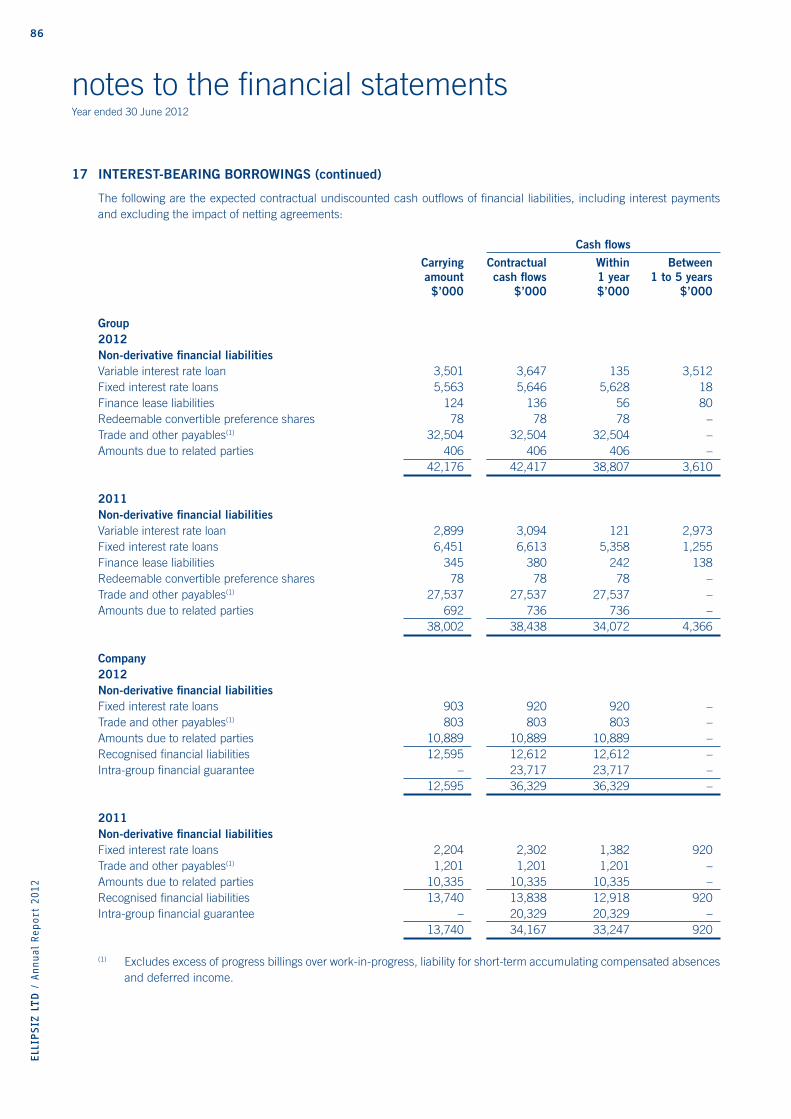
86ELL
IPSIZ
LTD
/ A
nnual
Report
2012
notes to the fi nancial statementsYear ended 30 June 2012
17 INTEREST-BEARING BORROWINGS (continued)
The following are the expected contractual undiscounted cash outfl ows of fi nancial liabilities, including interest payments and excluding the impact of netting agreements:
Cash fl ows
Carrying Contractual Within Between amount cash fl ows 1 year 1 to 5 years $’000 $’000 $’000 $’000
Group2012Non-derivative fi nancial liabilitiesVariable interest rate loan 3,501 3,647 135 3,512Fixed interest rate loans 5,563 5,646 5,628 18Finance lease liabilities 124 136 56 80Redeemable convertible preference shares 78 78 78 –Trade and other payables(1) 32,504 32,504 32,504 –Amounts due to related parties 406 406 406 – 42,176 42,417 38,807 3,610
2011Non-derivative fi nancial liabilitiesVariable interest rate loan 2,899 3,094 121 2,973Fixed interest rate loans 6,451 6,613 5,358 1,255Finance lease liabilities 345 380 242 138Redeemable convertible preference shares 78 78 78 –Trade and other payables(1) 27,537 27,537 27,537 –Amounts due to related parties 692 736 736 – 38,002 38,438 34,072 4,366
Company2012Non-derivative fi nancial liabilitiesFixed interest rate loans 903 920 920 –Trade and other payables(1) 803 803 803 –Amounts due to related parties 10,889 10,889 10,889 –Recognised fi nancial liabilities 12,595 12,612 12,612 –Intra-group fi nancial guarantee – 23,717 23,717 – 12,595 36,329 36,329 –
2011Non-derivative fi nancial liabilitiesFixed interest rate loans 2,204 2,302 1,382 920Trade and other payables(1) 1,201 1,201 1,201 –Amounts due to related parties 10,335 10,335 10,335 –Recognised fi nancial liabilities 13,740 13,838 12,918 920Intra-group fi nancial guarantee – 20,329 20,329 – 13,740 34,167 33,247 920
(1) Excludes excess of progress billings over work-in-progress, liability for short-term accumulating compensated absences and deferred income.
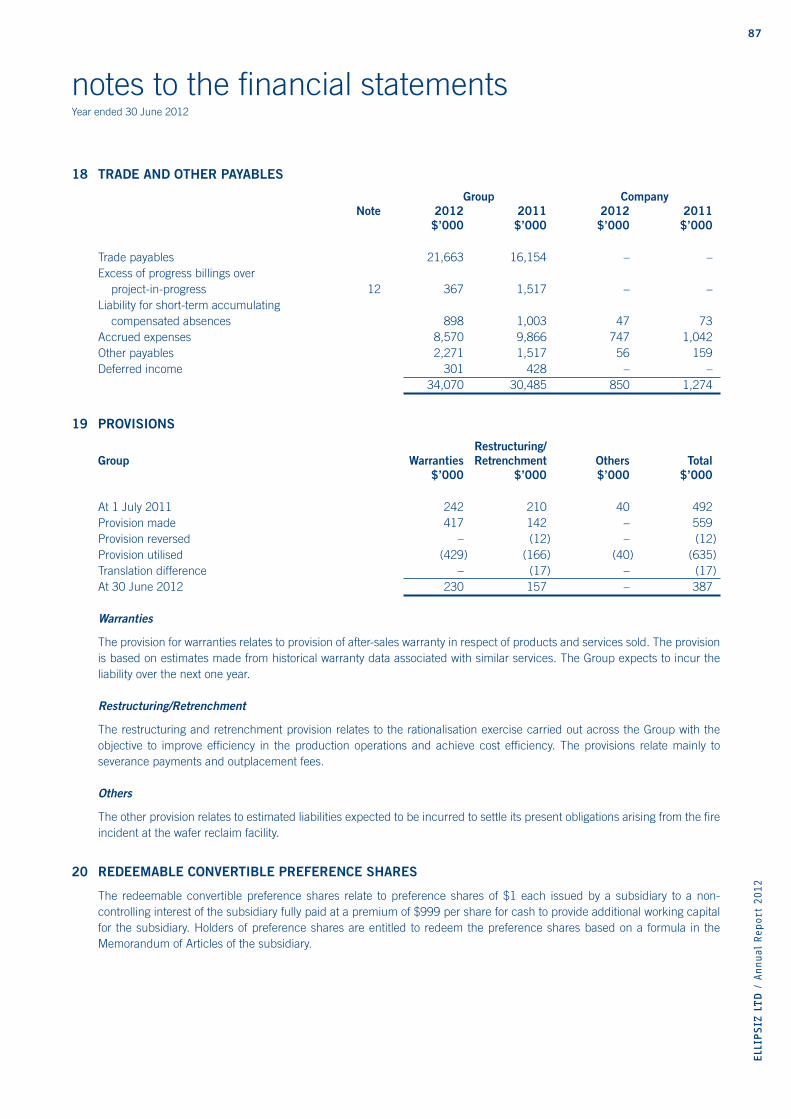
87
ELL
IPSIZ
LTD
/ A
nnual
Report
2012
notes to the fi nancial statementsYear ended 30 June 2012
18 TRADE AND OTHER PAYABLES
Group Company Note 2012 2011 2012 2011 $’000 $’000 $’000 $’000
Trade payables 21,663 16,154 – –Excess of progress billings over project-in-progress 12 367 1,517 – –Liability for short-term accumulating compensated absences 898 1,003 47 73Accrued expenses 8,570 9,866 747 1,042Other payables 2,271 1,517 56 159Deferred income 301 428 – – 34,070 30,485 850 1,274
19 PROVISIONS
Restructuring/Group Warranties Retrenchment Others Total $’000 $’000 $’000 $’000
At 1 July 2011 242 210 40 492Provision made 417 142 – 559Provision reversed – (12) – (12)Provision utilised (429) (166) (40) (635)Translation difference – (17) – (17)At 30 June 2012 230 157 – 387
Warranties
The provision for warranties relates to provision of after-sales warranty in respect of products and services sold. The provision is based on estimates made from historical warranty data associated with similar services. The Group expects to incur the liability over the next one year.
Restructuring/Retrenchment
The restructuring and retrenchment provision relates to the rationalisation exercise carried out across the Group with the objective to improve effi ciency in the production operations and achieve cost effi ciency. The provisions relate mainly to severance payments and outplacement fees.
Others
The other provision relates to estimated liabilities expected to be incurred to settle its present obligations arising from the fi re incident at the wafer reclaim facility.
20 REDEEMABLE CONVERTIBLE PREFERENCE SHARES
The redeemable convertible preference shares relate to preference shares of $1 each issued by a subsidiary to a non-controlling interest of the subsidiary fully paid at a premium of $999 per share for cash to provide additional working capital for the subsidiary. Holders of preference shares are entitled to redeem the preference shares based on a formula in the Memorandum of Articles of the subsidiary.
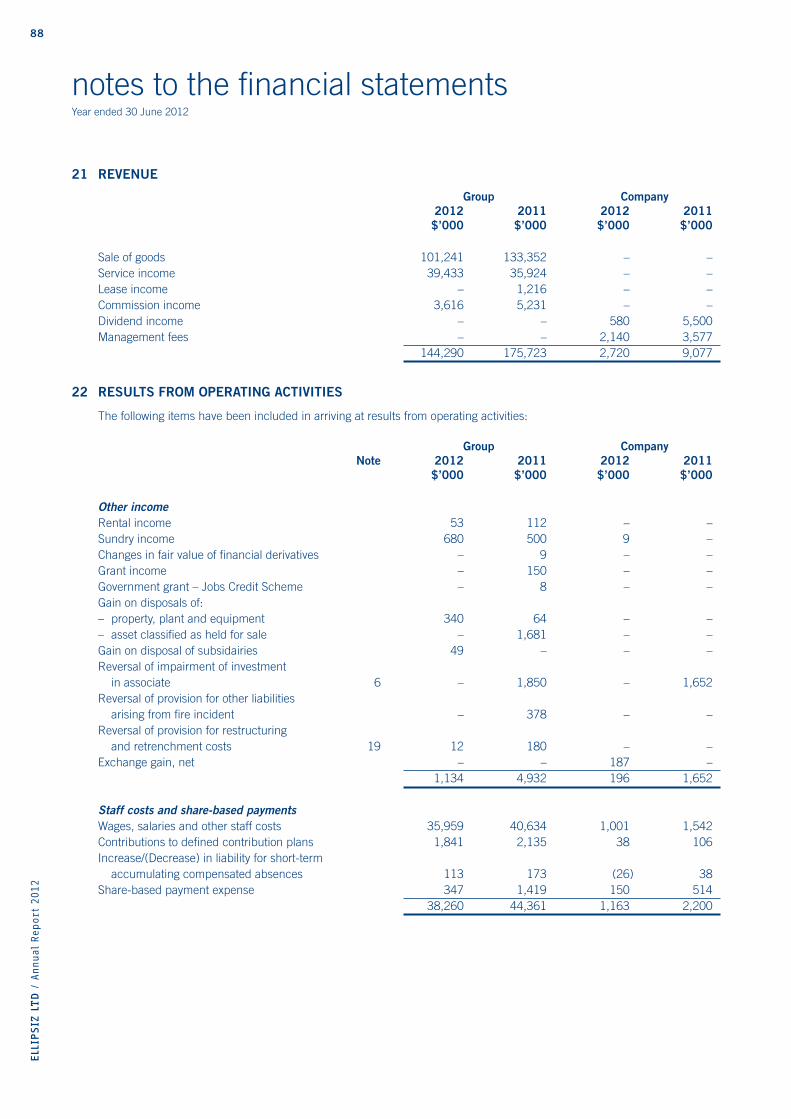
88ELL
IPSIZ
LTD
/ A
nnual
Report
2012
notes to the fi nancial statementsYear ended 30 June 2012
21 REVENUE
Group Company 2012 2011 2012 2011 $’000 $’000 $’000 $’000
Sale of goods 101,241 133,352 – –Service income 39,433 35,924 – –Lease income – 1,216 – –Commission income 3,616 5,231 – –Dividend income – – 580 5,500Management fees – – 2,140 3,577 144,290 175,723 2,720 9,077
22 RESULTS FROM OPERATING ACTIVITIES
The following items have been included in arriving at results from operating activities:
Group Company Note 2012 2011 2012 2011 $’000 $’000 $’000 $’000
Other incomeRental income 53 112 – –Sundry income 680 500 9 –Changes in fair value of fi nancial derivatives – 9 – –Grant income – 150 – –Government grant – Jobs Credit Scheme – 8 – –Gain on disposals of: – property, plant and equipment 340 64 – –– asset classifi ed as held for sale – 1,681 – –Gain on disposal of subsidairies 49 – – –Reversal of impairment of investment in associate 6 – 1,850 – 1,652Reversal of provision for other liabilities arising from fi re incident – 378 – –Reversal of provision for restructuring and retrenchment costs 19 12 180 – –Exchange gain, net – – 187 – 1,134 4,932 196 1,652
Staff costs and share-based paymentsWages, salaries and other staff costs 35,959 40,634 1,001 1,542Contributions to defi ned contribution plans 1,841 2,135 38 106Increase/(Decrease) in liability for short-term accumulating compensated absences 113 173 (26) 38Share-based payment expense 347 1,419 150 514 38,260 44,361 1,163 2,200
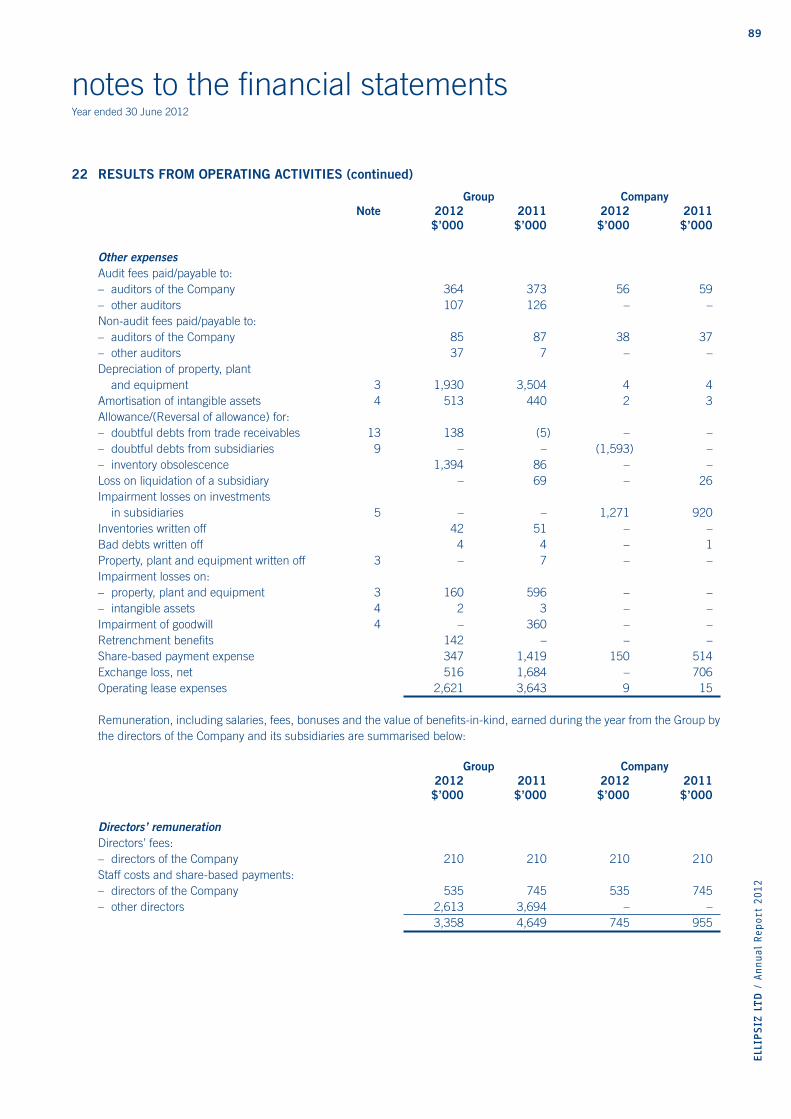
89
ELL
IPSIZ
LTD
/ A
nnual
Report
2012
notes to the fi nancial statementsYear ended 30 June 2012
22 RESULTS FROM OPERATING ACTIVITIES (continued)
Group Company Note 2012 2011 2012 2011 $’000 $’000 $’000 $’000
Other expensesAudit fees paid/payable to:– auditors of the Company 364 373 56 59– other auditors 107 126 – –Non-audit fees paid/payable to: – auditors of the Company 85 87 38 37– other auditors 37 7 – –Depreciation of property, plant and equipment 3 1,930 3,504 4 4Amortisation of intangible assets 4 513 440 2 3Allowance/(Reversal of allowance) for:– doubtful debts from trade receivables 13 138 (5) – –– doubtful debts from subsidiaries 9 – – (1,593) –– inventory obsolescence 1,394 86 – –Loss on liquidation of a subsidiary – 69 – 26Impairment losses on investments in subsidiaries 5 – – 1,271 920Inventories written off 42 51 – –Bad debts written off 4 4 – 1Property, plant and equipment written off 3 – 7 – –Impairment losses on:– property, plant and equipment 3 160 596 – –– intangible assets 4 2 3 – –Impairment of goodwill 4 – 360 – –Retrenchment benefi ts 142 – – –Share-based payment expense 347 1,419 150 514Exchange loss, net 516 1,684 – 706Operating lease expenses 2,621 3,643 9 15
Remuneration, including salaries, fees, bonuses and the value of benefi ts-in-kind, earned during the year from the Group by the directors of the Company and its subsidiaries are summarised below:
Group Company 2012 2011 2012 2011 $’000 $’000 $’000 $’000
Directors’ remunerationDirectors’ fees:– directors of the Company 210 210 210 210Staff costs and share-based payments:– directors of the Company 535 745 535 745– other directors 2,613 3,694 – – 3,358 4,649 745 955
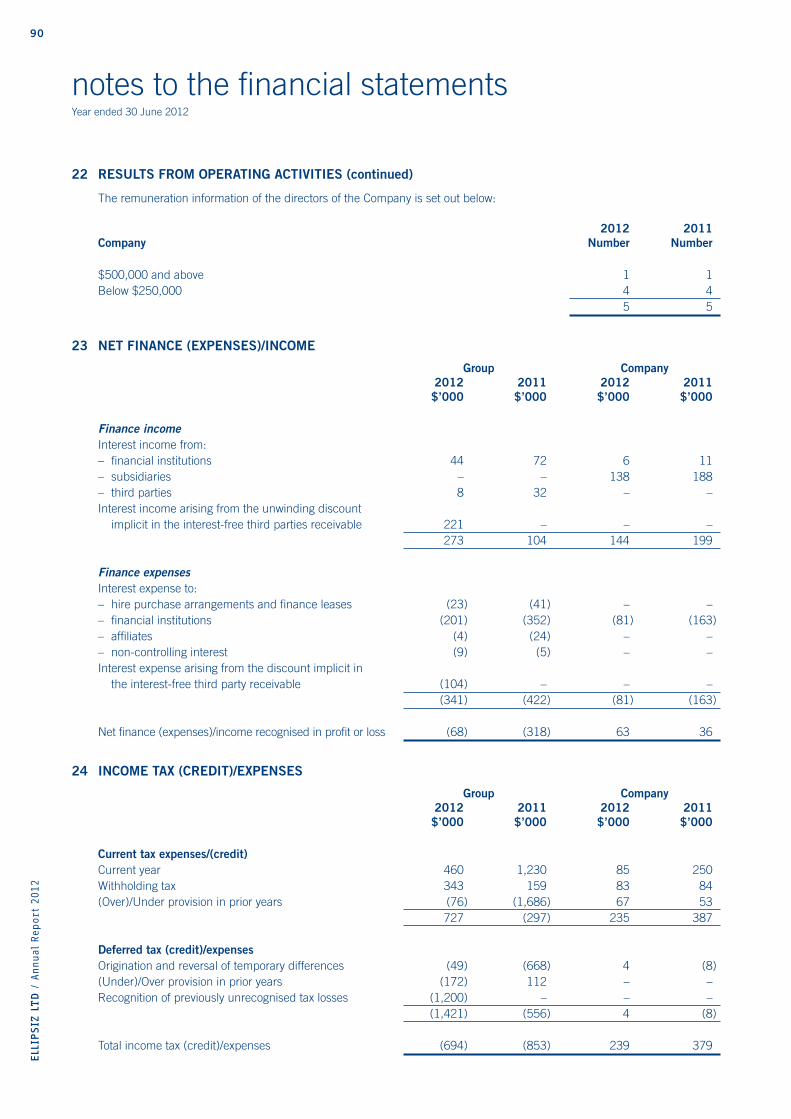
90ELL
IPSIZ
LTD
/ A
nnual
Report
2012
notes to the fi nancial statementsYear ended 30 June 2012
22 RESULTS FROM OPERATING ACTIVITIES (continued)
The remuneration information of the directors of the Company is set out below:
2012 2011Company Number Number
$500,000 and above 1 1Below $250,000 4 4 5 5
23 NET FINANCE (EXPENSES)/INCOME
Group Company 2012 2011 2012 2011 $’000 $’000 $’000 $’000
Finance incomeInterest income from:– fi nancial institutions 44 72 6 11– subsidiaries – – 138 188– third parties 8 32 – –Interest income arising from the unwinding discount implicit in the interest-free third parties receivable 221 – – – 273 104 144 199
Finance expensesInterest expense to:– hire purchase arrangements and fi nance leases (23) (41) – –– fi nancial institutions (201) (352) (81) (163)– affi liates (4) (24) – –– non-controlling interest (9) (5) – –Interest expense arising from the discount implicit in the interest-free third party receivable (104) – – – (341) (422) (81) (163) Net fi nance (expenses)/income recognised in profi t or loss (68) (318) 63 36
24 INCOME TAX (CREDIT)/EXPENSES
Group Company 2012 2011 2012 2011 $’000 $’000 $’000 $’000
Current tax expenses/(credit)Current year 460 1,230 85 250Withholding tax 343 159 83 84(Over)/Under provision in prior years (76) (1,686) 67 53 727 (297) 235 387
Deferred tax (credit)/expensesOrigination and reversal of temporary differences (49) (668) 4 (8)(Under)/Over provision in prior years (172) 112 – –Recognition of previously unrecognised tax losses (1,200) – – – (1,421) (556) 4 (8)
Total income tax (credit)/expenses (694) (853) 239 379
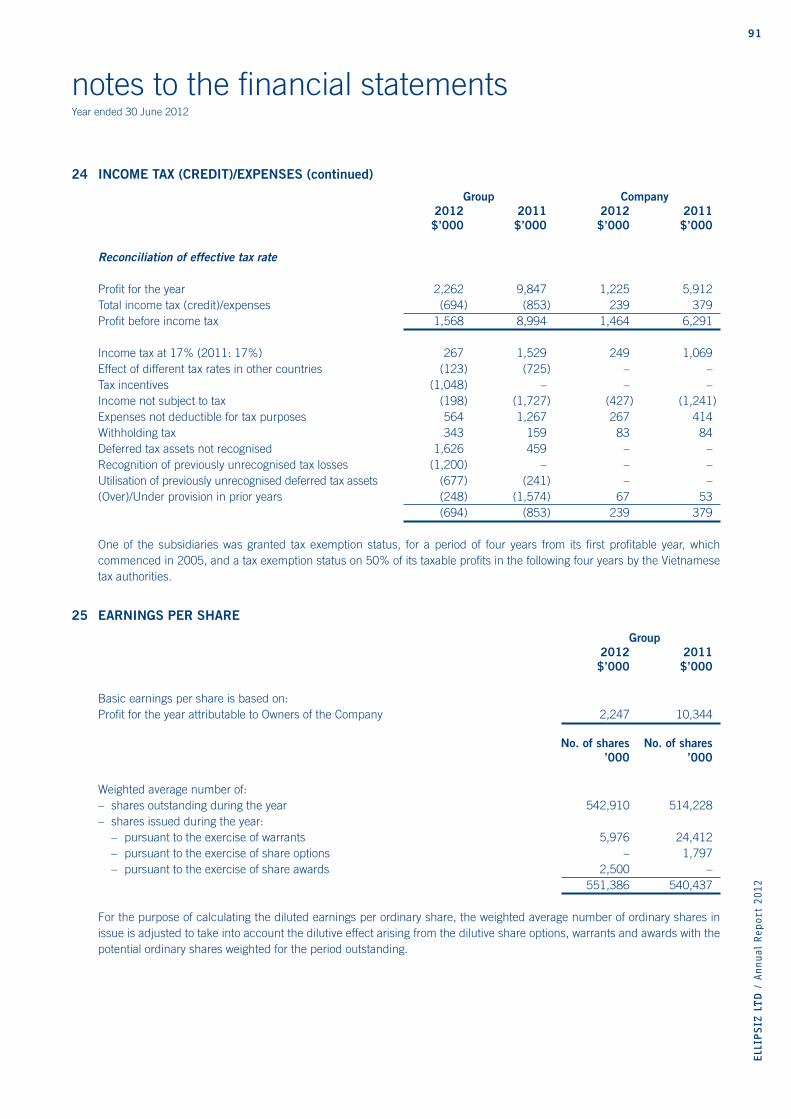
91
ELL
IPSIZ
LTD
/ A
nnual
Report
2012
notes to the fi nancial statementsYear ended 30 June 2012
24 INCOME TAX (CREDIT)/EXPENSES (continued)
Group Company 2012 2011 2012 2011 $’000 $’000 $’000 $’000
Reconciliation of effective tax rate
Profi t for the year 2,262 9,847 1,225 5,912Total income tax (credit)/expenses (694) (853) 239 379Profi t before income tax 1,568 8,994 1,464 6,291
Income tax at 17% (2011: 17%) 267 1,529 249 1,069Effect of different tax rates in other countries (123) (725) – –Tax incentives (1,048) – – –Income not subject to tax (198) (1,727) (427) (1,241)Expenses not deductible for tax purposes 564 1,267 267 414Withholding tax 343 159 83 84Deferred tax assets not recognised 1,626 459 – –Recognition of previously unrecognised tax losses (1,200) – – –Utilisation of previously unrecognised deferred tax assets (677) (241) – –(Over)/Under provision in prior years (248) (1,574) 67 53 (694) (853) 239 379
One of the subsidiaries was granted tax exemption status, for a period of four years from its fi rst profi table year, which commenced in 2005, and a tax exemption status on 50% of its taxable profi ts in the following four years by the Vietnamese tax authorities.
25 EARNINGS PER SHARE
Group 2012 2011 $’000 $’000
Basic earnings per share is based on:Profi t for the year attributable to Owners of the Company 2,247 10,344
No. of shares No. of shares ’000 ’000
Weighted average number of:– shares outstanding during the year 542,910 514,228– shares issued during the year: – pursuant to the exercise of warrants 5,976 24,412 – pursuant to the exercise of share options – 1,797 – pursuant to the exercise of share awards 2,500 – 551,386 540,437
For the purpose of calculating the diluted earnings per ordinary share, the weighted average number of ordinary shares in issue is adjusted to take into account the dilutive effect arising from the dilutive share options, warrants and awards with the potential ordinary shares weighted for the period outstanding.
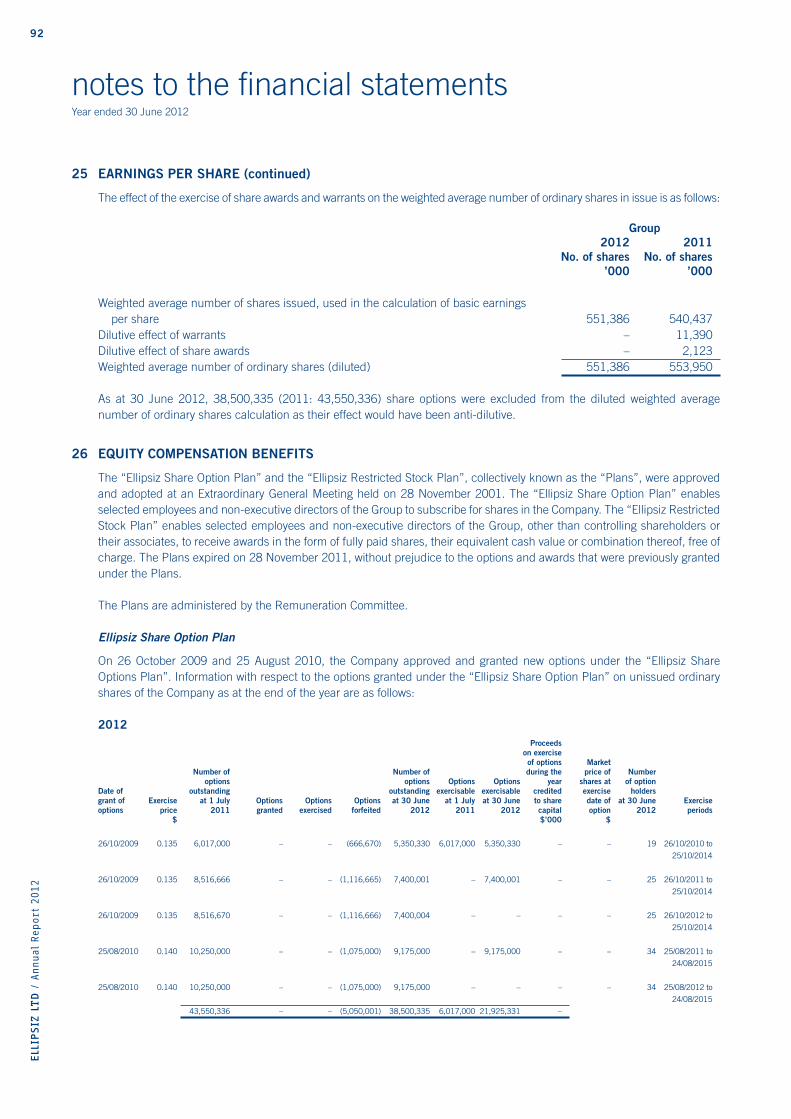
92ELL
IPSIZ
LTD
/ A
nnual
Report
2012
notes to the fi nancial statementsYear ended 30 June 2012
25 EARNINGS PER SHARE (continued)
The effect of the exercise of share awards and warrants on the weighted average number of ordinary shares in issue is as follows:
Group 2012 2011 No. of shares No. of shares ’000 ’000
Weighted average number of shares issued, used in the calculation of basic earnings per share 551,386 540,437Dilutive effect of warrants – 11,390Dilutive effect of share awards – 2,123Weighted average number of ordinary shares (diluted) 551,386 553,950
As at 30 June 2012, 38,500,335 (2011: 43,550,336) share options were excluded from the diluted weighted average number of ordinary shares calculation as their effect would have been anti-dilutive.
26 EQUITY COMPENSATION BENEFITS
The “Ellipsiz Share Option Plan” and the “Ellipsiz Restricted Stock Plan”, collectively known as the “Plans”, were approved and adopted at an Extraordinary General Meeting held on 28 November 2001. The “Ellipsiz Share Option Plan” enables selected employees and non-executive directors of the Group to subscribe for shares in the Company. The “Ellipsiz Restricted Stock Plan” enables selected employees and non-executive directors of the Group, other than controlling shareholders or their associates, to receive awards in the form of fully paid shares, their equivalent cash value or combination thereof, free of charge. The Plans expired on 28 November 2011, without prejudice to the options and awards that were previously granted under the Plans.
The Plans are administered by the Remuneration Committee.
Ellipsiz Share Option Plan
On 26 October 2009 and 25 August 2010, the Company approved and granted new options under the “Ellipsiz Share Options Plan”. Information with respect to the options granted under the “Ellipsiz Share Option Plan” on unissued ordinary shares of the Company as at the end of the year are as follows:
2012 Proceeds on exercise of options Market Number of Number of during the price of Number options options Options Options year shares at of optionDate of outstanding outstanding exercisable exercisable credited exercise holdersgrant of Exercise at 1 July Options Options Options at 30 June at 1 July at 30 June to share date of at 30 June Exerciseoptions price 2011 granted exercised forfeited 2012 2011 2012 capital option 2012 periods $ $’000 $
26/10/2009 0.135 6,017,000 – – (666,670) 5,350,330 6,017,000 5,350,330 – – 19 26/10/2010 to
25/10/2014
26/10/2009 0.135 8,516,666 – – (1,116,665) 7,400,001 – 7,400,001 – – 25 26/10/2011 to
25/10/2014
26/10/2009 0.135 8,516,670 – – (1,116,666) 7,400,004 – – – – 25 26/10/2012 to
25/10/2014
25/08/2010 0.140 10,250,000 – – (1,075,000) 9,175,000 – 9,175,000 – – 34 25/08/2011 to
24/08/2015
25/08/2010 0.140 10,250,000 – – (1,075,000) 9,175,000 – – – – 34 25/08/2012 to
24/08/2015
43,550,336 – – (5,050,001) 38,500,335 6,017,000 21,925,331 –

93
ELL
IPSIZ
LTD
/ A
nnual
Report
2012
notes to the fi nancial statementsYear ended 30 June 2012
26 EQUITY COMPENSATION BENEFITS (continued)
2011 Proceeds on exercise of options Market Number of Number of during the price of Number options options Options Options year shares at of optionDate of outstanding outstanding exercisable exercisable credited exercise holdersgrant of Exercise at 1 July Options Options Options at 30 June at 1 July at 30 June to share date of at 30 June Exerciseoptions price 2010 granted exercised forfeited 2011 2010 2011 capital option 2011 periods $ $’000 $
26/10/2009 0.135 8,766,664 – (2,649,664) (100,000) 6,017,000 – 6,017,000 358 0.15 to 23 26/10/2010 to
0.165 25/10/2014
26/10/2009 0.135 8,766,666 – – (250,000) 8,516,666 – – – – 32 26/10/2011 to
25/10/2014
26/10/2009 0.135 8,766,670 – – (250,000) 8,516,670 – – – – 32 26/10/2012 to
25/10/2014
25/08/2010 0.140 – 10,250,000 – – 10,250,000 – – – – 41 25/08/2011 to
24/08/2015
25/08/2010 0.140 – 10,250,000 – – 10,250,000 – – – – 41 25/08/2012 to
24/08/2015
26,300,000 20,500,000 (2,649,664) (600,000) 43,550,336 – 6,017,000 358
The fair value of services received in return for share options granted are measured by reference to the fair value of share options granted. The estimate of the fair value of the services received is measured based on a Black-Scholes model. The expected life used in the model has been adjusted, based on management’s best estimate, for the effects of non-transferability, exercise restrictions and behavioural considerations.
Fair value of share options and assumptions
26 October 26 October 26 October 25 August 25 AugustDate of vesting of options 2010 2011 2012 2011 2012
Fair value at measurement date $0.044 $0.054 $0.062 $0.041 $0.048
Share price based on volume-weighted average share price on grant date $0.125 $0.125 $0.125 $0.150 $0.150Exercise price at grant date $0.135 $0.135 $0.135 $0.140 $0.140Expected volatility 68.08% 68.08% 68.08% 48.23% 48.23%Expected option life 2.0 years 3.0 years 4.0 years 2.0 years 3.0 yearsExpected dividend yield 0.00% 0.00% 0.00% 1.87% 1.87%Risk-free interest rate 0.74% 0.92% 1.25% 0.74% 0.92%
The expected volatility is based on the historic volatility (calculated based on the weighted average expected life of the share options), adjusted for any expected changes to future volatility due to publicly available information.
There are no market conditions associated with the share option grants. Service conditions and non-market performance conditions are not taken into account in the measurement of the fair value of the services to be received at the grant date.
Ellipsiz Restricted Stock Plan
On 25 August 2010, 2,500,000 new share awards under the Ellipsiz Restricted Stock Plan (“ERSP”) were granted by the Company to qualifi ed directors and employees. The awards vested on 30 June 2011 and were allotted on 1 July 2011. At the balance sheet date, there were Nil (2011: 2,500,000) outstanding awards and the number of outstanding award holders was Nil (2011: 10).
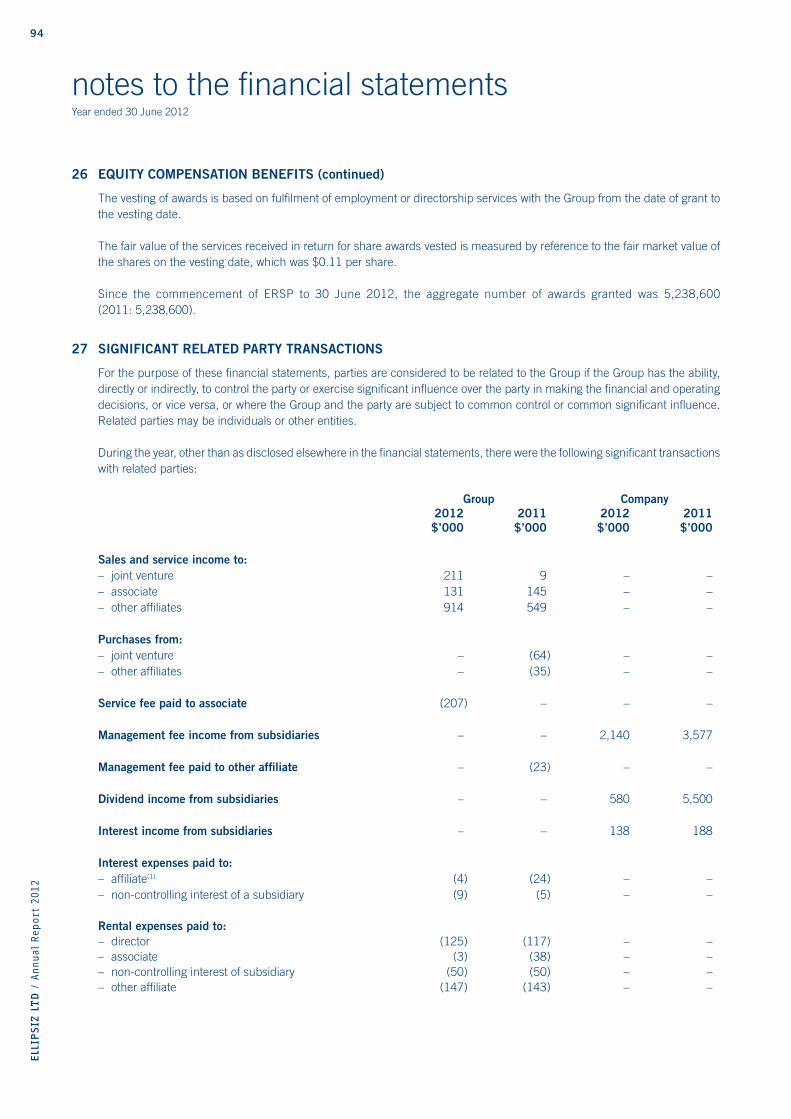
94ELL
IPSIZ
LTD
/ A
nnual
Report
2012
notes to the fi nancial statementsYear ended 30 June 2012
26 EQUITY COMPENSATION BENEFITS (continued)
The vesting of awards is based on fulfi lment of employment or directorship services with the Group from the date of grant to the vesting date.
The fair value of the services received in return for share awards vested is measured by reference to the fair market value of the shares on the vesting date, which was $0.11 per share.
Since the commencement of ERSP to 30 June 2012, the aggregate number of awards granted was 5,238,600 (2011: 5,238,600).
27 SIGNIFICANT RELATED PARTY TRANSACTIONS
For the purpose of these fi nancial statements, parties are considered to be related to the Group if the Group has the ability, directly or indirectly, to control the party or exercise signifi cant infl uence over the party in making the fi nancial and operating decisions, or vice versa, or where the Group and the party are subject to common control or common signifi cant infl uence. Related parties may be individuals or other entities.
During the year, other than as disclosed elsewhere in the fi nancial statements, there were the following signifi cant transactions with related parties:
Group Company 2012 2011 2012 2011 $’000 $’000 $’000 $’000
Sales and service income to:– joint venture 211 9 – –– associate 131 145 – –– other affi liates 914 549 – –
Purchases from:– joint venture – (64) – –– other affi liates – (35) – –
Service fee paid to associate (207) – – –
Management fee income from subsidiaries – – 2,140 3,577
Management fee paid to other affi liate – (23) – –
Dividend income from subsidiaries – – 580 5,500
Interest income from subsidiaries – – 138 188
Interest expenses paid to:– affi liate(1) (4) (24) – –– non-controlling interest of a subsidiary (9) (5) – –
Rental expenses paid to:– director (125) (117) – –– associate (3) (38) – –– non-controlling interest of subsidiary (50) (50) – –– other affi liate (147) (143) – –
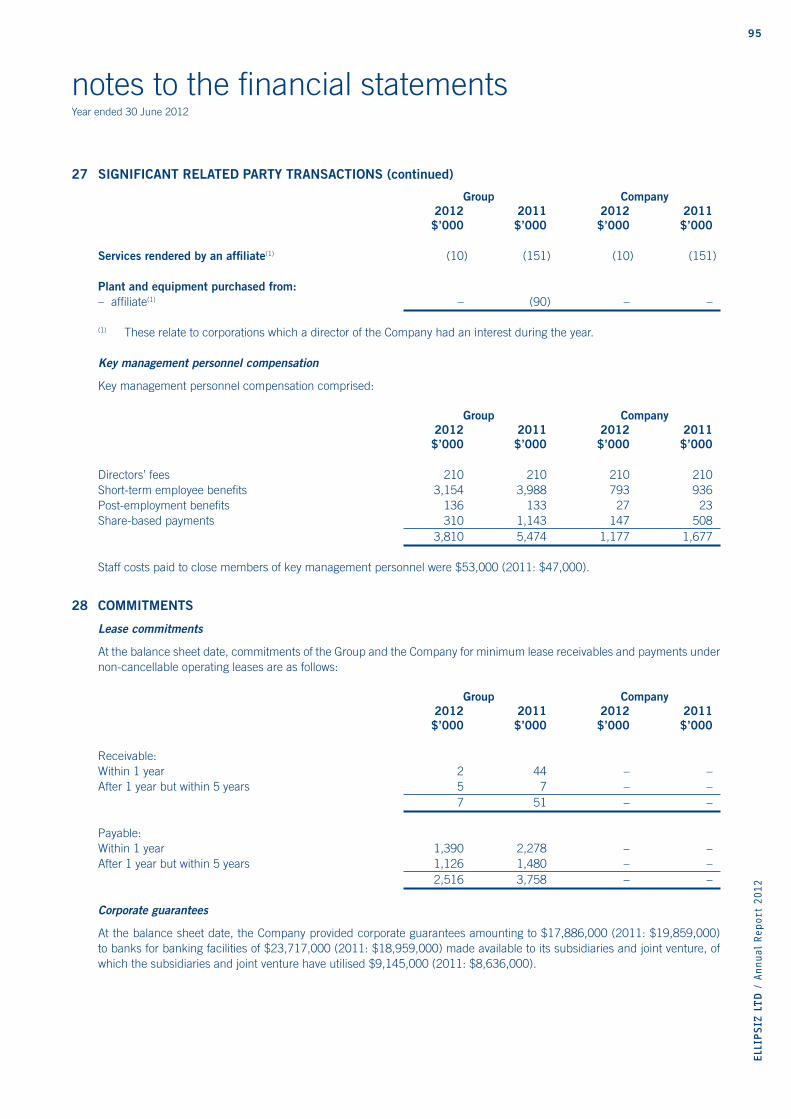
95
ELL
IPSIZ
LTD
/ A
nnual
Report
2012
notes to the fi nancial statementsYear ended 30 June 2012
27 SIGNIFICANT RELATED PARTY TRANSACTIONS (continued)
Group Company 2012 2011 2012 2011 $’000 $’000 $’000 $’000
Services rendered by an affi liate(1) (10) (151) (10) (151)
Plant and equipment purchased from:– affi liate(1) – (90) – –
(1) These relate to corporations which a director of the Company had an interest during the year.
Key management personnel compensation
Key management personnel compensation comprised:
Group Company 2012 2011 2012 2011 $’000 $’000 $’000 $’000
Directors’ fees 210 210 210 210Short-term employee benefi ts 3,154 3,988 793 936Post-employment benefi ts 136 133 27 23Share-based payments 310 1,143 147 508 3,810 5,474 1,177 1,677
Staff costs paid to close members of key management personnel were $53,000 (2011: $47,000).
28 COMMITMENTS
Lease commitments
At the balance sheet date, commitments of the Group and the Company for minimum lease receivables and payments under non-cancellable operating leases are as follows:
Group Company 2012 2011 2012 2011 $’000 $’000 $’000 $’000
Receivable:Within 1 year 2 44 – –After 1 year but within 5 years 5 7 – – 7 51 – –
Payable:Within 1 year 1,390 2,278 – –After 1 year but within 5 years 1,126 1,480 – – 2,516 3,758 – –
Corporate guarantees
At the balance sheet date, the Company provided corporate guarantees amounting to $17,886,000 (2011: $19,859,000) to banks for banking facilities of $23,717,000 (2011: $18,959,000) made available to its subsidiaries and joint venture, of which the subsidiaries and joint venture have utilised $9,145,000 (2011: $8,636,000).
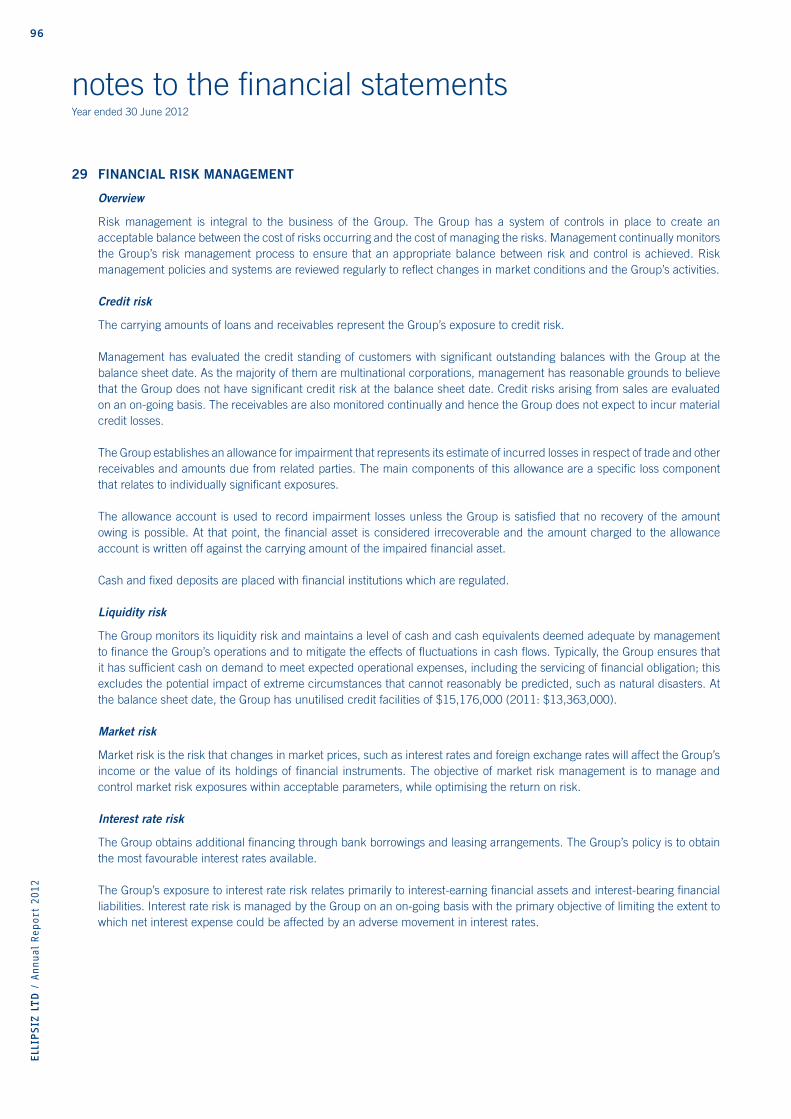
96ELL
IPSIZ
LTD
/ A
nnual
Report
2012
notes to the fi nancial statementsYear ended 30 June 2012
29 FINANCIAL RISK MANAGEMENT
Overview
Risk management is integral to the business of the Group. The Group has a system of controls in place to create an acceptable balance between the cost of risks occurring and the cost of managing the risks. Management continually monitors the Group’s risk management process to ensure that an appropriate balance between risk and control is achieved. Risk management policies and systems are reviewed regularly to refl ect changes in market conditions and the Group’s activities.
Credit risk
The carrying amounts of loans and receivables represent the Group’s exposure to credit risk.
Management has evaluated the credit standing of customers with signifi cant outstanding balances with the Group at the balance sheet date. As the majority of them are multinational corporations, management has reasonable grounds to believe that the Group does not have signifi cant credit risk at the balance sheet date. Credit risks arising from sales are evaluated on an on-going basis. The receivables are also monitored continually and hence the Group does not expect to incur material credit losses.
The Group establishes an allowance for impairment that represents its estimate of incurred losses in respect of trade and other receivables and amounts due from related parties. The main components of this allowance are a specifi c loss component that relates to individually signifi cant exposures.
The allowance account is used to record impairment losses unless the Group is satisfi ed that no recovery of the amount owing is possible. At that point, the fi nancial asset is considered irrecoverable and the amount charged to the allowance account is written off against the carrying amount of the impaired fi nancial asset.
Cash and fi xed deposits are placed with fi nancial institutions which are regulated.
Liquidity risk
The Group monitors its liquidity risk and maintains a level of cash and cash equivalents deemed adequate by management to fi nance the Group’s operations and to mitigate the effects of fl uctuations in cash fl ows. Typically, the Group ensures that it has suffi cient cash on demand to meet expected operational expenses, including the servicing of fi nancial obligation; this excludes the potential impact of extreme circumstances that cannot reasonably be predicted, such as natural disasters. At the balance sheet date, the Group has unutilised credit facilities of $15,176,000 (2011: $13,363,000).
Market risk
Market risk is the risk that changes in market prices, such as interest rates and foreign exchange rates will affect the Group’s income or the value of its holdings of fi nancial instruments. The objective of market risk management is to manage and control market risk exposures within acceptable parameters, while optimising the return on risk.
Interest rate risk
The Group obtains additional fi nancing through bank borrowings and leasing arrangements. The Group’s policy is to obtain the most favourable interest rates available.
The Group’s exposure to interest rate risk relates primarily to interest-earning fi nancial assets and interest-bearing fi nancial liabilities. Interest rate risk is managed by the Group on an on-going basis with the primary objective of limiting the extent to which net interest expense could be affected by an adverse movement in interest rates.
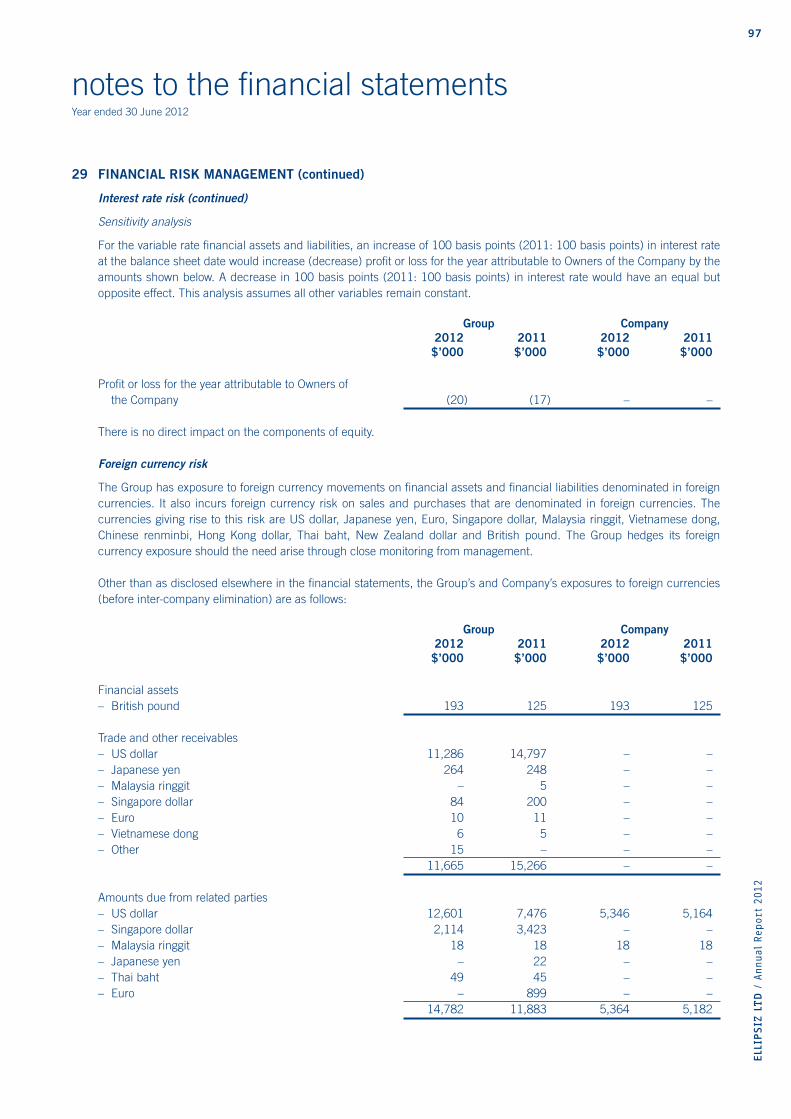
97
ELL
IPSIZ
LTD
/ A
nnual
Report
2012
notes to the fi nancial statementsYear ended 30 June 2012
29 FINANCIAL RISK MANAGEMENT (continued)
Interest rate risk (continued)
Sensitivity analysis
For the variable rate fi nancial assets and liabilities, an increase of 100 basis points (2011: 100 basis points) in interest rate at the balance sheet date would increase (decrease) profi t or loss for the year attributable to Owners of the Company by the amounts shown below. A decrease in 100 basis points (2011: 100 basis points) in interest rate would have an equal but opposite effect. This analysis assumes all other variables remain constant.
Group Company 2012 2011 2012 2011 $’000 $’000 $’000 $’000
Profi t or loss for the year attributable to Owners of the Company (20) (17) – –
There is no direct impact on the components of equity.
Foreign currency risk
The Group has exposure to foreign currency movements on fi nancial assets and fi nancial liabilities denominated in foreign currencies. It also incurs foreign currency risk on sales and purchases that are denominated in foreign currencies. The currencies giving rise to this risk are US dollar, Japanese yen, Euro, Singapore dollar, Malaysia ringgit, Vietnamese dong, Chinese renminbi, Hong Kong dollar, Thai baht, New Zealand dollar and British pound. The Group hedges its foreign currency exposure should the need arise through close monitoring from management.
Other than as disclosed elsewhere in the fi nancial statements, the Group’s and Company’s exposures to foreign currencies (before inter-company elimination) are as follows:
Group Company 2012 2011 2012 2011 $’000 $’000 $’000 $’000
Financial assets– British pound 193 125 193 125
Trade and other receivables– US dollar 11,286 14,797 – –– Japanese yen 264 248 – –– Malaysia ringgit – 5 – –– Singapore dollar 84 200 – –– Euro 10 11 – –– Vietnamese dong 6 5 – –– Other 15 – – – 11,665 15,266 – –
Amounts due from related parties– US dollar 12,601 7,476 5,346 5,164– Singapore dollar 2,114 3,423 – –– Malaysia ringgit 18 18 18 18– Japanese yen – 22 – –– Thai baht 49 45 – –– Euro – 899 – – 14,782 11,883 5,364 5,182
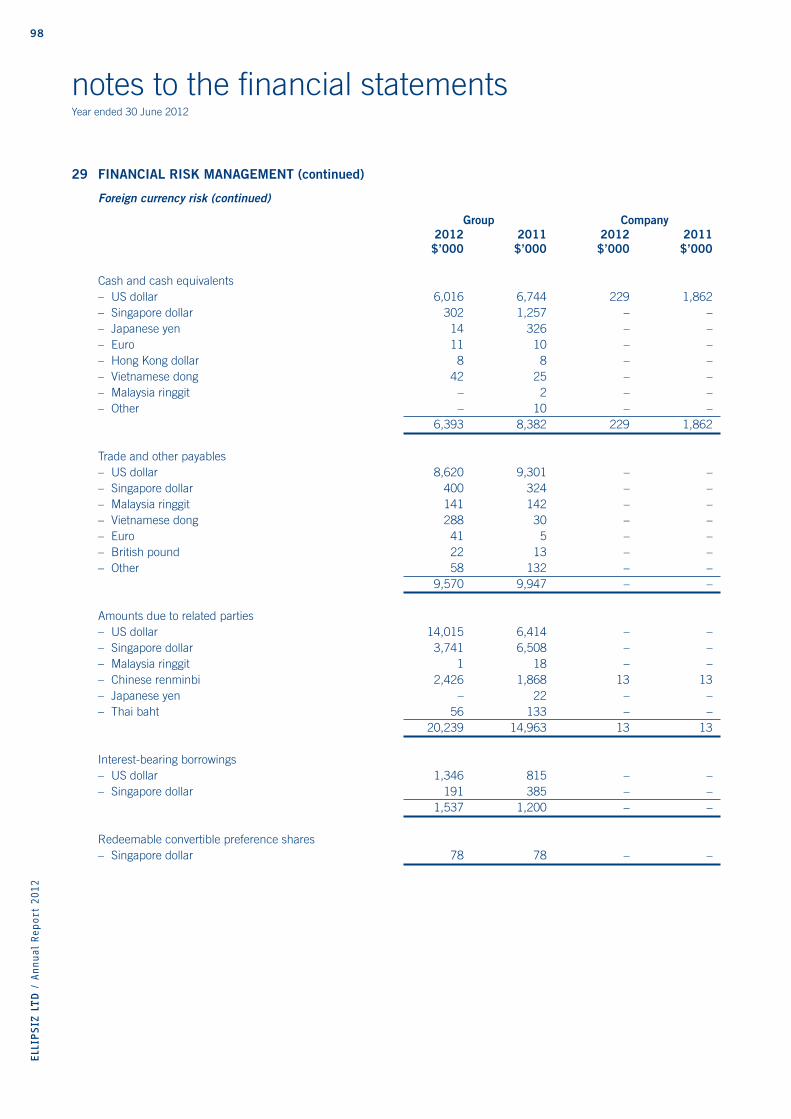
98ELL
IPSIZ
LTD
/ A
nnual
Report
2012
notes to the fi nancial statementsYear ended 30 June 2012
29 FINANCIAL RISK MANAGEMENT (continued)
Foreign currency risk (continued)
Group Company 2012 2011 2012 2011 $’000 $’000 $’000 $’000
Cash and cash equivalents– US dollar 6,016 6,744 229 1,862– Singapore dollar 302 1,257 – –– Japanese yen 14 326 – –– Euro 11 10 – –– Hong Kong dollar 8 8 – –– Vietnamese dong 42 25 – –– Malaysia ringgit – 2 – –– Other – 10 – – 6,393 8,382 229 1,862
Trade and other payables– US dollar 8,620 9,301 – –– Singapore dollar 400 324 – –– Malaysia ringgit 141 142 – –– Vietnamese dong 288 30 – –– Euro 41 5 – –– British pound 22 13 – –– Other 58 132 – – 9,570 9,947 – –
Amounts due to related parties– US dollar 14,015 6,414 – –– Singapore dollar 3,741 6,508 – –– Malaysia ringgit 1 18 – –– Chinese renminbi 2,426 1,868 13 13– Japanese yen – 22 – –– Thai baht 56 133 – – 20,239 14,963 13 13
Interest-bearing borrowings– US dollar 1,346 815 – –– Singapore dollar 191 385 – – 1,537 1,200 – –
Redeemable convertible preference shares– Singapore dollar 78 78 – –
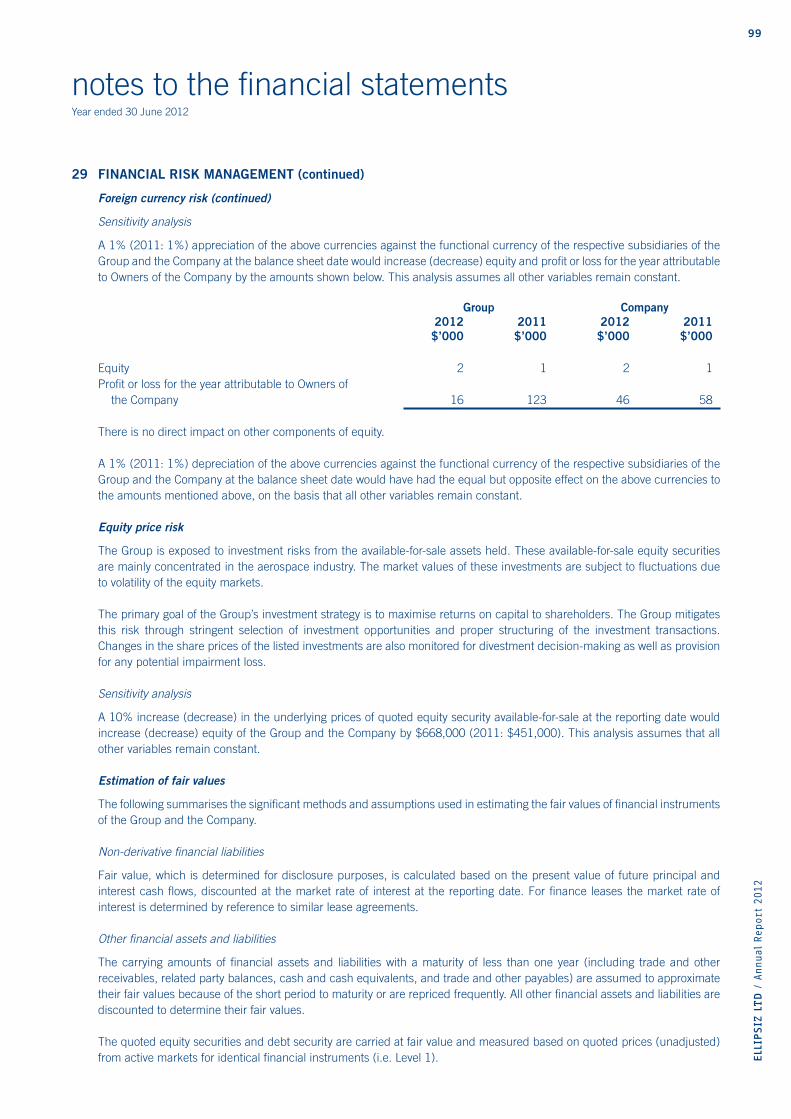
99
ELL
IPSIZ
LTD
/ A
nnual
Report
2012
notes to the fi nancial statementsYear ended 30 June 2012
29 FINANCIAL RISK MANAGEMENT (continued)
Foreign currency risk (continued)
Sensitivity analysis
A 1% (2011: 1%) appreciation of the above currencies against the functional currency of the respective subsidiaries of the Group and the Company at the balance sheet date would increase (decrease) equity and profi t or loss for the year attributable to Owners of the Company by the amounts shown below. This analysis assumes all other variables remain constant.
Group Company 2012 2011 2012 2011 $’000 $’000 $’000 $’000
Equity 2 1 2 1Profi t or loss for the year attributable to Owners of the Company 16 123 46 58
There is no direct impact on other components of equity.
A 1% (2011: 1%) depreciation of the above currencies against the functional currency of the respective subsidiaries of the Group and the Company at the balance sheet date would have had the equal but opposite effect on the above currencies to the amounts mentioned above, on the basis that all other variables remain constant.
Equity price risk
The Group is exposed to investment risks from the available-for-sale assets held. These available-for-sale equity securities are mainly concentrated in the aerospace industry. The market values of these investments are subject to fl uctuations due to volatility of the equity markets.
The primary goal of the Group’s investment strategy is to maximise returns on capital to shareholders. The Group mitigates this risk through stringent selection of investment opportunities and proper structuring of the investment transactions. Changes in the share prices of the listed investments are also monitored for divestment decision-making as well as provision for any potential impairment loss.
Sensitivity analysis
A 10% increase (decrease) in the underlying prices of quoted equity security available-for-sale at the reporting date would increase (decrease) equity of the Group and the Company by $668,000 (2011: $451,000). This analysis assumes that all other variables remain constant.
Estimation of fair values
The following summarises the signifi cant methods and assumptions used in estimating the fair values of fi nancial instruments of the Group and the Company.
Non-derivative fi nancial liabilities
Fair value, which is determined for disclosure purposes, is calculated based on the present value of future principal and interest cash fl ows, discounted at the market rate of interest at the reporting date. For fi nance leases the market rate of interest is determined by reference to similar lease agreements.
Other fi nancial assets and liabilities
The carrying amounts of fi nancial assets and liabilities with a maturity of less than one year (including trade and other receivables, related party balances, cash and cash equivalents, and trade and other payables) are assumed to approximate their fair values because of the short period to maturity or are repriced frequently. All other fi nancial assets and liabilities are discounted to determine their fair values.
The quoted equity securities and debt security are carried at fair value and measured based on quoted prices (unadjusted) from active markets for identical fi nancial instruments (i.e. Level 1).
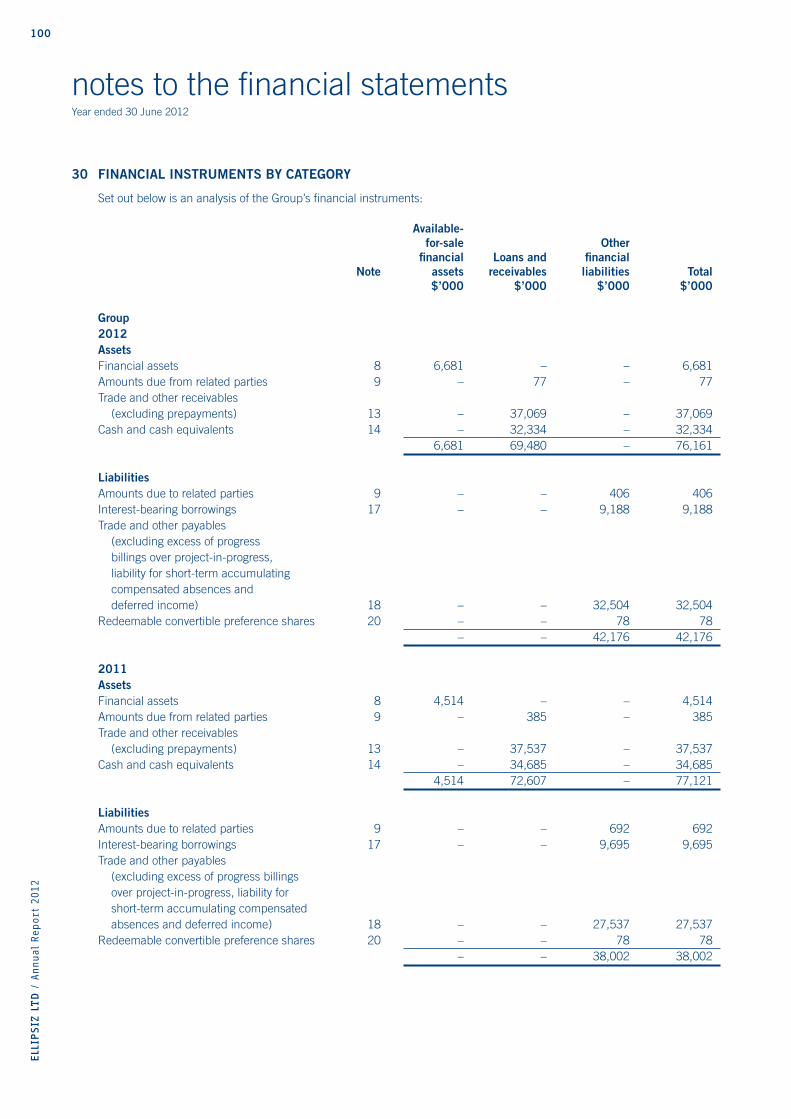
100ELL
IPSIZ
LTD
/ A
nnual
Report
2012
notes to the fi nancial statementsYear ended 30 June 2012
30 FINANCIAL INSTRUMENTS BY CATEGORY
Set out below is an analysis of the Group’s fi nancial instruments:
Available- for-sale Other fi nancial Loans and fi nancial Note assets receivables liabilities Total $’000 $’000 $’000 $’000
Group2012AssetsFinancial assets 8 6,681 – – 6,681Amounts due from related parties 9 – 77 – 77Trade and other receivables (excluding prepayments) 13 – 37,069 – 37,069Cash and cash equivalents 14 – 32,334 – 32,334 6,681 69,480 – 76,161
LiabilitiesAmounts due to related parties 9 – – 406 406Interest-bearing borrowings 17 – – 9,188 9,188Trade and other payables (excluding excess of progress billings over project-in-progress, liability for short-term accumulating compensated absences and deferred income) 18 – – 32,504 32,504Redeemable convertible preference shares 20 – – 78 78 – – 42,176 42,176
2011AssetsFinancial assets 8 4,514 – – 4,514Amounts due from related parties 9 – 385 – 385Trade and other receivables (excluding prepayments) 13 – 37,537 – 37,537Cash and cash equivalents 14 – 34,685 – 34,685 4,514 72,607 – 77,121
LiabilitiesAmounts due to related parties 9 – – 692 692Interest-bearing borrowings 17 – – 9,695 9,695Trade and other payables (excluding excess of progress billings over project-in-progress, liability for short-term accumulating compensated absences and deferred income) 18 – – 27,537 27,537Redeemable convertible preference shares 20 – – 78 78 – – 38,002 38,002
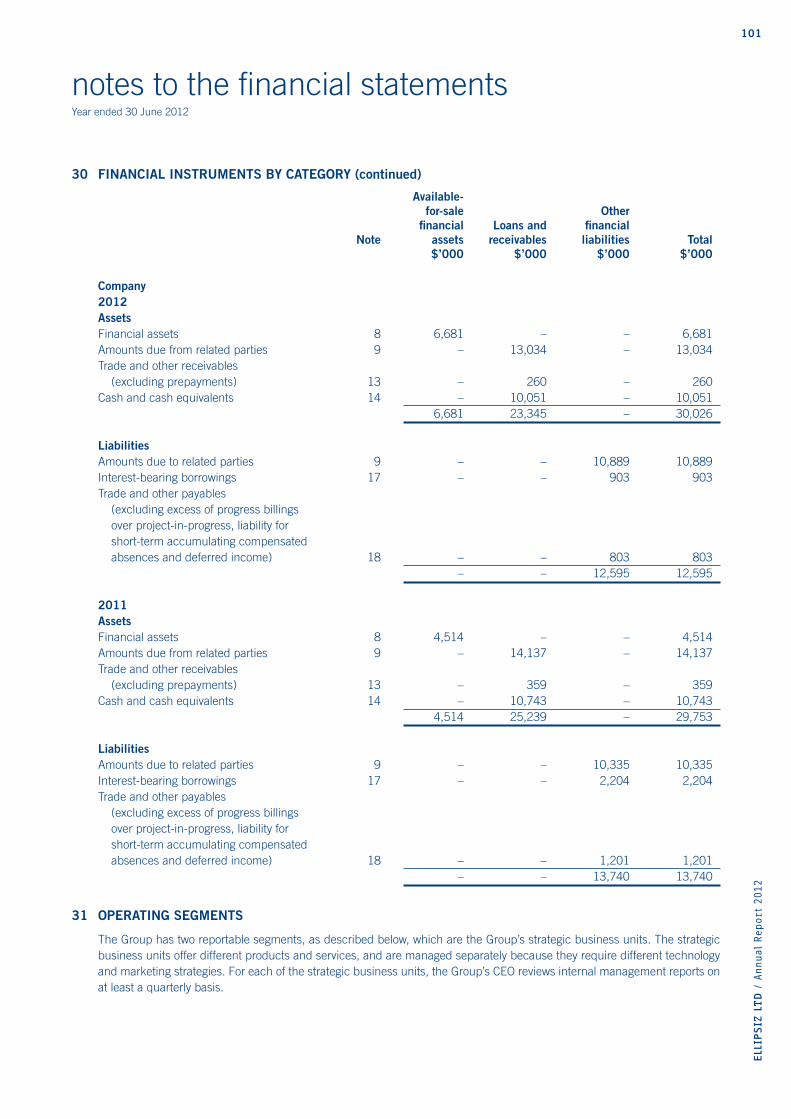
101
ELL
IPSIZ
LTD
/ A
nnual
Report
2012
notes to the fi nancial statementsYear ended 30 June 2012
30 FINANCIAL INSTRUMENTS BY CATEGORY (continued)
Available- for-sale Other fi nancial Loans and fi nancial Note assets receivables liabilities Total $’000 $’000 $’000 $’000
Company2012AssetsFinancial assets 8 6,681 – – 6,681Amounts due from related parties 9 – 13,034 – 13,034Trade and other receivables (excluding prepayments) 13 – 260 – 260Cash and cash equivalents 14 – 10,051 – 10,051 6,681 23,345 – 30,026
LiabilitiesAmounts due to related parties 9 – – 10,889 10,889Interest-bearing borrowings 17 – – 903 903Trade and other payables (excluding excess of progress billings over project-in-progress, liability for short-term accumulating compensated absences and deferred income) 18 – – 803 803 – – 12,595 12,595
2011AssetsFinancial assets 8 4,514 – – 4,514Amounts due from related parties 9 – 14,137 – 14,137Trade and other receivables (excluding prepayments) 13 – 359 – 359Cash and cash equivalents 14 – 10,743 – 10,743 4,514 25,239 – 29,753
LiabilitiesAmounts due to related parties 9 – – 10,335 10,335Interest-bearing borrowings 17 – – 2,204 2,204Trade and other payables (excluding excess of progress billings over project-in-progress, liability for short-term accumulating compensated absences and deferred income) 18 – – 1,201 1,201 – – 13,740 13,740
31 OPERATING SEGMENTS
The Group has two reportable segments, as described below, which are the Group’s strategic business units. The strategic business units offer different products and services, and are managed separately because they require different technology and marketing strategies. For each of the strategic business units, the Group’s CEO reviews internal management reports on at least a quarterly basis.
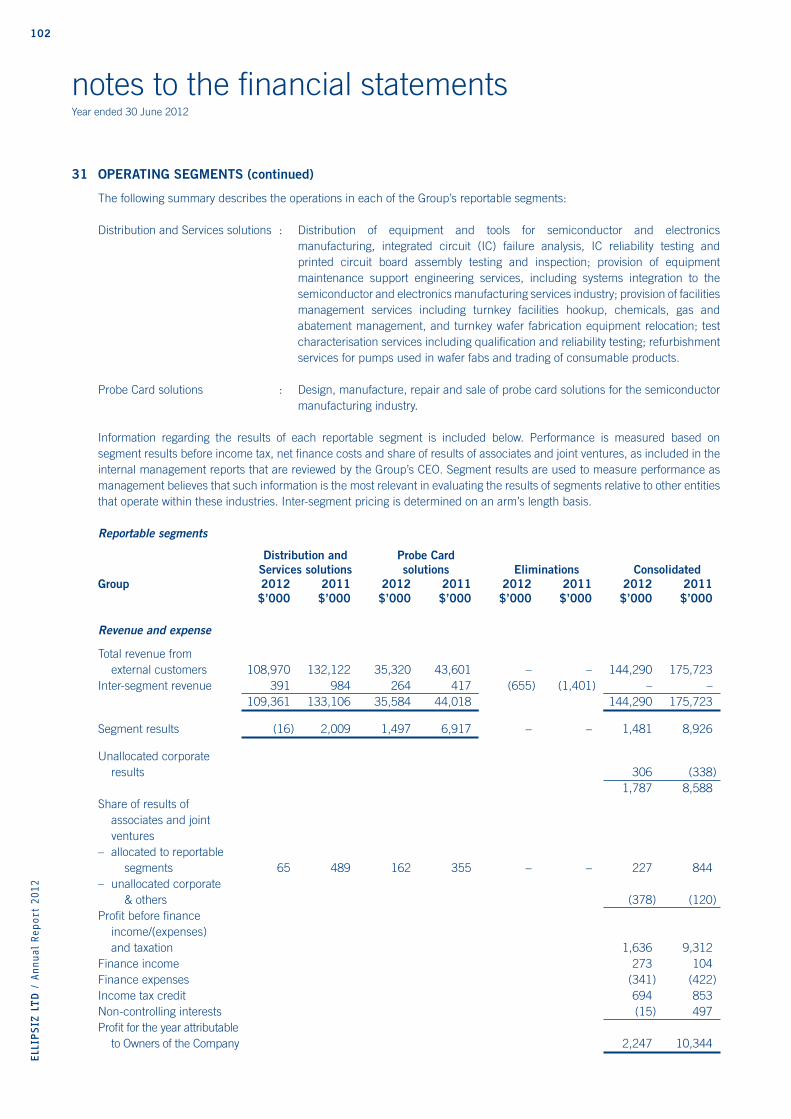
102ELL
IPSIZ
LTD
/ A
nnual
Report
2012
notes to the fi nancial statementsYear ended 30 June 2012
31 OPERATING SEGMENTS (continued)
The following summary describes the operations in each of the Group’s reportable segments:
Distribution and Services solutions : Distribution of equipment and tools for semiconductor and electronics manufacturing, integrated circuit (IC) failure analysis, IC reliability testing and printed circuit board assembly testing and inspection; provision of equipment maintenance support engineering services, including systems integration to the semiconductor and electronics manufacturing services industry; provision of facilities management services including turnkey facilities hookup, chemicals, gas and abatement management, and turnkey wafer fabrication equipment relocation; test characterisation services including qualifi cation and reliability testing; refurbishment services for pumps used in wafer fabs and trading of consumable products.
Probe Card solutions : Design, manufacture, repair and sale of probe card solutions for the semiconductor manufacturing industry.
Information regarding the results of each reportable segment is included below. Performance is measured based on segment results before income tax, net fi nance costs and share of results of associates and joint ventures, as included in the internal management reports that are reviewed by the Group’s CEO. Segment results are used to measure performance as management believes that such information is the most relevant in evaluating the results of segments relative to other entities that operate within these industries. Inter-segment pricing is determined on an arm’s length basis.
Reportable segments
Distribution and Probe Card Services solutions solutions Eliminations ConsolidatedGroup 2012 2011 2012 2011 2012 2011 2012 2011 $’000 $’000 $’000 $’000 $’000 $’000 $’000 $’000
Revenue and expense
Total revenue from external customers 108,970 132,122 35,320 43,601 – – 144,290 175,723Inter-segment revenue 391 984 264 417 (655) (1,401) – – 109,361 133,106 35,584 44,018 144,290 175,723
Segment results (16) 2,009 1,497 6,917 – – 1,481 8,926
Unallocated corporate results 306 (338) 1,787 8,588Share of results of associates and joint ventures– allocated to reportable segments 65 489 162 355 – – 227 844– unallocated corporate & others (378) (120)Profi t before fi nance income/(expenses) and taxation 1,636 9,312Finance income 273 104Finance expenses (341) (422)Income tax credit 694 853Non-controlling interests (15) 497Profi t for the year attributable to Owners of the Company 2,247 10,344
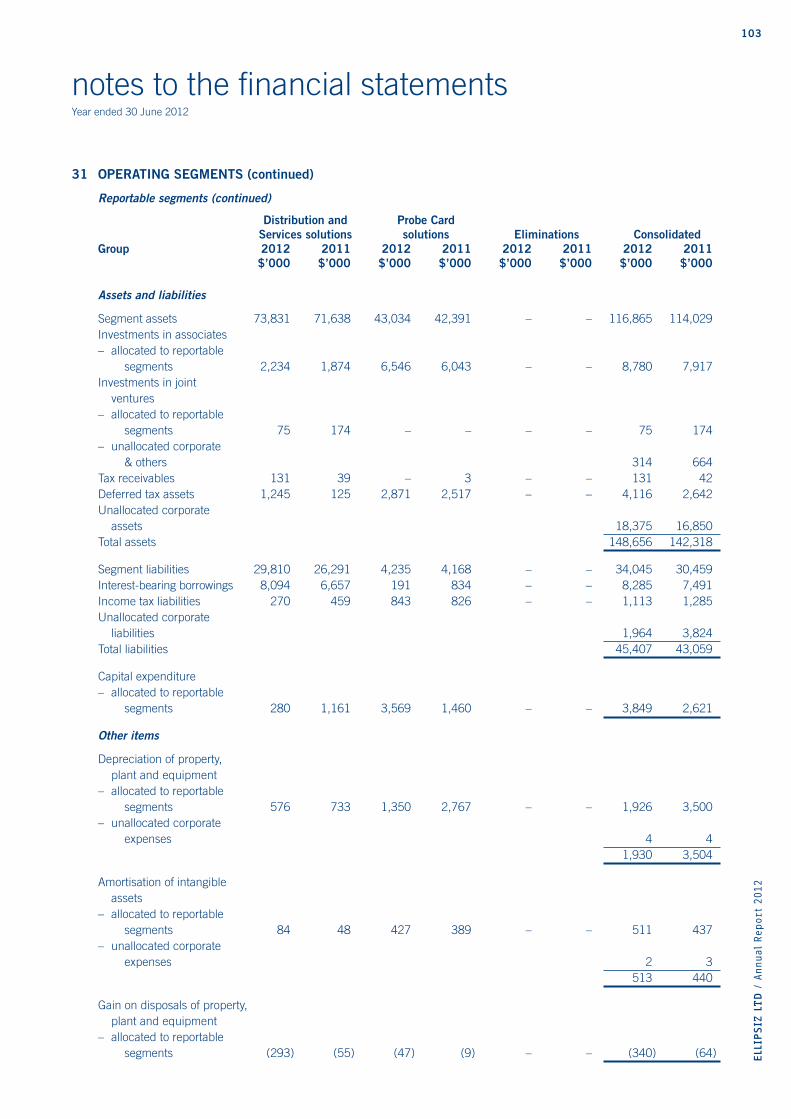
103
ELL
IPSIZ
LTD
/ A
nnual
Report
2012
notes to the fi nancial statementsYear ended 30 June 2012
31 OPERATING SEGMENTS (continued)
Reportable segments (continued)
Distribution and Probe Card Services solutions solutions Eliminations ConsolidatedGroup 2012 2011 2012 2011 2012 2011 2012 2011 $’000 $’000 $’000 $’000 $’000 $’000 $’000 $’000
Assets and liabilities
Segment assets 73,831 71,638 43,034 42,391 – – 116,865 114,029Investments in associates – allocated to reportable segments 2,234 1,874 6,546 6,043 – – 8,780 7,917Investments in joint ventures – allocated to reportable segments 75 174 – – – – 75 174– unallocated corporate & others 314 664Tax receivables 131 39 – 3 – – 131 42Deferred tax assets 1,245 125 2,871 2,517 – – 4,116 2,642Unallocated corporate assets 18,375 16,850Total assets 148,656 142,318
Segment liabilities 29,810 26,291 4,235 4,168 – – 34,045 30,459Interest-bearing borrowings 8,094 6,657 191 834 – – 8,285 7,491Income tax liabilities 270 459 843 826 – – 1,113 1,285Unallocated corporate liabilities 1,964 3,824Total liabilities 45,407 43,059
Capital expenditure– allocated to reportable segments 280 1,161 3,569 1,460 – – 3,849 2,621
Other items
Depreciation of property, plant and equipment – allocated to reportable segments 576 733 1,350 2,767 – – 1,926 3,500– unallocated corporate expenses 4 4 1,930 3,504
Amortisation of intangible assets– allocated to reportable segments 84 48 427 389 – – 511 437– unallocated corporate expenses 2 3 513 440
Gain on disposals of property, plant and equipment – allocated to reportable segments (293) (55) (47) (9) – – (340) (64)
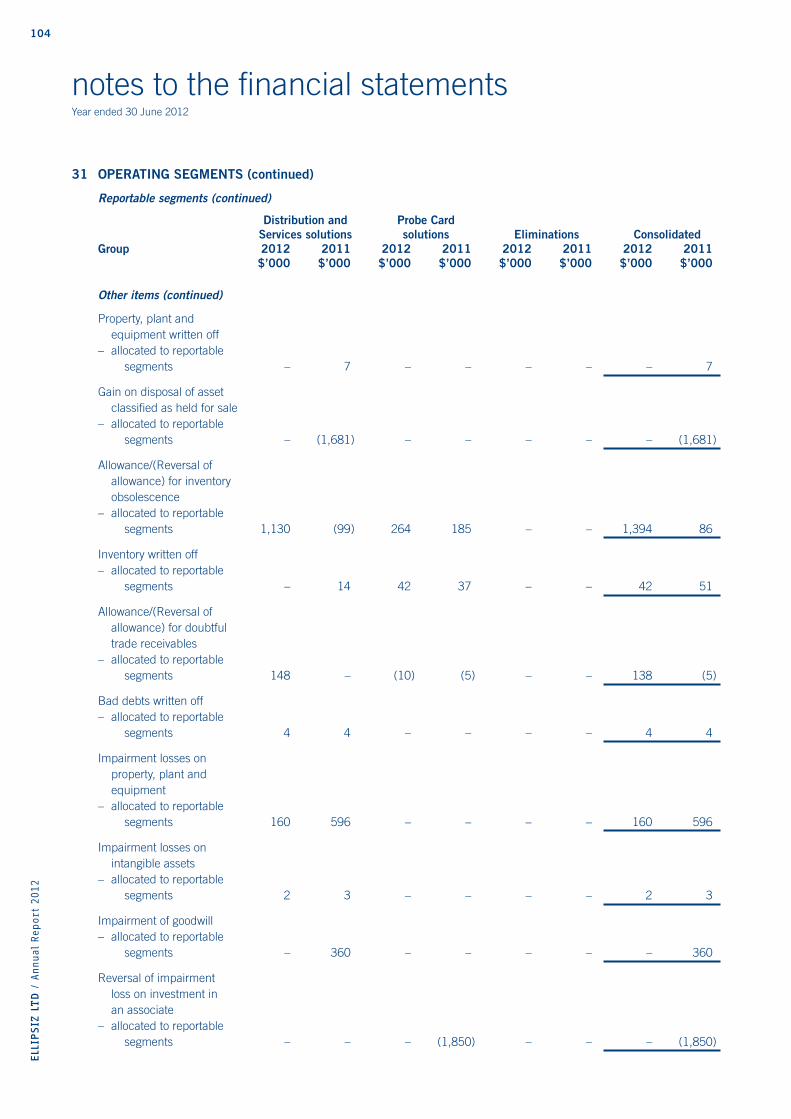
104ELL
IPSIZ
LTD
/ A
nnual
Report
2012
notes to the fi nancial statementsYear ended 30 June 2012
31 OPERATING SEGMENTS (continued)
Reportable segments (continued)
Distribution and Probe Card Services solutions solutions Eliminations ConsolidatedGroup 2012 2011 2012 2011 2012 2011 2012 2011 $’000 $’000 $’000 $’000 $’000 $’000 $’000 $’000
Other items (continued)
Property, plant and equipment written off– allocated to reportable segments – 7 – – – – – 7
Gain on disposal of asset classifi ed as held for sale – allocated to reportable segments – (1,681) – – – – – (1,681)
Allowance/(Reversal of allowance) for inventory obsolescence– allocated to reportable segments 1,130 (99) 264 185 – – 1,394 86
Inventory written off– allocated to reportable segments – 14 42 37 – – 42 51
Allowance/(Reversal of allowance) for doubtful trade receivables– allocated to reportable segments 148 – (10) (5) – – 138 (5)
Bad debts written off– allocated to reportable segments 4 4 – – – – 4 4
Impairment losses on property, plant and equipment – allocated to reportable segments 160 596 – – – – 160 596
Impairment losses on intangible assets– allocated to reportable segments 2 3 – – – – 2 3
Impairment of goodwill– allocated to reportable segments – 360 – – – – – 360
Reversal of impairment loss on investment in an associate– allocated to reportable segments – – – (1,850) – – – (1,850)
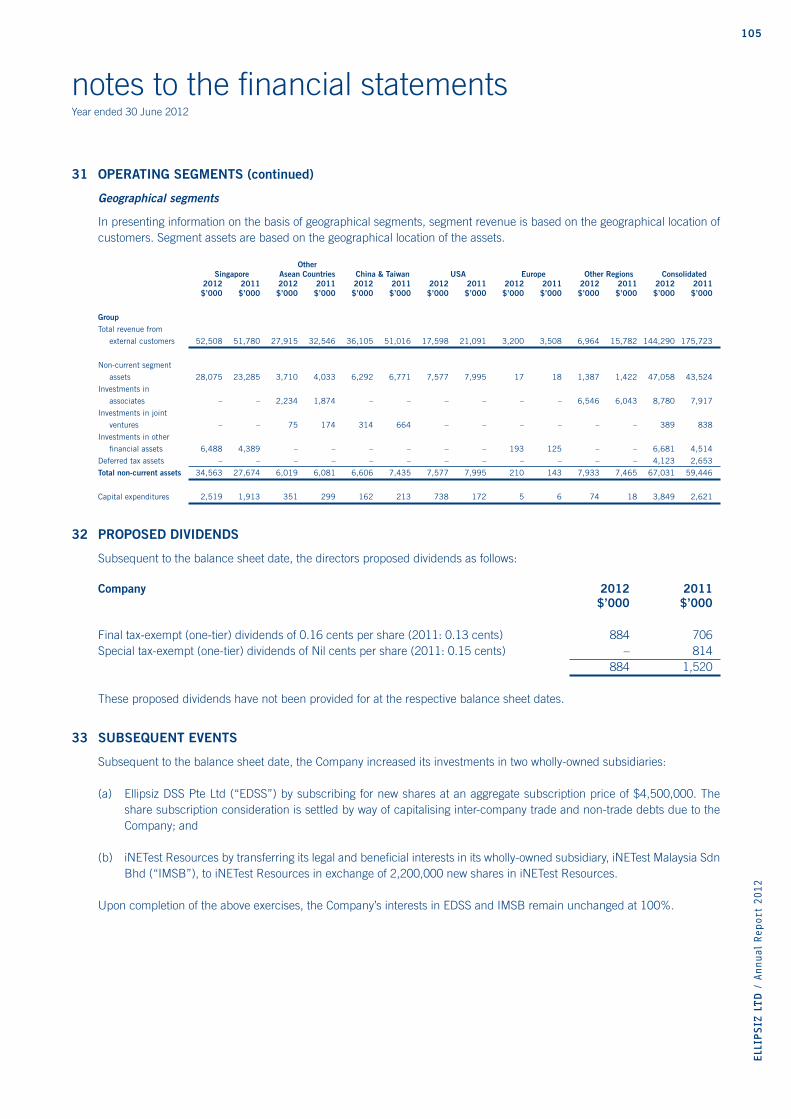
105
ELL
IPSIZ
LTD
/ A
nnual
Report
2012
notes to the fi nancial statementsYear ended 30 June 2012
31 OPERATING SEGMENTS (continued)
Geographical segments
In presenting information on the basis of geographical segments, segment revenue is based on the geographical location of customers. Segment assets are based on the geographical location of the assets.
Other Singapore Asean Countries China & Taiwan USA Europe Other Regions Consolidated 2012 2011 2012 2011 2012 2011 2012 2011 2012 2011 2012 2011 2012 2011 $’000 $’000 $’000 $’000 $’000 $’000 $’000 $’000 $’000 $’000 $’000 $’000 $’000 $’000
GroupTotal revenue from
external customers 52,508 51,780 27,915 32,546 36,105 51,016 17,598 21,091 3,200 3,508 6,964 15,782 144,290 175,723
Non-current segment
assets 28,075 23,285 3,710 4,033 6,292 6,771 7,577 7,995 17 18 1,387 1,422 47,058 43,524
Investments in
associates – – 2,234 1,874 – – – – – – 6,546 6,043 8,780 7,917
Investments in joint
ventures – – 75 174 314 664 – – – – – – 389 838
Investments in other
fi nancial assets 6,488 4,389 – – – – – – 193 125 – – 6,681 4,514
Deferred tax assets – – – – – – – – – – – – 4,123 2,653
Total non-current assets 34,563 27,674 6,019 6,081 6,606 7,435 7,577 7,995 210 143 7,933 7,465 67,031 59,446
Capital expenditures 2,519 1,913 351 299 162 213 738 172 5 6 74 18 3,849 2,621
32 PROPOSED DIVIDENDS
Subsequent to the balance sheet date, the directors proposed dividends as follows:
Company 2012 2011 $’000 $’000
Final tax-exempt (one-tier) dividends of 0.16 cents per share (2011: 0.13 cents) 884 706Special tax-exempt (one-tier) dividends of Nil cents per share (2011: 0.15 cents) – 814 884 1,520
These proposed dividends have not been provided for at the respective balance sheet dates.
33 SUBSEQUENT EVENTS
Subsequent to the balance sheet date, the Company increased its investments in two wholly-owned subsidiaries:
(a) Ellipsiz DSS Pte Ltd (“EDSS”) by subscribing for new shares at an aggregate subscription price of $4,500,000. The share subscription consideration is settled by way of capitalising inter-company trade and non-trade debts due to the Company; and
(b) iNETest Resources by transferring its legal and benefi cial interests in its wholly-owned subsidiary, iNETest Malaysia Sdn Bhd (“IMSB”), to iNETest Resources in exchange of 2,200,000 new shares in iNETest Resources.
Upon completion of the above exercises, the Company’s interests in EDSS and IMSB remain unchanged at 100%.
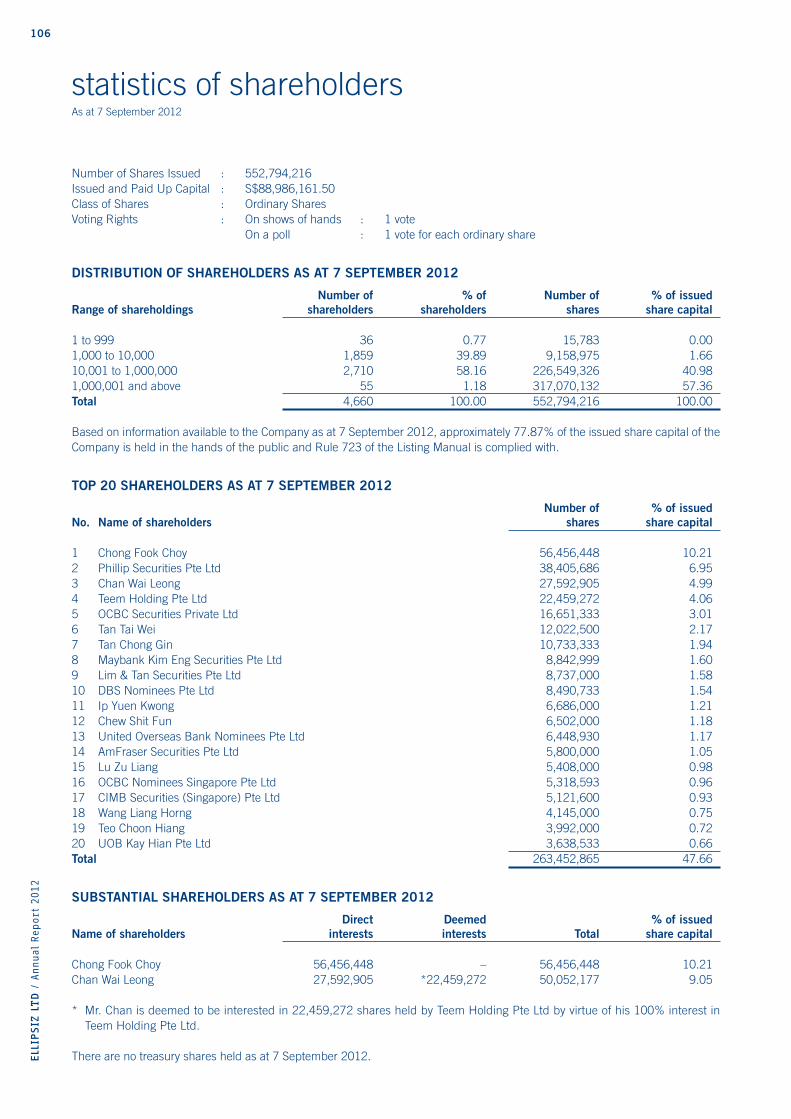
106ELL
IPSIZ
LTD
/ A
nnual
Report
2012
statistics of shareholdersAs at 7 September 2012
Number of Shares Issued : 552,794,216Issued and Paid Up Capital : S$88,986,161.50Class of Shares : Ordinary SharesVoting Rights : On shows of hands : 1 vote On a poll : 1 vote for each ordinary share
DISTRIBUTION OF SHAREHOLDERS AS AT 7 SEPTEMBER 2012
Number of % of Number of % of issuedRange of shareholdings shareholders shareholders shares share capital
1 to 999 36 0.77 15,783 0.001,000 to 10,000 1,859 39.89 9,158,975 1.6610,001 to 1,000,000 2,710 58.16 226,549,326 40.981,000,001 and above 55 1.18 317,070,132 57.36Total 4,660 100.00 552,794,216 100.00
Based on information available to the Company as at 7 September 2012, approximately 77.87% of the issued share capital of the Company is held in the hands of the public and Rule 723 of the Listing Manual is complied with.
TOP 20 SHAREHOLDERS AS AT 7 SEPTEMBER 2012
Number of % of issued No. Name of shareholders shares share capital
1 Chong Fook Choy 56,456,448 10.212 Phillip Securities Pte Ltd 38,405,686 6.953 Chan Wai Leong 27,592,905 4.994 Teem Holding Pte Ltd 22,459,272 4.065 OCBC Securities Private Ltd 16,651,333 3.016 Tan Tai Wei 12,022,500 2.177 Tan Chong Gin 10,733,333 1.948 Maybank Kim Eng Securities Pte Ltd 8,842,999 1.609 Lim & Tan Securities Pte Ltd 8,737,000 1.5810 DBS Nominees Pte Ltd 8,490,733 1.5411 Ip Yuen Kwong 6,686,000 1.2112 Chew Shit Fun 6,502,000 1.1813 United Overseas Bank Nominees Pte Ltd 6,448,930 1.1714 AmFraser Securities Pte Ltd 5,800,000 1.0515 Lu Zu Liang 5,408,000 0.9816 OCBC Nominees Singapore Pte Ltd 5,318,593 0.9617 CIMB Securities (Singapore) Pte Ltd 5,121,600 0.9318 Wang Liang Horng 4,145,000 0.7519 Teo Choon Hiang 3,992,000 0.7220 UOB Kay Hian Pte Ltd 3,638,533 0.66Total 263,452,865 47.66
SUBSTANTIAL SHAREHOLDERS AS AT 7 SEPTEMBER 2012
Direct Deemed % of issuedName of shareholders interests interests Total share capital
Chong Fook Choy 56,456,448 – 56,456,448 10.21Chan Wai Leong 27,592,905 *22,459,272 50,052,177 9.05 * Mr. Chan is deemed to be interested in 22,459,272 shares held by Teem Holding Pte Ltd by virtue of his 100% interest in
Teem Holding Pte Ltd.
There are no treasury shares held as at 7 September 2012.

107
ELL
IPSIZ
LTD
/ A
nnual
Report
2012
notice of annual general meetingEllipsiz Ltd (the “Company”)(Incorporated in the Republic of Singapore)Registration No. 199408329R
NOTICE IS HEREBY GIVEN that the 17th Annual General Meeting of the Company will be held at 29 Woodlands Industrial Park E1, Lobby 1, #04-03, NorthTech, Singapore 757716 on 18 October 2012 at 4.00 p.m. to transact the following businesses.
AS ORDINARY BUSINESS
1. To receive and adopt the Directors’ Report and Audited Financial Statements for the fi nancial year ended 30 June 2012, together with the Auditors’ Report thereon. (Resolution 1)
2. (i) To re-elect Mr. Phoon Wai Meng (independent and non-executive director) who is retiring in accordance with Article 91 of the Company’s Articles of Association, and who being eligible, offers himself for re-election. (Resolution 2)
(ii) To re-elect Mr. Amos Leong Hong Kiat (independent and non-executive director) who is retiring in accordance with Article 91 of the Company’s Articles of Association, and who being eligible, offers himself for re-election. (Resolution 3)
3. To approve directors’ fees of S$210,000 for the fi nancial year ended 30 June 2012 (2011: S$210,000). (Resolution 4)
4. To approve a fi rst and fi nal (tax-exempt one-tier) dividend of 0.16 cents per ordinary share for the fi nancial year ended 30 June 2012. (Resolution 5)
5. To re-appoint KPMG LLP as the Company’s auditors and to authorise the directors of the Company to fi x their remuneration. (Resolution 6)
AS SPECIAL BUSINESS
To consider and, if thought fi t, to pass with or without modifi cations, the following resolutions as Ordinary Resolutions.
6. “That authority be and is hereby given to the directors of the Company (“Directors”) to:
(a) (i) allot and issue shares in the Company (“shares”) whether by way of rights, bonus or otherwise; and/or
(ii) make or grant offers, agreements or options (collectively, the “Instruments”) that might or would require shares to be issued, including but not limited to the creation and issue of (as well as adjustments to) options, warrants, debentures or other instruments convertible into shares,
at any time and upon such terms and conditions and for such purposes and to such persons as the Directors may in their absolute discretion deem fi t; and
(b) (notwithstanding the authority conferred by this Resolution may have ceased to be in force) issue shares in pursuance of any Instrument made or granted by the Directors while this Resolution was in force,

108ELL
IPSIZ
LTD
/ A
nnual
Report
2012
PROVIDED ALWAYS that:
(1) the aggregate number of shares to be issued pursuant to this Resolution (including shares to be issued in pursuance of Instruments made or granted pursuant to this Resolution) does not exceed 50 per cent of the total number of issued shares, excluding treasury shares, (as calculated in accordance with sub-paragraph 2 below) of which the aggregate number of shares to be issued other than on a pro-rata basis to members of the Company (including shares to be issued in pursuance of Instruments made or to be made pursuant to this Resolution) does not exceed 20 per cent of the total number of shares, excluding treasury shares, of the Company (as calculated in accordance with sub-paragraph (2) below):
(2) (subject to such manner of calculation as may be prescribed by the Singapore Exchange Securities Trading Limited (“SGX-ST”)) for the purpose of determining the aggregate number of shares that may be issued under sub-paragraph (1) above, the percentage of issued shares shall be based on the Company’s total number of issued shares, excluding treasury shares, at the time this Resolution is passed, after adjusting for:
(2.1) new shares arising from the conversion or exercise of any convertible securities or share options or vesting of shares awards which are outstanding or subsisting at the time this Resolution is passed; and
(2.2) any subsequent bonus issue, consolidation or subdivision of shares;
(3) in exercising the authority conferred by this Resolution, the Company shall comply with the provisions of the Listing Manual of the SGX-ST for the time being in force (unless such compliance has been waived by the SGX-ST) and the articles of association for the time being of the Company; and
(4) (unless revoked or varied by the Company in general meeting) the authority conferred by this Resolution shall continue in force until the conclusion of the next Annual General Meeting of the Company or the date by which the next Annual General meeting of the Company is required by law to be held, whichever is the earlier.”
[See Explanatory note(i)] (Resolution 7)
7. “That authority be and is hereby given to directors of the Company to allot and issue from time to time such number of ordinary shares in the capital of the Company as may be required to be issued pursuant to the exercise of options previously granted under the Ellipsiz Share Option Plan (“ESOP”), PROVIDED ALWAYS that the aggregate number of additional ordinary shares allotted and issued pursuant to the ESOP and the previous Ellipsiz Restricted Stock Plan shall not exceed 15 per cent of the issued share capital of the Company from time to time.”
[See Explanatory note(ii)] (Resolution 8)
8. “That:
(a) for the purposes of Sections 76C and 76E of the Companies Act, Cap. 50 of Singapore (the “Companies Act”) the exercise by the directors of the Company (“Directors”) of all the powers of the Company to purchase or otherwise acquire issued ordinary shares in the capital of the Company (“shares”) not exceeding in aggregate the Maximum Limit (as hereafter defi ned), at such price or prices as may be determined by the Directors from time to time up to the Maximum Price (as hereafter defi ned), whether by way of:
(i) on-market purchases (each a “Market Purchase”) transacted on the Singapore Exchange Securities Trading Limited (“SGX-ST”); and/or
notice of annual general meeting
109
ELL
IPSIZ
LTD
/ A
nnual
Report
2012
notice of annual general meeting
(ii) off-market purchases (each an “Off-Market Purchase”) effected otherwise than on the SGX-ST in accordance with any equal access scheme(s) as may be determined or formulated by the Directors as they consider fi t in their absolute discretion, which scheme(s) shall satisfy all the conditions prescribed by the Companies Act,
and otherwise in accordance with all laws and regulations and rules of the SGX-ST as may for the time being be applicable, be and is hereby authorised and approved generally and unconditionally (the “Share Purchase Mandate”);
(b) unless varied or revoked by the Company in general meeting, the authority conferred on the Directors pursuant to the Share Purchase Mandate may be exercised by the Directors at any time and from time to time during the period commencing from the date of the passing of this Resolution and expiring on the earliest of:
(i) the date on which the next Annual General Meeting of the Company is held;
(ii) the date by which the next Annual General Meeting of the Company is required by law to be held; and
(iii) the date on which the share purchases have been carried out to the full extent mandated;
(c) in this Resolution:
“Average Closing Price” means the average of the last dealt prices of a share for the fi ve consecutive market days on which the shares are transacted on the SGX-ST immediately preceding the date of Market Purchase by the Company or, as the case may be, the date of the making of the offer pursuant to an Off-Market Purchase, and in the case of a Market Purchase, deemed to be adjusted in accordance with the Listing Manual for any corporate action which occurs after the relevant fi ve-day period;
“date of the making of the offer” means the date on which the Company announces its intention to make an offer for an Off-Market Purchase of shares, stating the purchase price (which shall not be more than the Maximum Price for an Off-Market Purchase) for each share and the relevant terms of the equal access scheme for effecting the Off-Market Purchase;
“Maximum Limit” means that number of issued shares representing 10 per cent of the total number of issued shares as at the date of the passing of this resolution; and
“Maximum Price”, in relation to a share to be purchased or acquired, means the purchase price (excluding brokerage, commission, applicable goods and services tax, stamp duty, clearance fees, and other related expenses) which shall not exceed:
(i) in the case of a Market Purchase of a share, 105 per cent of the Average Closing Price of the shares; and
(ii) in the case of an Off-Market Purchase of a share pursuant to an equal access scheme, 110 per cent of the Average Closing Price of the shares; and
(d) the Directors and/or any of them be and are hereby authorised to complete and do all such acts and things (including executing such documents as may be required) as they and/or he may consider expedient or necessary to give effect to the transactions contemplated and/or authorised by this Resolution.”
[See Explanatory note (iii)] (Resolution 9)
ANY OTHER BUSINESS
9. To transact any other ordinary business that may be transacted at an annual general meeting.
110ELL
IPSIZ
LTD
/ A
nnual
Report
2012
notice of annual general meeting
NOTICE OF BOOKS CLOSURE
NOTICE IS HEREBY GIVEN that the Transfer Books and the Register of Members of the Company will be closed on 29 October 2012 after 5.00 p.m. to determine the members’ entitlements to the proposed fi rst and fi nal dividend to be paid on 15 November 2012 (Thursday), subject to and contingent upon members’ approval for the proposed dividends being obtained at the forthcoming 17th Annual General Meeting of the Company. In respect of shares deposited in securities accounts with The Central Depository (Pte) Limited (“CDP”), the dividends will be paid by the Company to CDP which will, in turn, distribute the entitlements to the dividends to CDP account holders in accordance with its normal practice. Duly completed registrable transfers (together with all relevant documents of or evidencing title) received by the Share Registrar, M&C Services Private Limited, at 138 Robinson Road, #17-00, The Corporate Offi ce, Singapore 068906 up to 5.00 p.m. on 29 October 2012 (Monday), will be registered to determine members’ entitlements to the fi rst and fi nal dividend.
Dated: 2 October 2012By Order of the Board
Anne Choo and Chan Yuen LengJoint Company SecretariesSingapore
Notes:
A member of the Company entitled to attend and vote at this meeting is entitled to appoint not more than two proxies to attend and vote in his stead. A proxy need not be a member of the Company. Where a member appoints two proxies, he/she shall specify the proportion of the shareholding (expressed as a percentage of the whole) to be represented by each proxy. If no proportion is specifi ed, the fi rst named proxy shall be treated as representing 100 per cent of the shareholding and any second named proxy as an alternative to the fi rst named. A member of the Company which is a corporation is entitled to appoint its authorised representative or proxy to vote on its behalf. If the member is a corporation, the instrument appointing the proxy or representative must be under seal or the hand of an offi cer or attorney duly authorised. The instrument appointing a proxy must be deposited at the registered offi ce of the Company at 29 Woodlands Industrial Park E1, Lobby 1, #04-03, NorthTech, Singapore 757716 not less than 48 hours before the time appointed for the meeting.
Explanatory Notes on Special Business to be transacted:
(i) The Ordinary Resolution 7 proposed in item 6 above is to enable the directors of the Company to issue shares in the Company and to make or grant instruments (such as warrants or debentures) convertible into shares, and to issue shares in pursuance of such instruments, up to an amount not exceeding in total 50 per cent of the total number of issued shares excluding treasury shares of the Company with a sub-limit of 20 per cent for issues other than on a pro-rata basis to members. For the purpose of determining the aggregate number of shares that may be issued, the total number of issued shares, excluding treasury shares, will be calculated based on the Company’s total number of issued shares, excluding treasury shares, at the time that Resolution 7 is passed, after adjusting for new shares arising from the conversion or exercise of any convertible securities or share options or vesting of share awards which are outstanding or subsisting at the time Resolution 7 is passed, and any subsequent bonus issue, consolidation or subdivision of shares.
(ii) The Ordinary Resolution 8 proposed in item 7 above, if passed, will enable the directors of the Company, from the date of the above meeting until the next Annual General Meeting to allot and issue shares in the Company of up to a number not exceeding in total 15 per cent of the issued share capital of the Company from time to time pursuant to the exercise of options under the Ellipsiz Share Option Plan and the vesting of awards under the Ellipsiz Restricted Stock Plan.
(iii) The Ordinary Resolution 9 proposed in item 8 above, if passed, will renew the mandate approved by members of the Company on 19 October 2011 authorising the Company to purchase its own shares subject to and in accordance with the rules of the SGX-ST. Please refer to the letter to members dated 2 October 2012 for details.
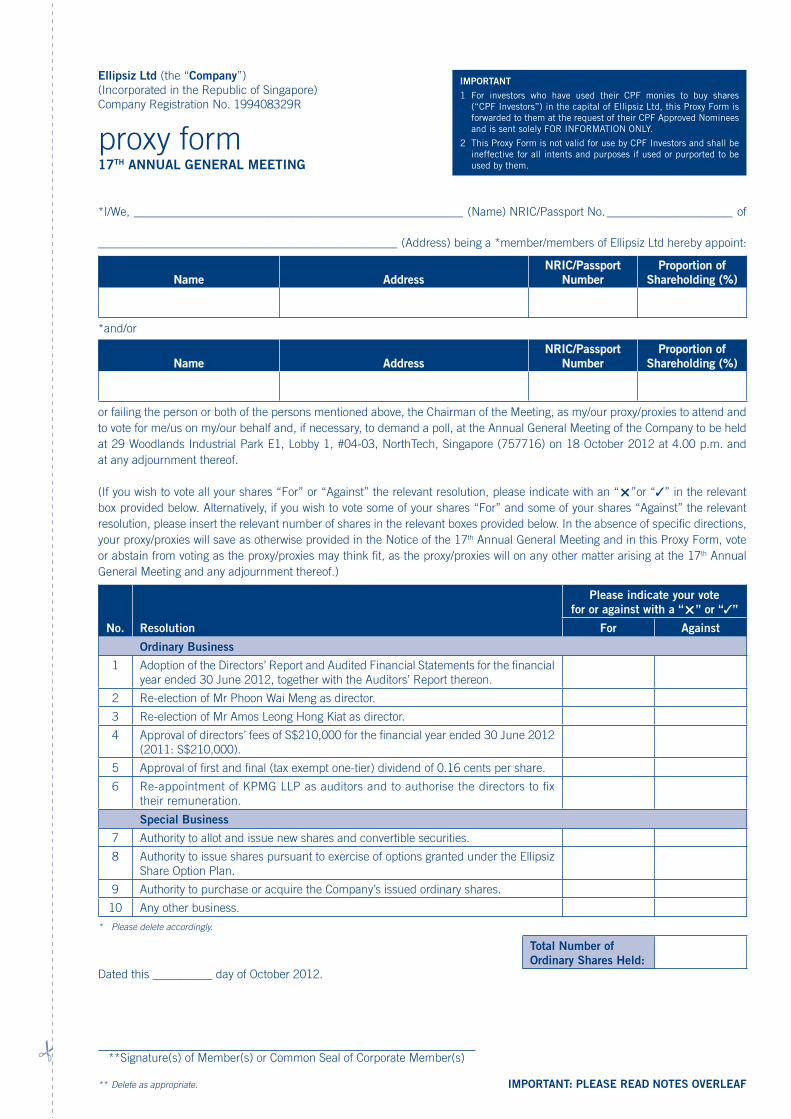
*I/We, _______________________________________________________ (Name) NRIC/Passport No. _____________________ of
__________________________________________________ (Address) being a *member/members of Ellipsiz Ltd hereby appoint:
NameName AddressAddressNRIC/Passport NRIC/Passport
NumberNumberProportion of Proportion of
Shareholding (%)Shareholding (%)
*and/or
NameName AddressAddressNRIC/Passport NRIC/Passport
NumberNumberProportion of Proportion of
Shareholding (%)Shareholding (%)
or failing the person or both of the persons mentioned above, the Chairman of the Meeting, as my/our proxy/proxies to attend and to vote for me/us on my/our behalf and, if necessary, to demand a poll, at the Annual General Meeting of the Company to be held at 29 Woodlands Industrial Park E1, Lobby 1, #04-03, NorthTech, Singapore (757716) on 18 October 2012 at 4.00 p.m. and at any adjournment thereof.
(If you wish to vote all your shares “For” or “Against” the relevant resolution, please indicate with an “ ”or “✓” in the relevant box provided below. Alternatively, if you wish to vote some of your shares “For” and some of your shares “Against” the relevant resolution, please insert the relevant number of shares in the relevant boxes provided below. In the absence of specifi c directions, your proxy/proxies will save as otherwise provided in the Notice of the 17th Annual General Meeting and in this Proxy Form, vote or abstain from voting as the proxy/proxies may think fi t, as the proxy/proxies will on any other matter arising at the 17th Annual General Meeting and any adjournment thereof.)
No. Resolution
Please indicate your votefor or against with a “ ” or “✓”
For Against
Ordinary Business
1 Adoption of the Directors’ Report and Audited Financial Statements for the fi nancial year ended 30 June 2012, together with the Auditors’ Report thereon.
2 Re-election of Mr Phoon Wai Meng as director.
3 Re-election of Mr Amos Leong Hong Kiat as director.
4 Approval of directors’ fees of S$210,000 for the fi nancial year ended 30 June 2012 (2011: S$210,000).
5 Approval of fi rst and fi nal (tax exempt one-tier) dividend of 0.16 cents per share.
6 Re-appointment of KPMG LLP as auditors and to authorise the directors to fi x their remuneration.
Special Business
7 Authority to allot and issue new shares and convertible securities.
8 Authority to issue shares pursuant to exercise of options granted under the Ellipsiz Share Option Plan.
9 Authority to purchase or acquire the Company’s issued ordinary shares.
10 Any other business.
* Please delete accordingly.
Total Number of Ordinary Shares Held:
Dated this __________ day of October 2012.
**Signature(s) of Member(s) or Common Seal of Corporate Member(s)
** Delete as appropriate. IMPORTANT: PLEASE READ NOTES OVERLEAF
Ellipsiz Ltd (the “Company”)(Incorporated in the Republic of Singapore)Company Registration No. 199408329R
IMPORTANT
1 For investors who have used their CPF monies to buy shares (“CPF Investors”) in the capital of Ellipsiz Ltd, this Proxy Form is forwarded to them at the request of their CPF Approved Nominees and is sent solely FOR INFORMATION ONLY.
2 This Proxy Form is not valid for use by CPF Investors and shall be ineffective for all intents and purposes if used or purported to be used by them.
proxy form 17TH ANNUAL GENERAL MEETING
Notes:
1. If you have ordinary shares entered against your name in the Depository Register (as defi ned in Section 130A of the Companies Act, Cap. 50 of Singapore), you should insert that number of ordinary shares. If you have ordinary shares registered in your name in the Register of Members, you should insert that number of ordinary shares. If you have ordinary shares entered against your name in the Depository Register and ordinary shares registered in your name in the Register of Members, you should insert the aggregate number of ordinary shares entered against your name in the Depository Register and registered in your name in the Register of Members. If no number is inserted, the instrument appointing a proxy or proxies shall be deemed to relate to all the ordinary shares in the capital of the Company held by you.
2. A member of the Company entitled to attend and vote at the Annual General Meeting is entitled to appoint one or two proxies to attend and vote in his stead. A proxy need not be a member.
3. Where a member appoints two proxies, the member shall specify the proportion of the shareholding (expressed as a percentage of the whole) to be represented by each proxy. If no such proportion is specifi ed, the fi rst named proxy shall be treated as representing 100 per cent of the shareholding and any second named proxy as an alternative to the fi rst named.
4. The instrument appointing a proxy or proxies (together with the power of attorney, if any, under which it is signed or a certifi ed copy thereof) must be deposited at the registered offi ce of the Company at 29 Woodlands Industrial Park E1, Lobby 1, #04-03, NorthTech, Singapore 757716 not later than 48 hours before the time fi xed for holding the Annual General Meeting.
5. This instrument appointing a proxy or proxies must be under the hand of the appointor or his attorney duly authorised in writing. Where the instrument appointing a proxy or proxies is executed by a corporation, it must be executed either under its seal or under the hand of any offi cer or attorney duly authorised.
6. A corporation which is a member may also authorise by resolution of its directors or other governing body, such person as it thinks fi t to act as its representative at the Annual General Meeting in accordance with Section 179 of the Companies Act, Cap. 50 of Singapore.
7. The Company shall be entitled to reject this instrument appointing a proxy or proxies if it is incomplete, improperly completed or illegible or where the true intentions of the appointor are not ascertainable from the instructions of the appointor specifi ed in the instrument appointing a proxy or proxies.
8. In the case of members whose ordinary shares are entered against their names in the Depository Register, the Company may reject any instrument appointing a proxy or proxies lodged if such members are not shown to have ordinary shares entered against their names in the Depository Register as at 48 hours before the time fi xed for holding the Annual General Meeting as certifi ed by the CDP to the Company.

corporate directory
SINGAPORE
Ellipsiz Ltd – Headquarters29 Woodlands Industrial Park E1#04-03 NorthTech Lobby 1 Singapore 757716 Tel: (65) 6311 8500Fax: (65) 6269 2628
Ellipsiz Singapore Pte Ltd29 Woodlands Industrial Park E1#04-03 NorthTech Lobby 1 Singapore 757716 Tel: (65) 6311 8500Fax: (65) 6518 2222
Ellipsiz DSS Pte Ltd29 Woodlands Industrial Park E1#04-03 NorthTech Lobby 1 Singapore 757716 Tel: (65) 6518 2200Fax: (65) 6518 2222
iNETest Resources Pte Ltd 29 Woodlands Industrial Park E1#04-03 NorthTech Lobby 1 Singapore 757716 Tel: (65) 6518 2200Fax: (65) 6518 2222
SV Probe Pte Ltd29 Woodlands Industrial Park E1#04-01 NorthTech Lobby 1 Singapore 757716 Tel: (65) 6769 8233Fax: (65) 6765 8183
Ellipsiz Communications Pte Ltd29 Woodlands Industrial Park E1#04-03 NorthTech Lobby 1 Singapore 757716Tel: (65) 6518 2200Fax: (65) 6518 2222
Ellipsiz TestLab Pte Ltd29 Woodlands Industrial Park E1#04-03 NorthTech Lobby 1 Singapore 757716 Tel: (65) 6518 2200Fax: (65) 6518 2222
FMB Industries Pte Ltd29 Woodlands Industrial Park E1#04-03 NorthTech Lobby 1 Singapore 757716 Tel: (65) 6518 2200Fax: (65) 6518 2222
E+HPS Pte Ltd152 Paya Lebar Road #06-03Citipoint@Paya LebarSingapore 409020Tel: (65) 6841 4833Fax: (65) 6841 0838
MALAYSIA
iNETest Malaysia Sdn Bhd (Penang Headquarters)50 Persiaran Bayan IndahBayan Bay 11900 Bayan Lepas Penang MalaysiaTel: (60) 4 642 5035Fax: (60) 4 642 9035
iNETest Malaysia Sdn Bhd (Kuala Lumpur Offi ce)29A Jalan SS 21/37 Damansara Utama 47400 Petaling JayaSelangor Darul Ehsan MalaysiaTel: (60) 3 7729 2035Fax: (60) 3 7726 6315
iNETest Malaysia Sdn Bhd (Penang Service Centre)Bay Avenue, Block H-8-1,Lorong Bayan Indah Dua, 11900 Bayan LepasPenang MalaysiaTel: (60) 4 642 5282Fax: (60) 4 642 9282
iNETest Malaysia Sdn Bhd(Kuching Offi ce)Lot 9706, 1st Floor Section 64 KTLD,Jalan Pending, Kuching, 93450Sarawak, MalaysiaTel: (60) 8 248 1201 Fax: (60) 8 248 3231
CHINA
Ellipsiz (Shanghai) International Ltd4F No. 2 Jia Li Building201 Keyuan Road Zhang Jiang Hi-Tech ParkPudong Shanghai 201203 ChinaTel: (86) 21 5027 0969Fax: (86) 21 5027 0968
Ellipsiz Semilab (Shanghai) Co., Ltd4F No. 2 Jia Li Building201 Keyuan Road Zhang Jiang Hi-Tech ParkPudong Shanghai 201203 ChinaTel: (86) 21 5027 0969Fax: (86) 21 5027 0968
Suzhou Silicon Information Technology Co., LtdM3#1F Microsystem ParkPeiyuan Road S.N.D SuzhouJiangsu 215163 ChinaTel: (86) 512 6689 4756Fax: (86) 512 6841 6855
E+HPS Engineering (Suzhou) Co., Ltd Unit 14 3F Building A5 Xing Han StreetSuzhou 215021 ChinaTel: (86) 512 6767 2671Fax: (86) 512 6767 2673
HPS Engineering (Suzhou) Co., Ltd Unit 14 3F Building A5 Xing Han StreetSuzhou 215021 ChinaTel: (86) 512 6767 2671Fax: (86) 512 6767 2673
iNETest (Suzhou) Co., LtdUnit 13-14 3F Building A 5 Xing Han StreetSuzhou 215021 ChinaTel: (86) 512 6762 3789Fax: (86) 512 6762 3790
iNETest Resources (China) Co., Ltd (Shanghai Headquarters)Unit K 19F Hua Min Empire PlazaNo. 726 Yan An Road (W) Shanghai 200050 ChinaTel: (86) 21 5238 3300Fax: (86) 21 5238 3301
iNETest Resources (China) Co., Ltd(Shenzhen Rep Offi ce)Room 211, 2nd Floor, Block205,TaiRan Industrial Park,Che Gong Miao Area, FuTian, Shenzhen Shenzhen 518040 ChinaTel: (86) 755 8343 9855Fax: (86) 755 8343 4429
SV Probe (SIP) Co., LtdNo. B1-3 Weiting Industrial Square,Weixin Road, Suzhou Industrial ParkJiangsu Province 215122 ChinaTel: (86) 512 6275 2330Fax: (86) 512 6275 2275
TAIWAN
Ellipsiz Taiwan Inc.No. 251 Jen-Ru Road Junan Miaoli HsienTaiwan 350 R.O.C.Tel: (886) 3 656 1595Fax: (886) 3 552 0347
Ellipsiz Taiwan Second Source Inc. 3F No. 35 Sintai RoadJhubei City Hsin Chu County Taiwan 302 R.O.C. Tel: (886) 3 656 1595Fax: (886) 3 552 0347
Ellipsiz Communications Taiwan Ltd8F No. 96 Section 1 Jianguo North RoadJhongshan District Taipei City Taiwan 10489, R.O.C. Tel: (886) 2 2515 9596Fax: (886) 2 2500 0055
SV Probe Technology Taiwan Co., Ltd3F No. 35 Sintai RoadJhubei City Hsin Chu County Taiwan 302 R.O.C. Tel: (886) 3 656 5188Fax: (886) 3 554 4150
THAILAND
iNETest Resources (Thailand) Ltd(Bangkok Headquarters)719 4th Floor KPN Tower Rama 9 Road Kwaeng Bangkapi KhetHuaykwang Bangkok Thailand 10310Tel: (66) 2 717 1400Fax: (66) 2 717 1422
iRC Technologies Limited719 4th Floor KPN Tower Rama 9 Road Kwaeng Bangkapi KhetHuaykwang Bangkok Thailand 10310Tel: (66) 2 717 1400Fax: (66) 2 717 1422
NEW ZEALAND
Ellipsiz Communications (NZ) LimitedPencarrow House1-3 Willeston Street Level 7Wellington, New ZealandTel: (64) 4 495 8941Fax: (64) 4 495 8950
FRANCE
SV Probe Technology SAS17 Square Edouard VIIParis 75009 FranceTel: +33 (0) 1 4439 9514Fax: +33 (0) 9 7006 4901
USA
SV Probe Inc. (Corporate Headquarters)9185 South Farmer AvenueSuite 105Tempe, AZ 85284 USATel: (480) 635 4700Fax: (480) 558 7440
SV Probe Inc.(Santa Clara Facility)4251 Burton DriveSanta Clara CA 95054 USATel: (408) 727 6341Fax: (408) 492 1424
INDIA
iNETest Technologies India Pvt. Limited (Chennai Headquarters)11th Floor Block C & D Ega Trade Centre809 Poonamallee High Road Kilpauk Chennai 600010 IndiaTel: (91) 44 2661 0171 (91) 44 2640 0779 (91) 44 2640 0781Fax: (91) 44 2661 0172
iNETest Technologies India Pvt. Ltd(Bangalore)304-308 Sophia’s Choice, 3rd Floor7 St. Mark’s RoadBangalore 560001 IndiaTel: (91) 80 4272 0011 to 4272 0040 (91) 80 4272 0000Fax: (91) 80 4272 0010
iNETest Technologies India Pvt. Ltd(Mumbai)702 A - Wing Sagartech Plaza Andheri-Kurla Road Sakinaka Junction Mumbai 400072 IndiaTel: (91) 22 2852 3910Fax: (91) 22 2852 3907
iNETest Technologies India Pvt. Ltd(New Delhi)LB 2 Prakash Deep BuildingNo.7 Tolstoy Marg Connaught PlaceNew Delhi 110001 IndiaTel: (91) 11 2371 7548Fax: (91) 11 2371 7548
iNETest Technologies India Pvt. Ltd(Pune)Destination Centre, T17 3rd FloorMagarpatta City,HadapsarPune 411028 IndiaTel: (91) 20 6600 9804Fax: (91) 20 6600 9808
VIETNAM
SV Probe Vietnam Co., Ltd37A VSIP Street 6Vietnam Singapore Industrial ParkThuan An TownBinh Duong Province Vietnam 72500Tel: (84) 650 3784301/2/3, 3768855/6/7Fax: (84) 650 3784304, 3768858
iNETest Newtek Co. Ltd.(Hanoi Headquarters)Suite 401 Van Phuc Toserco Building, No 1294 Valley Kim Ma, Ba Dinh DistrictHanoi VietnamTel: (84) 4 3 787 5489Fax: (84) 4 3 787 5490
iNETest Newtek Co. Ltd.(Ho Chi Minh City Branch)Unit 0.1 Thanh Quan Building12C1 Nguyen Thi Minh Khai StDaKao Ward District 1HCMC VietnamTel: (84) 8 3 910 7488Fax: (84) 8 3 911 0711
CONTENTS
1 introduction 2 our vision and mission 3 about ellipsiz / our fi nancials at a glance4 our geographical footprint 6 letter to shareholders 8 operations review14 board of directors 16 key executives 17 corporate information 18 corporate governance26 fi nancial review 28 industry outlook 31 risks management 33 fi nancial statements106 statistics of shareholders 107 notice of annual general meeting / proxy form

Annual Report 2012
ON TRACK FORPROGRESS...
(Reg. No. 199408329R)
29 Woodlands Industrial Park E1#04-03 NorthTech Lobby 1 Singapore 757716Tel : (65) 6311 8500Fax : (65) 6269 2628Email : [email protected] : www.ellipsiz.com
ELLIP
SIZ
LTD
/ Annual R
eport 2
012