ellipsiz ltd and its subsidiaries registration number ...ellipsiz ltd and its subsidiaries financial...
TRANSCRIPT
Ellipsiz Ltd and its Subsidiaries Registration Number: 199408329R
Full Year Financial Information and
Dividend Announcement for the year ended
30 June 2017

Ellipsiz Ltd and its Subsidiaries Financial Information
Year ended 30 June 2017
2
Statements of Financial Position
Group Company Note 2017 2016 Var. 2017 2016 Var. $’000 $’000 % $’000 $’000 % Non-current assets Property, plant and equipment 2 10,984 11,840 (7) 5 4 25 Intangible assets 3 41,425 41,213 1 – – – Subsidiaries 4 – – – 79,749 79,602 – Associates 5 862 8,385 (90) – 4,868 (100) Joint ventures 71 68 4 – – – Financial assets 5,179 5,203 – 4,952 4,970 – Deferred tax assets 3,612 3,374 7 – 84 (100) 62,133 70,083 (11) 84,706 89,528 (5) Current assets Inventories 7,843 9,115 (14) – – – Trade and other receivables 35,036 37,157 (6) 187 187 – Amounts due from related parties – – – 251 361 (30) Cash and cash equivalents 6 53,762 40,036 34 23,091 16,938 36 96,641 86,308 12 23,529 17,486 35 Total assets 158,774 156,391 2 108,235 107,014 1
Equity attributable to Owners of
the Company Share capital 7 89,566 89,566 – 89,566 89,566 – Reserves 8 41,918 38,171 10 15,566 15,815 (2) 131,484 127,737 3 105,132 105,381 – Non-controlling interests 413 385 7 – – – Total equity 131,897 128,122 3 105,132 105,381 – Non-current liabilities Provisions 244 214 14 – – – Interest-bearing borrowings 9 205 471 (56) – – – Deferred tax liabilities 903 581 55 – – – 1,352 1,266 7 – – – Current liabilities Trade and other payables 21,917 22,572 (3) 1,459 1,426 2 Provisions 257 231 11 – – – Amounts due to related parties 74 72 3 546 – 100 Interest-bearing borrowings 9 946 3,347 (72) – – – Current tax payable 2,331 781 198 1,098 207 430 25,525 27,003 (5) 3,103 1,633 90 Total liabilities 26,877 28,269 (5) 3,103 1,633 90 Total equity and liabilities 158,774 156,391 2 108,235 107,014 1
The accompanying notes form an integral part of these financial information.

Ellipsiz Ltd and its Subsidiaries Financial Information
Year ended 30 June 2017
3
Consolidated Statement of Comprehensive Income Group Note 2017 2016 Var. $’000 $’000 % Revenue 116,666 118,735 (2) Cost of revenue (74,616) (76,863) (3) Gross profit 42,050 41,872 – Other income 10 2,546 2,936 (13) Distribution expenses (11,991) (13,362) (10) Administrative expenses (16,648) (17,245) (3) Research & development expenses (2,951) (3,616) (18) Other expenses (1,652) (588) 181 Results from operating activities 10 11,354 9,997 14 Finance income 105 99 6 Finance expenses (67) (163) (59) Net finance income/(expenses) 11 38 (64) (159) Share of results of associates (net of tax) 207 981 (79) Share of results of joint ventures (net of tax) – 54 (100) Profit before income tax 11,599 10,968 6 Income tax expenses 12 (3,106) (1,365) 128 Profit for the year 8,493 9,603 (12)
Other comprehensive income Items that are or may be reclassified subsequently to profit or
loss
Exchange differences arising from: - liquidation of a subsidiary reclassified to profit or loss (206) – 100 - disposal of an associate reclassified to profit or loss 41 – 100 - disposal of a joint venture reclassified to profit or loss – 137 (100) - monetary items forming part of net investments in foreign operations 383 (185) (307) - translation of financial statements of foreign operation 690 2,260 (69) Net change in fair value of available-for-sale financial assets (18) (2,553) (99) Net change in fair value of available-for-sale financial assets,
reclassified to profit or loss
1,578 401 294 Tax effect – – Other comprehensive income for the year, net of income tax 2,468 60 4,023 Total comprehensive income for the year 10,961 9,663 13
Profit attributable to: Owners of the Company 8,501 9,598 (11) Non-controlling interests (8) 5 (260) Profit for the year 8,493 9,603 (12)
Total comprehensive income attributable to: Owners of the Company 10,933 9,676 14 Non-controlling interests 28 (13) 315 Total comprehensive income for the year 10,961 9,663 13
Earnings per share 13 - Basic (cents) 5.09 5.74 (11) - Diluted (cents) 5.09 5.74 (11)
The accompanying notes form an integral part of these financial information.

Ellipsiz Ltd and its Subsidiaries Financial Information
Year ended 30 June 2017
4
Consolidated Statement of Changes in Equity
Group Share capital
Capital reserve
Fair value
reserve
Share- based
compen-sation
reserve
Exchange translation
reserve Retained earnings
Total attributable to Owners
of the Company
Non-controlling interests
Total equity
$’000 $’000 $’000 $’000 $’000 $’000 $’000 $’000 $’000 30 June 2016
Balance as at 1 July 2015 89,566 (11,648) 2,212 2,290 (12,415) 51,454 121,459 398 121,857
Total comprehensive
income for the year Profit for the year – – – – – 9,598 9,598 5 9,603 Other comprehensive
income
Exchange differences arising from the
- disposal of joint venture – – – – 137 – 137 – 137 - monetary items forming
part of net investments in foreign operations – – – – (185) – (185) – (185)
- translation of financial statements of foreign operations – – – – 2,278 – 2,278 (18) 2,260
Net change in fair value of available-for-sale financial assets – – (2,553) – – – (2,553) – (2,553)
Net change in fair value of available-for-sale financial assets, reclassified to profit or loss – – 401 – – – 401 – 401
Total other comprehensive income – – (2,152) – 2,230 – 78 (18) 60
Total comprehensive income for the year – – (2,152) – 2,230 9,598 9,676 (13) 9,663
Transactions with
Owners, recorded directly in equity
Contributions by and distributions to Owners
Final dividend of 0.67 cents per share in respect of 2015(1) – – – – – (1,114) (1,114) – (1,114)
Special dividend of 0.67 cents per share in respect of 2015(1) – – – – – (1,114) (1,114) – (1,114)
Interim dividend of 0.70 cents per share in respect of 2016 – – – – – (1,170) (1,170) – (1,170)
Total contributions by and distributions to Owners – – – – – (3,398) (3,398) – (3,398)
Total transactions with Owners – – – – – (3,398) (3,398) – (3,398)
Balance as at 30 June 2016 89,566 (11,648) 60 2,290 (10,185) 57,654 127,737 385 128,122
(1) On 30 October 2015, the Group completed a share consolidation of 10 existing issued ordinary shares into 3 ordinary shares. Accordingly,
restrospective adjustments have been made to the interim and final and special dividend in respect of 2015 (see note 7).
The accompanying notes form an integral part of these financial information.
Ellipsiz Ltd and its Subsidiaries Financial Information
Year ended 30 June 2017
5
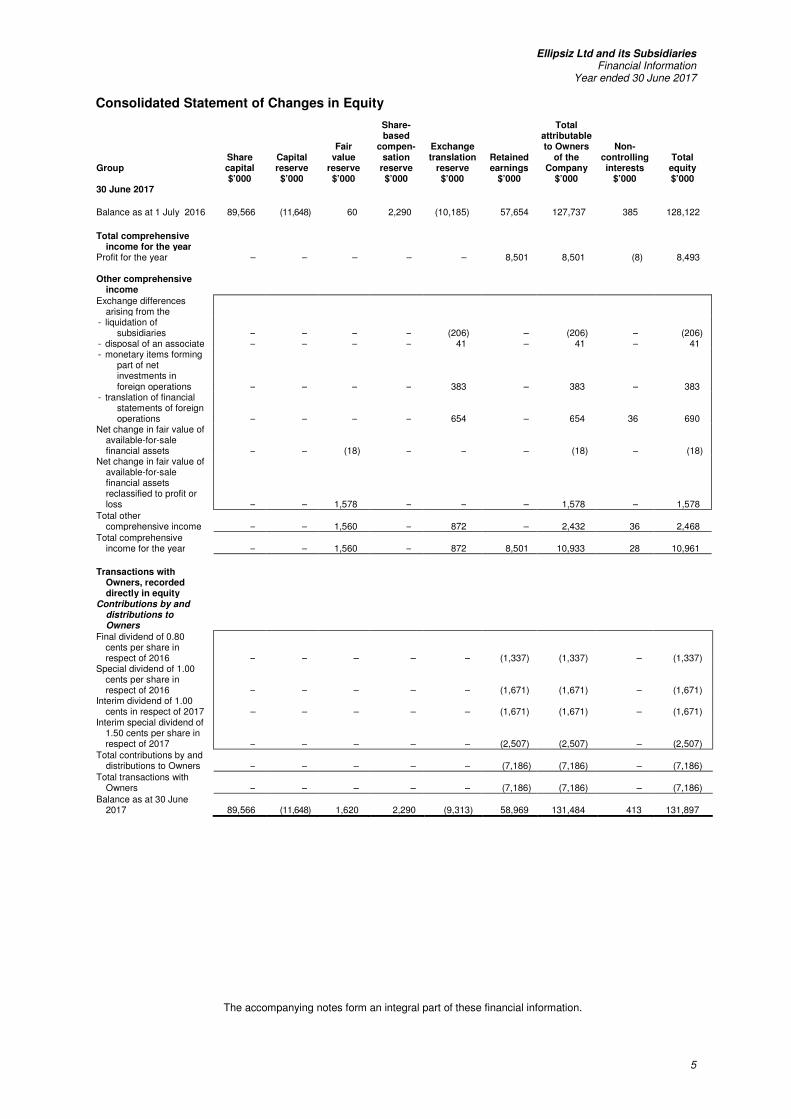
Consolidated Statement of Changes in Equity
Group Share capital
Capital reserve
Fair value
reserve
Share- based
compen-sation
reserve
Exchange translation
reserve Retained earnings
Total attributable to Owners
of the Company
Non-controlling interests
Total equity
$’000 $’000 $’000 $’000 $’000 $’000 $’000 $’000 $’000 30 June 2017
Balance as at 1 July 2016 89,566 (11,648) 60 2,290 (10,185) 57,654 127,737 385 128,122
Total comprehensive
income for the year Profit for the year – – – – – 8,501 8,501 (8) 8,493
Other comprehensive income
Exchange differences arising from the
- liquidation of subsidiaries – – – – (206) – (206) – (206)
- disposal of an associate – – – – 41 – 41 – 41 - monetary items forming
part of net investments in foreign operations – – – – 383 – 383 – 383
- translation of financial statements of foreign operations – – – – 654 – 654 36 690
Net change in fair value of available-for-sale financial assets – – (18) – – – (18) – (18)
Net change in fair value of available-for-sale financial assets reclassified to profit or loss – – 1,578 – – – 1,578 – 1,578
Total other comprehensive income – – 1,560 – 872 – 2,432 36 2,468
Total comprehensive income for the year – – 1,560 – 872 8,501 10,933 28 10,961
Transactions with
Owners, recorded directly in equity
Contributions by and distributions to Owners
Final dividend of 0.80 cents per share in respect of 2016 – – – – – (1,337) (1,337) – (1,337)
Special dividend of 1.00 cents per share in respect of 2016 – – – – – (1,671) (1,671) – (1,671)
Interim dividend of 1.00 cents in respect of 2017 – – – – – (1,671) (1,671) – (1,671)
Interim special dividend of 1.50 cents per share in respect of 2017 – – – – – (2,507) (2,507) – (2,507)
Total contributions by and distributions to Owners – – – – – (7,186) (7,186) – (7,186)
Total transactions with Owners – – – – – (7,186) (7,186) – (7,186)
Balance as at 30 June 2017 89,566 (11,648) 1,620 2,290 (9,313) 58,969 131,484 413 131,897
.
The accompanying notes form an integral part of these financial information.

Ellipsiz Ltd and its Subsidiaries Financial Information
Year ended 30 June 2017
6
Statement of Changes in Equity
Company Share capital
Fair value reserve
Share-based compensation
reserve Retained earnings
Total equity
$’000 $’000 $’000 $’000 $’000 30 June 2016 Balance as at 1 July 2015 89,566 2,212 2,290 12,248 106,316
Total comprehensive income for the year Profit for the year – – – 4,615 4,615 Other comprehensive income Net change in fair value of available-for-sale financial
assets – (2,553) – – (2,553) Net change in fair value of available-for-sale financial
assets, reclassified to profit or loss – 401 – – 401 Total other comprehensive income – (2,152) – – (2,152)
Total comprehensive income for the year – (2,152) – 4,615 2,463 Transactions with Owners, recorded directly in
equity Contributions by and distributions to Owners Final dividend of 0.67 cents per share in respect of
2015(1) – – – (1,114) (1,114) Special dividend of 0.67 cents per share in of respect of
2015(1) – – – (1,114) (1,114) Interim dividend of 0.70 cents per share in respect of
2016 – – – (1,170) (1,170) Total transactions with Owners – – – (3,398) (3,398) Balance as at 30 June 2016 89,566 60 2,290 13,465 105,381
30 June 2017 Balance as at 1 July 2016 89,566 60 2,290 13,465 105,381 Total comprehensive income for the year Profit for the year – – – 5,377 5,377 Other comprehensive income
Net change in fair value of available-for-sale financial assets, net of tax – (18) – – (18)
Net change in fair value of available-for-sale financial assets reclassified to profit or loss, net of tax – 1,578 – – 1,578
Total other comprehensive income – 1,560 – – 1,560 Total comprehensive income for the year – 1,560 – 5,377 6,937
Transactions with Owners, recorded directly in
equity Contributions by and distributions to Owners Final dividend of 0.80 cents per share in respect of 2016 – – – (1,337) (1,337) Special dividend of 1.00 cents per share in respect of
2016 – – – (1,671) (1,671) Interim dividend of 1.00 cents per share in respect of
2017 – – – (1,671) (1,671) Interim special dividend of 1.50 cents per share in
respect of 2017 – – – (2,507) (2,507) Total contributions by and distributions to Owners – – – (7,186) (7,186) Total transactions with Owners – – – (7,186) (7,186) Balance as at 30 June 2017 89,566 1,620 2,290 11,656 105,132
(1) On 30 October 2015, the Group completed a share consolidation of 10 existing issued ordinary shares into 3 ordinary shares. Accordingly,
retrospective adjustments have been made to the interim and final and special dividend in respect of 2015 (see note 7).
The accompanying notes form an integral part of these financial information.
Ellipsiz Ltd and its Subsidiaries Financial Information
Year ended 30 June 2017
7
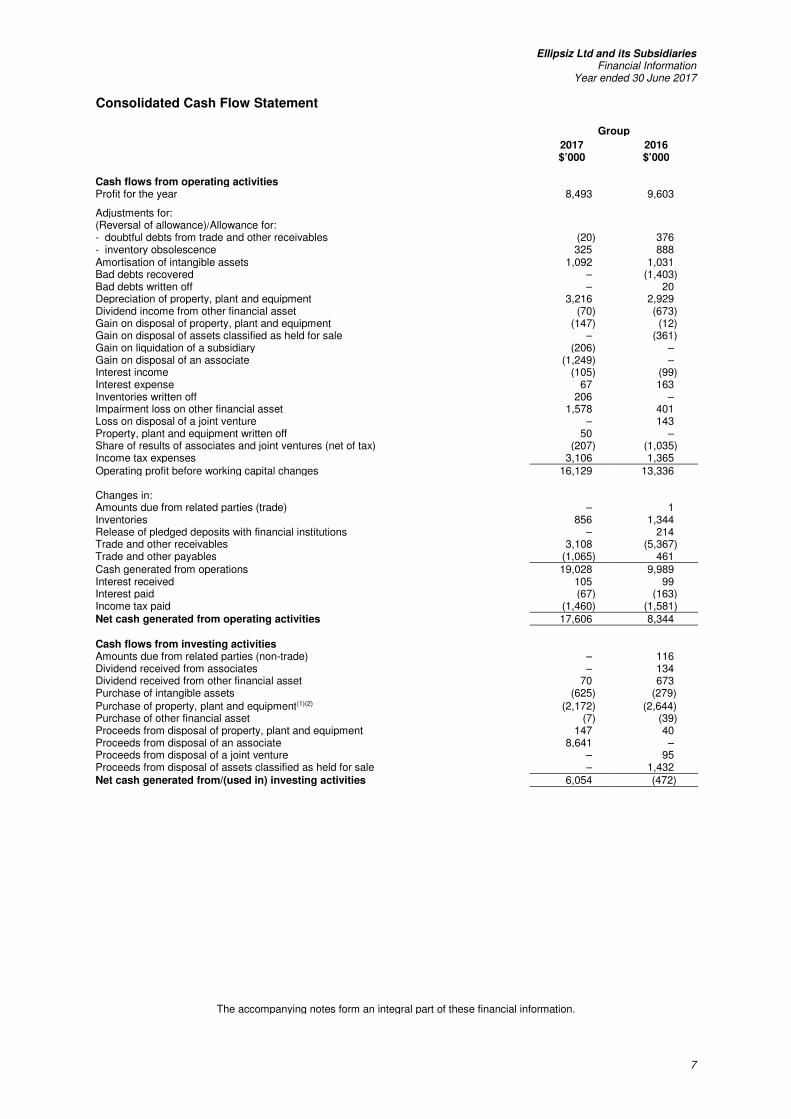
Consolidated Cash Flow Statement
Group
2017 2016 $’000 $’000 Cash flows from operating activities Profit for the year 8,493 9,603 Adjustments for: (Reversal of allowance)/Allowance for: - doubtful debts from trade and other receivables (20) 376 - inventory obsolescence 325 888 Amortisation of intangible assets 1,092 1,031 Bad debts recovered – (1,403) Bad debts written off – 20 Depreciation of property, plant and equipment 3,216 2,929 Dividend income from other financial asset (70) (673) Gain on disposal of property, plant and equipment (147) (12) Gain on disposal of assets classified as held for sale – (361) Gain on liquidation of a subsidiary (206) – Gain on disposal of an associate (1,249) – Interest income (105) (99) Interest expense 67 163 Inventories written off 206 – Impairment loss on other financial asset 1,578 401 Loss on disposal of a joint venture – 143 Property, plant and equipment written off 50 – Share of results of associates and joint ventures (net of tax) (207) (1,035) Income tax expenses 3,106 1,365 Operating profit before working capital changes 16,129 13,336
Changes in: Amounts due from related parties (trade) – 1 Inventories 856 1,344 Release of pledged deposits with financial institutions – 214 Trade and other receivables 3,108 (5,367) Trade and other payables (1,065) 461 Cash generated from operations 19,028 9,989 Interest received 105 99 Interest paid (67) (163) Income tax paid (1,460) (1,581) Net cash generated from operating activities 17,606 8,344 Cash flows from investing activities Amounts due from related parties (non-trade) – 116 Dividend received from associates – 134 Dividend received from other financial asset 70 673 Purchase of intangible assets (625) (279) Purchase of property, plant and equipment(1)(2) (2,172) (2,644) Purchase of other financial asset (7) (39) Proceeds from disposal of property, plant and equipment 147 40 Proceeds from disposal of an associate 8,641 – Proceeds from disposal of a joint venture – 95 Proceeds from disposal of assets classified as held for sale – 1,432 Net cash generated from/(used in) investing activities 6,054 (472)
The accompanying notes form an integral part of these financial information.
Ellipsiz Ltd and its Subsidiaries Financial Information
Year ended 30 June 2017
8
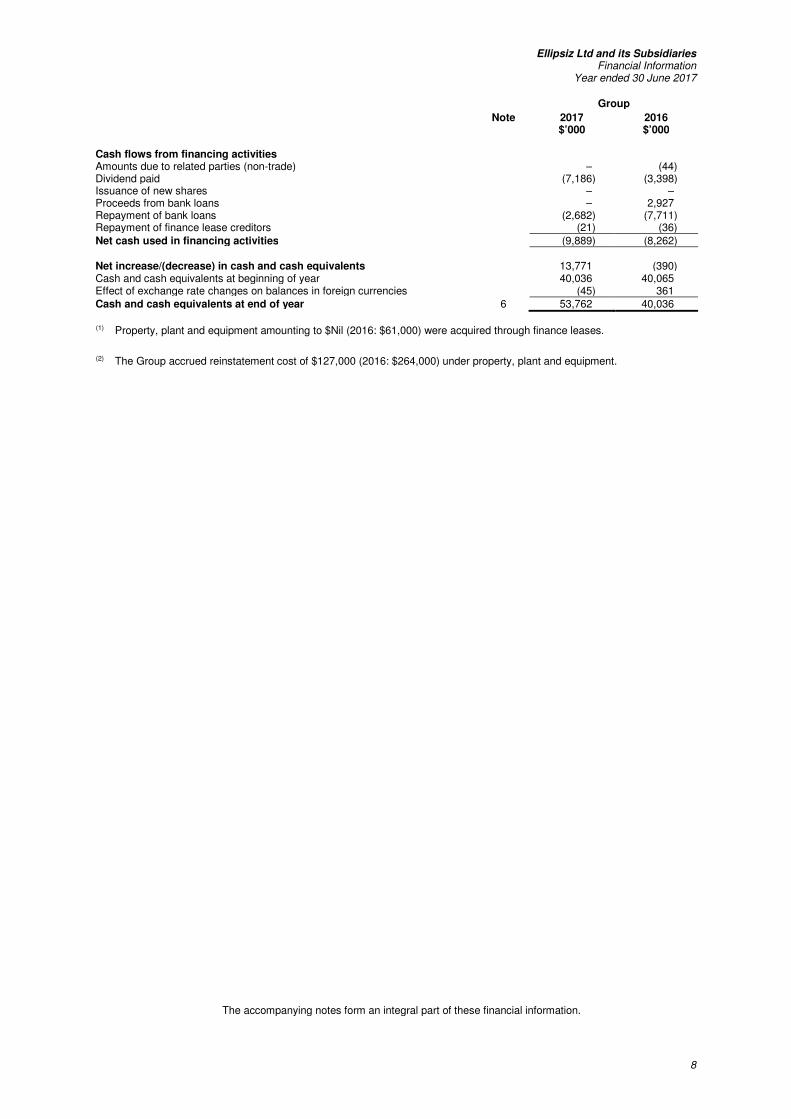
Group
Note 2017 2016 $’000 $’000 Cash flows from financing activities Amounts due to related parties (non-trade) – (44) Dividend paid (7,186) (3,398) Issuance of new shares – – Proceeds from bank loans – 2,927 Repayment of bank loans (2,682) (7,711) Repayment of finance lease creditors (21) (36)
Net cash used in financing activities (9,889) (8,262) Net increase/(decrease) in cash and cash equivalents 13,771 (390) Cash and cash equivalents at beginning of year 40,036 40,065 Effect of exchange rate changes on balances in foreign currencies (45) 361 Cash and cash equivalents at end of year 6 53,762 40,036
(1) Property, plant and equipment amounting to $Nil (2016: $61,000) were acquired through finance leases.
(2) The Group accrued reinstatement cost of $127,000 (2016: $264,000) under property, plant and equipment.
The accompanying notes form an integral part of these financial information.
Ellipsiz Ltd and its Subsidiaries Financial Information
Year ended 30 June 2017
9
Notes to the Financial Information
These notes form an integral part of the financial information. The announcement was authorised for issue by the directors on 21 August 2017. 1. Basis of Preparation
The Group has applied the same accounting policies and methods of computation in the financial information for the current reporting period as those used in the audited financial statements for the year ended 30 June 2016. In the current financial period, the Group and the Company have adopted all the new and revised Financial Reporting Standards (FRSs) and Interpretations of FRSs (INT FRSs) that are relevant to its operations and effective for annual periods beginning on 1 July 2016. The adoption of these new/revised FRSs and INT FRSs does not result in substantial changes to the Group’s and the Company’s accounting policies and has no material effect on the amounts reported for the current or prior periods.
The financial information were not audited or reviewed by the auditors.
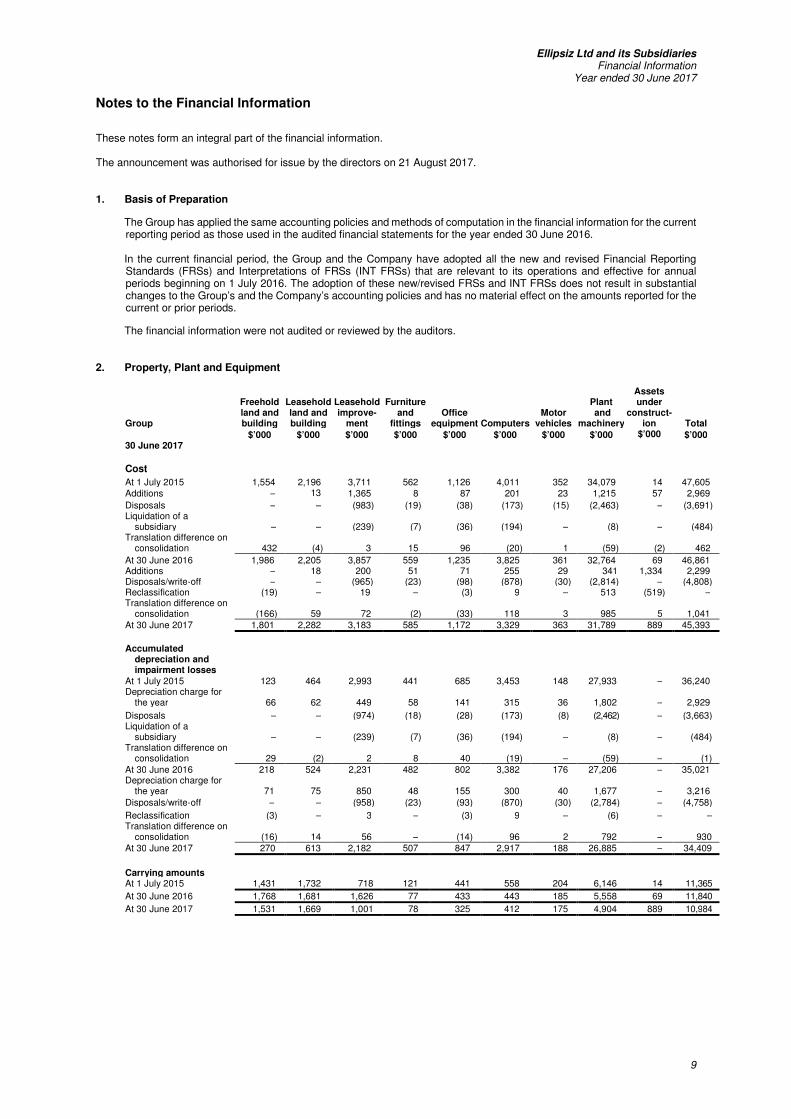
2. Property, Plant and Equipment
Group
Freehold land and building
Leasehold land and building
Leasehold improve-
ment
Furniture and
fittings Office
equipment Computers Motor
vehicles
Plant and
machinery
Assets under
construct-ion Total
$’000 $’000 $’000 $’000 $’000 $’000 $’000 $’000 $’000 $’000 30 June 2017 Cost
At 1 July 2015 1,554 2,196 3,711 562 1,126 4,011 352 34,079 14 47,605 Additions – 13 1,365 8 87 201 23 1,215 57 2,969
Disposals – – (983) (19) (38) (173) (15) (2,463) – (3,691) Liquidation of a
subsidiary – – (239) (7) (36) (194) – (8) – (484) Translation difference on
consolidation 432 (4) 3 15 96 (20) 1 (59) (2) 462
At 30 June 2016 1,986 2,205 3,857 559 1,235 3,825 361 32,764 69 46,861 Additions – 18 200 51 71 255 29 341 1,334 2,299 Disposals/write-off – – (965) (23) (98) (878) (30) (2,814) – (4,808) Reclassification (19) – 19 – (3) 9 – 513 (519) – Translation difference on
consolidation (166) 59 72 (2) (33) 118 3 985 5 1,041 At 30 June 2017 1,801 2,282 3,183 585 1,172 3,329 363 31,789 889 45,393
Accumulated
depreciation and impairment losses
At 1 July 2015 123 464 2,993 441 685 3,453 148 27,933 – 36,240 Depreciation charge for
the year 66 62 449 58 141 315 36 1,802 – 2,929
Disposals – – (974) (18) (28) (173) (8) (2,462) – (3,663) Liquidation of a
subsidiary – – (239) (7) (36) (194) – (8) – (484) Translation difference on
consolidation 29 (2) 2 8 40 (19) – (59) – (1) At 30 June 2016 218 524 2,231 482 802 3,382 176 27,206 – 35,021 Depreciation charge for
the year 71 75 850 48 155 300 40 1,677 – 3,216
Disposals/write-off – – (958) (23) (93) (870) (30) (2,784) – (4,758)
Reclassification (3) – 3 – (3) 9 – (6) – – Translation difference on
consolidation (16) 14 56 – (14) 96 2 792 – 930 At 30 June 2017 270 613 2,182 507 847 2,917 188 26,885 – 34,409
Carrying amounts At 1 July 2015 1,431 1,732 718 121 441 558 204 6,146 14 11,365
At 30 June 2016 1,768 1,681 1,626 77 433 443 185 5,558 69 11,840
At 30 June 2017 1,531 1,669 1,001 78 325 412 175 4,904 889 10,984

Ellipsiz Ltd and its Subsidiaries Financial Information
Year ended 30 June 2017
10
Company
Furniture and fittings
Office equipment Computers Total
$’000 $’000 $’000 $’000 30 June 2017 Cost At 1 July 2015 9 7 22 38 Additions – – 3 3 Write off – (2) (13) (15) At 30 June 2016 9 5 12 26 Additions 1 – 2 3 Write off – – (1) (1) At 30 June 2017 10 5 13 28 Accumulated depreciation At 1 July 2015 9 7 16 32 Depreciation charge for the year – * 5 5 Write off – (2) (13) (15) At 30 June 2016 9 5 8 22 Depreciation charge for the year * * 2 2 Write off – – (1) (1) At 30 June 2017 9 5 9 23 Carrying amounts At 1 July 2015 – – 6 6
At 30 June 2016 – – 4 4
At 30 June 2017 1 – 4 5
* Amount less than $1,000. Leasehold land and building and plant and machinery of the Group with carrying amounts of $Nil (2016: $1,477,000) and $486,000 (2016: $530,000) respectively, have been pledged to banks as securities for certain bank loans (note 9).
The carrying amount of property, plant and equipment includes amounts totalling $55,000 (2016: $76,000) for the Group in respect of assets acquired under finance leases (note 9). Depreciation for the year was included in the following line items of the statements of comprehensive income:
Group 2017 2016 $’000 $’000
Cost of revenue 2,340 2,186 Distribution expenses 190 134 Administrative expenses 483 461 Research and development expenses 203 148
3,216 2,929
3. Intangible Assets
Group Computer software
Technology licence
Intellectual property
Development expenditure Goodwill Total
$’000 $’000 $’000 $’000 $’000 $’000 30 June 2017 Cost At 1 July 2015 771 2,099 10,462 6,578 28,135 48,045 Additions – acquired 18 – – – – 18 Additions – internally developed 87 – – 174 – 261 Write off (49) – – – – (49) Liquidation of a subsidiary – – – – (744) (744) Translation difference on
consolidation 15 7 (15) (14) (20) (27) At 30 June 2016 842 2,106 10,447 6,738 27,371 47,504 Additions – acquired 338 – – – – 338 Additions – internally developed – – – 287 – 287 Write off (7) – – – – (7) Translation difference on
consolidation (1) 55 279 178 313 824 At 30 June 2017 1,172 2,161 10,726 7,203 27,684 48,946

Ellipsiz Ltd and its Subsidiaries Financial Information
Year ended 30 June 2017
11
Group Computer software
Technology licence
Intellectual property
Development expenditure Goodwill Total
$’000 $’000 $’000 $’000 $’000 $’000 Accumulated amortisation and
impairment losses At 1 July 2015 658 1,012 3,127 530 744 6,071 Amortisation for the year 71 112 477 371 – 1,031 Write off (49) – – – – (49) Liquidation of a subsidiary – – – – (744) (744) Translation difference on
consolidation 15 (5) (18) (10) – (18) At 30 June 2016 695 1,119 3,586 891 – 6,291 Amortisation for the year 93 112 751 136 – 1,092 Write off (7) – – – – (7) Translation difference on
consolidation – 29 93 23 – 145 At 30 June 2017 781 1,260 4,430 1,050 – 7,521 Carrying amounts At 1 July 2015 113 1,087 7,335 6,048 27,391 41,974
At 30 June 2016 147 987 6,861 5,847 27,371 41,213
At 30 June 2017 391 901 6,296 6,153 27,684 41,425
Amortisation for the year was included in the following line items of the statements of comprehensive income:
Group 2017 2016 $’000 $’000
Cost of revenue 1,055 1,011 Distribution expenses 1 – Administrative expenses 14 20 Research and development expenses 22 –
1,092 1,031
Annual impairment tests for cash-generating units containing goodwill For the purpose of impairment testing, goodwill is allocated to the Group’s cash-generating units (CGU) identified according to reportable segments as follows:
Group 2017 2016 $’000 $’000 Probe Card solutions 12,291 11,981 Distribution and Services solutions 15,393 15,390
27,684 27,371
The recoverable amount of a CGU is determined annually based on value-in-use calculations. These calculations use cash flow projections based on financial forecasts approved by management covering periods of one to five years. Key assumptions used for value-in-use calculations For the purpose of analysing each CGU, management used the following key assumptions:
Group
Revenue growth
rate Discount
rate % %
2017 Probe Card solutions 5.6 17.9 Distribution and Services solutions 4.1 12.2
2016 Probe Card solutions 5.1 15.4 Distribution and Services solutions 5.0 13.2
The weighted average growth rates used are based on the forecasts included in industry reports. The discount rates used are pre-tax and reflect specific risks relating to the relevant segments. No growth has been projected on the cash flows beyond the five-year period covered by the financial budget and projection.

Ellipsiz Ltd and its Subsidiaries Financial Information
Year ended 30 June 2017
12
4. Subsidiaries
During the year, (a) SV Probe Technology S.A.S., a wholly-owned subsidiary which was placed under liquidation previously, was dissolved
and ceased to be a subsidiary of the Group.
(b) Oriental International Technology Limited, a wholly-owned and inactive subsidiary in Hong Kong, was deregistered and ceased to be a subsdiary of the Group.
(c) its inactive wholly-owned subsidiary, Tokyo Cathode Laboratory (HK) Co. Limited, a corporation incorporated under
the laws of Hong Kong SAR, People’s Republic of China, has applied for de-registration under the laws of Hong Kong.
5. Associate
On 15 November 2016, the Company entered into a share purchase agreement with a third party, to dispose its entire 40% shareholding in Kita Manufacturing Co., Ltd for a cash consideration of US$6,000,000 (approximately $8,641,000).
The transaction was completed on 5 January 2017.
6. Cash and Cash Equivalents
Group Company 2017 2016 2017 2016 $’000 $’000 $’000 $’000 Cash at banks and in hand 44,757 32,434 15,976 9,871 Deposits with financial institutions 9,005 7,602 7,115 7,067 Cash and cash equivalents in the
consolidated statement of cash flows
53,762 40,036 23,091 16,938
7. Share Capital
Group and Company Group and Company 2017 2017 2016 2016 No. of shares Share capital No. of shares Share capital ’000 $’000 ’000 $’000 Fully paid ordinary shares, with no par value: Ordinary shares At 1 July 167,128 89,566 557,094 89,566 Reduction in number of shares arising from share consolidation – – (389,966) – As at 30 June 167,128 89,566 167,128 89,566
The Group had not acquired any treasury shares for the financial year ended 30 June 2017. There were no treasury shares held by the Group as at 30 June 2017 (2016: Nil). During its annual general meeting on 19 October 2015, the Company obtained approval from its members to consolidate every 10 existing issued ordinary share in the capital of the Company into 3 consolidated shares (“share consolidation”). The exercise was completed on 30 October 2015. The number of issued shares of the Company following the share consolidation exercise was 167,128,185.
8. Reserves
Group Company 2017 2016 2017 2016 $’000 $’000 $’000 $’000 Capital reserve (11,648) (11,648) – – Fair value reserve 1,620 60 1,620 60 Share-based compensation reserve 2,290 2,290 2,290 2,290 Exchange translation reserve (9,313) (10,185) – – Retained earnings 58,969 57,654 11,656 13,465 41,918 38,171 15,566 15,815

Ellipsiz Ltd and its Subsidiaries Financial Information
Year ended 30 June 2017
13
9. Interest-bearing Borrowings
Interest-bearing borrowings consist of the following:
Group 2017 2016 $’000 $’000 Non-current liabilities Secured bank loans – 44 Unsecured bank loans 164 366 Obligations under finance leases 41 61 205 471 Current liabilities Secured bank loans 48 838 Unsecured bank loans 882 2,492 Obligations under finance leases 16 17 946 3,347 1,151 3,818
Maturity of liabilities (excluding finance lease liabilities)
Group 2017 2016 $’000 $’000
Within 1 year 930 3,330 After 1 year but within 5 years 164 410 1,094 3,740
The borrowings are secured on the following assets:
Group Note 2017 2016 $’000 $’000 Leasehold land and building 2 – 1,477 Plant and machinery 2 486 530 Total carrying amount 486 2,007
Obligations under finance leases
2017 2016 Group Principal Interest Total Principal Interest Total $’000 $’000 $’000 $’000 $’000 $’000 Repayable within 1 year 16 3 19 17 4 21 Repayable after 1 year but within 5
years 41 2 43 61 5 66 57 5 62 78 9 87
10. Results from Operating Activities
Group 2017 2016 $’000 $’000 Other income Bad debts recovered – 1,403 Dividend income from other financial asset(1) 70 673 Exchange gain, net 6 – Gain on disposal of property, plant and equipment 147 12 Gain on disposal of assets classified as held for sale – 361 Gain on liquidation of a subsidiary 206 – Gain on disposal of an associate 1,249 – Rental income 67 29 Sundry income 801 458 2,546 2,936

Ellipsiz Ltd and its Subsidiaries Financial Information
Year ended 30 June 2017
14
Group Note 2017 2016 $’000 $’000 Other expenses (Reversal of allowance)/Allowance for doubtful debts from trade and other
receivables
(20) 376 Allowance for inventory obsolescence 325 888 Amortisation of intangible assets 3 1,092 1,031 Bad debts written off – 20 Depreciation of property, plant and equipment 2 3,216 2,929 Exchange loss, net – 12 Inventories written off 206 – Impairment loss on other financial asset 1,578 401 Loss on disposal of a joint venture – 143 Property, plant and equipment written off 50 – Operating lease expenses 2,367 2,406
Increase in depreciation expenses during the year was mainly due to expansion of certain facilities for Probe Card solutions business and purchase of new equipment during the financial year. (1) In FY2016, one of the quoted shares that the Company invested in, has delisted its shares and proceeded with the
voluntary liquidation process. The income received in FY2016 and FY2017 were the dividend distibutions during the liquidation process.
11. Net Finance Income/(Expenses)
Group 2017 2016 $’000 $’000 Finance income Interest income from: - financial institutions 105 90 - joint venture – 4 - third parties – 5
105 99
Finance expenses Interest expenses to: - finance leases (4) (4) - financial institutions (63) (159) (67) (163) Net finance income/(expenses) 38 (64)
12. Income Tax Expenses
Group 2017 2016 $’000 $’000 Current tax - current year 3,239 1,937 - withholding tax 282 157 - over provision in prior year (240) (31) - utilisation of previously unrecognised deferred tax assets (395) (645)
2,886 1,418
Group 2017 2016 $’000 $’000 Deferred tax - origination and reversal of temporary differences 574 816 - under/(over) provision in prior years 224 (504) - recognition of previously unrecognised deferred tax assets (578) (365)
220 (53)
Total income tax expenses 3,106 1,365

Ellipsiz Ltd and its Subsidiaries Financial Information
Year ended 30 June 2017
15
13. Earnings Per Share
Group 2017 2016 $’000 $’000 Basic earnings per share is based on: Profit for the year attributable to Owners of the Company 8,501 9,598
No. of shares No. of shares ’000 ’000
Weighted average number of: - shares outstanding during the year 167,128 167,128
Diluted earnings per share is the same as basic earnings per share as there are no potentially dilutive ordinary shares for both current and prior years.
14. Net Asset and Tangible Asset Values Per Ordinary Share
Group Company cents cents Net asset value per ordinary share based on issued share capital of the
Company as at: (a) 30 June 2017 78.67 62.91
(b) 30 June 2016 76.43 63.05
Net tangible asset value per ordinary share based on issued share capital of
the Company as at: (a) 30 June 2017 53.89 62.91
(b) 30 June 2016 51.77 63.05
Net tangible asset is equity attributable to Owners of the Company less intangible assets.
15. Breakdown of Revenue and Profit After Tax Before Deducting Non-Controlling Interests
Group 2017 2016 Variance $’000 $’000 % Revenue reported for first half year 57,318 57,639 (1) Profit after tax before deducting non-controlling interests for first half
year 2,321 3,574 (35) Revenue reported for second half year 59,348 61,096 (3) Profit after tax before deducting non-controlling interests for second
half year 6,172 6,029 2 16. Dividends
16.1 Dividend Paid
The resolution in respect of the final dividend and special dividend declared for the financial year ended 30 June 2016 was approved at the Company’s Annual General Meeting convened on 19 October 2016. The final and special tax exempt, one-tier cash dividend totalling 1.80 cents per ordinary share was paid on 18 November 2016.
The Company declared and paid a tax exempt one-tier interim dividend of 1.00 cents per share and interim special dividend of 1.50 cents per share on 16 March 2017.

Ellipsiz Ltd and its Subsidiaries Financial Information
Year ended 30 June 2017
16
16.2 Dividend Declared (Proposed)
2017 2016 Name of dividend Final
(Proposed) Final
Dividend type Cash Cash Dividend rate 2.00 cents per
ordinary 0.80 cents per ordinary share
Tax Tax exempt
(One-Tier) Tax exempt (One-Tier)
Name of dividend Final Special (Proposed)
Special
Dividend type Cash Cash Dividend rate 4.50 cents per
ordinary share 1.00 cent per ordinary share
Tax Tax exempt
(One-Tier) Tax exempt (One-Tier)
Date payable
The final and special dividends proposed, if approved at the 22nd Annual General Meeting, will be payable on 21 November 2017.
Book closure date
The book closure date is 30 October 2017, after 5.00 pm.
16.3 Annual Dividend
Net Dividend 2017 2016 $’000 $’000 Ordinary shares Interim dividend and interim special dividend 4,178 1,170 Final dividend and final special dividend 10,863(1) 3,008 15,041 4,178
(1) The final and special dividends for 2017 is estimated based on the number of ordinary shares issued by the Company
as at 30 June 2017. The dividends have not been provided for in the financial information.
17. Significant Related Party Transactions
Significant transactions with related parties are as follows:
Group 2017 2016 $’000 $’000 Rental expenses paid to a director (124) (132)
Pursuant to Rule 704(13) of the SGX Listing Manual, the person occupying a managerial position in the Company is the executive director, Kelvin Lum Wen-Sum, 43, the son of David Lum Kok Seng, a substantial shareholder of the Company.

Ellipsiz Ltd and its Subsidiaries Financial Information
Year ended 30 June 2017
17
18. Interested Person Transactions The Company does not have any general mandate from shareholders for interested person transactions (IPT). During the year, the total transactions with interested person are as follows:
Name of interested person Aggregate value of all interested person transactions during the financial period under review (excluding transactions less than $100,000 and transactions conducted under shareholder’s mandate pursuant to Rule 920)
Aggregate value of all interested person transactions conducted under shareholders’ mandate pursuant to Rule 920 (excluding transactions less than $100,000)
Chan Wai Leong (Director) Rental expenses
$’000 124
$’000 –
The total IPT of $124,000 is less than 3% of our audited consolidated net tangible assets of FY2016.
19. Commitments
Lease Commitments
As at 30 June 2017, commitments of the Group for minimum lease receivables and payments under non-cancellable operating leases are as follows:
Group 2017 2016 $’000 $’000 Payable: Within 1 year 1,711 1,785 After 1 year but within 5 years 4,166 2,543 After 5 years 30 21 5,907 4,349
Capital Commitments Capital commitments contracted but not provided for 45 256
Corporate guarantees
As at 30 June 2017, the Company provided corporate guarantees amounting to $17,022,000 (2016: $16,678,000) to banks for banking facilities made available to its subsidiaries, of which the subsidiaries have utilised $807,000 (2016: $2,439,000).
20. Other Information
Reportable segments
Distribution & Services
solutions Probe Card solutions Eliminations Consolidated
Group 2017 2016 2017 2016 2017 2016 2017 2016 $’000 $’000 $’000 $’000 $’000 $’000 $’000 $’000 Revenue and Expense Total revenue from external
customers 41,790 42,179 74,876 76,556 – – 116,666 118,735 Inter-segment revenue 1,085 828 – 3 (1,085) (831) – – 42,875 43,007 74,876 76,559 116,666 118,735
Segment results 2,883 1,706 11,700 9,095 (37) – 14,546 10,801
Unallocated corporate results (3,192) (804) 11,354 9,997 Share of results of associates
and joint ventures - allocated to reportable
segments 122 215 85 820 – – 207 1,035
Profit before finance income/(expenses) and taxation 11,561 11,032
Finance income 105 99 Finance expenses (67) (163) Income tax expense (3,106) (1,365) Non-controlling interests 8 (5) Profit for the year attributable to
Owners of the Company 8,501 9,598
Ellipsiz Ltd and its Subsidiaries Financial Information
Year ended 30 June 2017
18
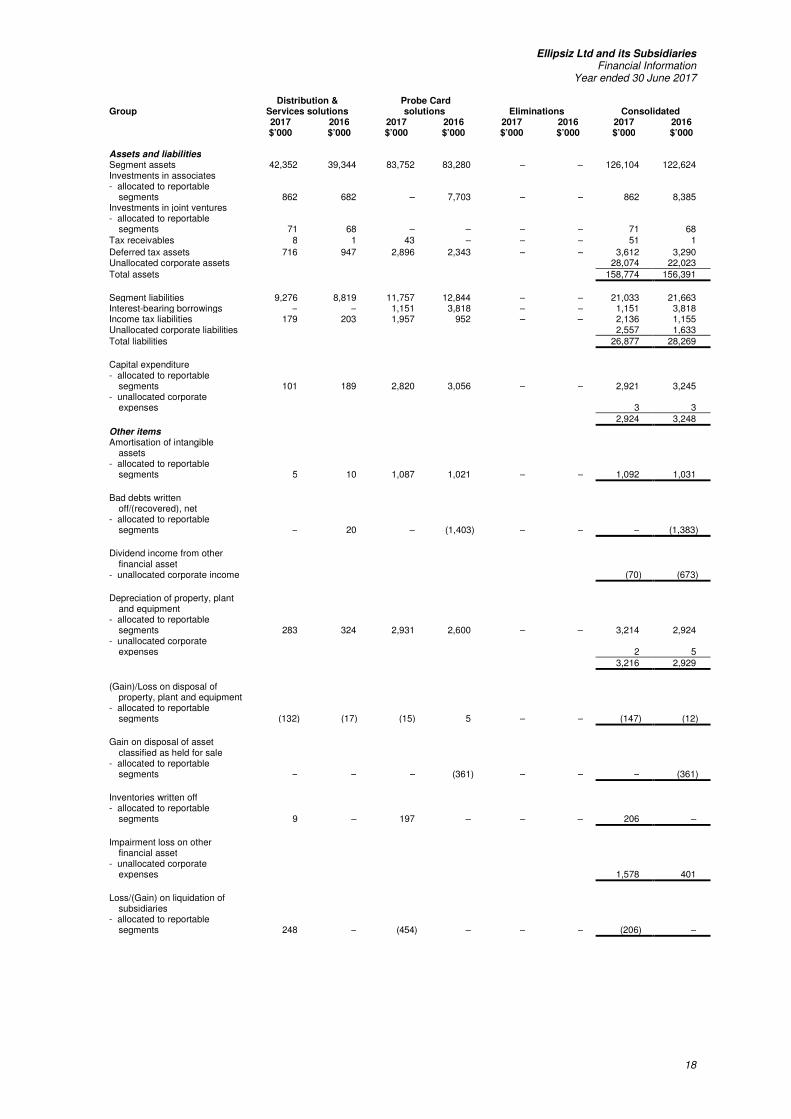
Group Distribution &
Services solutions Probe Card solutions Eliminations Consolidated
2017 2016 2017 2016 2017 2016 2017 2016 $’000 $’000 $’000 $’000 $’000 $’000 $’000 $’000 Assets and liabilities Segment assets 42,352 39,344 83,752 83,280 – – 126,104 122,624 Investments in associates - allocated to reportable
segments 862 682 – 7,703 – – 862 8,385 Investments in joint ventures - allocated to reportable
segments 71 68 – – – – 71 68 Tax receivables 8 1 43 – – – 51 1
Deferred tax assets 716 947 2,896 2,343 – – 3,612 3,290 Unallocated corporate assets 28,074 22,023
Total assets 158,774 156,391
Segment liabilities 9,276 8,819 11,757 12,844 – – 21,033 21,663 Interest-bearing borrowings – – 1,151 3,818 – – 1,151 3,818 Income tax liabilities 179 203 1,957 952 – – 2,136 1,155 Unallocated corporate liabilities 2,557 1,633 Total liabilities 26,877 28,269
Capital expenditure - allocated to reportable
segments 101 189 2,820 3,056 – – 2,921 3,245 - unallocated corporate
expenses 3 3 2,924 3,248
Other items Amortisation of intangible assets - allocated to reportable
segments 5 10 1,087 1,021 – – 1,092 1,031
Bad debts written
off/(recovered), net - allocated to reportable
segments – 20 – (1,403) – – – (1,383)
Dividend income from other
financial asset - unallocated corporate income (70) (673)
Depreciation of property, plant
and equipment - allocated to reportable
segments 283 324 2,931 2,600 – – 3,214 2,924 - unallocated corporate
expenses 2 5 3,216 2,929
(Gain)/Loss on disposal of
property, plant and equipment - allocated to reportable
segments (132) (17) (15) 5 – – (147) (12)
Gain on disposal of asset
classified as held for sale - allocated to reportable
segments – – – (361) – – – (361)
Inventories written off - allocated to reportable
segments 9 – 197 – – – 206 –
Impairment loss on other
financial asset - unallocated corporate
expenses 1,578 401
Loss/(Gain) on liquidation of
subsidiaries - allocated to reportable
segments 248 – (454) – – – (206) –

Ellipsiz Ltd and its Subsidiaries Financial Information
Year ended 30 June 2017
19
Group Distribution &
Services solutions Probe Card solutions Eliminations Consolidated
2017 2016 2017 2016 2017 2016 2017 2016 $’000 $’000 $’000 $’000 $’000 $’000 $’000 $’000 Gain on disposal of an associate - allocated to reportable
segments – – (1,249) – – – (1,249) –
Loss on disposal of a joint venture - allocated to reportable
segments – 143 – – – – – 143
(Reversal of
allowance)/Allowance for doubtful trade and other receivables
- allocated to reportable segments (20) 376 – – – – (20) 376
Allowance/(Reversal of
allowance) for inventory obsolescence
- allocated to reportable segments 14 (5) 311 893 – – 325 888
Property, plant and equipment
written off - allocated to reportable
segments 23 – 27 – – – 50 –

Ellipsiz Ltd and its Subsidiaries Financial Information
Year ended 30 June 2017
20
Geographical segments
In presenting information on the basis of geographical segments, segment revenue is based on the geographical location of customers. Segment assets are based on the geographical location of the assets.
Singapore Malaysia China Taiwan USA Japan Europe Other Regions Consolidated Group 2017 2016 2017 2016 2017 2016 2017 2016 2017 2016 2017 2016 2017 2016 2017 2016 2017 2016
$’000 $’000 $’000 $’000 $’000 $’000 $’000 $’000 $’000 $’000 $’000 $’000 $’000 $’000 $’000 $’000 $’000 $’000 Total revenue from
external customers 27,345 22,615 3,446 6,571 26,217 28,774 13,884 15,688 17,520 21,120 19,141 14,199 3,019 3,648 6,094 6,120 116,666 118,735
Non-current segment
assets 40,458 40,527 31 30 501 712 2,850 2,195 902 1,212 2,591 3,153 23 3 5,053 5,221 52,409 53,053 Investments in
associates – – – – – – – –
–
– – 7,703 – – 862 682 862 8,385 Investments in joint
ventures – – – – – – – –
–
–
–
– – – 71 68 71 68 Investments in other
financial assets 4,910 4,910 – – – – – – – – 227 233 42 60
–
– 5,179 5,203
Deferred tax assets – – – – – – – – – – – – – – – – 3,612 3,374
Total non-current assets 45,368 45,437 31 30 501 712 2,850 2,195 902 1,212 2,818 11,089 65 63 5,986 5,971 62,133 70,083
Capital expenditure 372 253 14 14 239 58 1,411 1,118 360 851 175 603 – – 353 351 2,924 3,248
Ellipsiz Ltd and its Subsidiaries Financial Information
Year ended 30 June 2017
21
CONFIRMATION BY THE BOARD
PURSUANT TO RULE 720(1) OF THE SGX-ST LISTING MANUAL
We further confirm that the Company has procured undertakings from the Company’s directors and executive officers in the
format set out in Appendix 7.7 under Rule 720(1) of the SGX-ST Listing Manual.
On behalf of the Board of Directors.
Chan Wai Leong Chief Executive Officer
Kelvin Lum Wen-Sum Executive Director Singapore
21 August 2017