elsa de sá caetano - repositorio-aberto.up.pt
TRANSCRIPT

Elsa de Sá Caetano
Trabalho CI-58
Development of a vision system for vibration analysis
SILVA, S., BATEIRA, J. & CAETANO, E.
2nd Int. Conf. on Experimental Vibration Analysis for Civil Engineering
Structures, EVACES’07, Porto, Portugal, 2007
Experimental Vibration Analysis for Civil Engineering Structures 113
ABSTRACT: Recent progress in image acquisition and analysis systems opened the door to the application in structural vibration monitoring. The proposed system is targeted to operate together with traditional vibration monitoring systems providing additional valued information or to operate in situations were the number of points to analyze would be impossible or costly with the existing systems. Ambient vibration and forced vibration subjects are analyzed together providing means for correlation of the structure vibration itself with its sources. This paper describes the major characteristics of the developed vision system and exemplifies the major advantages and drawbacks based on the presented applications concerning cable vibrations in a cable-stayed bridge and other kinds of bridges. 1 INTRODUCTION The evolution of image analysis during the last decade has shown the immense potential of vision systems in the context of structural monitoring. In effect, not only there has been a continuous upgrading of computation power, but also better cameras have been produced, with higher frame rates, higher resolutions, and with low distortion lenses. This scenario allows the development of new and more powerful, and also computationally heavier image analysis algorithms, triggering the interest to different applications, like the vibration monitoring of full scale Civil Engineering structures.
The current monitoring systems for vibration analysis, based on networks of accelerometers and strain gages distributed along the structures, provide extremely precise data, with the inconveniences of cost of the devices and electrical cables, when a large number and extension are required, respectively, and of the significant labor in their installation. On another hand, vision systems have the advantage of easy installation for collection of images at long distances, the inconvenience being the heavier processing algorithms and the precision of measurements when compared to conventional accelerometers or strain gages. There are however particular applications in the Civil Engineering domain where the lower precision is not a great inconvenience when compared to the advantages provided. Such is the case of the monitoring of cable vibrations in cable-stayed bridges or of the detection of the correlation between pedestrians and the structure in footbridges. For these situations, the installation of multiple sensors is virtually impossible, given the large number of cables and pedestrians. On the contrary, using only one or two cameras, it is possible to easily acquire video images from which the simultaneous vibration or motion of a large number of cables or pedestrians can be traced. Also vibrations of cables and motion of pedestrians (in the case of lock-in) are one or more orders of magnitude higher than the structural vibration of current Civil Engineering structures, therefore the precision required for image measurements is not so high as for the later structures.
Development of a vision system for vibration analysis
S. Silva, J. Bateira, E. Caetano Faculty of Engineering of the University of Porto, Portugal
114 EVACES’07
A vision system like the presented in this paper intends to be a complement to the traditional vibration monitoring systems and can provide an important second data source to achieve a more complete monitoring, for example by enabling the detection of cable vibration events that can be used as triggers for acquisition by conventional monitoring systems.
Using an Optical Flow algorithm for image analysis the system is able to follow the movement of several points of a structure. This algorithm allows the analysis of the movement at pixel level. The points analyzed can be defined automatically (e.g. midpoints of the lines that define the structure contour in the image) or determined by the user. In either case, the output of this algorithm is a set of time series that express movement/vibration of specified targets regardless of the scene being analyzed.
In terms of image analysis techniques for pedestrians tracking we have used image differences to get the moving objects, and morphologic operations to filter the undesired ones. A labeling algorithm is also applied to identify each person’s movement individually. At the end we have a bounding box around each one inside of which we identify the head of the person to later correlate its movement with deck and/or cable vibration.
To validate our system we conducted experiments on three pedestrian bridges located in Portugal, namely at Coimbra (shallow arch), Viana do Castelo (cable-stayed), and in Porto, at FEUP (stress-ribbon). The experiments consisted in exciting the bridge decks with a few pedestrians (two to four persons) walking and running across the bridge, and also jumping in specific locations of the deck. The structural vibration and movement of the pedestrians were acquired using the described techniques and the results compared to the ones obtained by traditional vibration instrumentation systems (seismographs and inertial units). A signal analysis was performed which enabled a better comparison with the results obtained from other sources. This revealed a high correspondence between the detected vibrations and the ones measured using the traditional systems. It was also possible to correlate the excitation frequency of the moving subjects to the vibration frequency of the structures and to correlate the beginning and end of the structural vibrations induced by the presence of these subjects. Analyzing these results we were able to validate the described system as being able to accurately monitor the structural vibrations and their source.
Although only pedestrian bridges were tested during the development of this system, its use is not limited to this kind of structures. Any structure that exhibits a vibration movement within the limits of this system analysis capability can be monitored in the exact same way. 2 SYSTEM DESCRIPTION 2.1 Overview This system was designed to work in conjunction with other vibration acquisition and analysis systems. The main purpose is to monitor the vibration in several points of large structures (like bridges) and trigger the data acquisition of other systems.
In opposition to other machine vision vibration analysis systems [3,5], this is tailored to monitor the structure has a whole and not just one element (although this is also possible). The system is capable to process in real-time a set of previously selected points in the structure and to obtain the time series describing their vibration. A simple frequency domain analysis is then performed and the information about the frequencies and magnitudes of oscillation are retrieved. With this information several different triggers can be easily programmed by the user.
When real-time processing is not needed, more refined algorithms can be used and in addition to the vibration detection of structural elements, and motion tracking of subjects can be performed. In both modes, the obtained time series can be used to do a rough structural modal analysis.
If the analyzed structure is, for instance, a cable-stayed footbridge, it is interesting to correlate de pedestrians’ activity with deck and cables vibrations [4]. To do so we have developed
Experimental Vibration Analysis for Civil Engineering Structures 115
tracking algorithms that allow the system to characterize the pedestrians' trajectory (the persons’ heads, to be more specific) on both time/space and frequency domain, while they walk through the bridge in a plane that is perpendicular to the camera, or when they jump in particular locations of the deck. In this initial phase we found interesting to experiment the intervention of only two to four persons on the running and jumping tasks, and to perform them quite spatially separated, with no superposition, in order to clearly identify each person and do an individual tracking. Nevertheless, we are positive that, in the future, the system can go further and reach the automatic identification of pedestrians in a cluttered scenario.
Even if the analyzed bridge is not cable-stayed, one can correlate the pedestrians’ motion with deck’s vibration, and take advantage of a complete spatial, temporal and spectral knowledge of these moving sources of vibration.
The developed algorithms of persons’ motion tracking do not require training tasks or any kind of previous learning. A system initialization may only be required to select a region of interest in experiments with persons jumping in a specific location, to remove the undesired moving objects that disturb the analyses, situation in which we can apply this restriction.
The main limitations of the system are the resolution and maximum frame rate of the camera. In many cameras the resolution/frame rate is a tradeoff. With a frame rate of 30fps one can describe vibration modes up to 15Hz, although this theoretical limit is some what lower in practice. The signal to noise rate (SNR) is highly dependent of the amplitude of the vibrations in relation to the imaging area. For the same vibration amplitude a larger area means lower SNR and a smaller area means higher SNR.
2.2 Hardware The system is formed by a set of digital cameras mounted with high quality low distortion lenses, a computer for image processing and a data storage unit.
The cameras used here were chosen for their ability to acquire high resolution images at high frame rates. They are capable of progressive scanning instead of the typical interlaced scanning common in commercial low grade cameras. This is of utmost importance because we are interested in analyzing movement with high frequency components and the interlacing introduces artifacts and distortion in the recorded images with this kind of movement. The cameras have a trigger feature that enables synchronized image acquisition. This synchronization can be obtained through a master clock, such as a GPS with configurable frequency time pulse or some other kind of clock. This enables the correlation between images acquired with different cameras and data from other sources. Because this system has to work in outdoor environments, special care must be made with the behavior of the cameras with changing illumination conditions. In opposition to common industrial/scientific machine vision applications were the light is set up as to uniformly illuminate in a constant manner the objects of interest, in structural vibration analysis system the light varies greatly within the scene of interest and with time (e.g. the illumination conditions at 9:00 AM are certainly different from the illumination conditions at 1:00 PM). Because of this, the camera has to be able to adjust its sensor gain and exposition time to accommodate these variations and provide a steady exposure.
The lenses used are standard among machine vision applications; they have to have good controlled and easily correctable distortion (e.g. the spatial distortion characteristic must be well approximated by a polynomial) and suitable resolution.
The processing unit should support the two operation modes of the system: real time image processing and image recording. The latter is simple to achieve using a standard modern portable computer; the former is however more demanding as the algorithms are of high complexity. Nevertheless real time computation is still in reach of modern portable low power computers.
The acquired data is stored in a hard-disk adequate for handling high quality video. Some care has to be taken in the housing of the cameras/lenses. The housing should be
ventilated and the glass window should have a special heating system to prevent condensed
116 EVACES’07
water to accumulate in it. Ideally the glass window should have a UV filtering capability and a water and dust repellent coating. 2.3 Image processing algorithms and software In this section we will describe the algorithms used to perform the vibration estimation and motion tracking.
Before processing the images, these are filtered in the time dimension. The cut-off frequency is a trade off between signal-to-noise rate and maximum detectable frequency that it establishes. An automatic gain control loop / histogram equalization is applied to maintain a constant image brightness. This is necessary because of the flicker caused by the automatic exposure loop of the camera. The images are also filtered in the spatial dimensions to reduce noise. 2.3.1 Image processing algorithms for structural analysis Because we are interested in analyzing images covering large areas, common motion tracking algorithms that rely on some kind of template matching or geometrical property fail. The relative amplitude of the motion compared to the image area is very small and in the order of only a few pixels. Instead we propose an approximation based on the optical flow algorithm. The optical flow is a vector field that describes the image intensity changes. If a motion of an object induces changes in the image intensity values then, after suitable camera/lens calibration and after consideration of the point of view, this object movement can be estimated by its optical flow. The optical flow algorithm gives an estimate of the horizontal and vertical optical flow based on the image brightness components. This is made solving the following differential equation:
0x y tI u I v I⋅ + ⋅ + = (1.1)
where xI , yI and tI are the horizontal, vertical and time domain image intensity derivatives, and u , v are the horizontal and vertical optical flow components, respectively.
There are many methods to numerically solve this equation; one that gives good results and is suitable for real-time implementation is the Lucas-Kanade method [1, 2]. The Lucas-Kanade method divides the image into smaller sections and assumes constant velocity in each section. Then it performs a weighted least-squares fit of the optical flow constraint equation to a constant model for 1.1 in each section.
Retrieving motion with a camera is very prone to the motion of the camera itself. More so if one uses a very long focal distance lens (tele-lens). Using this system one can monitor a known fixed point and estimate the camera movement. This estimation can then be applied to the motion estimation of the objects of interest. 2.3.2 Image processing algorithms for subject motion tracking The subject motion tracking is carried out in a different way in comparison with the structural motion. In this case the motion is quite large (several pixels between frames) and classic techniques were found to be more robust and less time consuming in this type of movement analysis. Nevertheless it is possible to integrate the optical-flow and the described approach to obtain an even better performance in some cases (particularly when there is occlusion and the velocity estimate can be used in a Kalman filter).
The first step of this algorithm is to detect the motion. Since the scene elements that are moving along the frames’ sequence are mainly the pedestrians, this can be achieved using background subtraction techniques. The moving objects are, thus, obtained using temporal differences between each frame and the background frame. The background frame is an image that is captured without the targets of interest being present. A threshold is used to eliminate insignificant differences between both frames.
Experimental Vibration Analysis for Civil Engineering Structures 117
For walking or running pedestrians’ experiments we have used this technique to obtain the pedestrians silhouette. In order to clean the remaining noise from the differences image, we’ve used a sequence of morphological operators. First we apply an opening operator to remove the noise, and then a closing operator to connect the object parts. However there are some remaining objects that should not be detected. Since they are small objects, comparing to the pedestrians silhouette (bridge components like the handrail or the deck, with significant motion components), we have introduced a criterion to eliminate objects which area is bellow a certain fraction of the mean area of all detected moving objects. Then a labeling algorithm is applied to identify each subject and a bounding box is created around each one. The regions restricted by these bounding boxes are then analyzed for the detection of the subjects’ heads. We can easily see that the vertical projection of the differences image (the silhouette) has the shape of a Gauss function. The maximum of this projection is the central line of the silhouette, were the head is intercepted. To determine the top of the head, we analyze the silhouette in a region defined by a neighborhood around the central line. The top of the head is, thus, obtained by detecting the upper point of the silhouette in this neighborhood.
In the other case presented here, when pedestrians are jumping, given that the corresponding horizontal motion is not significant, we can restrict the analyzing area to a small region of interest, in order to avoid undesired moving objects. The same background subtraction technique is used to obtain a binary image (black and white) of the subjects’ silhouette. In this case the vertical projection of the pedestrians also looks like a group of Gauss functions. In order to estimate each subject’s horizontal position we filter this projection with a Gaussian (one-dimensional) filter. Then the same process is used to detect the top of each subjects head: the filtered projections’ local maxima correspond to each silhouette’s central line; the heads’ tops are the upper points of the silhouettes, in a defined neighborhood around each central line. 3 RESULTS
3.1 Coimbra (shallow arch) footbridge
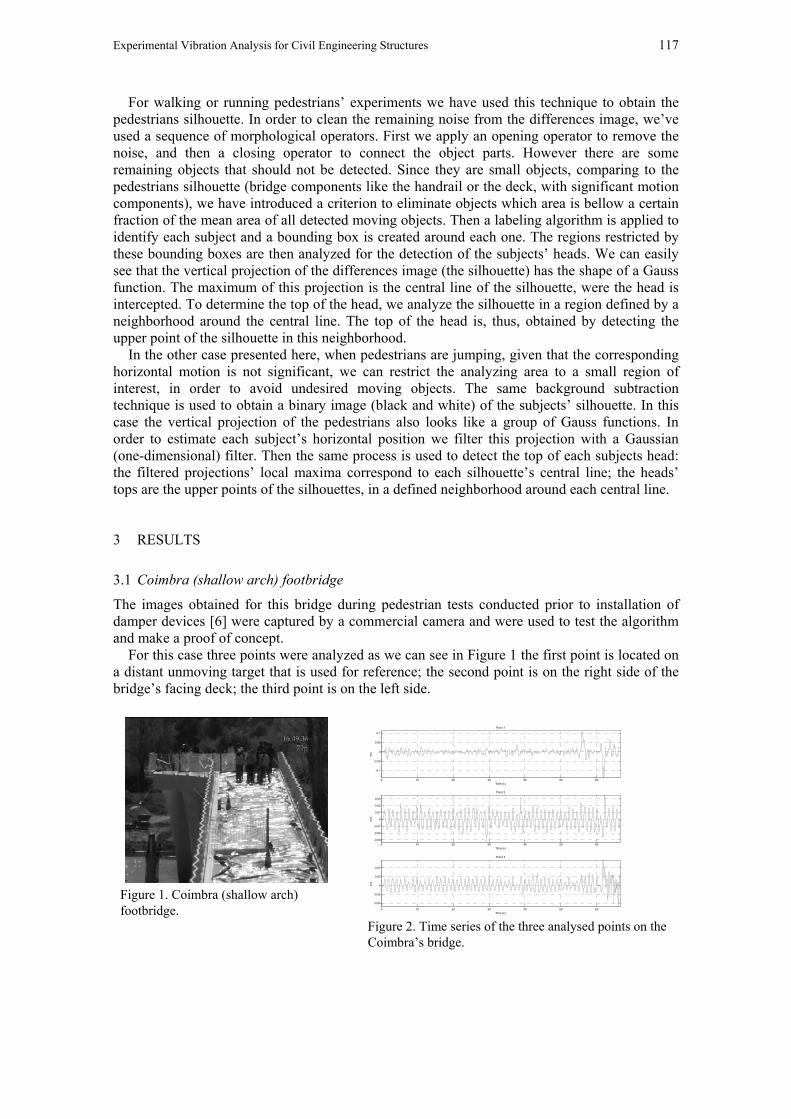
The images obtained for this bridge during pedestrian tests conducted prior to installation of damper devices [6] were captured by a commercial camera and were used to test the algorithm and make a proof of concept.
For this case three points were analyzed as we can see in Figure 1 the first point is located on a distant unmoving target that is used for reference; the second point is on the right side of the bridge’s facing deck; the third point is on the left side.
Figure 1. Coimbra (shallow arch) footbridge.
0 10 20 30 40 50 60
-0.1
-0.05
0
0.05
0.1
m/s
Time (s)
Point 1
0 10 20 30 40 50 60-0.03
-0.02
-0.01
0
0.01
0.02
0.03
m/s
Time (s)
Point 2
0 10 20 30 40 50 60
-0.04
-0.02
0
0.02
0.04
m/s
Time (s)
Point 3
Figure 2. Time series of the three analysed points on the Coimbra’s bridge.
118 EVACES’07
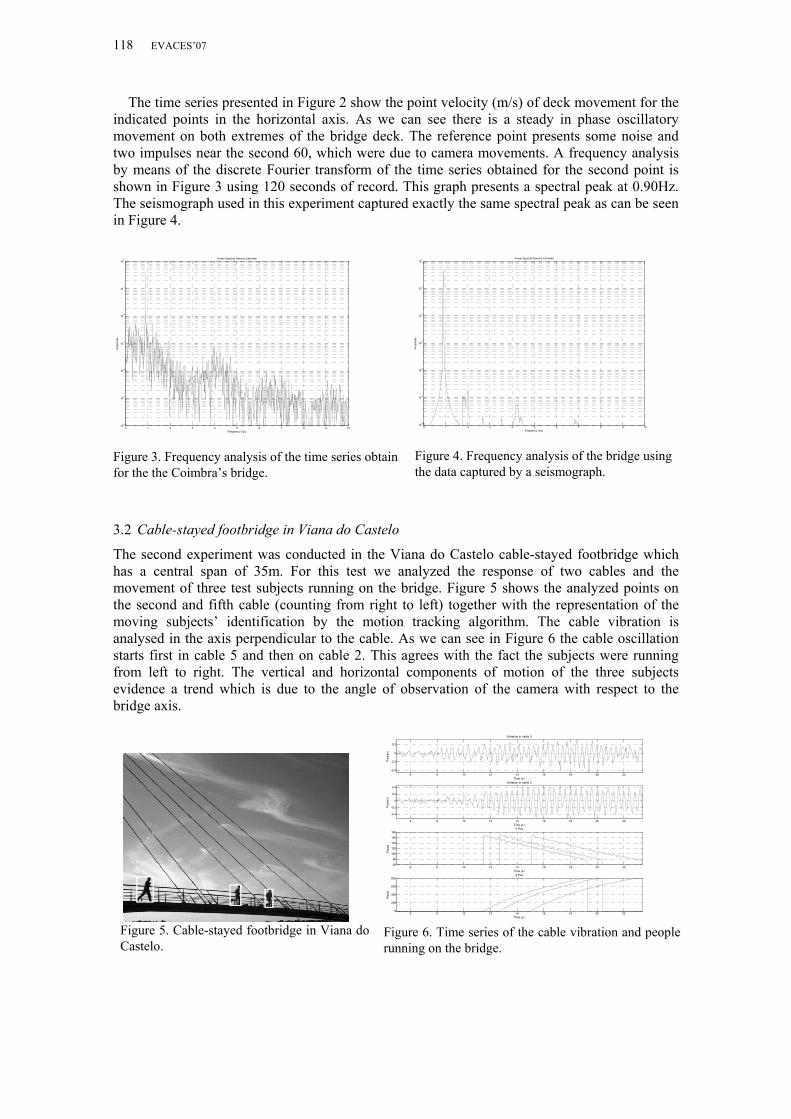
The time series presented in Figure 2 show the point velocity (m/s) of deck movement for the indicated points in the horizontal axis. As we can see there is a steady in phase oscillatory movement on both extremes of the bridge deck. The reference point presents some noise and two impulses near the second 60, which were due to camera movements. A frequency analysis by means of the discrete Fourier transform of the time series obtained for the second point is shown in Figure 3 using 120 seconds of record. This graph presents a spectral peak at 0.90Hz. The seismograph used in this experiment captured exactly the same spectral peak as can be seen in Figure 4.
0 1 2 3 4 5 6 7 8 9 1010-6
10-5
10-4
10-3
10-2
10-1
100
Power Spectral Density Estimate
Am
plitu
de
Frequency (Hz)
Figure 3. Frequency analysis of the time series obtain for the the Coimbra’s bridge.
0 1 2 3 4 5 6 7 8 9 1010
-6
10-5
10-4
10-3
10-2
10-1
100 Power Spectral Density Estimate
Am
plitu
de
Frequency (Hz)
Figure 4. Frequency analysis of the bridge using the data captured by a seismograph.
3.2 Cable-stayed footbridge in Viana do Castelo
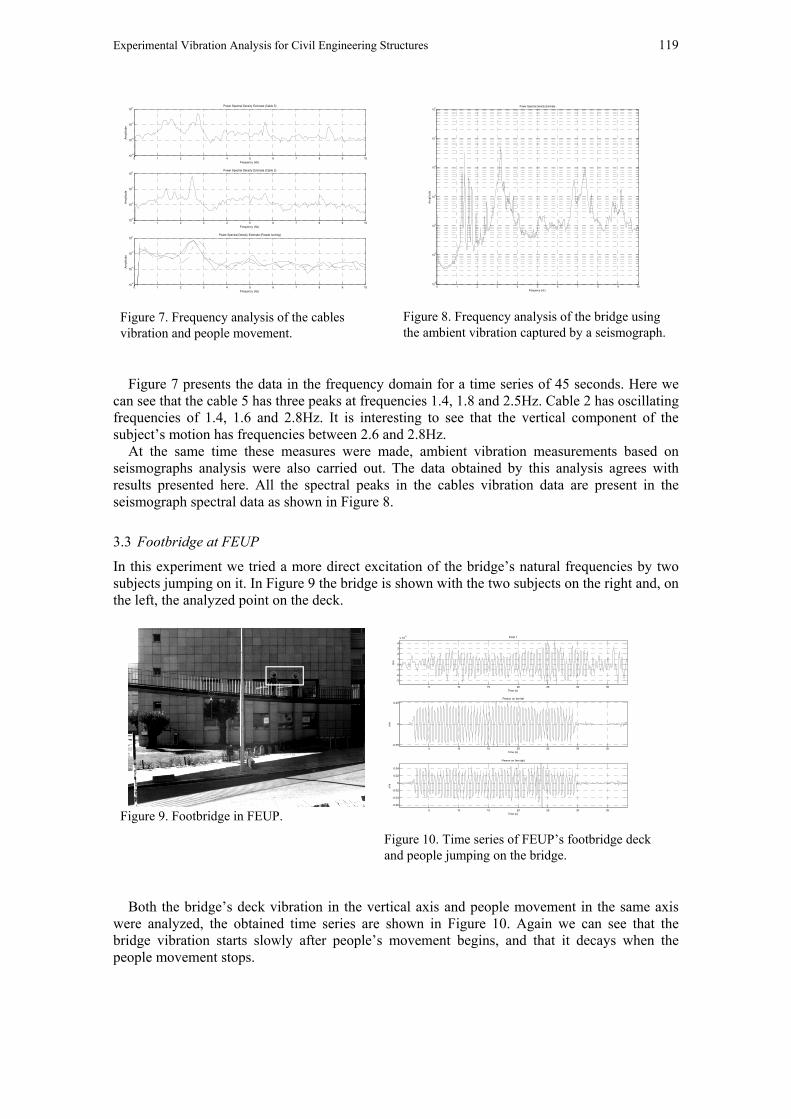
The second experiment was conducted in the Viana do Castelo cable-stayed footbridge which has a central span of 35m. For this test we analyzed the response of two cables and the movement of three test subjects running on the bridge. Figure 5 shows the analyzed points on the second and fifth cable (counting from right to left) together with the representation of the moving subjects’ identification by the motion tracking algorithm. The cable vibration is analysed in the axis perpendicular to the cable. As we can see in Figure 6 the cable oscillation starts first in cable 5 and then on cable 2. This agrees with the fact the subjects were running from left to right. The vertical and horizontal components of motion of the three subjects evidence a trend which is due to the angle of observation of the camera with respect to the bridge axis.
Figure 5. Cable-stayed footbridge in Viana do Castelo.
6 8 10 12 14 16 18 20 22-0.4
-0.2
0
0.2
Pix
els/
s
Time (s)
Vibration in cable 5
6 8 10 12 14 16 18 20 22
-0.4
-0.2
0
0.2
0.4
Pix
els/
s
Time (s)
Vibration in cable 2
6 8 10 12 14 16 18 20 2260
80
100
120
140
160
180
Pix
els
Time (s)
Y Pos
6 8 10 12 14 16 18 20 220
200
400
600
800
Pix
els
Time (s)
X Pos
Figure 6. Time series of the cable vibration and people running on the bridge.
Experimental Vibration Analysis for Civil Engineering Structures 119
0 1 2 3 4 5 6 7 8 9 1010-6
10-4
10-2
100Power Spectral Density Estimate (People running)
Am
plitu
de
Frequency (Hz)
0 1 2 3 4 5 6 7 8 9 1010-6
10-4
10-2
100Power Spectral Density Estimate (Cable 5)
Am
plitu
de
Frequency (Hz)
0 1 2 3 4 5 6 7 8 9 1010-6
10-4
10-2
100Power Spectral Density Estimate (Cable 2)
Am
plitu
de
Frequency (Hz)
Figure 7. Frequency analysis of the cables vibration and people movement.
0 1 2 3 4 5 6 7 8 9 1010
-6
10-5
10-4
10-3
10-2
10-1
100
Power Spectral Density Estimate
Am
plitu
de
Frequency (Hz)
Figure 8. Frequency analysis of the bridge using the ambient vibration captured by a seismograph.
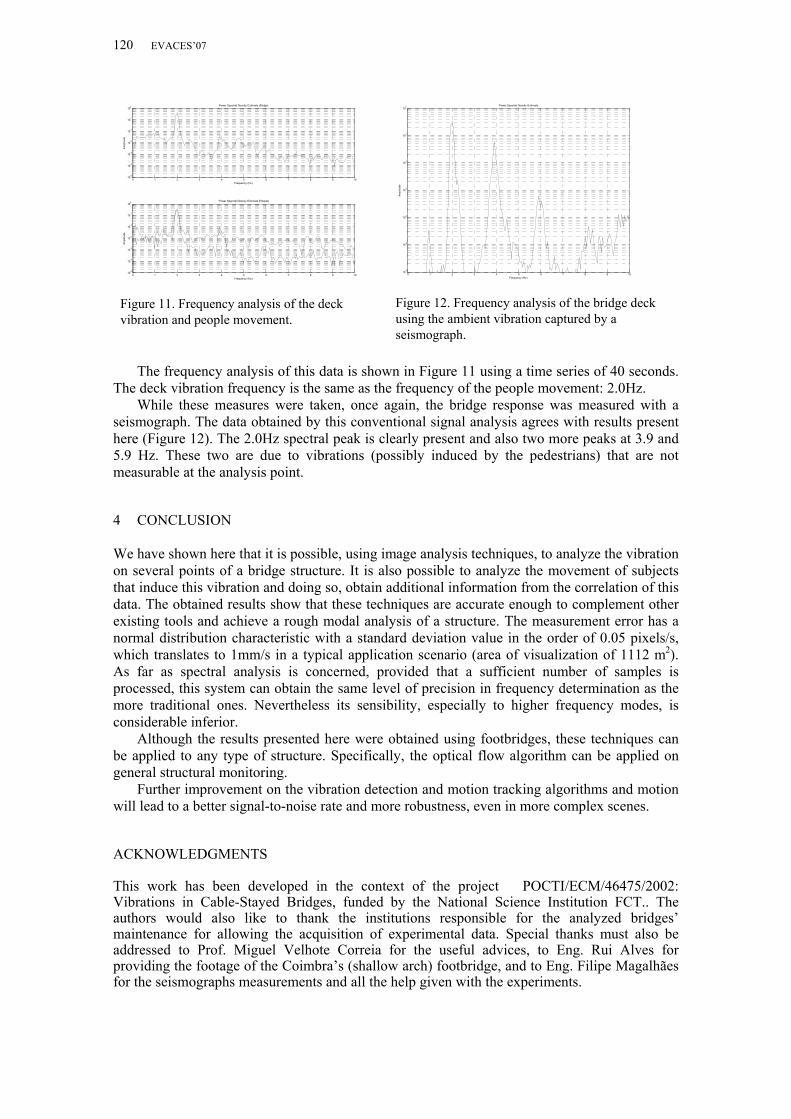
Figure 7 presents the data in the frequency domain for a time series of 45 seconds. Here we
can see that the cable 5 has three peaks at frequencies 1.4, 1.8 and 2.5Hz. Cable 2 has oscillating frequencies of 1.4, 1.6 and 2.8Hz. It is interesting to see that the vertical component of the subject’s motion has frequencies between 2.6 and 2.8Hz.
At the same time these measures were made, ambient vibration measurements based on seismographs analysis were also carried out. The data obtained by this analysis agrees with results presented here. All the spectral peaks in the cables vibration data are present in the seismograph spectral data as shown in Figure 8.
3.3 Footbridge at FEUP
In this experiment we tried a more direct excitation of the bridge’s natural frequencies by two subjects jumping on it. In Figure 9 the bridge is shown with the two subjects on the right and, on the left, the analyzed point on the deck.
Figure 9. Footbridge in FEUP.
5 10 15 20 25 30 35
-3
-2
-1
0
1
2
3
4
x 10-3
m/s
Time (s)
Point 1
5 10 15 20 25 30 35-0.05
0
0.05
m/s
Time (s)
Person on the left
5 10 15 20 25 30 35
-0.06
-0.04
-0.02
0
0.02
0.04
m/s
Time (s)
Person on the right
Figure 10. Time series of FEUP’s footbridge deck and people jumping on the bridge.
Both the bridge’s deck vibration in the vertical axis and people movement in the same axis were analyzed, the obtained time series are shown in Figure 10. Again we can see that the bridge vibration starts slowly after people’s movement begins, and that it decays when the people movement stops.
120 EVACES’07
0 1 2 3 4 5 6 7 8 9 1010
-6
10-5
10-4
10-3
10-2
10-1
100
Power Spectral Density Estimate (Bridge)
Am
plitu
de
Frequency (Hz)
0 1 2 3 4 5 6 7 8 9 1010
-6
10-5
10-4
10-3
10-2
10-1
100
Power Spectral Density Estimate (People)
Am
plitu
de
Frequency (Hz)
Figure 11. Frequency analysis of the deck vibration and people movement.
0 1 2 3 4 5 6 7 8 9 1010
-6
10-5
10-4
10-3
10-2
10-1
100 Power Spectral Density Estimate
Am
plitu
de
Frequency (Hz)
Figure 12. Frequency analysis of the bridge deck using the ambient vibration captured by a seismograph.
The frequency analysis of this data is shown in Figure 11 using a time series of 40 seconds.
The deck vibration frequency is the same as the frequency of the people movement: 2.0Hz. While these measures were taken, once again, the bridge response was measured with a
seismograph. The data obtained by this conventional signal analysis agrees with results present here (Figure 12). The 2.0Hz spectral peak is clearly present and also two more peaks at 3.9 and 5.9 Hz. These two are due to vibrations (possibly induced by the pedestrians) that are not measurable at the analysis point.
4 CONCLUSION We have shown here that it is possible, using image analysis techniques, to analyze the vibration on several points of a bridge structure. It is also possible to analyze the movement of subjects that induce this vibration and doing so, obtain additional information from the correlation of this data. The obtained results show that these techniques are accurate enough to complement other existing tools and achieve a rough modal analysis of a structure. The measurement error has a normal distribution characteristic with a standard deviation value in the order of 0.05 pixels/s, which translates to 1mm/s in a typical application scenario (area of visualization of 1112 m2). As far as spectral analysis is concerned, provided that a sufficient number of samples is processed, this system can obtain the same level of precision in frequency determination as the more traditional ones. Nevertheless its sensibility, especially to higher frequency modes, is considerable inferior.
Although the results presented here were obtained using footbridges, these techniques can be applied to any type of structure. Specifically, the optical flow algorithm can be applied on general structural monitoring.
Further improvement on the vibration detection and motion tracking algorithms and motion will lead to a better signal-to-noise rate and more robustness, even in more complex scenes.
ACKNOWLEDGMENTS This work has been developed in the context of the project POCTI/ECM/46475/2002: Vibrations in Cable-Stayed Bridges, funded by the National Science Institution FCT.. The authors would also like to thank the institutions responsible for the analyzed bridges’ maintenance for allowing the acquisition of experimental data. Special thanks must also be addressed to Prof. Miguel Velhote Correia for the useful advices, to Eng. Rui Alves for providing the footage of the Coimbra’s (shallow arch) footbridge, and to Eng. Filipe Magalhães for the seismographs measurements and all the help given with the experiments.

Experimental Vibration Analysis for Civil Engineering Structures 121
REFERENCES [1] Barron, J.L., D.J. Fleet, S.S. Beauchemin, and T.A. Burkitt. 1992. Performance of optical flow
techniques, CVPR. [2] Miguel V. Correia, Aurélio C. Campilho, A Pipelined Real-Time Optical Flow Algorithm, 372-380
ICIAR 2004 [3] Nogueira, F. M. A., Barbosa, F. S., Barra, L. P. S. 2005. Evaluation of structural natural frequencies
using image processing, EVACES 2005. [4] Yoshida, Junji, Abe, Masato, Fujino, Yozo, Higashiuwatoko, Kayoko, 2002. Image analysis of human
induced lateral vibration of a pedestrian bridge, Footbridge 2002. [5] Lee, Jong Jae, Shinozuka, Masanobu, 2006. A vision-based system for remote sensing of bridge
displacement, NDT&E International N.º 39, PP 425-431. [6] Caetano, Cunha, Moutinho, 2007. Implementation of passive devices for vibration control at Coimbra
footbridge, EVACES 2007.

122 EVACES’07