embed a data connected visio diagram in sharepoint 2013 ... · 2013 embed a data connected visio...
TRANSCRIPT

2013
Embed a Data Connected
Visio Diagram in
SharePoint 2013
Hands-On Lab
Lab Manual

This document is provided “as-is”. Information and views expressed in this document, including URL and
other Internet Web site references, may change without notice. You bear the risk of using it.
This document does not provide you with any legal rights to any intellectual property in any Microsoft
product. You may copy and use this document for your internal, reference purposes.
© 2012 Microsoft. All rights reserved.

Page 1
Contents
EMBED A DATA CONNECTED VISIO DIAGRAM IN SHAREPOINT 2013 ............................................................. 2 Lab Objectives ........................................................................................................................................................ 2 Technologies .......................................................................................................................................................... 2 Audience ................................................................................................................................................................ 2 Scenario ................................................................................................................................................................. 2 Getting Started ....................................................................................................................................................... 2
Connect to the Lab Environment ....................................................................................................................... 2 Open the Lab Environment ................................................................................................................................ 2
Exercise 1 – Configuring the Data-Driven Visio Diagram ...................................................................................... 5 Scenario ............................................................................................................................................................. 5 Task 1 – Importing SharePoint 2013 list data .................................................................................................... 5 Task 2 – Automatically Linking Server Data to Visio Server Shapes ................................................................ 8 Task 3 - Applying New Data Graphics to Visio Diagrams ............................................................................... 12 Task 4 – Publishing the Visio Diagram ............................................................................................................ 18
Exercise 2 : Embedding Visio Diagrams in a Web-Part Page ............................................................................. 19 Scenario ........................................................................................................................................................... 19 Task 1 – Adding Visio Web Access web part to a web part page ................................................................... 20 Task 2 – Connecting the Visio Web Access library to the Documents library ................................................. 23 Task 3 – Interacting with the Visio Diagrams ................................................................................................... 26 Task 4 - Changing Server Information in a Visio Diagram .............................................................................. 28 Task 5 – Leaving and Responding to Comments on a Visio Diagram ............................................................ 31
Summary .............................................................................................................................................................. 33

Hands-on Lab Embed a Data Connected Visio Diagram in SharePoint 2013
Microsoft Confidential Page 2
Embed a Data Connected Visio Diagram in SharePoint 2013
Estimated time to complete this lab: 35 minutes
Lab Objectives
In this lab, you will configure an existing Visio diagram to retrieve data from a SharePoint 2013 list, then connect Visio shapes to the list data, and use a custom data-graphic template to present the data on the shapes using text overlays, data bars, and fill colors. You will publish the diagram to SharePoint 2013, and surface it on a web-part page using the Visio Web Access web part.
In addition, you will add interactivity to the page (using web-part connections), then configure and test automatic data refresh. Finally, you will briefly explore collaboration features in Visio Services by adding comments to the diagram.
You will create this data-driven Visio experience without the need to write any programming code or database queries.
After completing this lab, you should be able to:
Create a Visio data source based on a SharePoint list
Use the Automatic Link feature to relate data-source rows to diagram shapes
Create a data graphic and apply it to diagram shapes
Publish the Visio diagram as a Visio Web Diagram to a SharePoint library
Embed Visio diagrams into a web part page using the Visio Web Access web part
Configure the Visio Web Access web part for automatic refresh
Add comments to a Visio diagram and read others’ replies
Technologies
Visio 2013
SharePoint 2013
Audience
SharePoint Site Administrators and SharePoint IT Professionals
Scenario
This lab takes you through configuring a Visio diagram to retrieve data from a SharePoint 2013 list, customizing the Visio diagram, and then publishing it to SharePoint and interacting with it online.
Getting Started
Connect to the Lab Environment
Log on to the DC virtual machine (VM) as Garth Fort, with the credentials CONTOSO\GarthF, pass@word1.
Open the Lab Environment
To begin the lab, open the HOL - Contoso Servers.vsdx Visio file:

Hands-on Lab Embed a Data Connected Visio Diagram in SharePoint 2013
Microsoft Confidential Page 3
1. Switch to the DC virtual machine. Click Start, All Programs, Microsoft Office 2013 and then
click Visio 2013.
2. In Visio 2013, click Open Other Drawings.
3. In the Open window, click Computer, and then click Browse.
4. In the Open dialog box, type \\W15-SP\C$\HOLContent\BIHOL-Visio\HOL – Contoso
Servers, and then click Open.
The Visio diagram titled “Contoso Servers” opens with the Shapes window open.

Hands-on Lab Embed a Data Connected Visio Diagram in SharePoint 2013
Microsoft Confidential Page 4

Hands-on Lab Embed a Data Connected Visio Diagram in SharePoint 2013
Microsoft Confidential Page 5
Exercise 1 – Configuring the Data-Driven Visio Diagram
Estimated time to complete this exercise: 10 minutes
Scenario
Connecting data from external sources, such as Excel, Access, SQL Server or SharePoint, is a two-step process – import your data first, then connect it to shapes. In this exercise, you will first use the Data Selector wizard to import a SharePoint 2013 list into the External Data window in the Visio diagram. The data in the External Data window is a snapshot of your source data at the time of import. You can refresh this data to match changes in your source data (click Refresh All on the Data tab), but Visio doesn’t send changes in the diagram back to the data source. After importing the SharePoint 2013 list data you will link the rows to Visio shapes. Visio 2013 provides three ways to link rows of data to shapes in your drawing: You can link rows to existing shapes one at a time, you can link the rows to shapes automatically, or you can create shapes from the data. In this exercise you will link the rows to shapes automatically. This requires preparing the shapes beforehand by giving them special Shape Data fields, which has already been completed.
Task 1 – Importing SharePoint 2013 list data
In this task, you will import Contoso server data from a SharePoint 2013 list into the External Data window of the Visio diagram.
1. On the DATA tab, in the External Data group, click Link Data to Shapes.

Hands-on Lab Embed a Data Connected Visio Diagram in SharePoint 2013
Microsoft Confidential Page 6
2. In the Data Selector dialog, click the Microsoft SharePoint Foundation list radio button, and
then click Next.
3. In the Select a site dialog, type http://intranet.contoso.com/sites/BIHOL-Visio into the Site
text box, and then click Next.

Hands-on Lab Embed a Data Connected Visio Diagram in SharePoint 2013
Microsoft Confidential Page 7
4. If asked for logon information, use the following credentials:
User name: contoso\garthf
Password: pass@word1
5. In the Select a list dialog, click Contoso Servers.
6. Click Link to a list radio button.
7. Click Next.

Hands-on Lab Embed a Data Connected Visio Diagram in SharePoint 2013
Microsoft Confidential Page 8
8. After you click Finish on the last page of the Data Selector wizard, the External Data window
displays with your imported data shown in a table.
Task 2 – Automatically Linking Server Data to Visio Server Shapes
In this task you will use Visio’s Automatically Link feature to link the External Data to the Visio
diagram shapes. The External Data contains a Server column that aligns with the shapes’ Network
Names. The Server column and Network Name alignment has already been prepared for you.
1. On the Data tab, in the External Data group, click Automatically Link.

Hands-on Lab Embed a Data Connected Visio Diagram in SharePoint 2013
Microsoft Confidential Page 9
2. In the Automatically link rows to shapes dialog, click All shapes on this page radio button, and
then click Next.
3. In the next screen, in the Data Column drop down, click Server.

Hands-on Lab Embed a Data Connected Visio Diagram in SharePoint 2013
Microsoft Confidential Page 10
4. In the Shape Field drop down, click Network Name, and then click Next.
5. After you click Finish on the last page of the Automatic Link wizard, Visio links the rows and
shapes that have matching values.:
the Visio diagram displays the appropriate data from the External Data list
the External Data list displays a link icon to show the data is linked

Hands-on Lab Embed a Data Connected Visio Diagram in SharePoint 2013
Microsoft Confidential Page 11
6. To view the Shape Data:
a. Right-click on the DC-01 shape.
b. From the context menu, click Data, and then click Shape Data.
The Shape Data window displays on the right side of the window.
c. Scroll through the Shape Data window and view the data linked to the External Data table.

Hands-on Lab Embed a Data Connected Visio Diagram in SharePoint 2013
Microsoft Confidential Page 12
Task 3 - Applying New Data Graphics to Visio Diagrams
In this task, you will highlight all of the server shapes and use the Data Graphics feature to alter the data field displays and styles.
1. Select all diagram shapes by clicking and holding your left mouse button and dragging a
rectangular area across the images.
2. If done correctly, all server images and connectors are selected.

Hands-on Lab Embed a Data Connected Visio Diagram in SharePoint 2013
Microsoft Confidential Page 13
3. On the Data tab, in the Display Data group, click Data Graphics, and then click Create New
Data Graphic.
4. In the New Data Graphic window, click New Item.
5. To configure the item, in the New Item window:
a. In the Display section, from the Data field drop down, click Server.
b. From the Displayed as drop down, click Text.
This will populate the Style drop down.
Hands-on Lab Embed a Data Connected Visio Diagram in SharePoint 2013
Microsoft Confidential Page 14
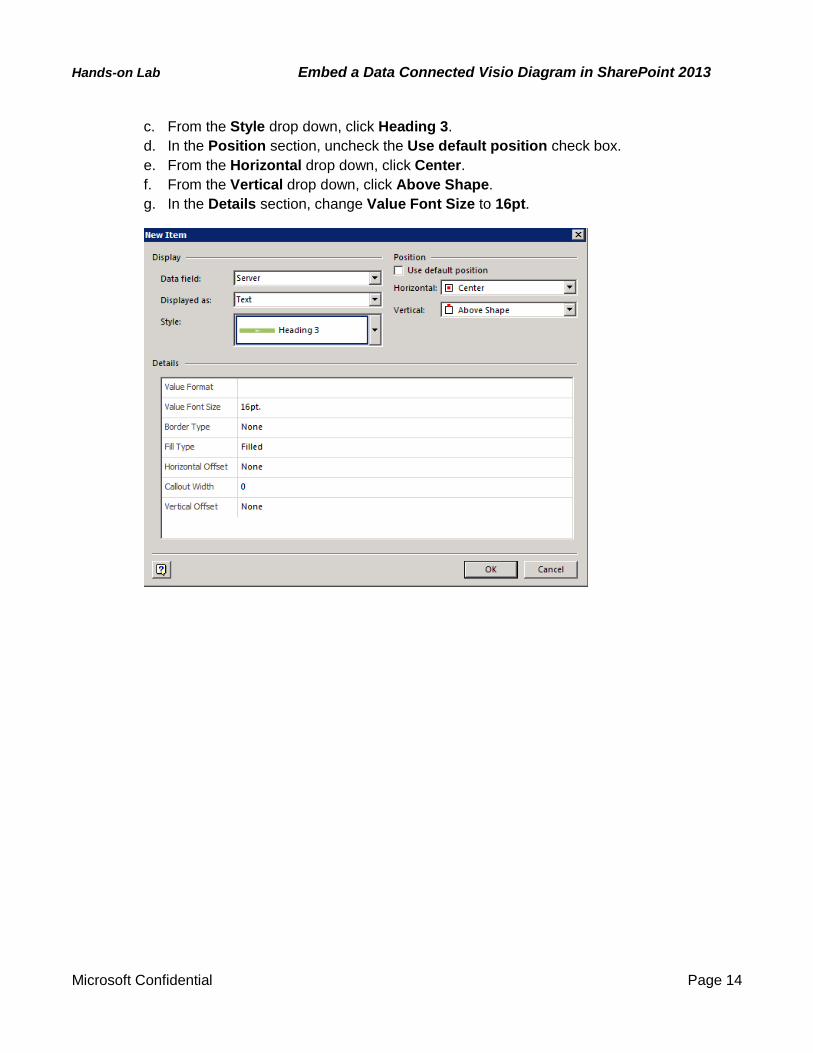
c. From the Style drop down, click Heading 3.
d. In the Position section, uncheck the Use default position check box.
e. From the Horizontal drop down, click Center.
f. From the Vertical drop down, click Above Shape.
g. In the Details section, change Value Font Size to 16pt.

Hands-on Lab Embed a Data Connected Visio Diagram in SharePoint 2013
Microsoft Confidential Page 15
h. When you click OK in the New Item window, the New Data Graphic window will display
with the Server Data Field listed.
6. To add the Bandwidth Used (GB) as the next new data field:
a. In the New Data Graphic window, click New Item.
b. In the New Item window, make the following selections, and then click OK.
Property Value
Data Field Bandwidth Used (GB)
Displayed As Data Bar
Style Progress Bar
Use Default Position Deselect
Horizontal Center
Vertical Below Shape
Details – Value Font Size 8pt.
7. To add the Admin as the next new data field:
a. In the New Data Graphic window, click New Item.
b. In the New Item window, make the following selections and then click OK.
Property Value
Data Field Admin
Displayed As Text
Style Text callout

Hands-on Lab Embed a Data Connected Visio Diagram in SharePoint 2013
Microsoft Confidential Page 16
Use Default Position Deselect
Horizontal Center
Vertical Below Shape
Details – Value Font Size 10pt.
8. To add the Status as the next new data field:
a. In the New Data Graphic window, click New Item.
b. In the New Item window, make the following selections and then click OK.
Property Value
Data Field Status
Displayed As Color by Value
Coloring method Each color represents a unique value
Color Assignments Red = Offline, Green = Online

Hands-on Lab Embed a Data Connected Visio Diagram in SharePoint 2013
Microsoft Confidential Page 17
9. Confirm the final New Data Graphic window looks as follows, and then click OK.
10. If prompted, click Yes to apply this data graphic to the selected shapes.

Hands-on Lab Embed a Data Connected Visio Diagram in SharePoint 2013
Microsoft Confidential Page 18
The final report should look as follows:
Task 4 – Publishing the Visio Diagram
In this task, you will save the Visio digram to a SharePoint 2013 document library. Then you will open and interact with the Visio diagram in SharePoint. First, you will save the Visio digram to the BIHOL-Visio site in SharePoint 2013.
1. In Visio 2013, on the File tab, click Save As.
2. In the Save As window, click Computer, and then click Browse.

Hands-on Lab Embed a Data Connected Visio Diagram in SharePoint 2013
Microsoft Confidential Page 19
3. In the Save As dialog box, navigate to http://intranet.contoso.com/sites/BIHOL-Visio
4. If asked for log in information, enter the following credentials:
User name: contoso\garthf
Password: pass@word1
5. Under Document Libraries, double-click Documents to open the library, and then click Save.
In this exercise, you imported a SharePoint 2013 list of Contoso Server data. You then used the Automatically Link feature to link the imported server data to the server shapes in the Visio diagram. You then applied new data graphics to the Visio diagram, and then published the Visio diagram to a SharePoint 2013 library.
Exercise 2 : Embedding Visio Diagrams in a Web-Part Page
Scenario
In this exercise, you will create a web-part page named Contoso Diagrams. You will then configure the page to contain the Visio Web Drawings library web part and a Visio Web Access web part. A connection will be defined to pass the selected Visio diagram to the Visio Web Access web part. To experience the automatic refresh capabilities of the Visio Web Access web part, you will change the status for a server, then see the Visio diagram update to reflect the change.

Hands-on Lab Embed a Data Connected Visio Diagram in SharePoint 2013
Microsoft Confidential Page 20
Task 1 – Adding Visio Web Access web part to a web part page
In this task, you will add a Visio Web Access web part to a web part page and then you will add the Documents web part to drive displaying the Contoso Server data in the Visio Web Access web part.
1. Open Internet Explorer and navigate to the Visio HOL subsite at
http://intranet.contoso.com/sites/BIHOL-Visio.
2. If prompted for login information, enter the following credentials:
User name: contoso\garthf
Password: pass@word1
3. On the BIHOL-Visio page, in the left navigation, click Contoso Server Status to open the page.
4. From the Settings menu, click Edit page.
5. If a Message from webpage dialog box displays, click OK to check out the item before making
changes.

Hands-on Lab Embed a Data Connected Visio Diagram in SharePoint 2013
Microsoft Confidential Page 21
6. In the Header web part zone, click Add a Web Part link.
7. Under Categories, click Business Data, then click Visio Web Access under Parts:
8. Click Add to add the Visio Web Access web part to the page.

Hands-on Lab Embed a Data Connected Visio Diagram in SharePoint 2013
Microsoft Confidential Page 22
9. Click the Click here to open the tool pane link to configure the Visio Web Access web part.
10. To configure the Visio Web Access:
a. In the Automatic Refresh Interval text box, enter 1.
b. Deselect the Show Page Navigation checkbox.
c. Expand Appearance section, and then change Title to Visio Diagrams.
d. Set Height to 600 Pixels.
e. Click OK.
Note: The Web Drawing URL property will not be configured yet. The web part will pull the URL
information from the Visio diagrams in the Documents library.

Hands-on Lab Embed a Data Connected Visio Diagram in SharePoint 2013
Microsoft Confidential Page 23
Task 2 – Connecting the Visio Web Access library to the Documents library
You will now add the Documents library web part to pass in the user-selected diagram to the Visio
Diagrams web part property.
1. To add the Documents library as a second web part:
a. In the Header web part zone of the page, click Add a Web Part.
b. From the Categories list, click Apps and from the Parts list, click Documents.
c. Click Add to add the Documents library web part to the page.
2. To Connect the Visio Web Access web part to the Documents library web part:
a. Click the drop-down arrow in the top right corner of the Visio Web Access Web Part.
b. Click Connections.
c. Click Get Web Drawing URL and Page Name From.

Hands-on Lab Embed a Data Connected Visio Diagram in SharePoint 2013
Microsoft Confidential Page 24
d. Click Documents.
The Configure Connection – Webpage Dialog displays.
e. In the Configure Connection Webpage Dialog, from the Provider Field Name drop down,
click Document URL.

Hands-on Lab Embed a Data Connected Visio Diagram in SharePoint 2013
Microsoft Confidential Page 25
f. From the Consumer Field Name drop down, click Web Drawing URL, and then click
Finish.
The selected Visio diagram displays in the Visio Diagrams web part.
3. On the Format Text tab, in the Edit group, click Save to save the changes and stop editing the
page, so you can interact with the web parts.

Hands-on Lab Embed a Data Connected Visio Diagram in SharePoint 2013
Microsoft Confidential Page 26
4. To view another Visio diagram listed in the Documents library web part, click on the double
arrow diagonal adjacent to the desired .VSDX file and your selection populates the lower web
part.
Note: If you click the document names, the Visio diagrams will open in a new window.
Task 3 – Interacting with the Visio Diagrams
1. In Documents web part, click the double-arrow beside HOL - Contoso Servers.

Hands-on Lab Embed a Data Connected Visio Diagram in SharePoint 2013
Microsoft Confidential Page 27
2. In the lower right corner of Visio Diagram web part, use the Zoom feature to zoom in and zoom
out of the image.
5. Click Zoom to fit page to view.
6. In the Visio Diagrams web part, click the diagram and while holding down the mouse button,
move the diagram around the web part.

Hands-on Lab Embed a Data Connected Visio Diagram in SharePoint 2013
Microsoft Confidential Page 28
7. In the Visio Web Access, click the DC-01 server image, and then click Shape Info to display
the server information.
8. Scroll down in the Shape Info dialog and note the Server data.
Task 4 - Changing Server Information in a Visio Diagram
In this task you will open the list of Contoso Servers, change the data for the Email Server, save the information, and then view the change son the Contoso Server Status web part page.

Hands-on Lab Embed a Data Connected Visio Diagram in SharePoint 2013
Microsoft Confidential Page 29
1. In the left navigation, right-click Contoso Servers, and then click Open in new tab.
2. Click on the ContosoServers-All Items tab to display the list.
3. In the ContosoServers list, click to select the EMAIL-03 item.

Hands-on Lab Embed a Data Connected Visio Diagram in SharePoint 2013
Microsoft Confidential Page 30
4. To change the Bandwidth Used:
a. Click the ellipse beside EMAIL-03 to open the menu, and then click Edit Item.
b. In the EMAIL-03 Edit window, in the Bandwidth Used (GB) text box change 65 to 100.
c. Click Save.
5. To view the changes:
a. Click Pages – Contoso Server Status tab to return to the Contoso Server Status
page.

Hands-on Lab Embed a Data Connected Visio Diagram in SharePoint 2013
Microsoft Confidential Page 31
b. On the Contoso Server Status page, in the Visio Diagrams web part, click Refresh to
update the data.
Note: You may need to click Refresh several times until you see EMAIL-03 updated to
100.
c. Note the Bandwidth used for EMAIL – 03 is now 100.
Task 5 – Leaving and Responding to Comments on a Visio Diagram
1. In the Documents web part, click the Contoso Sales Process name to open the Visio diagram
in Visio Services full screen mode.

Hands-on Lab Embed a Data Connected Visio Diagram in SharePoint 2013
Microsoft Confidential Page 32
2. In the new window, click the Shipping shape and in the top navigation, click Comments.
A Comments window opens on the right side of the page.
3. In the Comments section, click New.
4. Type the following message in the text box.
We need to add a step for fulfillment process.
5. Click the white space below the new text box to add the comment.
Note the comment icon above the Shipping shape.
Note: You can also click in the Reply text box to respond to an existing comment
In this exercise, you added a Visio Web Access web part and a Documents library web part to a web part page. You then used Connections to the two web parts so that when a Visio diagram is selected in the Documents library web part, the Visio diagram will display in the Visio Web Access web part. You then interacted with the web part page in SharePoint. And finally, you added comments to the Visio diagram in SharePoint 2013.

Hands-on Lab Embed a Data Connected Visio Diagram in SharePoint 2013
Microsoft Confidential Page 33
Summary
In this lab you investigated the Visio 2013 and SharePoint 2013 integration features. You learned how to pull in data from a SharePoint 2013 list into a Visio diagram, how to save the Visio file to SharePoint and how to create a web part page to display Visio diagrams.
This lab discussed how to perform the following tasks:
Create a Visio data source based on a SharePoint list
Use the Automatic Link feature to relate data-source rows to diagram shapes
Create a data graphic and apply it to diagram shapes
Publish the Visio diagram as a Visio Web Diagram to a SharePoint library
Embed Visio diagrams into a web part page using the Visio Web Access web part
Configure the Visio Web Access web part for automatic refresh
Add comments to a Visio diagram and read others’ replies