embracing su stainability, pursuing growthindofoodagri.listedcompany.com/misc/ar2017.pdfhousing...
TRANSCRIPT

AnnuAl REPORT 2017
EmbRAcing SuSTAinAbiliTy, PuRSuing gROwTh

Housing facilities at oil palm plantation
At A gLAnceIndofood Agri resources Ltd. (IndoAgri) is a vertically integrated agribusiness group with activities spanning the entire supply chain from research and development (r&d), seed breeding, oil palm cultivation and milling; as well as the production and marketing of cooking oil, shortening and margarine. Headquartered in singapore and Jakarta, we are among the largest palm oil producers in Indonesia. our branded cooking oil, shortening and margarine products together garner a leading share in the domestic market. As a diversified agribusiness group, IndoAgri also engages in the cultivation of sugar cane, rubber and other crops.

OuR ViSiOnto become a leading integrated agribusiness, and one of the world-class agricultural research and seed breeding companies.
OuR VAluESWith discipline as the basis of our way of life; we conduct our business with integrity; we treat our stakeholders with respect; and together we unite to strive for excellence and continuous innovation.
OuR miSSiOnto be a low-cost producer, through high yields and cost-effective and efficient operations.
to continuously improve our people, processes and technology.
exceed our customers’ expectations, whilst ensuring the highest standards of quality.
recognise our role as responsible and engaged corporate citizens in all our business operations, including sustainable environmental and social practices.
to continuously increase stakeholders’ value.
cOnTEnTS
FinAnciAlSdirectors’ statement 61Independent Auditor’s report 63consolidated statement of comprehensive Income 67Balance sheets 68 consolidated statement of changes in equity 70consolidated cash flow statement 72 notes to the financial statements 74
OThER inFORmATiOnInterested Person transactions 151Plantation Locations 152 statistics of shareholdings 154notice of Annual general Meeting 156Proxy form
gROuP OVERViEwAt a glance Vision, Mission and Values 1 Milestones 2corporate structure 4geographical Presence 6chairman’s statement 10ceo’s statement 11
OPERATiOn And FinAnciAl REViEwgroup Performance review 14 Plantation review 20 edible oils & fats review 32
SuSTAinAbiliTy & gOVERnAncEsustainability at IndoAgri 36Board of directors 40corporate Information 43corporate governance 45
oil palm seeds breeding
01 Indofood AgrI resources Ltd
AnnuAl REPORT 2017

M i l e s t o n e s2011
• Listed Pt sIMP on the IdX
• Increased rsPo-certified
cPo to 195,000 tonnes
2012•
Acquired a 26.4% stake in Heliae, a development-stage
algae technology solutions company
•Increased rsPo-certified
cPo to 248,000 tonnes
2007•
completed a reverse takeover and listed on the sgX-st
• Acquired plantation land in
south sumatra and Kalimantan•
Acquired a 58.8% stake in Pt PP London sumatra Indonesia tbk (Lonsum)
• enrolled as a
roundtable on sustainable Palm oil (rsPo) member
2008•
diversified into sugar business via 60% stake in
Pt Laju Perdana Indah (Pt LPI)
•Acquired plantation land
in south sumatra andcentral Kalimantan
2009
• Acquired plantation land
in south sumatra•
Achieved rsPo-certified crude Palm oil (cPo) of
170,000 tonnes
2010
• divested an 8% stake in Lonsum,
of which 3.1% was sold to Pt salim Ivomas Pratama tbk
(Pt sIMP)
A dEcAdE OF TRAnSFORmATiOn
02 Indofood AgrI resources Ltd
AnnuAl REPORT 2017
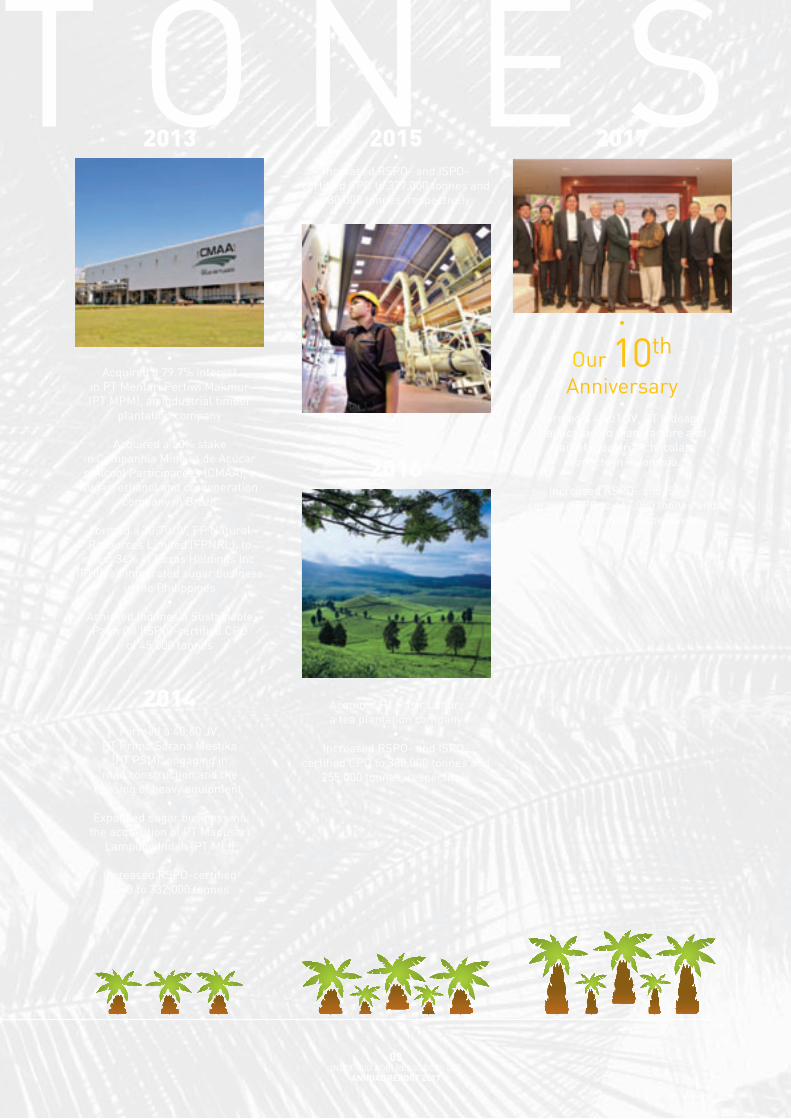
M i l e s t o n e s2017
•
our 10th
Anniversary•
formed a 49:51 JV, Pt Indoagri daitocacao, to manufacture and
market industrial chocolate products in Indonesia.
• Increased rsPo- and IsPo-
certified cPo to 447,000 tonnes and 389,000 tonnes, respectively
2015•
Increased rsPo- and IsPo-certified cPo to 377,000 tonnes and
180,000 tonnes, respectively
2016
• Acquired Pt Pasir Luhur, a tea plantation company
• Increased rsPo- and IsPo-
certified cPo to 388,000 tonnes and 255,000 tonnes, respectively
2013
• Acquired a 79.7% interest
in Pt Mentari Pertiwi Makmur (Pt MPM), an industrial timber
plantation company•
Acquired a 50% stake in companhia Mineira de Açúcar e Álcool Participações (cMAA), a sugar, ethanol and co-generation
company in Brazil•
formed a 30:70 JV, fP natural resources Limited (fPnrL), to
invest 34% in roxas Holdings Inc. (rHI), an integrated sugar business
in the Philippines•
Achieved Indonesia sustainable Palm oil (IsPo)-certified cPo
of 45,000 tonnes
2014•
formed a 40:60 JV, Pt Prima sarana Mustika
(Pt PsM), engaging in road construction and the
leasing of heavy equipment•
expanded sugar business via the acquisition of Pt Madusari
Lampung Indah (Pt MLI)•
Increased rsPo-certified cPo to 332,000 tonnes
A dEcAdE OF TRAnSFORmATiOn
03 Indofood AgrI resources Ltd
AnnuAl REPORT 2017

cORPORATE STRucTuRE(as at 31 december 2017)
73.5%
59.5%
50.0%18.9%
notes:• IndoAgri is 62.8% effectively owned by Pt Indofood sukses Makmur tbk (Pt IsM)• shareholding percentage is calculated based on 1,395,904,530 shares (excluding treasury shares
of the company)
04 Indofood AgrI resources Ltd
AnnuAl REPORT 2017

oil palm plantation at north sumatra

legend
Oil Palm
Sugar cane
Rubber
Timber
cocoa
Tea
Refinery
Sugar mill
SOuTh EAST ASiA
gEOgRAPhicAl PRESEncE
indonesia
247,630 hectares of
oil palm
indonesia
19,869 hectares of
rubber
indonesia
12,618 hectares ofsugar cane
mAlAySiA
SingAPORE
SumATRA
JAVA
KAlimAnTAn SulAwESi
nORThmAluKu
PhiliPPinES
06 Indofood AgrI resources Ltd
AnnuAl REPORT 2017

bRAZil
minAS gERAiS
SOuTh AmERicA
OuR PlAnTATiOnS And REFinERiES
indonesiaIndoAgri owns strategically located estates and production facilities across Indonesia. the group’s planted area occupies 300,387 hectares. oil palm is the dominant crop, followed by sugar cane, rubber and other crops. our plantations are largely located in sumatra and Kalimantan, while our refineries are mainly sited at major cities including Jakarta, Medan, surabaya and Bitung.
brazilIndoAgri has a 50% interest in cMAA. cMAA has 49,204 hectares of planted sugar cane in Brazil, of which 45% is company owned and 55% belongs to third parties.
PhilippinesIndoAgri has a 30% interest in fPnrL, which in turn holds a 62.9% interest in rHI, the largest integrated sugar business in the Philippines.
indonesia
20,270 hectares ofother crops
brazil
49,204 hectares ofsugar cane
07 Indofood AgrI resources Ltd
AnnuAl REPORT 2017

Production Facilities in indonesia
26 Palm Oil Mills
Annual FFB processing capacity – 6.6M tonnes
5 Refineries
Annual CPO processing capacity – 1.4M tonnes
2 Sugar Mills/Refineries
Annual cane crushing capacity – 2.2M tonnes
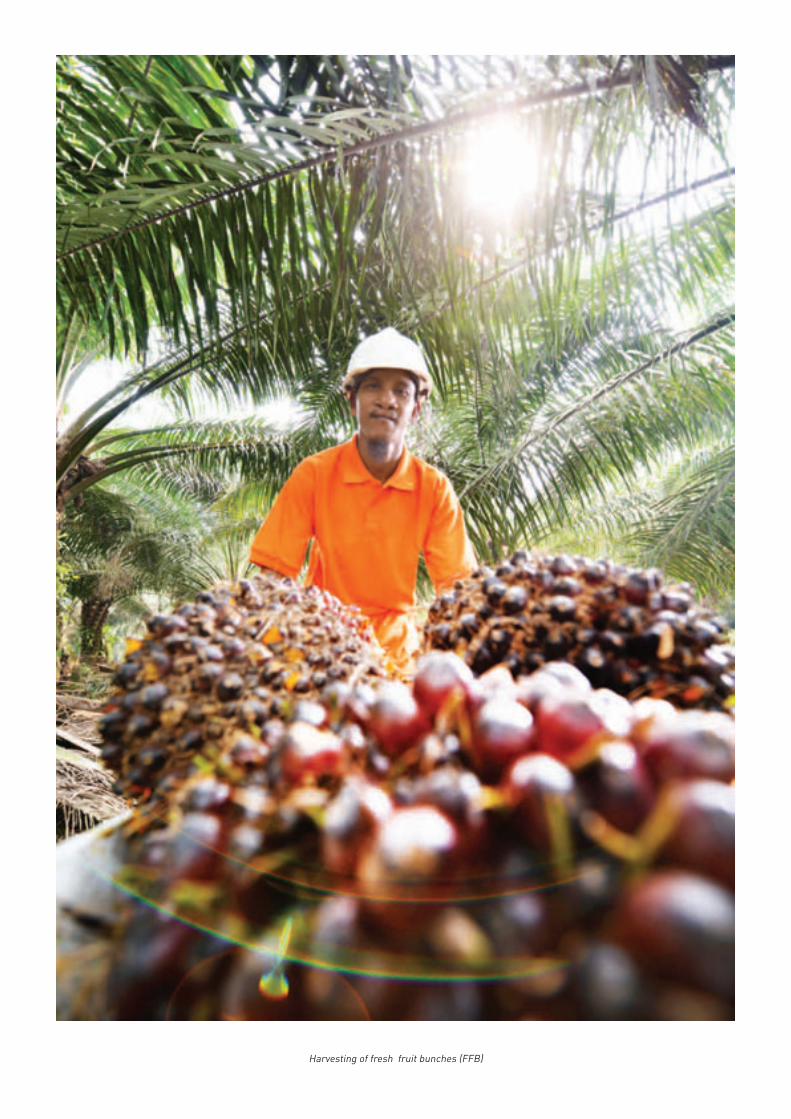
Harvesting of fresh fruit bunches (ffB)
chAiRmAn’S STATEmEnT
dEAR ShAREhOldERS,
since we were publicly listed 10 years ago, the company has grown significantly. from 72,000 hectares of plantations in 2007, we now have 300,000 hectares; and from six palm oil mills, we now run 26 mills. Annual cPo output raised from 384,000 tonnes in 2007 to 842,000 tonnes, and productivity was improved with more efficient use of fertilisers, water and energy. our revenue tripled to s$1.6 billion between that period.
over the years, we have worked closely with local communities to make sure they benefit from our operations. We created 40,000 jobs and assisted in the operations of smallholders’ plasma plantations. With our help, they are now a part of the rsPo programme to produce sustainable palm oil.
We care for our environment. As fire and haze are harmful to the health of both communities and plantations, we have enforced a strict zero-burning policy and maintained our own fire-fighting forces to safeguard our plantations and neighbourhoods. We have received commendation for our participation in the haze management efforts organised by the Indonesian and singapore governments.
these initiatives have led to positive environmental and social outcomes. We formally accounted for the impact of our operations in our first sustainability report in 2013, ahead of the industry, and have continued to do so every year.
the group has continued its growth trajectory in 2017. Margins of palm oil have recovered with increased sales by both value and volume. ffb nucleus have recovered from the el niño-induced drought in 2015 and increased by 4% to reach a total output of 3,109,000 tonnes. to support demand growth, the group has steadily increased plantings and processing capacity. downstream, consumer demand for cooking oil and margarine remained healthy, even as the retail sector was dampened due to intensifying competition. More will also be done to capture higher retail margins from other crops, like sugar, tea and cocoa.
the current climate of agribusiness remains highly volatile and complex. Productions can be significantly affected by adverse weather conditions, and the top line can become eroded by fluctuations in commodity prices, forex and operating costs, such as minimum wages. We must continue to strengthen our fundamentals and improve margins through better-yielding crops, cost containment measures and innovations to drive productivity.
We continue to pursue sound investments that are in line with our overall strategy. In december 2017, we took part in a 50:50 joint venture, canapolis, with our current partner in Brazil, and contributed a capital of us$7.2 million in mid-february 2018. canapolis has acquired a sugar mill with an annual cane crushing capacity of 1.8 million tonnes as well as 6,048 hectares of land for us$42 million. this investment is expected to help grow our sugar-related operation in Brazil.
overall, the Board is satisfied with the performance of the management team. they have delivered good results, ensured sustainable operations and upheld a high standard of corporate governance. A dividend of 0.65 singapore cents per share was announced and distributed to the shareholders in the year.
our warm congratulations go to Mark Wakeford who was awarded the most prestigious Best chief executive officer Award for companies with s$300 million to s$1 billion in market capitalisation at the singapore corporate Awards. It is a remarkable achievement that aptly reflects his sterling efforts in guiding the group through uncertain times towards resilient growth.
on behalf of the Board, I would like to extend my appreciation to our team of dedicated and talented employees, our committed smallholders, partners and suppliers. I am thankful to my colleagues on the Board for their advice and support. We are grateful to our shareholders whose trust and confidence have enabled the group to achieve good results.
Edward leechairman
10 Indofood AgrI resources Ltd
AnnuAl REPORT 2017

dEAR ShAREhOldERS,
2017 was an improved year for edible oil farmers recovering from contracted supplies precipitated by the severe 2015 el niño drought. the volume increases have been accompanied by rebounding commodity prices, while consumption was uplifted by global economic growth. In Indonesia, the stable rupiah, along with its vast population, rising affluence and fast-growing middle class, provided continued impetus for growing domestic demand.
during the year, the group’s ffB nucleus and cPo output increased by 4% and 1% to 3,109,000 tonnes and 842,000 tonnes respectively. In Brazil our sugar operations under cMAA had a record year crushing 4.1 million tonnes of cane, a 11% increase from 2016, and achieving 100% of our operating capacity. this is a 36% increase in cane crushing since we invested in 2013, and demonstrates the strong growth in our Brazil operations.
IndoAgri posted a strong financial result in 2017. the group’s consolidated revenue grew by 9% to rp15.8 trillion year-on-year, and our core profit, excluding the effects of foreign currency fluctuations and changes in fair values of biological assets and a one-off gain, grew by 37% to rp640 billion in 2017. net profit after tax declined by 18% to rp653 billion. the decline was mainly due to lower gross profit arising from higher fertiliser application and lower sugar contribution, negative effects from foreign currency fluctuations and changes in fair values of biological assets, and the absence of a rp107 billion claim from a contractor for a significant delay in the completion of a turnkey project.
gearing for stronger demandAs a leading producer in the world’s second largest market for palm oil consumption, our key priorities have been to enhance operational capacities to capture growth
opportunities, as well as proactively improve operations, increase yields, raise productivity and control costs.
In line with higher palm consumption, as well as output from young estates coming into maturity, we had initiated a capacity expansion programme to construct three new palm oil mills. two of the mills were completed in 2017, with the third due for completion in 2019.
In addition, scheduled for 2018 is a programme to expand the processing capacity of the surabaya refinery by 300,000 tonnes per annum. collectively, these enhancements will boost the group’s combined annual cPo processing capacities by 21% upon completion in 2018.
our sugar and ethanol mill in Brazil has also been operating at 100% capacity. In line with our growth strategy in Brazil, we announced in february 2018 the acquisition of our second sugar and ethanol mill together with 6,048 hectares of land in Brazil. this is a 50:50 joint venture together with the same local partner that we have in cMAA. this new mill will expand our cane crushing capacity by 1.8 million tonnes per annum to 5.6 million tonnes. We plan to bring the new mill into operation in 2020, after completing the necessary cane plantings.
Refreshing our retail strategyBracing for the eventual ban of unpackaged cooking oils from the traditional markets in Indonesia, we have started to roll out affordably priced pillow-packed cooking oils under the group’s secondary brand of delima. this will cater to consumers making the shift from unbranded to branded cooking oils, while the refill packs sold under our Bimoli brand compete in the premium segments.
other than cooking oils, the group’s strategy to diversify downstream products for retail markets gained momentum.
cEO’S STATEmEnT
Our key priorities have been to enhance operational capacities to capture growth opportunities, as well as proactively improve operations, increase yields, raise productivity and control costs.
11 Indofood AgrI resources Ltd
AnnuAl REPORT 2017

this has enabled us to capture additional value afforded by our vertically integrated supply chain.
In 2017, the group acquired Pasir Luhur tea plantation in West Java. Among the most elevated tea plantations in Indonesia, the Pasir Luhur estate is an excellent environment for the cultivation of tea. We now have a series of premium black teas and white teas marketed in tea bags under the house brand of Kahuripan – a name synonymous with “Life” in Bahasa Indonesia.
over in south sumatra, our sugar operation expanded into retail sugar, allocating about 10% of its cane output to the production of 1 kg packs sold under the Indosugar brand. to test the market, we have been retailing the new product through IndoMaret stores in the vicinity of our sugar plantation. We expect to replicate this relatively lucrative operation in the central Java estate in due course.
We have also been exploring the production and marketing of retail chocolates made from our own cocoa beans. Previously, the cocoa is processed and sold to chocolate manufacturers. We expect to launch our first brand of consumer chocolate bars in 2018.
the group has a separate venture with daitocacao that will produce industrial chocolates for the manufacture of premium snacks and ice-cream coatings. the collaboration went into second gear as we marked the ground breaking at the site of our first chocolate factory in november 2017, with commercial production scheduled for 2019.
improving operational efficiencies Where it makes sense, we have continued to invest in machinery and automated processes alongside operational expansion. We now have a fleet of 13 mechanised cane harvesters deployed in our Indonesian sugar estates, and will be progressively replacing the manual packaging lines at our refineries with automated ones. this exercise allows us to free up valuable manpower for redeployment into higher value-added operations.
the group’s centralised erP system and the use of data analytics have continued to provide our teams with good visibility on crop conditions for improved agronomic strategies. We are currently migrating the platform to a newer software programme, which would allow us to take advantage of intelligent and predictive analysis on a real-time basis. In addition to this, to improve data mining efficiency and to reduce duplicative efforts, much of our in-field data is now collected via hand-held devices. the fingerprinting system that was used to monitor workers’ activities is now applied to authenticate data entries, thereby improving the accountability and accuracy of the data collected. With the upgraded erP system in place, we will be able to further improve the use and application of our data.
our r&d initiatives on yield enhancements and crop resilience have continued to contribute to the group’s sustainable production and long-term business competitiveness. In 2017, our seed breeding team produced a seed variety with unprecedented tolerance against a type of fungal disease that is fatal to palm trees. Initially, these new varieties will
be used for internal replanting activities to ensure that our own estates are fortified with the latest and highest-yielding disease-resistance palm seeds.
We have a separate r&d team in Indonesia specialising in the breeding of high-yielding sugar cane varieties – an intensive process involving a five-year selection programme that identifies suitable varieties for commercial use. In 2017, we initiated commercial plantings using our own cane varieties, which have proven to be higher yielding than our current varieties. this will help to boost our cane productivity and yields as we replant with improved varieties.
increasing sustainable productionAs food producers, we are constantly mindful of our responsibilities in food safety, quality and traceability. In 2017, our certified palm estates have produced a further 59,000 tonnes and 134,000 tonnes of sustainable cPo under rsPo and IsPo requirements, respectively. Pending the issue of official certificates, this would bring the group’s total rsPo- and IsPo-certified outputs to 447,000 tonnes and 389,000 tonnes respectively. the goal to achieving 100% sustainable palm oil sourcing by 2020 has been on track.
We started the largest smallholder certification project under the rsPo involving 3,144 smallholders responsible for 6,141 hectares of plasma plots. We are proud that as at end-2017, 1,902 hectares of smallholder estates have received rsPo certification. In addition, around 2,700 hectares that have passed the stage 1 audits and will be progressing to stage 2.
during the year, an enhanced sustainability Palm oil Policy 2017 encapsulating our core commitments on (i) zero deforestation and zero planting on high conservation value and high carbon stock areas (ii) zero planting on peatlands regardless of depth (iii) zero burning for land clearance
cEO’S STATEmEnT
ffB from the oil palm plantation
12 Indofood AgrI resources Ltd
AnnuAl REPORT 2017

Acknowledgementsthere is much to be grateful for in the 10 years since IndoAgri was successfully listed on the sgX. Personally, the greatest rewards have come from the shared camaraderie with many individuals, teams and partners who have weathered alongside as the group gained scale, including its diversification into sugar in 2008 and expansion into Brazil in 2013.
As an agribusiness committed to a triple bottom line of planet, people and profit, it has been our imperative to connect, engage and collaborate with our stakeholders, strengthen mutual interests and establish common goals. over the years, affirmation by professional bodies such as the singapore exchange, Institute of singapore chartered Accountants, singapore Institute of directors, Accounting and corporate regulatory Authority, media agencies, as well as this year’s accolade as first runner-up in the Investor relations Website survey by the Investor relations Professionals Association (singapore) and eQs group, are testaments of our efforts. We will continue to expand and develop our website for improved stakeholder communication.
our quest for continued success has been aptly captured by the theme of this year’s annual report: “embracing sustainability, Pursuing growth”. As we enter our next decade, I’d like to thank our shareholders and customers for their continued trust and support; our Board members for their leadership and unwavering commitment; as well as my fellow IndoAgri colleagues for their steadfast contributions over the last 10 years.
mark Julian wakefordchief executive officer and executive director
and (iv) respect for human rights including free, prior and informed consent, was issued. this policy was extended to all third party suppliers.
In Brazil, our sustainable cane production certified under the Bonsucro scheme was increased to 893,000 tonnes of cane covering 12,345 hectares, compared to 373,000 tonnes of certified cane harvested from 4,198 hectares in the previous year.
While certifications and policies remain integral to the group’s sustainability journey, they do not detract us from implementing many other programmes and activities with positive impact to the lives of those in our community. We continue to place heavy emphasis on occupational health and safety by promoting safety behaviours and conducting workplace safety training across our estates.
A complete disclosure of our sustainability efforts is published annually in the sustainability report. I encourage you to download the latest version to learn more about our sustainability programmes and achievements.
looking aheadAgricultural commodity prices will continue to remain volatile driven by mixed fundamentals and global developments. As a diversified and vertically integrated agribusiness with a dominant presence in Indonesia, our operations continue to be supported by a positive domestic economic outlook. the ongoing fiscal reforms in the areas of infrastructure and social security, the large domestic consumption, along with Indonesia being the second largest consumer of palm oil globally, will continue to support our operations. In Brazil, with our current sugar and ethanol mill now operating at full capacity, the second sugar and ethanol mill will enable us to increase our production by 2020.
new Palm oil mill at south sumatra
13 Indofood AgrI resources Ltd
AnnuAl REPORT 2017

IndoAgri is a vertically integrated agribusiness group with operations spanning the entire supply chain, from upstream plantation management and cultivation of oil palm to downstream refining, distribution and sales of edible palm oil and other palm-based derivatives. We have a total planted area of 300,387 hectares under our diversified business portfolio. this includes 247,630 hectares of oil palm, 19,869 hectares of rubber, 12,618 hectares of sugar cane and 20,270 hectares of other crops.
the Plantation division is IndoAgri’s principal business, contributing over 90% to the group’s overall eBItdA in 2017. It owns and operates 26 palm oil mills, four crumb rubber processing facilities, three sheet rubber processing facilities, two sugar mills and refineries, a cocoa mill and a tea mill. the group’s eof division owns and operates five cPo refineries across Indonesia.
the Plantation division also oversees two sugar operations outside Indonesia: a 50:50 joint venture with cMAA in Brazil, and an indirect interest in rHI in the Philippines.
gROuP PERFORmAncE REViEw
FinAnciAl highlighTSPalm production in 2017 recovered from the el-niño drought. ffB nucleus and cPo production increased, on a year-on-year basis, by 4% to 3,109,000 tonnes and by 1% to 842,000 tonnes respectively. our consolidated revenue grew by 9% to rp15.8 trillion in the year due mainly to higher sales contributions from the Plantation and eof divisions.
despite higher sales volume and selling prices of palm products, the group achieved lower profitability in 2017 on lower gross profit arising from higher fertiliser application and lower sugar contribution, negative effects from foreign currency fluctuations and changes in fair values of biological assets, and the absence of a rp107 billion one-off claim, partly offset by improved share of profits from a joint venture. the group reported a net profit after tax of rp653 billion compared to rp792 billion in the previous year. core profit, excluding foreign currency effect, biological asset gain and one-off gain, has increased by 37% to rp640 billion.
Revenue(rp trillion)
net Profit/(loss) to Owners of the company(rp trillion)
Profit from Operations(rp trillion)
14.513.815.8
2015 2016 2017
0.4
(0.0)
2015 (restated) 2016 2017
0.5
1.7
2.3
2015 (restated) 2016 2017
0.9
nAV per share(rp)
8,4788,081 8,671
201720162015 (restated)
14 Indofood AgrI resources Ltd
AnnuAl REPORT 2017

FinAnciAl POSiTiOn As at end-2017, the group’s total non-current assets of rp30.0 trillion was slightly higher than the previous year-end. the increase was attributable to share of profit from cMAA and investments in associates. this was partly offset by lower property, plant and equipment, and income tax refunds and lower advances for projects.
total current assets of rp7.4 trillion as at end-2017 were also higher by rp0.6 trillion than the previous year-end. the increase was mainly attributable to higher trade and other receivables, higher biological assets relating to agriculture produce and cash levels. this was partly offset by lower advances and prepayments and inventories.
As at end-2017, total current liabilities were rp6.4 trillion, or 37% higher than the rp4.7 trillion recorded last year. this increase in liabilities was due to higher trade payables relating to purchases of raw materials and fertiliser, and drawdowns of short-term working capital facilities to support the refinery and sugar operation and certain long-term facilities maturing in 2018. this was partly offset by lower customer advances and lower income tax payable.
total non-current liabilities were rp9.6 trillion, or 12% lower than the rp11.0 trillion recorded in end-2016 as a result of lower long-term loan facilities arising from payment of loan installments and the maturity of certain long-term facilities in 2018, lower amounts due to related parties
and lower deferred tax liabilities. this was partly offset by higher estimated liabilities for employee benefits, which was determined based on the actuarial calculations in accordance with the provisions of the Indonesian Labour Law.
the group has strengthened its financing structure by refinancing its usd loan facilities into rupiah facilities. As at end-2017, the group has reduced its usd facilities to 19% of total loans, compared to 27% in end-2016. the blended interest rate has reduced from 6.9% in 2016 to 6.3% in 2017.
cASh FlOwSthe group generated a cash flow of rp1.9 trillion from operations in 2017, as compared with rp2.0 trillion in 2016 arising mainly from improved working capital. during the year, rp1.7 trillion was used for investing activities, including capital expenditure relating to additions of property, plant and equipment and bearer plants, and investments in associates. these were mainly funded using the cash generated from operations and partially from bank borrowings.
net cash flow generated from financing activities was rp0.3 trillion. these were mainly related to proceeds from interest-bearing loans and borrowings to fund the operations.
In fY2017, the group generated a free cash flow of rp0.2 trillion, compared to the rp0.4 trillion reported last year. the group’s net cash increased by 0.5 trillion to rp2.9 trillion as at end-2017, compared to rp2.4 billion in 2016.
SuSTAinAbiliTythe group’s sustainability achievements for 2017 included the publication of an enhanced sustainable Palm oil Policy in february, reflecting its pledge not to plant on high carbon stock areas among other commitments. the group’s rsPo- and IsPo-certified cPo has increased to 447,000 tonnes and 389,000 tonnes, representing 53% and 46% of the total cPo produced in the year.
Additionally, the group’s Pluit refinery was named one of Jakarta’s top 10 companies with best environmental management practices by the Provincial government of Jakarta.
Loading of ffB at the oil palm estate
15 Indofood AgrI resources Ltd
AnnuAl REPORT 2017

gROuP PERFORmAncE REViEw
FinAnciAl highlighTS
in Rp billion in Sgd million *
2015 Actual
Restated **
2016 Actual
2017 Actual
2015 Actual
Restated **
2016 Actual
2017 Actual
net sales 13,835 14,531 15,827 1,422 1,493 1,626
gross Profit 2,969 3,489 3,195 305 359 328
gain Arising from changes in fair Values of Biological Assets 9 219 35 1 23 4
Profit from operations 901 2,263 1,678 93 233 172
net Profit After tax 37 792 653 4 81 67
Profit/(loss) attributable to owners of the company (48) 507 447 (5) 52 46
ePs (in rp)/(in sgd 'cents) (34) 363 320 (0.3) 3.7 3.3
current Assets 5,567 6,754 7,375 549 667 728
fixed Assets 21,762 21,722 21,492 2,147 2,143 2,121
other Assets 7,958 8,028 8,548 785 792 843
total Assets 35,287 36,504 37,415 3,482 3,602 3,692
current Liabilities 6,451 4,650 6,380 637 459 630
non-current Liabilities 8,656 10,975 9,612 854 1,083 949
total Liabilities 15,107 15,625 15,992 1,491 1,542 1,578
shareholders' equity 11,281 11,835 12,104 1,113 1,168 1,194
total equity 20,180 20,878 21,423 1,991 2,060 2,114
total debt 10,141 10,027 10,530 1,001 989 1,039
cash 1,969 2,405 2,930 194 237 289
in Percentage (%)
sales growth (7.5%) 5.0% 8.9%
gross Profit Margin 21.5% 24.0% 20.2%
Profit from operations Margin 6.5% 15.6% 10.6%
net Profit After tax Margin 0.3% 5.5% 4.1%
Profit/(loss) attributable to owners of the company Margin (0.3%) 3.5% 2.8%
return on Assets 1 2.6% 6.2% 4.5%
return on equity 2 (0.4%) 4.3% 3.7%
current ratio (times) 0.9 1.5 1.2
net debt to equity ratio (times) 3 0.40 0.37 0.35
total debt to total Assets ratio (times) 0.29 0.27 0.28
1 Profit from operations divided by total assets2 Profit/(loss) attributable to owners of the company divided by shareholders’ equity3 net debt divided by total equity
* 2015 to 2017 Income statement and Balance sheet items were converted at exchange rates of rp9,731/sgd1 and rp10,134/sgd1, respectively** the restated figures were related to the adoption of Amendments frs 16 and frs 41 Agriculture – Bearer Plants
16 Indofood AgrI resources Ltd
AnnuAl REPORT 2017

OPERATiOnAl highlighTSthe table below relates to business operations in Indonesia. for sugar operations outside Indonesia, please refer to page 27 of this annual report.
in hectares (unless otherwise stated) 2015 2016 2017
Planted Area – nucleusOil Palm 246,359 247,430 247,630 Mature 187,400 203,501 209,817 Immature 58,959 43,929 37,813Rubber 21,338 20,115 19,869 Mature 17,394 16,761 16,973 Immature 3,944 3,354 2,896Sugar cane 13,358 13,249 12,618Others 19,578 19,742 20,270 Mature 17,192 16,801 16,828 Immature 2,386 2,941 3,442Planted Area – PlasmaOil Palm and Rubber 90,316 90,463 89,441Age maturity of Oil Palm TreesImmature 58,959 43,929 37,8134 – 6 years 9,693 11,557 10,9447 – 20 years 116,094 121,318 117,346Above 20 years 61,612 70,626 81,527total 246,359 247,430 247,630distribution of Planted Areas – nucleusriau 56,461 56,464 54,766north sumatra 39,278 38,753 39,182south sumatra 95,586 96,077 95,751West Kalimantan 27,050 26,729 26,788east Kalimantan 65,290 65,041 65,309central Kalimantan 8,999 9,263 10,067Java 2,926 2,929 3,214sulawesi 5,043 5,280 5,310total 300,633 300,536 300,387Production Volume (’000 Tonnes)total fresh fruit Bunches (ffB) 4,693 3,964 4,043ffB nucleus 3,414 2,981 3,109crude Palm oil (cPo) 1,002 833 842Palm Kernel (PK) 235 201 205rubber 17 15 11sugar 2 68 65 54Sales Volume (’000 Tonnes)cPo 3 982 826 880 PK and PK related Products 1 230 194 211 rubber 16 13 12 sugar 67 66 50 oil Palm seeds (‘million) 10 10 11
1 comprised of PK, Palm Kernel oil (PKo) and Palm Kernel expeller (PKe)2 comprised of sugar production in south sumatra, share of sugar produced in central Java and refined sugar3 sales to external and internal parties
17 Indofood AgrI resources Ltd
AnnuAl REPORT 2017

2017 Oil Palm Production in indonesia
Total FFB
4.0Mtonnes
CPO
0.8Mtonnes
Oil Palm Seeds
15.5M
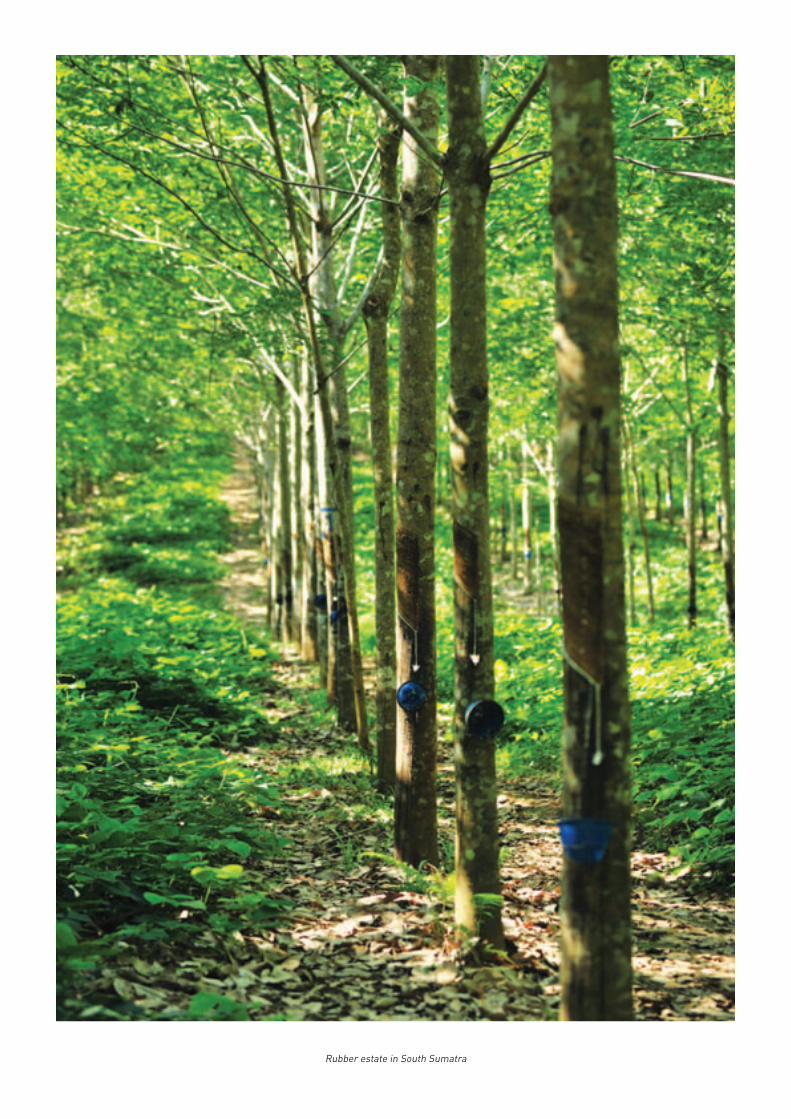
rubber estate in south sumatra

the Plantation division manages and cultivates various agricultural crops on IndoAgri’s estates, and is responsible for the production and sale of cPo, palm kernels and other palm oil by-products for domestic and international markets.
As at end-2017, the total area of planted oil palm estates covered 247,630 hectares, of which 15% or 37,813 hectares were immature estates. the age of oil palms averaged 15 years. the division also owns and operates 26 palm oil mills with a combined annual ffB processing capacity of 6.6 million tonnes.
our rubber estates are located in north and south sumatra, east Kalimantan and sulawesi. As at end-2017, the nucleus rubber estates occupied 19,869 hectares, of which 15% or 2,896 hectares were immature estates. the age of rubber trees averaged 16 years. the division operates four crumb rubber and three sheet rubber processing facilities on these estates.
the division also manages two advanced agricultural r&d centres: sumBio in Bah Lias, north sumatra, and Pt sAIn in Pekanbaru, riau. these centres specialise in high-tech seed breeding programmes and cultivation techniques. they produced a combined output of 15.5 million premium seeds in 2017.
2017 REViEwthe Plantation division’s total revenue in 2017 increased by 12% to rp10.1 trillion due to higher sales volume and
PlAnTATiOn REViEw – PAlm & RubbER
cPO vs Soy Oil Pricesus$/tonne
average selling prices of palm products, partly offset by lower sugar sales. our sugar production in south sumatra reported a 25% decline mainly due to high rainfall in 2016 and 2017, which affected the sucrose content and harvesting activities. In addition, the extended harvest period in 2016 also affected the cane yield for the current season.
cPo prices, cIf rotterdam, remained relatively firm at an average of us$717 per tonne in 2017 compared to us$704 per tonne in 2016. rubber prices (rss 3 sIcoM) recovered 21% to an average of us$2,001 per tonne in 2017 compared to us$1,647 per tonne in 2016, resulting from tighter supply due to higher rainfalls in thailand.
total ffB production in 2017 increased by 2% over last year. the higher production was mainly due to a 4% increase in nucleus ffB from the recovery of palm production post el-niño and the contribution from newly mature areas, but this was partly offset by lower external ffB purchases.
nine thousand hectares of newly mature oil palms were harvested during the year. A 30-tonnes-per-hour mill in south sumatra and a 40-tonnes-per-hour mill in West Kalimantan were completed and commissioned in 2017 to process the higher ffB production from these newly mature areas.
rubber production declined by 26% to 11,000 tonnes as some of the rubber estates were converted into oil palm plantations. forty-seven per cent of rubber products comprising sheet rubber and crumb rubber were exported, and the rest were sold in domestic markets.
Rubber Pricesus$/tonne
soy oil Premium over cPocPo (cIf rotterdam)
soy oil (cIf rotterdam) rss3 (sheet) tsr20 (Block form)
7,000
6,000
5,000
4,000
3,000
2,000
1,000
0
Dec
’06
Jun
’07
Dec
’07
Jun
’08
Dec
’08
Jun
’09
Dec
’09
Jun
’10
Dec
’10
Jun
’11
Dec
’11
Jun
’12
Dec
’12
Jun
’13
Dec
’13
Jun
’14
Dec
’14
Jun
’15
Dec
’15
Jun
’16
Dec
’16
Jun
’17
Dec
’17
Dec
’06
Jun
’07
Dec
’07
Jun
’08
Dec
’08
Jun
’09
Dec
’09
Jun
’10
Dec
’10
Jun
’11
Dec
’11
Jun
’12
Dec
’12
Jun
’13
Dec
’13
Jun
’14
Dec
’14
Jun
’15
Dec
’15
Jun
’16
Dec
’16
Jun
’17
Dec
’17
1,800
1,600
1,400
1,200
1,000
800
600
400
200
0
20 Indofood AgrI resources Ltd
AnnuAl REPORT 2017

Oil Palm PlantationAge Profile (247,630 hectares)
33%
47%
5%
15%
Immature 4-6 years 7-20 years 20 years
2018 OuTlOOKAgricultural commodity prices remain volatile driven by mixed fundamentals and global developments. these included crop yields, which are dependent on weather patterns, higher supply forecasts for other competing vegetable oil, slower demand growth from key markets such as china, and geopolitical uncertainties. nonetheless, we expect longer-term palm prices to be supported by lower production growth arising from the slowdown in new plantings.
As a diversified and vertically integrated agribusiness with a dominant presence in Indonesia, our operations are well supported by the positive domestic economic outlook, ongoing fiscal reforms in the areas of infrastructure and social security, and large domestic consumption. this is in addition to Indonesia’s status as the second largest palm consuming market globally, consuming around 15% of global palm supplies. We will continue to enhance our operational capacities to capture the growth opportunities, as well as proactively improve operations, increase yields, raise productivity and control costs.
the Plantation division intends to prioritise its capital expenditure allocation on immature estates and progressively replant the older palm trees in north sumatra and riau. With higher ffB production projected in the years ahead, we will continue to expand our milling capacities starting with the construction of another 45-tonnes-per-hour mill in Kalimantan with target completion in 2019.
to strengthen our market standing as a low cost producer, we will continue to optimise our value chain as well as implement a range of comprehensive and coordinated initiatives to increase yields, improve cost control and raise productivity on our estates. these include conducting 30-hectare block analyses to enhance crop management and planting densities, optimising fertiliser and herbicide usage, adopting crop management and harvesting best practices to maximise ffB collection and production, maximising asset utilisation, and improving mechanisation to increase efficiency and reduce costs.
We will also embrace technologies and innovations by increasing the use of drones and gPs tracking devices, leveraging data analytics to improve supply chain efficiencies, encouraging paperless and digital workflows through sAP enhancements, automation and new soPs, as well as drive the intended behaviours and outcomes by setting and implementing KPIs.
3,1093,4142,981
FFb Production (nucleus)(in ‘000 tonnes)
cPO Production(in ‘000 tonnes)
2015 2016 2017
833 8421,002
2015 2016 2017
21 Indofood AgrI resources Ltd
AnnuAl REPORT 2017

2017 Sugar and Ethanol Production
indonesia Total Own Cane
0.6M Sugar 54,000 tonnes
brazilTotal Cane
4.1M Sugar 316,000 tonnes
Ethanol 154,000 m3
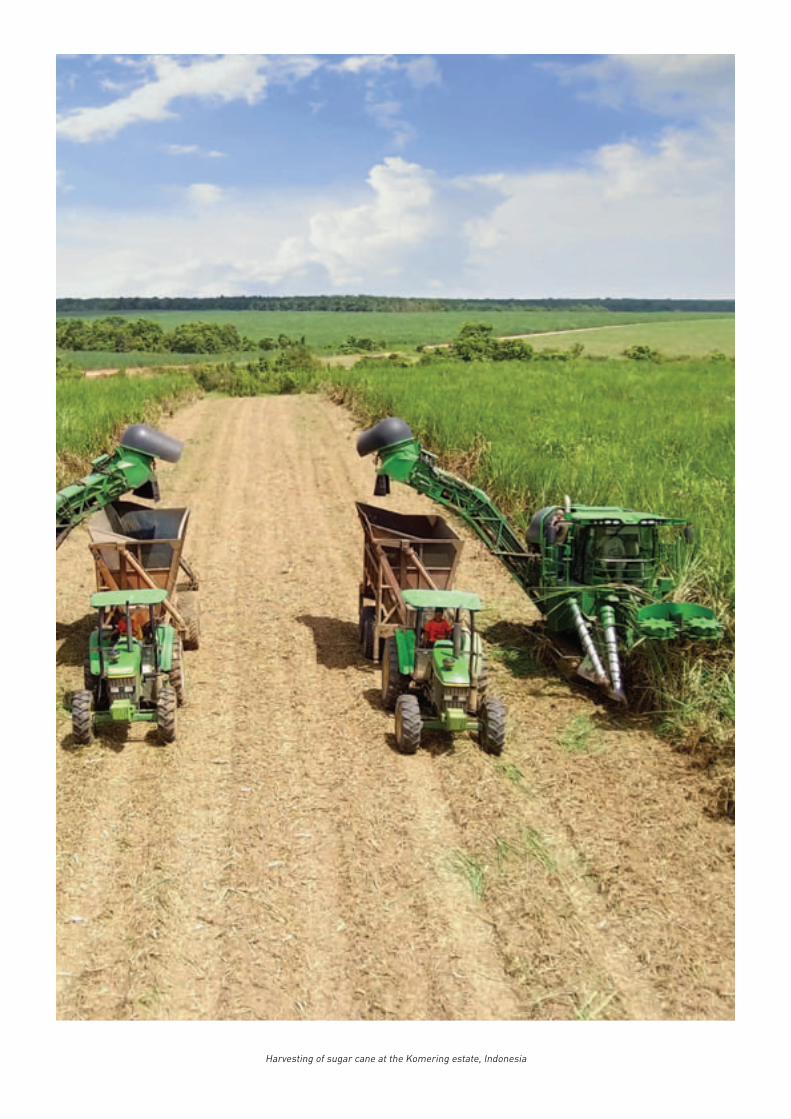
Harvesting of sugar cane at the Komering estate, Indonesia

sugar production at the Komering factory
the Plantation division’s sugar cane estates in south sumatra and central Java cater to the growing domestic demand for sugar. the estate in south sumatra is integrated with an 8,000-tonnes-of-cane-per-day (tcd) sugar mill and refinery with an annual crushing capacity of 1.44 million tonnes of cane, whereas the estate in central Java operates a 4,000-tcd sugar mill and refinery with an annual capacity of 0.72 million tonnes of cane.
Indonesia’s food self-sufficiency policy mandates strict import quotas on selected commodities, including sugar, to regulate domestic prices from external fluctuations. Imports are restricted when domestic prices fell below the thresholds stipulated by the government. the government raised the locally produced sugar floor price to rp9,100 per kilogramme in 2016. subsequently in 2017, the government has set a maximum sugar retail price in modern trade outlets of rp12,500 per kilogramme for sugar as part of the effort to manage inflation in Indonesia. domestic sugar prices have hovered above international market prices in the year.
5,992 hectares of sugar estates belonging to 307 farmers under supply agreements whereby credits were extended to the smallholders to acquire seed cane, fertilisers and agrochemicals with repayments deducted from their share of the sugar derived from the cane delivered to the factory. A total of 28,000 tonnes of sugar was produced at the central Java estate, of which the group’s share was 10,000 tonnes.
revenue from the division’s sugar operations in Indonesia decreased by 32% to rp530 billion mainly due to lower sugar volume sold and lower sugar selling price. this accounted for 5% of the Plantation division’s total revenue.
Operational highlights
unit 2015 2016 2017
Own Plantation:
Planted Area Hectares 13,358 13,249 12,618*
sugar cane Harvested ’000 tonnes 746 861 639
Sugar Production Volume:
south sumatra ’000 tonnes 58 58 44
Java (Pt LPI’s share) ’000 tonnes 10 7 10
Total Production ’000 tonnes 68 65 54
* the lower planted area was due to replanting being scheduled in 1Q 2018.
2018 OuTlOOKIn Indonesia, sugar consumption for food and beverages is expected to climb to 3.6 million tonnes in 2018 from an estimated 3.4 million tonnes this year. government policies aimed at expanding the sugar cane plantations, increasing production capacities and improving crop yield and productivity, coupled with strong market demand and Indonesia’s status as a net sugar importer will likely keep the domestic sugar industry buoyant in 2018.
We will continue to draw on our r&d capabilities to develop new breeds of higher-yielding seed cane varieties. A key focus moving forward would be to replant the sugar estates with higher yielding cane varieties.
We are also progressively increasing mechanisation for harvesting and other field activities to improve productivity and cost efficiency in our sugar plantations. this will require a change in the field layout and field sizes as we replant the cane to provide the optimal set-up for mechanisation. At the same time, we will increase the use of drones for crop monitoring and to support cane ripening. these initiatives will ensure that we optimise the existing production facilities in south sumatra and central Java in anticipation of the increased demand.
PlAnTATiOn REViEw – SugAR: indOnESiA
2017 REViEwIn 2017, the south sumatra estate processed 639,000 tonnes of sugar cane and produced 44,000 tonnes of sugar. the sugar production was lower than last year mainly due to higher rainfalls in 2016 and 2017, and the extended harvest period in 2016, which affected the sucrose content and harvesting activities respectively.
the total planted sugar cane area as at december 2017 in south sumatra was 12,618 hectares, of which 3,673 hectares were new plantings and replantings during 2017. during the year, the division planted the first new cane varieties developed in its own r&d facility. these varieties have undergone a five-year trial protocol and demonstrated higher yields than the current planted varieties.
the central Java factory processed 378,000 tonnes of sugar cane in 2017. the majority of sugar cane came from
24 Indofood AgrI resources Ltd
AnnuAl REPORT 2017

mAnuFAcTuRing PROcESS FOR SugAR
bOilER
FinAl mOlASSES
End cuSTOmERS
SugAR bOiling & cuRing
JuicE clARiFicATiOn & EVAPORATiOn
SugAR dRying & hAndling
FiniShEd SugAR PROducTS
FilTER cAKES
bAgASSEcAnE hAndling & milling
25 Indofood AgrI resources Ltd
AnnuAl REPORT 2017

cMAA sugar mill and ethanol plant in Brazil

the Plantation division has sugar plantations in Brazil and the Philippines. the estate in Brazil is held and managed through a 50% stake in cMAA. the sugar cane grown and harvested by cMAA is used to produce both sugar and ethanol, and the surplus bagasse is used in the co-generation of electricity. these activities are supported by a modern and highly efficient sugar mill in Minas gerais, Brazil, which has an annual crushing capacity of 3.8 million tonnes of sugar cane.
Brazil’s status as the world’s largest sugar producer and second largest ethanol producer is supported by its availability of land for growth, favourable climate, advanced agronomic knowledge and productive workforce. In 2017, Brazil was responsible for 22% of worldwide sugar production and 42% of the global sugar export market. It is also the world’s most cost-competitive sugar producer, and this has kept the Brazilian sugar industry on a steady upward trajectory.
In the Philippines, we have a 30% stake in fPnrL, which is a joint venture company created to invest in rHI, Philippines’ largest integrated sugar business. though fPnrL, IndoAgri has a 62.9% interest in rHI. rHI has three sugar mills, one in Batangas and two in negros occidental, with a total processing capacity of 38,500 tcd or an annual capacity of 6.2 million tonnes. this makes rHI the biggest sugar miller in the Philippines, accounting for 17% of the country’s entire sugar production. rHI is also the third largest sugar refiner in the Philippines, with a capacity of 18,000 Lkg per day at its Batangas refinery (1 Lkg is equivalent to 50 kg).
the Philippines is southeast Asia’s third largest sugar-producing country with an output of 2.5 million tonnes in 2017. More than 90% of the sugar produced is consumed domestically, with the balance exported primarily to the us, which imposes a quota on sugar imports from the Philippines.
2017 REViEwsugar no. 11 (csce) contract prices fell by 17% to an average of 15 cents us per pound in 2017, compared to 18 cents us per pound in the previous year. this is a 23% decrease in absolute terms from January to december 2017, exacerbated by bumper crops around the world and weak demand from major importers such as India (due to increased domestic production) and china (due to higher drawdowns in domestic stocks). this has resulted in a supply surplus for the sugar market after two consecutive years of global sugar deficits due to el niño effects and the lack of expansion in Brazil.
As at end-2017, cMAA has a planted sugar cane area of 49,204 hectares, of which 45% is owned by cMAA. A total of 4.1 million tonnes of harvested sugar cane was processed with over 100% utilisation rate to produce 316,000 tonnes of raw sugar, 154,000 m3 of ethanol and 392,000 MWh of electricity, the best year cMAA has had since its inception, and a 35% increase in cane crushed since we invested in 2013.
cMAA reported an increase in profitability in 2017 due to the higher sugar, ethanol and energy prices, higher
production outputs, lower production costs and lower foreign exchange impacts. IndoAgri’s share of cMAA’s profit amounted to rp139 billion, as compared with the loss of rp33 billion in 2016.
cMAA achieved Bonsucro certification for around 893,000 tonnes of sustainable sugar cane harvested from 12,345 hectares. this represents 22% and 56% of cMAA’s total cane crushed in 2017 and managed sugar cane planted area. the target is to achieve 100% Bonsucro certification for cMAA-managed cane fields by the end of the 2020/2021 harvest season. Bonsucro is a globally recognised sustainability standard and multi-stakeholder non-profit organisation.
In the Philippines, rHI processed 3.5 million tonnes of sugar cane from third-party suppliers and produced 325,000 tonnes of raw sugar, 69,540 m3 of ethanol and 175,000 tonnes of refined sugar in fY2016/17.
Operational highlights – cmAA
year Ended march
unit 2015/ 2016
2016/ 2017
2017/ 2018 *
Planted Area # Hectares 52,843 53,826 49,204
Harvested Area Hectares 45,739 45,953 47,022
cane crushing ’000 tonnes 3,703 3,690 4,092
Production Volume:
VHP ’000 tonnes 237 266 316
ethanol ’000 m3 149 136 154
energy ’000 MWh 368 339 392
* operation data is for nine months only# 45% of planted area is leased and planted by cMAA. the balance
55% belongs to third parties
Operational highlights – Rhi
year Ended September
unit 2014/2015
2015/2016
2016/2017
Production Volume:
tonnes cane milled ’000 tonnes 2,650 2,994 3,461
raw sugar ’000 tonnes 258 252 325
refined sugar ’000 tonnes 141 142 175
ethanol ’000 m3 50 76 70
PlAnTATiOn REViEw – SugAR: OuTSidE indOnESiA
27 Indofood AgrI resources Ltd
AnnuAl REPORT 2017

PlAnTATiOn REViEw – SugAR: OuTSidE indOnESiA
2018 OuTlOOKglobal demand for sugar is expected to remain soft amidst increased outputs in 2017. However in the medium term, we expect the market to return to a deficit. sugar prices are likely be strongly influenced by the production levels in major sugar-producing economies like Brazil, the eu, India and thailand as well as the petrol prices, which affects ethanol demand.
We will continue to tap on cMAA’s deep experience, advanced methodologies and knowledge in cane cultivation to improve the efficiency of the Indonesia sugar operations. We are studying opportunities for the next phase of expansion as the mill at cMAA are operating at full capacity.
world Sugar Production in 2016/17
BrAzIL 23% IndIA 12% eu 10% cHInA 6% tHAILAnd 6% us 4% MeXIco 4% russIA 4% PAKIstAn 4% AustrALIA 3% otHers 24%
TOTAl
177.9m TOnnES
source: LMc International
sugar cane plantation in cMAA, Brazil
28 Indofood AgrI resources Ltd
AnnuAl REPORT 2017

Packaging oil palm seeds at the r&d centre in north sumatra
the Plantation division’s agronomic research activities are spearheaded by its two r&d centres: sumBio at Bah Lias in north sumatra, and Pt sAIn at Pekanbaru in riau. the r&d programmes and priorities at these facilities are primarily focused on increasing yields and productivity, improving crop resilience, and enhancing good estate management practices.
Leading the r&d efforts are experienced scientists and researchers who are well versed in the cultivation and production of premium high-yielding oil palm seeds. Both sumBio and Pt sAIn are among 15 recognised oil palm seed producers in Indonesia certified to produce high quality planting material suited to the local climates.
for cane cultivation, we have a research team based in the south sumatran sugar estate. We also have an r&d team in Jakarta for our edible oils and fats business. collectively, the r&d activities have continued to contribute towards IndoAgri’s objectives for sustainable production and long-term business competitiveness.
the group’s r&d efforts cover:
• Plant breeding, which leverages biotechnology, a diverse germ-plasm base and other advanced cultivation techniques to produce top quality high-yielding disease-tolerant oil palm seeds and planting materials. for sugar, we have an extensive selection process whereby new cane varieties undergo a
PlAnTATiOn REViEw – R&d
rigorous five-year selection programme before the new commercial varieties are identified.
• Soils and hydrology, which involves soil surveys and analyses, hydrology studies to improve soil fertility and drainage, and the use of 3d topographical maps to plan optimal field layouts.
• Agronomy, which entails site-specific soil management and crop-cultivation techniques to ensure optimal crop management and planting densities, and fertiliser and herbicide usage on a block-by-block basis.
• crop protection, which emphasises the use of biological and naturally occurring agents for controlling pests and diseases.
• data capture and information management, which involves accurate as well as real-time data analysis using 2d and 3d maps derived from global Positioning systems (gPs) and ground surveys, and the use of integrated software systems for improved visibility of relevant data across all subsidiaries, refineries and plantations, to aid management decisions.
• Product development, which includes the development of specific formulations of edible oils and fats. this enables the division to meet the diverse requirements of industrial and retail customers as well as changing consumer preferences through new product releases.
our r&d efforts for sustainable production include:
• Soil and water conservation, specifically the control of soil erosion, cultivation of Legume cover crops to improve soil fertility for new plantings, stabilisation of soil on steep slopes and canal banks using Vetiver systems, and measures to ensure good drainage in low-lying areas and to keep the water table at optimum height for plant growth.
• Fertiliser management programmes, which entail a fully integrated strategy to provide site-specific formulations for individual plantation blocks based on the yield target, annual foliar analysis, soil fertility, fertiliser trials, and nutrient release from soil and plant residue. While organic and inorganic fertilisers are used in combination to ensure optimum palm nutrition, priority is given to inorganic fertiliser usage where appropriate.
• Recycling of palm oil mill by-products, such as empty fruit bunches (efB) and palm oil mill effluent (PoMe), which are used together as soil mulch. this has cut our annual requirement for inorganic fertilisers by 14%, while the co-composting of efB and PoMe potentially replaces up to 30% of inorganic fertiliser usage per year.
• integrated pest and disease management, which includes the use of biological control agents such as barn owls and entomopathogenic microbes. With the
29 Indofood AgrI resources Ltd
AnnuAl REPORT 2017

effectiveness of our barn owl programme, the use of rodenticides has been discontinued in riau since 2011. each year, some 8,000 and 2,000 owlets are produced in our riau and south sumatra estates, respectively. this is in addition to the planting of beneficial flowers to attract natural parasitoids and predators. the incidence of crop damage caused by leaf-eating caterpillars is monitored and analysed using sAP and Web-gIs. this has enabled timely interventions and effective control of all major leaf-eating pests. for the sugar cane estates, we have an extensive programme for the breeding of natural predators such as the black earwigs. this has significantly reduced the risk of pest outbreaks.
• Training and collaboration, which involves deriving new operational solutions through research methodologies, regular inspection visits to the plantations to evaluate field conditions and advise on current agronomy issues, and regular training for estate personnel on the latest agronomic practices for crop protection, and soil and crop management.
2017 REViEwthe group sold 11.3 million oil palm seeds in 2017 compared to 9.7 million a year ago. each year, about 200 seeds per hectare would be set aside for the division’s own planting activities, while the majority is sold to external customers.
to ensure the sustainable development of high-yield, disease-tolerant palm progenies, both Pt sAIn and sumBio carried out crossbreeding programmes. for example, to improve the quality traits of palm seed progenies, sumBio introduced a range of pollen sources from ghana to be hybridised with Pt sAIn’s ghana materials. this complemented and broadened the genetic base of both breeding populations, while retaining the original genetic background and branding in the improved varieties.
the palm seed varieties released over the last two years by our r&d centres have produced higher yields per hectare and are more resistant to diseases compared to previous varieties. this has resulted in a more productive use of limited land resources. similar results are being achieved with our r&d programmes for cane breeding. In 2017, we
PlAnTATiOn REViEw – R&d
Laboratory activities at sumbio in north sumatra
30 Indofood AgrI resources Ltd
AnnuAl REPORT 2017

visibility of field conditions. We plan to increase the use of data analytics alongside statistical and census methods to improve the accuracy of yield forecasts. the detailed analyses of the physicochemical soil properties across different terrain and agro-climatic environments will enable us to improve site-specific fertiliser recommendations for optimised yields.
other r&d improvements will include pest and disease management and precision agronomy via improved crop management strategies, as well as optimal planting densities, fertiliser and rsPo-compliant herbicide usage. such initiatives will deliver higher and more profitable yields per hectare, reduce production costs, and maintain a balanced nutrient programme for sustainable growth and a cleaner environment.
embarked on commercial cane planting activities using our own cane varieties, which have higher yields compared to previously planted crops.
to manage the risks posed by counterfeit seed distributors, Pt sAIn and sumBio have each developed a process to authenticate and tag their seed products using laser and ultraviolet (uV) printing technology.
to reduce pesticide use, we continued to monitor the progress of trees and beneficial plants planted along the estate roads to encourage a favourable ecosystem for natural insect predators and parasitoids. We deployed entomopathogenic agents such as fungi, bacteria and viruses as biopesticides, as well as uV light traps to inhibit the occurrence of leaf-eating caterpillars. crop protection efforts were further intensified in 2017 with the use of drones. this has enabled us to efficiently observe the agronomic conditions in the field, in addition to monitoring the spatio-temporal patterns of pest attacks using detailed census data from our sAP system.
the use of drone images, along with data feeds from geographic Information systems (gIs), ground gPs and unmanned aerial vehicles, such as fixed-wing systems and drone quad-copters, supported our precision agronomy objectives. the timely and reliable data harnessed through these tools have enhanced our responsiveness to varying soil and crop conditions, including nutrient status and the prevalence of pests and diseases. this has enabled us to proactively prevent potential agronomic issues and optimise manpower and resource deployment. We pioneered the use of drones to chemically ripen the cane in our sugar estates in Indonesia.
r&d has remained at the core of product innovation in catering to the growing demands and discerning tastes of Indonesian consumers. this included customised formulations of cooking oils and specialty fats required by f&B manufacturers and patisseries. In addition, we continue to provide r&d support for the design of cost-efficient and environmentally friendly packaging materials.
2018 OuTlOOKHigher demands, driven by rising consumer affluence and growing population size as well as new planting activities, will continue to provide the impetus for our r&d activities. In the year ahead, we will continue to focus on the cultivation of premium, high-yielding oil palm seed materials and improved cane varieties, along with the deployment of bio-control methods, which enable the biodiversity of our estates to be preserved.
We will continue to fine-tune our agronomic practices and improve our soil and water management programmes using highly detailed 3d topographic maps. We will also leverage our mechanisation programmes to improve resource allocation and streamline existing work processes.
our integrated sAP enterprise resource planning system, which has been progressively upgraded over the years, will enable us to capture more real-time data points for better
use of ground gPs at the estate
31 Indofood AgrI resources Ltd
AnnuAl REPORT 2017

2018 OuTlOOKIn 2018, demand is projected to rise for specialty fats products. We will increase the utilisation of downstream assets and enhance production capacities to broaden the range of specialty fats products. to capture sales opportunities in eastern Indonesia, we are expanding the capacity of our surabaya refinery by 300,000 tonnes per annum.
to supplement these efforts, we will continue to work on new product offerings and implement competitive pricing strategies. We remain committed to ongoing efforts to rationalise products, review product specifications and packaging, as well as enhance process automation to manage operational costs.
With the eventual ban of unpackaged cooking oils in Indonesia, the Ministry of commerce implemented a domestic Market obligation initiative to encourage consumers to switch from bulk cooking oils to branded packed oils. We will ride on this initiative to drive our branded market segment as well as promote the delima brand.
We will also strengthen our supply chain management to enhance customer service, and work closely with the Indofood group to widen our market coverage and grow our distribution network.
EdiblE OilS & FATS REViEw
eof division manufactures and markets IndoAgri’s downstream products, which include cooking oils, margarine, shortening and other by-products derived from cPo refining and fractionation. the division owns and operates five refineries located strategically in major Indonesian cities near deep-water ports. the refineries have a total annual cPo processing capacity of 1.4 million tonnes.
our consumer cooking oils are marketed domestically under the leading brands of Bimoli, Bimoli spesial, delima and Happy, while our consumer margarine and shortening are packed and sold under the Palmia and Amanda brands. Bimoli, in particular, is a household name and an award-winning consumer brand. Its accolades include the Indonesia Best Brand Award (triple Platinum Level), Indonesian customer satisfaction Award, Halal top Brand and Indonesia original Brand 2017.
our industrial cooking oils are sold directly to the Indofood group and other f&B manufacturers, while our industrial margarine and shortening are marketed to confectioners, bakeries and other food manufacturers under the Palmia, simas, Amanda, Malinda and delima brands.
We supplement our sales and market penetration efforts by leveraging the distribution channels of the Indofood group. As a result, we have good access to direct sales channels, as well as local and national distributors serving retail outlets across Indonesia.
2017 REViEwduring 2017, the eof division purchased approximately 874,000 tonnes of cPo during the year, 64% of which was from the group’s own plantations, for the production of cooking oils and margarine. the division also produced and sold small amounts of palm-based derivatives, such as refined, bleached and deodorised (rBd) palm stearin and palm fatty acid distillate.
revenue from the eof division increased by 8% to rp10.4 trillion in 2017 due mainly to higher sales of cooking oil and margarine products. this was supported by increased consumption of branded products in Indonesia. Branded consumer products contributed over half of the division’s revenue, while the improvement in sales volumes was attributed to competitive pricing and heightened marketing activities such as brand campaigns and tactical promotions.
sales contribution from the eof division accounted for 66% of the group’s external sales in 2017. the revenue derived from Indonesia was 88%, while the balance came from exports to 25 countries, including china, Malaysia, Myanmar, nigeria, Papua new guinea, singapore, south Korea, sri Lanka, the Philippines and timor Leste.
As part of ongoing efforts to enhance brand experiences, the division rejuvenated the packaging for the Bimoli range of cooking oil products, and lightened the colour of the oil to appeal to more consumers. filling of cooking oil into refillable package
32 Indofood AgrI resources Ltd
AnnuAl REPORT 2017

mAnuFAcTuRing PROcESS FROm FFb TO cOnSumER PROducTS
EmPTy FRuiT bunchES And liquid
cRudE PAlm KERnEl Oil
Rbd PAlm OlEin PAcKAging
cRudE PAlm Oil
REFining
Rbd PAlm Oil
Rbd PAlm STEARin
ShORTEning
FlAVOuRing & ViTAminS
wATER & SAlT
niTROgEn gAS
cOOKing Oil
mARgARinE
milling
PAlm KERnEl
cRuShing PAlm KERnEl mEAl
blEndingblEnding
lAuRic Oil
FRAcTiOnATing & FilTRATiOn
mARgARinE PlAnT
mixing TAnK
chilling
PAcKAging
mixing TAnK
chilling
PAcKAging
PAlm FATTy Acid diSTillATE
FRESh FRuiT bunchES
33 Indofood AgrI resources Ltd
AnnuAl REPORT 2017

Sustainable Practices, delivering commitments
NO new plantings
on peat, primary forest and HCV land
53% of total
CPO production certified to RSPO
46% of total
CPO production certified to ISPO
29% of sites
certified to SMK3 (Health & Safety) Gold

turnera subulata, an example of biological control

IndoAgri operates an agribusiness that contributes to the growing global demand for edible oils and fats. When grown responsibly, oil palms can make efficient use of scarce land resources, provide a source of livelihood for local communities and contribute to economic growth. Both efficiency and innovation are essential factors to achieve sustainable agriculture, resilient communities and safer workplaces.
KEy SuSTAinAbiliTy highlighTS in 2017
• certified cPO in indonesia– 447,000 tonnes of rsPo-certified cPo, representing
53% of total production in 2017– 389,000 tonnes of IsPo-certified cPo, representing
46% of total production in 2017
• certified Sugarcane in brazil– 893,000 tonnes of Bonsucro-certified production,
representing 22% of total cMAA crushed cane in 2017/2018 harvest season
• Occupational health and Safety– 29% or 31 palm oil sites awarded sMK3 gold for Health
and safely Management certification (sMK3)– zero fatality in palm oil operations; one fatality in rubber
operations
• worker welfare – strict compliance with minimum wage regulations– no registered IndoAgri worker below 18 years old– seasonal workers contracts comply with government
regulations
• Smallholders– Achieved 1,902 hectares or 60% of rsPo certification
target under the smallholder programme with IdH– 48 training days delivered under a pilot programme
KEy SuSTAinAbiliTy TARgETS
• to achieve rsPo and IsPo certification for all palm oil production by 2019
• to achieve zero fatality in 2018 and to reduce accident frequency rate by 10% between 2018-2020
• to achieve 100% product traceability and sustainable palm oil sourcing by 2020
• to achieve Bonsucro certification for all cMAA-managed cane fields by the end of the 2020/2021 harvest season
• to reduce energy consumption in palm oil mills and refineries by up to 5% and 3% respectively by 2018 from the usage rate in 2016, when the programme started
• to reduce water consumption per ffB processed in palm oil mills by 3% by 2018 from the usage rate in 2016, when the programme started
• to certify 24 palm oil mills and 3 refineries to Iso 14001 by 2019
SuSTAinAbiliTy AT indOAgRi
cOmmiTmEnT• Mission• Policies• Mission• Policies
REPORTing• Annual report• sustainability
report
ASSESS TO imPROVE• Indicators• targets• evalution
through audit• Materiality
review AcTiOn• r&d• Management systems• certifications• stakeholders engagement• Internal collaboration• training
PlAnning• government
policy• corporate
business• Programmes
1-6
SuSTAinAbiliTy mAnAgEmEnT
36 Indofood AgrI resources Ltd
AnnuAl REPORT 2017

SuSTAinAbiliTy mAnAgEmEnTdirected by IndoAgri’s sustainable Palm oil Policy, the group continues to make progress in achieving responsible and traceable supplies by integrating sustainable practices into its operations and supply base.
our management approach aims to respond to risks and opportunities related to the environment, communities and other stakeholders, with efforts supported by well-trained personnel, formal processes, an accountable culture, and partnership with stakeholders.
globally, rsPo certification continues as a vital part of achieving a sustainable palm oil supply. According to an rsPo report, plantations covering a total of 3.2 million hectares across 16 countries were rsPo-certified as of mid-2017, an increase of 14% from the previous period.
the 2016 new York declaration on forests assessment report looked at 415 companies with active management to help eliminate deforestation in the supply chain. In the palm oil sector, 59% of the companies had committed to commodity-specific policies1. IndoAgri is one of them.
SySTEmATic APPROAchcommitment – guided by our mission and values, our sustainability team comprises competent professionals who manage the material topics and impacts to preserve value over the long term.
Planning – the group accounts for wider macro trends and risk using an enterprise risk Management system. this is supported by sound corporate governance, internal controls and transparency. We apply innovation and r&d to invigorate assets, as well as improve integration and diversity, in our efforts to drive growth in domestic and international markets. We run six sustainability Programmes to deliver improvements across a range of key material issues. our materiality assessments since 2013 are fully aligned with the grI reporting principles, and clearly captures the material topics and impacts in the value chain.
Action – Policies, commitments and programmes are enforced by people who take action on the ground to deliver palm oil ‘from seed to shelf’. We use management systems and standard operating procedures to maintain quality and drive improvements in areas such as r&d, personal safety, food safety, environmental management and information control. the sustainability team coordinates the initiatives underlying the achievement of certifications such as rsPo, IsPo and ProPer. We engage various stakeholders including customers, communities, suppliers and civil society organisations in managing sustainability risks, opportunities and impacts.
Assess and report – the sAP enterprise data system and the sustainability information system are used to collate data to monitor the progress and targets of the sustainability programmes. evaluation is carried out through the use of audits, performance trends and stakeholder feedback.
details of our management approach, including materiality assessment and stakeholder engagement, can be found in the IndoAgri sustainability report on our website.
SuSTAinAbiliTy gOVERnAncEIndoAgri’s corporate governance complies with relevant laws and regulation and safeguards shareholders’ interests. the Board actively reviews the sustainability issues, validates the material environment, social and governance factors and oversees their management and monitoring.
overall guidance on sustainability is led by the ceo in consultation with the Management, the erM unit, the r&d team and the sustainability representatives from all business units, reporting to the Board. the Board is updated on a quarterly basis through the Audit & risk Management committee on matters relating to material sustainability risks and concerns. the ceo personally takes part in the discussions and correspondences relating to ongoing impacts in the field.
In July 2017, IndoAgri’s ceo won the Best ceo (Mid cap) Award at the singapore corporate governance Awards where sustainability is a key judging criterion. In the zoological society of London’s sustainability Policy transparency toolkit (sPott) report 2017, which assessed 50 of the world’s largest palm oil producers and traders on the public disclosure of their policies, operations and commitments to environmental, social and governance practices, IndoAgri was scored ‘green’ for higher transparency.
STAKEhOldER EngAgEmEnTSour key stakeholder groups are employees, customers, investors, government and civil organisations, and local communities. We connect, engage and collaborate with them
Barn owls as biological control agents
37 Indofood AgrI resources Ltd
AnnuAl REPORT 2017

to strengthen mutual interests and establish common goals. regular contact with the stakeholders has been integral to the development of our sustainability policy and the delivery of our commitments. At the core of the group’s initiatives for product safety management are customer engagement activities that include audits, public seminars and customer satisfaction surveys. certification to rsPo and IsPo also involves customer engagement and close cooperation with grower cooperatives called Kuds and government ministries to improve plasma management by the smallholders.
community engagements include fire control awareness, land ownership issues and social impact assessments, which require strong community relations and support. community engagement is done via annual community development forums to discuss impacts and investments in areas, such as education and community health.
supplier engagement continues to be an important process for IndoAgri to meet its policy commitments in areas such as agronomy and well-managed operations.
SuSTAinAbiliTy PROgRAmmESIn 2013, 11 task forces were formed to run six core Programmes and to monitor and improve each material topic to deliver the commitments in our sustainable Palm oil Policy.
1: growing Responsibly this Programme sets the policy framework for high standards of corporate governance, risk management, leadership and professional integrity. All our business interactions must be conducted in an ethical, honest, and accountable manner, in accordance with prevailing laws and regulations. the Board evaluates governance and integrity based on our code of conduct. We do not lobby for commercial agriculture contracts or favourable commercial terms. this Programme forms the foundation for the other five Programmes by nurturing the capacity and competencies of IndoAgri employees and plasma smallholders.
2: Sustainable Agriculture and Products this Programme drives sustainable practices in cultivation, milling and refining. By adopting sustainability standards, such as Iso 14001, High conservation Value/High carbon stock assessments, and food safety Management systems, the Programme helps to improve carbon management and
Kayangan estate in riau which achieved a ProKLIM village award
SuSTAinAbiliTy AT indOAgRi
38 Indofood AgrI resources Ltd
AnnuAl REPORT 2017

training for Posyandu volunteer in West Kalimantan
fire brigade at one of the riau estates
mitigate climate change impacts through projects related to forestry, land use, agriculture, transport and waste.
3: Safe and Traceable Products this Programme, guided by the company’s quality assurance policy, ensures that all cPo-derived products are traceable, safe, and beneficial for human consumption. It ensures compliance with international and local regulations and certifications. food safety is a requisite condition to qualify as IndoAgri suppliers, as stated in the sustainable Palm oil Policy and responsible supplier guidelines. Many of our products are fortified with minerals and vitamins as required by legislation. We are able to trace all ffB that arrive at our mills to their nucleus and managed plasma plantations. We also use barcodes to track ffB shipments from our plasma farms.
4: Smallholders this Programme promotes good agriculture practices, efficient land use, legal labour practices and rsPo and IsPo certification among our plasma growers. the Programme also sets out practical guidelines on local community engagement, land rights, free, Prior and Informed consent and plasma management. IndoAgri fully supports the nucleus-plasma scheme that was created by the Indonesian government for plantation companies to develop oil palm plots near their plantations for smallholders. About 53% of our oil palm plasmas are managed independently by smallholders.
5: work and Estate living this Programme sets out to ensure that the safety, health, wellbeing and basic human rights of our workers and their families living on our estates are properly taken care of. We provide free basic amenities, proper sanitation, clean water supply, waste collection, and electricity, for the people living on our estates, and work closely with local governments, hospitals and communities to ensure the people living on our estates can access essential services and common facilities, such as clinics and health posts, sports and worship facilities, schools, childcare centres, and allotments of vegetables and fruits.
6: Solidarity this Programme seeks to improve the quality of life in the estates through capacity building, education and financial support. We conduct social impact assessments at our estates and factories through an external party and develop specific programmes that can address the needs of each community. the assessment takes into account factors such as the local culture, level of education and economic condition of the local community. community projects implemented over the years have helped to improve infrastructure, disaster relief, local entrepreneurship, education, the environment and health. examples include the cleft lip surgeries for children from poor families and the government-initiated ProKLIM project to make villages more resilient initiated and energy efficient.
39 Indofood AgrI resources Ltd
AnnuAl REPORT 2017

bOARd OF diREcTORS
mR lEE KwOng FOO, EdwARdchairman and lead independent director
Mr Lee spent 36 years in the singapore Administrative service (foreign service Branch), during which he served as singapore’s High commissioner in Brunei darussalem (1984 to 1990), Ambassador to the Philippines (1990 to 1993) and Ambassador to Indonesia (1994 to 2006).
Mr Lee was awarded the Public Administration Medal (silver) in 1996, the Long service Medal in 1997, the Public Administration Medal (gold) in 1998 and the Meritorious service Medal in 2006 by the singapore government. In 1993, the Philippines government bestowed on him the order of sikatuna, rank of datu (grand cross).
In 2007, the Indonesian government awarded him the highest civilian honour, the Bintang Jasa utama (first class).
Mr Lee holds a Masters of Arts degree from cornell university.
mR lim hOcK SAnVice chairman and independent director
Mr Lim is presently the President and ceo of united Industrial corporation Limited. He is also the non-executive chairman and Independent director of gallant Venture Ltd. Mr Lim started his career in 1966 with the then Inland revenue department of singapore. He became an Accountant at Mobil oil Malaya sdn Bhd in 1967 before joining the Port of singapore Authority in 1968, where he served in various management positions. from 1975 to 1992, he was with the civil Aviation Authority of singapore and held the position of director-general.
Mr Lim has a Bachelor of Accountancy degree from the then university of singapore, a Master of science (Management) degree from the Massachusetts Institute of technology and attended the Advanced Management Program at Harvard Business school. He is a fellow of the chartered Institute of Management Accountants (uK) and a fellow and past President of the Institute of certified Public Accountants of singapore. He is a recipient of the singapore government Meritorious service Medal, the Public Administration Medal (gold) and the Public service Medal.
mR mARK JuliAn wAKEFORdchief Executive Officer and Executive director
Mr Wakeford is the President director of Pt sIMP and Pt Lajuperdana Indah, and director of Lonsum and cMAA. He started his career with Kingston smith & co, a firm of chartered Accountants in London, england.
Mr Wakeford has been in the plantation industry since 1993, working with plantation companies in Indonesia, Papua new guinea, soloman Islands and thailand. He started his plantation career in Indonesia as the finance director of Lonsum in 1993, before moving to Papua new guinea as the cfo of Pacific rim Plantations Limited (PrPoL) from 1995 to 1999. In 1999, Mr Wakeford became ceo and executive director of PrPoL. PrPoL was sold to cargill in 2005, Mr Wakeford spent one year with cargill, before joining the company in January 2007. He became ceo of the company in August 2007 and is concurrently a member of rabobank’s Asia food and Agribusiness Advisory Board.
Mr Wakeford was trained and qualified as a chartered Accountant in London, england. He also attended the senior executive Programme at the London Business school.
40 Indofood AgrI resources Ltd
AnnuAl REPORT 2017

mR mOlEOnOTO TJAngExecutive director and head of Finance and corporate Services
Mr tjang is a director of Pt Indofood sukses Makmur tbk. He is concurrently a commissioner of Pt Indofood cBP sukses Makmur tbk, Vice President director of Pt sIMP and President commissioner of Lonsum. He started his career in 1984 with drs. Hans Kartikahadi & co., a public accounting firm in Jakarta. Before joining the Plantations division of the Indofood group as cfo, he has held various management positions in the Plantations division of the Indofood group and salim Plantations group.
Mr tjang was awarded a Bachelor of Accountancy degree from the university of tarumanegara, Jakarta, a Bachelor’s degree in Management and a Master of science degree in Administration & Business Policy from the university of Indonesia. He is a registered accountant in Indonesia.
mR SuAimi SuRiAdyExecutive director and head Of EOF division
Mr suriady is a director of Pt Indofood cBP sukses Makmur tbk, where he heads the snack food division. He concurrently serves as director of Pt sIMP. He began his career with an automotive battery distributor, Pt Menara Alam teknik of Astra group and moved on to join consumer goods manufacturer, Konica film and Paper.
Mr suriady was awarded a Master of Business Administration from de Montfort university in the united Kingdom.
mR TJhiE TJE FiEnon-Executive director
Mr tjhie is a director of Pt Indofood sukses Makmur tbk. He is concurrently director of Pt Indofood cBP sukses Makmur tbk, where he supervises all financial operations and oversees the Beverages division. He is also the President commissioner of Pt sIMP. He has previously served as a director of Lonsum and Pt Indomiwon citra Inti and as a senior executive of Pt Kitadin coal Mining. Mr tjhie was awarded a Bachelor’s degree in Accounting from the Perbanas Banking Institute in Jakarta.
bOARd OF diREcTORS
41 Indofood AgrI resources Ltd
AnnuAl REPORT 2017

mR AxTOn SAlimnon-Executive director
Mr Axton salim is a director of Pt Indofood sukses Makmur tbk. He is also a director of Pt Indofood cBP sukses Makmur tbk, where he heads the dairy and the Beverages division. He is concurrently a commissioner of Pt sIMP and Lonsum and non-executive director of gallant Venture Ltd. He also serves as co-chair of scaling up nutrition (sun) Business network Advisory group and director of Art Photography centre Ltd.
Mr salim was awarded a Bachelor of science in Business Administration from the university of colorado, usA.
mR gOh KiAn chEEindependent director
Mr goh is a consultant at the national university of singapore’s (nus) centre for the Arts. He is also an Independent director of AsiaMedic Limited and HL global enterprises Limited.
Mr goh started his career as an audit trainee with goldblatt & co (uK). He joined American International Assurance Pte Ltd in 1981 as an Accounting supervisor. In 1982, he became a regional Internal Auditor in Mobil oil singapore Pte Ltd and rose to the position of regional credit and Insurance Manager in 1987. In 1990, he was seconded to Mobil PetrochemicalsInternational Ltd where he served as regional Accounting Manager and later, as the controller of the Asia Pacific region till 2000. Before his present role in nus, Mr goh was the regional Vice President & controller as well as an executive director of John Hancock International Pte Ltd. He was also an Independent director of china Minzhong food corporation Limited from october 2013 to March 2017.
Mr goh has a Bachelor of Arts (Hons) degree in Accounting and economics from Middlesex university, united Kingdom.
mR hEndRA SuSAnTOindependent director
Mr susanto is an audit committee member of Pt Indofood sukses Makmur tbk, Pt Indofood cBP sukses Makmur tbk and Lonsum. He began his career as an Account relationship Manager of standard chartered Bank’s corporate Banking division in 1990. He joined Pt BnP Lippo Leasing in 1993 as the Head of the corporate Marketing division. In 1996, he joined Pt Ing Indonesia Bank as Vice President in the Project and structured finance division and was subsequently promoted to director in the Wholesale Banking division of the bank. Mr susanto also acted as the chief representative of Ing Bank n.V. in Indonesia until 2005.
Mr susanto has a Bachelor of computer science degree and a Master of commerce degree from the university of new south Wales, Australia.
42 Indofood AgrI resources Ltd
AnnuAl REPORT 2017

cORPORATE inFORmATiOn
diREcTORS
chairman and lead independent directorLee Kwong foo, edward
Vice chairman and independent directorLim Hock san
chief Executive Officer and Executive directorMark Julian Wakeford
Executive director and head of Finance and corporate ServicesMoleonoto tjang
Executive director and head of EOF divisionsuaimi suriady
non-Executive directortjhie tje fie
non-Executive directorAxton salim
independent directorgoh Kian chee
independent directorHendra susanto
ExEcuTiVE cOmmiTTEE
Mark Julian Wakeford (chairman)tjhie tje fieMoleonoto tjangsuaimi suriady
AudiT And RiSK mAnAgEmEnT cOmmiTTEE
goh Kian chee (chairman) Lim Hock san Hendra susanto
nOminATing cOmmiTTEE
Lee Kwong foo, edward (chairman)tjhie tje fie Lim Hock san Hendra susanto
REmunERATiOn cOmmiTTEE
Lim Hock san (chairman) tjhie tje fie goh Kian chee
REgiSTRAR
Boardroom corporate & Advisory services Pte. Ltd. 50 raffles Placesingapore Land tower #32-01, singapore 048623
REgiSTEREd OFFicE
8 eu tong sen street#16-96/97 the centralsingapore 059818
cOmPAny SEcRETARiES
Lee siew Jee, Jennifer Mak Mei Yook
AudiTORS
ernst & Young LLPone raffles Quaynorth tower, Level 18singapore 048583
AudiT PARTnER
Vincent toong Weng sum(Appointed since financial year ended 31 december 2016)
43 Indofood AgrI resources Ltd
AnnuAl REPORT 2017

storage tanks at tanjung Priok refinery

45 INDOFOOD AGRI RESOURCES LTD
ANNUAL REPORT 2017
The Board of Directors (“Board”) and Management of Indofood Agri Resources Ltd. (the “Company” and together with its subsidiaries, the “Group”) firmly believe that good corporate governance is critical to the sustainability and long-term success of the Group’s businesses and performance. The Board is responsible for the corporate governance framework and policies, and is committed to upholding high standards of corporate governance in achieving a culture of accountability and transparency within the Company.
This report sets out the key aspects of the Company’s corporate governance framework and practices, with reference to the principles and guidelines of the Code of Corporate Governance 2012 (“2012 Code”). The Company has complied with all material aspects of the 2012 Code, with exception to Guidelines 4.4, 8.4, 9.2 and 9.3.
For Guideline 4.4, the Nominating Committee (“NC”) has reviewed the participation and contribution of the current Directors, as well as the number of meetings they have attended in 2017. The NC is satisfied that all the Directors have devoted sufficient time to the affairs of the Company. They have adequately discharged their duties as Directors and provided objective views to the Board and Management.
The Board believes that the number of listed company directorships held by its Directors is contingent upon individual capacity. The Company requires all its Directors to provide an annual affirmation of their ability to allocate the time and commitment necessary to carry out their Board responsibilities. In addition, the Directors were selected based on their experience, expertise and ability to contribute to the Board. As such, the Board does not see a need at present to stipulate a policy for the maximum number of listed company board representations that a Director may hold.
For Guideline 8.4, the Company does not stipulate a policy for the reclamation of variable incentives. However, the Remuneration Committee (“RC”) has the discretion not to award or reclaim the variable incentives from Executive Directors and key management personnel in exceptional circumstances involving material misstatement of financial results or misconduct resulting in financial loss to the Company.
As for Guidelines 9.2 and 9.3, the exact remunerations of the Directors and the CEO are not disclosed after the Board and Management have carefully considered the competitive nature of the industry and the potential for such information to be used by competition to undermine the Company’s efforts in attracting and retaining talent.
CORPORATE GOvERNANCE STRUCTURE
SHAREHOLDERS
BOARD OF DIRECTORS
EXECUTIVE COMMITTEE
ENTERPRISE RISKMANAGEMENT
AUDIT AND RISKMANAGEMENT COMMITTEE
INTERNAL AUDIT
REMUNERATIONCOMMITTEE
NOMINATING COMMITTEE
BOARD MATTERS
Board’s Conduct Of Its Affairs [Principle 1]The Board comprises Directors with a wide range of skills and experience in operations management, banking, finance, accounting, risk management and industry knowledge. The Board has reviewed the qualifications of its Directors and is satisfied that they possess the necessary competencies to lead and govern the Company effectively. A brief biography of each Director is given on pages 40 to 42 of this Annual Report.
Roles and Responsibilities:The principal functions of the Board are to:• review the financial performance and condition of the Group;• approve the Group’s strategic plans, key operational initiatives, major investment, divestment and corporate
restructuring, as well as major funding decisions;• identify principal risks of the Group’s businesses, and implement systems to manage these risks;• assume the responsibility of corporate governance;• reviews the sustainability issues, validates the material environment, social and governance factors and oversees
their management and monitoring;• establish and maintain exemplary values and standards for the Company; and• ensure all statutory obligations to shareholders and other stakeholders are understood and met.
CORPORATE GOvERNANCE

46 INDOFOOD AGRI RESOURCES LTD
ANNUAL REPORT 2017
CORPORATE GOvERNANCE
Board Approval: The Company has adopted internal guidelines, which set out all matters requiring the Board’s approval as specified under the Singapore Exchange Securities Trading Limited’s (“SGX-ST”) Listing Manual. Some of the material items that require the Board’s approval would include the Company’s strategic and operating plans, quarterly and full-year financial results, dividend matters, issuance of shares, succession plan for the Board and Senior Management such as Chief Executive Officer (“CEO”), Chief Financial Officer (“CFO”) and Chief Operating Officer (“COO”), acquisition and divestment of businesses exceeding certain material limits, and all material commitments to term loans, lines of credit and credit support from banks and financial institutions.
Directors’ Duties and Obligations: All the Directors shall exercise independent judgement and objectively discharge their duties and responsibilities in the best interest of the Company. This is one of the performance criteria for peer and self-assessment in the NC’s annual evaluation on the effectiveness of the individual Directors. Based on these assessments for 2017, all the Directors have discharged this duty. In addition, a Director is required to declare any conflict of interest in a transaction or proposed transaction, and abstain from participating in the deliberation of such transactions by the Board and/or its Committees.
Board Committees: In discharging its responsibilities and fiduciary obligations more effectively, the Board is assisted by the Executive Committee (“Exco”) and various Board Committees including the Audit and Risk Management Committee (“AC & RMC”), the NC and the RC. The Board Committees are actively engaged and play a key role in enhancing corporate governance, improving internal controls and driving the performance of the Group. Each of these Board Committees has clearly defined terms of reference, which set out its duties, authority and accountabilities. The terms of reference are reviewed annually.
The Exco is chaired by Mr Mark Julian Wakeford, and comprises Messrs Tjhie Tje Fie, Moleonoto Tjang and Suaimi Suriady as its members. The Board delegates the Exco certain discretionary limits and authority for business development, investment, divestment, capital expenditure, finance, treasury, budgeting, human resource and business planning. The Exco is entrusted to execute the business strategies approved in the annual budget and business plan, implement the appropriate accounting systems and other financial controls, put in place a robust risk management framework, monitor compliance to laws and regulations, adopt competitive human resource practices and compensation policies, and ensure that the Group operates within the approved budget.
Board and Board Committee Meetings: All Board, Board Committee and Annual General Meetings (“AGM”) for the year are scheduled in advance in consultation with the Directors. The Board and Board Committees meet regularly to discuss the Group’s business results and performance, strategic decisions and policies, operational matters and governance issues. The Board meets at least four times each year. For the Board Committees, the AC & RMC meets eight times each year, while meetings by the RC and NC are held at least once a year.
The Company’s Constitution provides for the Board and Board Committee meetings to be conducted via telephone or any other forms of communication facilities as well as decisions to be made by way of written resolutions. Directors who are unable to attend the Board and Board Committee meetings are provided with the meeting materials, to facilitate follow-ups on any matters covered in the meetings.
The Directors’ attendance at the Board and Board Committee meetings held during the financial year ended 31 December 2017 is set out below:
Description Board AC & RMC NC RCNumber of meetings held in 2017 5 8 1 1Name of directors Number of meetings attendedLee Kwong Foo, Edward 5 – 1 –Lim Hock San 3 6 1 1Mark Julian Wakeford 5 – – –Moleonoto Tjang 4 – – –Suaimi Suriady 4 – – –Tjhie Tje Fie 3 – 1 1Axton Salim 3 – – –Goh Kian Chee 5 8 – 1Hendra Susanto 5 8 1 –
Chairman
“-” refers to not applicable
CORPORATE GOvERNANCE

47 INDOFOOD AGRI RESOURCES LTD
ANNUAL REPORT 2017
CORPORATE GOvERNANCE
Training and Induction for Directors: The Board recognises the importance of continuous professional development in order to contribute effectively to the Board. All newly appointed Directors are briefed by the respective Chairmen of the Board on key areas and issues. In addition, new Directors are required to undergo orientation and training conducted by the Senior Management to familiarise them with the Group’s organisation, business operations, strategic direction, industry trends and developments, governance practices, as well as their statutory and other responsibilities as Directors. There was no new Director appointed in 2017.
The Directors receive continuing education and training in areas pertaining to their duties and responsibilities, corporate governance, and the changes to relevant laws and regulations, such as the SGX-ST Rules, Code of Corporate Governance, Companies Act, as well as financial reporting standards. The Directors are also invited to attend seminars and trainings organised by the Singapore Institute of Directors (“SID”) and various professional bodies and organisations to stay abreast of relevant developments and issues in financial, legal, corporate governance and regulatory requirements.
In 2017, some of the Directors participated in the following seminars and training programmes:• Executive seminars including “The Sustainability Imperative”, “Audit Committee Seminar 2017” and “Strategy at the
Board Level” organised by the SID.• “4th Singapore Dialogue on Sustainable World Resources” organised by Singapore Institute of International Affairs.• “EmTech Asia”, a seminar hosted by MIT Technology Review.• “Solving the Triple Challenge to Agriculture”, a conference hosted by World Agricultural Forum and the S. Rajaratnam
School of International Studies, Nanyang Technological University.• “Innovative Dynamic Education and Action for Sustainability 6.0”, a one-year programme conducted by The MIT
Sloan School of Management.• “New Business Models, Evolving Business Models and Strategy in the Years Ahead”, a seminar organised by
Singapore Management University.• “3rd Annual Mixed-Use Development”, a seminar organised by marcus evans.
BOARD COMPOSITION AND GUIDANCE [PRINCIPLE 2]Board Independence: The Board is required to determine on an annual basis whether a Director is deemed to be independent based on the guidelines in the 2012 Code and the assessment of the NC. The Board is required to take into account the existence of relationships or circumstances that are relevant to its evaluation. The 2012 Code states that the independence of any Director who has served on the Board beyond nine years from the date of his first appointment should be subjected to a more rigorous review. The NC reviews the independence of each Non-Executive Director annually. The results of the assessments conducted in 2018 are disclosed under “Annual Assessment of Directors’ Independence”.
Board Composition and Size: The Company recognises and views diversity at the Board level as a critical aspect in achieving its strategic objectives and long-term sustainability. The NC ensures a balanced representation at the Board by taking into consideration factors such as the diversity of skills, knowledge, experience, gender, background and ages of all the Directors. The NC reviews the Board’s composition and succession plans annually to ensure they are commensurate with the Group’s business and operations.
As at 31 March 2018, the Board comprises nine Directors, of whom three are Executive Directors, two are Non-Executive Directors and four are Independent Directors. Taking into account the nature and scope of the Company’s operations, the Board and the NC concur that the current Board size is appropriate and adequate for effective decision making. Three out of the nine Directors, namely the CEO, Mr Mark Julian Wakeford, and the Executive Directors, Messrs Moleonoto Tjang and Suaimi Suriady, are deemed to have extensive experience in plantation and downstream refinery operations in Indonesia.
Board Information: The Directors receive updates from the Management on relevant business initiatives, industry developments, and matters relating to the Group or the industries in which it operates. The Directors also receive analysts’ reports on the Group and other plantation companies from time to time, which provide updates on key issues and developments in the industry, as well as the challenges and opportunities for the Group. As part of ongoing efforts to maximise the effectiveness of the Board, site visits to the plantations, mills and factories are arranged periodically for the Directors. Where necessary, the Directors may seek professional advice, either individually or as a group, to support their duties.
During the year, the Board engaged a law firm, Rajah & Tann Singapore LLP, to brief the Directors on the amendments to the Companies Act and the SGX-ST Listing Manual, as well as the necessary amendments to be made to the Company’s Constitution.
CORPORATE GOvERNANCE

48 INDOFOOD AGRI RESOURCES LTD
ANNUAL REPORT 2017
CORPORATE GOvERNANCE
Board of DirectorsName Status Position Exco AC & RMC NC RCLee Kwong Foo, Edward Lead Independent Chairman ChairmanLim Hock San Independent Vice Chairman Member Member ChairmanMark Julian Wakeford Executive Member ChairmanMoleonoto Tjang Executive Member MemberSuaimi Suriady Executive Member MemberTjhie Tje Fie Non-Executive Member Member Member MemberAxton Salim Non-Executive MemberGoh Kian Chee Independent Member Chairman MemberHendra Susanto Independent Member Member Member
Non-Executive Directors’ Participation: The Non-Executive Directors are encouraged to attend the Board meetings, participate actively in discussions about the Company’s strategic plan and issues, review the Management’s performance against targets, and monitor the reporting of the Company’s performance. The Non-Executive Directors may schedule, as and when necessary, to meet without the presence of Management on matters such as Board processes and practices, corporate governance initiatives, succession planning, leadership development and remuneration matters.
CHAIRMAN AND CHIEF EXECUTIvE OFFICER [PRINCIPLE 3]Separation of Roles: The roles of Chairman and CEO are held by separate persons, each with his own area of responsibilities and accountabilities, to ensure an appropriate balance of power and independence.
The office of the Chairman is assumed by Mr Edward Lee, who is also the Lead Independent Director. He is a Non-Executive Director and is unrelated to the CEO or other members of the Management. As the Chairman, Mr Edward Lee bears the responsibility for the proper functioning of the Board and the effectiveness of its governance processes.
The Chairman works closely with the CEO to develop the agenda for the Board meetings, and ensures that the Corporate Secretary disseminates complete, accurate and timely information to the Directors for their reading prior to the meetings. During the Board meetings, the Chairman facilitates open and objective debates among the Directors to encourage their active contributions as well as to carefully deliberate on all the agenda items, especially the strategic issues, for sound decision-making. The Chairman also plays an important role in fostering constructive exchanges amongst the shareholders, the Board and Management at the AGM and other shareholder meetings.
Mr Mark Julian Wakeford holds the office of the CEO. His responsibilities include charting and reviewing the corporate directions and strategies, which cover the areas of marketing and strategic alliances, and providing the Company with strong leadership and clear vision. The CEO, supported by the Exco, is responsible for the day-to-day operation and management of the businesses. The CEO is accountable to the Board for all decisions, actions and performance of the Group.
Lead Independent Director: Mr Edward Lee, who chairs the Board and the NC, is the Lead Independent Director. The role of the Lead Independent Director includes meeting with the Non-Executive Directors as and when such meetings are deemed necessary. He is also available to shareholders on matters of concern that cannot be resolved through contact with the CEO or CFO, or where such contact is deemed inappropriate.
BOARD MEMBERSHIP [PRINCIPLE 4]Nominating Committee (“NC”): The NC, chaired by Mr Edward Lee, with Messrs Lim Hock San, Tjhie Tje Fie and Hendra Susanto as members, meets at least once a year to carry out the following duties and functions:• review the Board succession plans for Directors and Management;• recommend to the Board all board appointments and re-nomination of Directors in consideration of their respective
contribution and performance;• ensure all Directors submit themselves for re-nomination and re-election at regular intervals and at least once
every three years;• determine annually whether a Director is independent, according to the 2012 Code;• assess the ability of a Director to adequately carry out his duties especially when he has multiple board
representations;• decide on the evaluation criteria for the Board’s performance; and• review the professional training and development programmes for the Board.

49 INDOFOOD AGRI RESOURCES LTD
ANNUAL REPORT 2017
CORPORATE GOvERNANCE
Appointment of New Directors and Re-nomination of Directors: The NC adopts the following process when selecting and appointing new Directors and re-nominating Directors should the need arise:• review annually the size and composition of the Board to ensure that there are sufficient independent Directors; • leverage the help of external sources such as recruitment firms to identify potential candidates in consultation with
the controlling shareholders and Management;• consider the age, experience, gender and knowledge of potential candidates when selecting a new Board member
to ensure sufficient diversity in the Board to maximise its effectiveness;• consult with the Board and Management to determine the selection criteria and suitability of the potential candidates
based on their values and track record, core competencies, and ability to devote time and effort to carry out their role and duties independently and effectively; and
• recommend the best candidate to the Board for approval.
Re-nomination of Directors: The NC is also responsible for the re-nomination of Directors, taking into consideration factors such as their attendance record and participation at Board meetings. Pursuant to the Company’s Constitution, at each AGM, at least one-third of the Directors shall retire from office by rotation. Existing Directors shall submit themselves for re-nomination and re-election at least once every three years, unless the member is disqualified from holding office. Newly appointed Directors shall submit themselves for re-election at the AGM immediately following the appointment.
Annual Assessment of Director’s Independence: The NC reviewed the independence of each Non-Executive Director in February 2018 based on the respective Directors’ self-declaration in the Directors’ Independence Checklist and their performance on the Board and Board Committees, and was satisfied that the Company has complied with the guidelines of the 2012 Code, which required at least one-third of the Board to be made up of Independent Directors.
All the Independent Directors, Messrs Edward Lee, Lim Hock San, Goh Kian Chee and Hendra Susanto have been with the Board for more than 10 years. The NC was of the view that the four Independent Directors demonstrated independent judgement in the best interests of the Company at the Board and Board Committee meetings. These Directors have continued to provide valuable and objective contributions to the Board through their in-depth knowledge and involvement in the industry. As non-executives, they have no affiliation to the Company, its related corporations, substantial shareholders or Management that could affect or compromise their independence or impartiality in the Group’s day-to-day operations. There has been no increase in Director’s fees for the past few years, and the level of remuneration paid to these Independent Directors does not compromise their objectivity.
The NC has deemed that Messrs Edward Lee, Lim Hock San, Goh Kian Chee and Hendra Susanto have fulfilled their obligations as Independent Directors. The Board has considered the views of the NC and concurred with their assessments on the independent status of the four Independent Directors.
Annual Assessment of Director’s Commitment: For Directors with board representations in other public-listed companies, the NC has reviewed whether they would be able to carry out their fiduciary duties as Directors of the Company based on the level of participation and contribution of the respective Directors, as well as the number of meetings they have attended in the year. The NC was satisfied that all the Directors had devoted sufficient time to the affairs of the Company. They adequately discharged their duties as Directors and provided objective views to the Board and Management. The Board does not see a need at present to stipulate a policy for the maximum number of listed company board representations that a Director may hold.
Alternate Directors: The Company has no Alternate Directors on its Board.
Nominee Directors: The NC does not see a need for Nominee Directors, and therefore no formal policy has been put in place for the appointment of Nominee Directors.
BOARD PERFORMANCE [PRINCIPLE 5]Evaluation of the Board, Board Committees and Directors: As recommended by the NC, the Company has implemented an annual process to evaluate the overall performance and effectiveness of the Board, the Board Committees, and the contribution of the Chairman and respective Directors, using the NC’s recommended performance criteria.
Where appropriate, the Board may recommend changes to the assessment forms to align with prevailing regulations and requirements.
Every year, all Directors are required to complete the following appraisal forms:• Board Assessment – This evaluates the effectiveness of the Board in key areas such as governance, leadership and
strategy, Board meetings and decision-making, Board performance, development and training, control and risk management, and communication.

50 INDOFOOD AGRI RESOURCES LTD
ANNUAL REPORT 2017
CORPORATE GOvERNANCE
• Board Committees Assessment – This evaluates the effectiveness of the AC & RMC, RC and NC based on key criteria recommended by the “Nominating Committee Guide in Singapore”.
• Peer Assessment – This evaluates the performance of each Director based on their level of commitment, standard of conduct, competency, attendance at meetings, training and development, and interaction with other Directors, Management and stakeholders.
The Chairman is also assessed by his fellow Board members on his ability to lead, establish proper procedures to ensure the effective functioning of the Board, and facilitate meaningful participation and open communication during Board meetings.
The NC assesses the contributions of each Director and ways to improve the Board’s performance. A report of the evaluation, including the key areas for improvement and recommendations, is presented to the Board for consideration.
The Board has reviewed the NC’s report and agrees with the findings that the Directors have been effective and met the performance objectives in 2017.
ACCESS TO INFORMATION [PRINCIPLE 6]The Company Secretary is competent in company laws and company secretariat practices to provide effective secretarial support to the Board and its various committees, which includes taking minutes of the meetings, ensuring compliance with Board procedures and regulatory requirements, and assisting the Board to implement and strengthen corporate governance policies and processes.
The Company Secretary attends all the Board meetings and is directly accountable to the Board, through the Chairman, on all matters relating to the proper functioning of the Board, including its compliance with the Company’s Constitution, the Companies Act, the Securities and Futures Act and the SGX-ST Listing Manual. The Company Secretary acts as the primary point of contact between the Company and the SGX. The appointment and removal of the Company Secretary is subject to the approval of the Board.
In providing secretarial support to the Board and Board Committees, the Company Secretary is responsible for circulating the schedules of the meetings to the Directors at the beginning of the calendar year. Board papers and related materials, such as financial results, project updates, budgets and forecasts are circulated to the Directors before the meeting and in a timely manner so that they can consider the issues adequately and engage in productive discussions during the meetings.
The Company Secretary may invite other Management members or external consultants to the meetings to present or advise on specific matters. The Directors have direct and independent access to the Company Secretary as well as the Management, and are regularly updated on significant developments and events regarding the Group. The Directors may seek professional advice, either individually or as a group, in executing their duties. The cost of such professional advice is borne by the Company.
REMUNERATION MATTERS
PROCEDURES IN DEvELOPING REMUNERATION POLICIES [PRINCIPLE 7]Remuneration Committee: The RC is chaired by Mr Lim Hock San, with Messrs Tjhie Tje Fie and Goh Kian Chee as members. All the RC members are Non-Executive Directors. Messrs Lim Hock San and Goh Kian Chee are also Independent Directors. The RC meets at least once a year to review and approve the remuneration package and terms of employment of the Company’s Directors and Key Executives.
The RC covers all aspects of remuneration, including Director’s fees, salaries, allowances, bonuses and benefits-in-kind. RC members are refrained from deciding on their own remuneration. For Key Executives, the RC also recommends their termination payments, retirement payments, gratuities, ex-gratia payments, severance payments and other similar payments, while ensuring the fair and reasonable termination clauses that are not overly generous have been provided for in their service contracts.
The RC consolidates the Director’s fees as a total sum and submits it, along with the other recommendations, to the Board for endorsement before tabling it for shareholders’ approval at the AGM. The RC is also empowered to review the human resource management policies of the Group.

51 INDOFOOD AGRI RESOURCES LTD
ANNUAL REPORT 2017
CORPORATE GOvERNANCE
LEvEL AND MIX OF REMUNERATION [PRINCIPLE 8]The remuneration policy seeks to reward the Executive Directors and Key Executives based on their performance and contributions to the Group, and to ensure the remuneration is commercially competitive to attract and retain the right talent.
Remuneration of Independent Directors and Non-Executive Directors: The RC adopts a base fee remuneration model for the Independent Directors. The Chairmen of the Board and Board Committees who are Independent Directors are paid higher fees in view of their greater responsibilities. Independent Directors who are involved in Board Committees are paid additional fees for their services. If the Independent Director is required to travel on behalf of the Company, the Company will reimburse the travel expenses incurred along with a prescribed travel allowance.
Non-Executive Directors are not paid a Director’s fee or other forms of remuneration. This is to avoid compromising their independence of views.
Remuneration of Executive Directors and Key Executive: The RC approves the framework of remuneration for the Executive Directors and Key Executives. The RC exercises broad discretion and independent judgement, and consults with controlling shareholders to ensure that the compensation amount and remuneration mix are appropriate for the Company and the respective roles. The remuneration mix of the Executive Directors and Key Executives consists of two components: an annual fixed cash component comprising an annual basic salary and other fixed allowances, and an annual variable cash incentive that is directly linked to the performance of the Company, the respective operating unit and the individual.
Appropriate Key Performance Indicators (“KPI”), covering the six strategic objectives of crop, cost, condition, people, process and product, are used to assess individual performance and to determine the quantum of annual rewards and cash incentives. In determining the quantum for the variable component of the remuneration, the RC takes into account the extent to which the KPIs have been met. The RC has the discretion not to award or to reclaim the variable incentives from the Executive Directors and Key Executives in exceptional circumstances involving material misstatement of financial results or misconduct resulting in financial loss to the Company. The RC is satisfied that the remuneration is aligned to the performance of the Executive Directors and Key Executives in 2017.
DISCLOSURE ON REMUNERATION [PRINCIPLE 9]The salary band of every Director and Key Executive is to be duly disclosed with a breakdown, either in percentage or dollar terms, of the remuneration earned as stipulated by the 2012 Code. The exact remuneration of the Directors and the CEO are not disclosed after the Board and Management have carefully considered the competitive nature of the industry and the potential for such information to be used by competition to undermine the Company’s efforts in attracting and retaining talent.
Director’s Remuneration: The remuneration of the Directors and the CEO paid by the Company and its subsidiaries, for the financial year ended 31 December 2017 are as follows:
Name of Directors Fixed/variable Salary Director’s FeesAbove S$1,250,000Mark Julian Wakeford 100% –Moleonoto Tjang (1) 100% –Below S$250,000Lee Kwong Foo, Edward – 100%Lim Hock San – 100%Goh Kian Chee – 100%Hendra Susanto – 100%Tjhie Tje Fie (2) – –Axton Salim (2) – –Suaimi Suriady (2) – –
(1) Remuneration paid by PT Salim Ivomas Pratama Tbk.(2) Remuneration paid by PT ISM or other companies in the PT ISM Group.
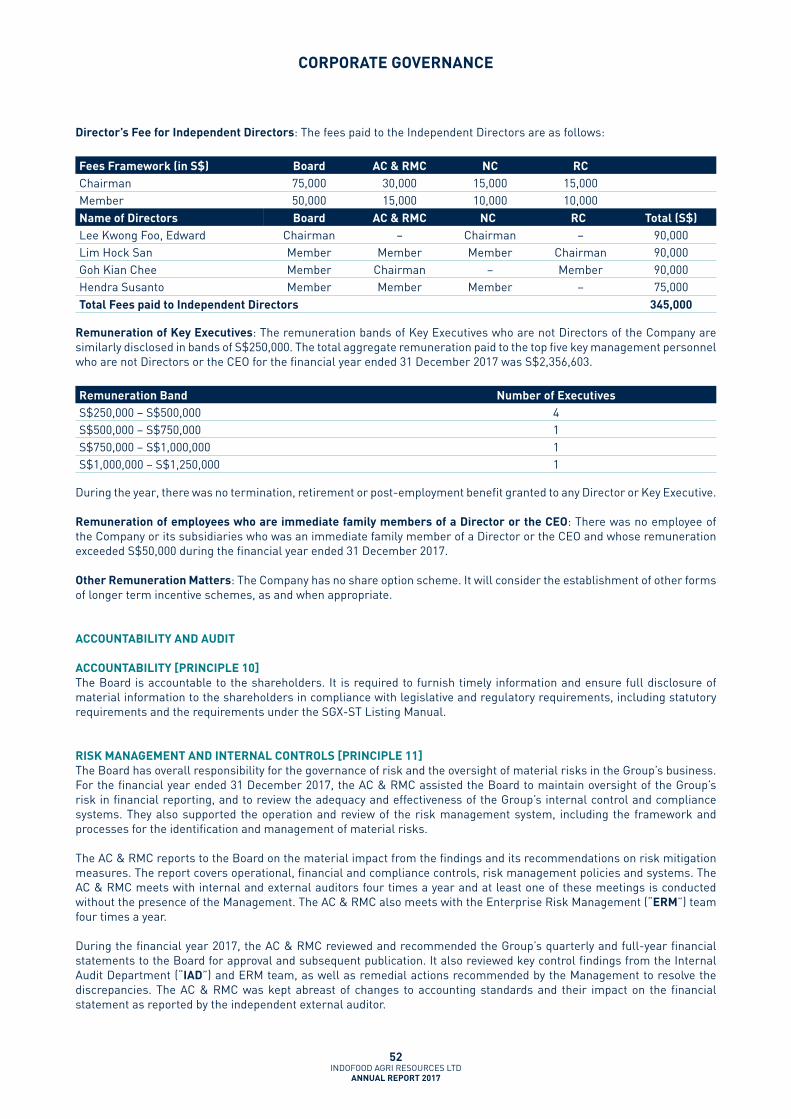
52 INDOFOOD AGRI RESOURCES LTD
ANNUAL REPORT 2017
CORPORATE GOvERNANCE
Director’s Fee for Independent Directors: The fees paid to the Independent Directors are as follows:
Fees Framework (in S$) Board AC & RMC NC RCChairman 75,000 30,000 15,000 15,000Member 50,000 15,000 10,000 10,000Name of Directors Board AC & RMC NC RC Total (S$)Lee Kwong Foo, Edward Chairman – Chairman – 90,000Lim Hock San Member Member Member Chairman 90,000Goh Kian Chee Member Chairman – Member 90,000Hendra Susanto Member Member Member – 75,000Total Fees paid to Independent Directors 345,000
Remuneration of Key Executives: The remuneration bands of Key Executives who are not Directors of the Company are similarly disclosed in bands of S$250,000. The total aggregate remuneration paid to the top five key management personnel who are not Directors or the CEO for the financial year ended 31 December 2017 was S$2,356,603.
Remuneration Band Number of ExecutivesS$250,000 – S$500,000 4S$500,000 – S$750,000 1S$750,000 – S$1,000,000 1S$1,000,000 – S$1,250,000 1
During the year, there was no termination, retirement or post-employment benefit granted to any Director or Key Executive.
Remuneration of employees who are immediate family members of a Director or the CEO: There was no employee of the Company or its subsidiaries who was an immediate family member of a Director or the CEO and whose remuneration exceeded S$50,000 during the financial year ended 31 December 2017.
Other Remuneration Matters: The Company has no share option scheme. It will consider the establishment of other forms of longer term incentive schemes, as and when appropriate.
ACCOUNTABILITY AND AUDIT
ACCOUNTABILITY [PRINCIPLE 10]The Board is accountable to the shareholders. It is required to furnish timely information and ensure full disclosure of material information to the shareholders in compliance with legislative and regulatory requirements, including statutory requirements and the requirements under the SGX-ST Listing Manual.
RISK MANAGEMENT AND INTERNAL CONTROLS [PRINCIPLE 11]The Board has overall responsibility for the governance of risk and the oversight of material risks in the Group’s business. For the financial year ended 31 December 2017, the AC & RMC assisted the Board to maintain oversight of the Group’s risk in financial reporting, and to review the adequacy and effectiveness of the Group’s internal control and compliance systems. They also supported the operation and review of the risk management system, including the framework and processes for the identification and management of material risks.
The AC & RMC reports to the Board on the material impact from the findings and its recommendations on risk mitigation measures. The report covers operational, financial and compliance controls, risk management policies and systems. The AC & RMC meets with internal and external auditors four times a year and at least one of these meetings is conducted without the presence of the Management. The AC & RMC also meets with the Enterprise Risk Management (“ERM”) team four times a year.
During the financial year 2017, the AC & RMC reviewed and recommended the Group’s quarterly and full-year financial statements to the Board for approval and subsequent publication. It also reviewed key control findings from the Internal Audit Department (“IAD”) and ERM team, as well as remedial actions recommended by the Management to resolve the discrepancies. The AC & RMC was kept abreast of changes to accounting standards and their impact on the financial statement as reported by the independent external auditor.

53 INDOFOOD AGRI RESOURCES LTD
ANNUAL REPORT 2017
CORPORATE GOvERNANCE
The ERM team has worked closely with IAD to manage high-risk areas, ensure accuracy of the risk assessment reports, and enforce risk mitigation controls and strategies. IAD has performed independent reviews of the risks and controls identified by the ERM team to ensure adequate monitoring and proper resolution. The AC & RMC is satisfied that effective internal controls have been put in place with robust internal audit and ERM frameworks to identify, monitor, manage and report material risks affecting the Group.
The Board also reviewed the adequacy and effectiveness of the Company’s risk management and internal control systems with the AC & RMC and the ERM team in the year. The Board confirmed, with the AC & RMC’s concurrence, that the Group’s internal controls were adequate and effective in addressing the financial, operational, compliance and information technology control risks, and risk management system.
In making its assessments, the Board has received assurance from the CEO and the CFO that the financial records were properly maintained to their best knowledge and ability, and the financial statements provided a true and fair view of the Group’s operations and finances. The Board was also assured that the Company had implemented effective risk management and internal control systems to safeguard stakeholders’ interest.
Noting that, as no internal control system or ERM framework can provide absolute assurance against material, judgement or human errors, frauds and other irregularities, the Board deems that the Group’s internal control system and ERM framework have provided reasonable assurance against material financial misstatement or loss in safeguarding the Company’s assets and shareholders’ value.
AUDIT AND RISK MANAGEMENT COMMITTEE [PRINCIPLE 12]Composition of the AC & RMC: The AC & RMC comprises three Independent Directors, including the Chairman, Mr Goh Kian Chee, and members, Messrs Lim Hock San and Hendra Susanto. The AC & RMC possesses expertise in financial management and is fully qualified to discharge its powers and duties.
Powers and Duties of the AC & RMCThe AC & RMC is authorised by the Board to review and investigate any matters according to its terms of reference. It has full access to external and internal auditors, and may invite any Director, Management or employee in the Group to attend its meetings.
The key responsibility of the AC & RMC is to assist the Board in risk management, controls and governance processes as well as to provide an independent review of the effectiveness of the risk management framework and systems, and the adequacy of control measures in addressing the financial, operational, compliance and information technology control risks.
The list of duties set out in the AC & RMC’s terms of reference include:• review the audit plan, internal accounting controls, audit report, Management letter and Management’s response to
the external auditor;• review the quarterly, half-yearly and annual financial statements, especially on changes to accounting policies and
practices, major risk areas, and significant adjustments resulting from the audit, before submitting the reports to the Board for approval;
• review the on-going concern statement, compliance with applicable accounting standards, and requirements by the SGX, statutes and laws;
• review the effectiveness and adequacy of the Group’s internal controls, including financial, operational, and compliance controls and procedures, risk management policies and systems, and co-ordination between the Management and the external auditor;
• review with the external auditor any suspected frauds, irregularities as well as infringements of Singapore laws, regulations and the Listing Manual that would likely have a material impact on the Group’s operating results or financial position, and the mitigating measures recommended by the Management;
• review, without the presence of the Management, the level of assistance the Management has provided to the external auditor, and the adequacy of the resolution to issues arising from the audits or highlighted by the external auditor;
• review Interested Person Transactions;• review the whistle-blowing system and its effectiveness as a confidential channel for employees to report potential
improprieties in financial management and other areas;• review ERM reports;• consider all matters related to the appointment of the external auditor, including the audit fee;• undertake additional reviews and projects requested by the Board, and to report its findings and recommendations
to the Board in a timely manner; and• undertake functions and duties as required by the Singapore laws and the Listing Manual.

54 INDOFOOD AGRI RESOURCES LTD
ANNUAL REPORT 2017
CORPORATE GOvERNANCE
Audit Activities Performed in 2017The AC & RMC conducted eight meetings during the year and carried out its duties according to the terms of reference. The Company Secretary maintained records of all the AC & RMC meetings including minutes of discussions and decisions on key matters. The AC & RMC also met with the internal and external auditors separately and without the presence of the Management.
The financial statements of the Group and the Company are reviewed and endorsed by the AC & RMC before they are submitted to the Board for approval, and the financial results subsequently disclosed to the public. The AC & RMC also reviews and monitors the Group’s and the Company’s financial conditions, internal and external audits, and the effectiveness of the Group’s and the Company’s systems of accounting and internal controls.
In 2017, the following key audit matters were discussed between the Management and the external auditors, and subsequently reviewed by the AC & RMC. The AC & RMC is satisfied that the list of key audit matters has been appropriately addressed and disclosed in the financial statements.
Key Audit Matters Key Considerations and Decisions made by the AC & RMCAssessment of goodwill impairment
The AC & RMC considered and evaluated the methodology applied by the independent valuer engaged by the Management to determine the recoverable value for the assessment of goodwill impairment. The AC & RMC reviewed the appropriateness and reasonableness of the underlying assumptions applied in determining the recoverable value of the goodwill impairment as well as the audit findings report presented by the external auditor during the year-end meeting. The AC & RMC concurred with the Management’s assessment on goodwill impairment for the financial year ended 31 December 2017.
Recoverability of deferred tax assets arising from tax losses carried forward
The AC & RMC considered and reviewed the methodology and key assumptions used by the Management to determine the amount of future taxable profits for the next five years for deferred tax assets recognition. The AC & RMC reviewed the financial projections to assess the appropriateness of the methodology and reasonableness of the assumptions made as well as the audit findings report presented by the external auditor during the year-end meeting. The AC & RMC concurred with the Management on their assessment of the recoverability of deferred tax assets arising from tax losses carried forward for the financial year ended 31 December 2017.
The external auditors have included the above significant matters as key audit matters in their audit report for the financial year ended 31 December 2017 together with a detailed description of the audit procedures adopted from page 64 of this Annual Report.
The Board is of the view that all the members of the AC & RMC are appropriately qualified to discharge their responsibilities.
In 2017, the AC & RMC conducted an annual assessment of its effectiveness in discharging its roles and responsibilities. Based on the self-assessment, the AC & RMC believes it has adequately fulfilled its duties as set out in the terms of reference.
External Audit: The appointment of the external auditor is recommended by the Board and approved by the shareholders at the AGM. The AC & RMC assesses the performance of the external auditor annually based on ACRA’s Audit Quality Indicators, feedback from the Management, and the objectivity and conduct of the external auditor during the audit, and recommends the re-appointment of the external auditor to the Board. An external auditor can only be appointed for a maximum of five consecutive annual audits according to SGX-ST regulations.
The AC & RMC has reviewed the audit services provided by the external auditor in 2017 and is satisfied with the quality and objectivity of the audit. In accordance with Rule 1207(6)(a) of the Listing Manual, the audit and non-audit fees paid to the external auditor for its services in the financial year ended 31 December 2017 are disclosed on page 99 of this Annual Report.

55 INDOFOOD AGRI RESOURCES LTD
ANNUAL REPORT 2017
CORPORATE GOvERNANCE
The external auditors of the Group’s subsidiaries, associated companies and a joint venture are also disclosed on pages 117, 119 and 122 of this Annual Report respectively. The Board and the AC & RMC are satisfied that these external auditors are qualified and have adequate resources to meet their audit obligations, and do not compromise the standard and effectiveness of the audit. The Board and the AC & RMC are of the opinion that the Company is in compliance with Rules 712 and 716 of the SGX-ST Listing Manual.
Ernst & Young LLP is the current external auditor for the Company. The AC & RMC is satisfied with the performance of Ernst & Young LLP and has recommended to the Board for it to be re-appointed as the external auditor of the Company for another term, subject to shareholders’ approval at the next AGM.
INTERNAL AUDIT [PRINCIPLE 13]IAD is headed by Mr Rogers H. Wirawan who reports directly to the Chairman of the AC & RMC on all internal audit matters. IAD plans the internal audit schedules in consultation with the Management before submitting the plan to the AC & RMC for approval. The internal audit is conducted in accordance with the guidelines and standards set out in the Professional Practice of Internal Auditing by the Institute of Internal Auditors. As at end-December 2017, there were 89 staff in the IAD.
IAD is an independent unit separate from the business and corporate activities. Its duties and responsibilities, with regards to risk management and internal controls, are as follows:• review the risk profile of the Company;• identify and recommend actions to eliminate or mitigate risks so as to improve the risk profile;• recommend risk parameters for the Company’s operations;• review risk mitigation efforts and related costs;• monitor the mitigation efforts and risk parameters; and• establish and maintain a risk reporting and monitoring framework.
IAD operates within the framework set out in the Internal Audit Charter and Code of Ethics that is approved by the Management and the AC & RMC. It implements a systematic and disciplined approach to evaluate and improve the effectiveness of risk management, controls and governance processes. As part of the audit plan, IAD performs independent reviews of the risks and controls identified by the ERM team to provide additional assurance of the robustness of the ERM framework to the Management.
The AC & RMC is satisfied that the key risks and controls are adequately monitored and managed in 2017. During the year, IAD adopted a risk-based auditing approach that focused on material internal controls. High-risk areas of strategic business units were identified and audited, and key findings and recommendations were presented and discussed at the quarterly meetings with the AC & RMC. A set of key actions to rectify the gaps was developed by IAD together with the Management, and its progress monitored and reported to the AC & RMC at quarterly meetings. The AC & RMC has also reviewed the adequacy of the internal audit function, including IAD’s organisational structure, work scope and audit plans. Overall, the AC & RMC is satisfied that IAD has adequate resources and a good standing within the Group to perform its role effectively.
ENTERPRISE RISK MANAGEMENT (“ERM”)As an agribusiness constantly exposed to unpredictable weather conditions, fluctuating commodity prices, and evolving consumer needs, amongst other challenging conditions, the Group is said to operate in a VUCA (volatile, uncertain, complex and ambiguous) environment. Recent global economic developments have intensified the challenges with trade uncertainties, currency volatility, security threats, conscientious consumerism and aggressive competition.
To mitigate these risks, the Group has established an integrated ERM framework to proactively manage uncertainties across operations. Supported by sound corporate governance and effective operational execution, ERM fully coordinates the ‘Lines of Defence’ across all operating and functional units to enable the Group to maintain vigilance and oversight of its operations for timely and accurate identification, assessment, mitigation, reporting and monitoring of risks that could have an adverse impact on the business drivers and results.

56 INDOFOOD AGRI RESOURCES LTD
ANNUAL REPORT 2017
CORPORATE GOvERNANCE
IMPROvE SUSTAINABLE BUSINESS
MANAGE RISK(S) AND MINIMISE IMPACT
AC
HIE
vE B
USI
NES
S O
BjE
CTIv
E
BUSINESS DRIvERS/SOURCE OF RISKS RISKS/ISSUES
COORDINATED APPROACH TO RISK
ACTIvITIES COvERAGE
ASSESS
MITIGATE
REPORT
MONITOR
OPERATIONS UNITS
– Estates
– Mills
– Refinery
– Engineering
– R&D Breeding
– Transportation
SUPPORT FUNCTIONS
– Procurement
– Accounting
– Treasury
– Budget
– Legal
– HR
MONITORING OvERSIGHT
MONITORING AND CONTROL FUNCTIONS
– ERM
– Internal Audit
– Inspection Services
– Systems & Procedures
OvERSIGHT
– BOD
– Executive Management
– Audit Committee
– Steering Committees
STRATEGIES
OPERATIONS
FINANCE
COMPLIANCE
BUSINESS STRATEGIC INITIATIvES
– Short-term Programme
– Long-term Programme
INDUSTRY ISSUES
– External/Industry Trends
– Others
CO
MP
LIA
NC
EP
ERFO
RM
AN
CE
Coordination Across The “Lines of Defense”
BO
AR
D/E
XECU
TIvE
MA
NA
GEM
ENT
In preparing the Group for the challenges of an increasingly competitive business environment, ERM also contributes to the sustainable operation of the Group. Since 2013, the Group has put in place a Business Continuity Management (“BCM”) framework to assure all stakeholders of the availability of the Group’s products and services during periods of emergency. BCM focuses on minimising the impact of emergencies on the Group’s operations and establishing a high level of resilience within the organisation to continue its operations during times of distress.
Under BCM, several potential emergency scenarios, with control measures to mitigate and minimise foreseeable operational impacts, have been developed. Take for example the ‘plantation fire’ scenario. Control measures included daily monitoring of hotspots based on reliable satellite data and observations of fire incidents by fire patrol teams, regular fire prevention trainings and exercises in fire-prone estates, regular upkeep of fire-fighting equipment, construction of fire-monitoring towers, mapping of water sources, and regular communication on the Group’s Zero Burn policy and fire safety with employees, contract workers and the local community. These efforts have led to reduction of fire incidents over the years.
In 2017, the Group has continued its ERM strategy to enhance the commitment of the Board of Directors, Heads of Department and Operating Units in the implementation of the ERM policy, establish a clear risk governance structure to support accountability of each unit, integrate the ERM policy into the management processes, align ERM programmes to support the business strategies, communicate ERM policy and processes, and foster a risk awareness culture within the Group.
ERM is supported by an ERM team who works closely with managers and risk owners to conduct quarterly risk assessments and review the effectiveness of control measures. The ERM team monitors the progress of the ERM Action Plan to mitigate risks, and reports significant risks and exposures to the Board as well as the AC & RMC.

57 INDOFOOD AGRI RESOURCES LTD
ANNUAL REPORT 2017
CORPORATE GOvERNANCE
In 2017, the following risks were identified, monitored and managed:
Strategic Risks• Planning
Inadequate planning and forecasting may limit the Group’s ability to anticipate and respond to internal and external changes, make sound and informed decisions, and take advantage of growth opportunities.
• Sustainable Palm Oil Uncertainty in industry trends and requirements may threaten the Group’s ability to ensure sustainable business operations, leading to adverse perceptions among stakeholders and the loss of competitive advantage for the Group.
• Land Expansion Land is a key resource in agribusiness, and any limitation on the availability or use of land can threaten the Group’s ability to grow and achieve its strategic objectives.
Operational Risks• Pests and Plant Diseases
Infestations by pests and plant diseases may lower crop productivity and potential death of trees.
• Occupational Health and Safety Failure to implement a proper system of occupational health and safety to adequately protect employees and workers from workplace accidents and health hazards may expose the Group to higher fatality and accident rates, financial loss in terms of compensations and liabilities, and poor business reputation.
• Resource Availability Inadequate resources, such as raw materials, fertilisers, equipment, tools and component parts, may threaten the Group’s ability to produce quality products on time and at competitive prices.
• Social ConflictsConflicts with local communities may affect the Group’s operations, resulting in limited or controlled access to critical areas, higher operating costs, lower productivity and unsafe work environments.
• Natural Disasters Disasters such as flooding, drought, earthquake and fire, may result in property damage, stoppage or delay in operations, higher operating costs, lower productivity and customer dissatisfaction.
Compliance Risks• Land Ownership
Failure to obtain land permits and licenses and to promptly resolve land ownership issues and third-party claims may result in loss of land rights.
• Tax Compliance Non-compliance with local or national tax regulations, failure to identify and prevent legal risks, and inadequate communication with tax authorities may result in severe financial penalties.
• Environmental ComplianceNon-compliance to environmental laws and regulations may expose the Group to regulatory sanctions, public protests, security problems, fines and penalties.
Financial Risks• Credit Defaults
Defaults of loans by plasma smallholders may result in financial loss.
• Capital Liquidity Insufficient access to financial capital may affect the Group’s capacity to achieve growth, execute strategies and generate returns.
• Economic UncertaintyFluctuations in commodity prices and rupiah exchange rates may adversely affect the Group’s financial condition.

58 INDOFOOD AGRI RESOURCES LTD
ANNUAL REPORT 2017
CORPORATE GOvERNANCE
WHISTLE-BLOWING POLICY
The Group has implemented whistle-blowing policy and procedures. The policy provides clearly defined channels and processes for employees to report any misconducts, which include suspected frauds, corruptions and unethical practices. All reports are kept strictly confidential to protect the identities of the reporting employees. The reports are reviewed and acted upon by either the Exco or the AC & RMC.
The IAD will conduct an independent investigation of each case and recommend the appropriate resolutions. A quarterly report of these investigations is submitted to the AC & RMC.
The AC & RMC has reviewed and approved the whistle-blowing policy and procedures.
SHAREHOLDER RIGHTS AND RESPONSIBILITIES
SHAREHOLDER RIGHTS AND COMMUNICATION WITH SHAREHOLDERS [PRINCIPLE 14 AND 15]The Company is committed to regular and timely disclosure of information pertinent to the shareholders. Announcements are made within the prescribed periods through the SGXNET, and where necessary, through mainstream news media by press releases. All announcements are posted on the Company’s Investor Relations (“IR”) website and disseminated by email to subscribers as news alerts. The IR website is a key source of investor-related information, which includes Company’s presentation slides, annual reports, shares and dividend information and factsheets, for the investment community.
The CEO, CFO and other Management members conduct quarterly and full-year results briefings, as well as organise conferences and conference calls to communicate important corporate developments and announcements, such as merger and acquisition of companies, to analysts. Apart from these channels, the Management also engages in frequent dialogues, road shows and investment forums with the investing community both individually and as a group to facilitate their understanding of the Group’s business model and growth strategies.
In 2017, the Group conducted 140 meetings and conference calls to engage and share with shareholders and analysts the Group’s business strategies, operational and financial results and business outlook. These meetings are supported by selected members of the Company’s Management and the Board. As part of the engagement efforts with the investing community, key shareholders and analysts were taken on site visits to the Group’s refinery in Tanjung Priok.
DIvIDEND POLICY
The Company started paying dividends since 2012. The dividend payments take into consideration the Group’s financial performance, liquidity, capital commitment, business prospect, economic outlook and regulatory factors. The Board aims to maintain a balance between meeting shareholders’ expectations and prudent capital management with a sustainable dividend payment.
CODE OF CONDUCT AND COMPANY CULTURE
The Group adopts the Code of Conduct and core values of its parent company, PT ISM. These include two policies on the Company Business Ethics and the Work Ethics of Employees and the core values of Discipline, Integrity, Respect, Unity, Leadership and Innovation. Having the same core values and company culture as PT ISM allows the Group to engage stakeholders and conduct its businesses in a consistent manner.
The Code of Conduct and core values are regularly communicated and reinforced at staff engagement platforms. They are also easily accessible by all employees from the Company’s website. Any violation of the Code of Conduct is deemed a breach of the employment contract and may lead to sanction or disciplinary action.

59 INDOFOOD AGRI RESOURCES LTD
ANNUAL REPORT 2017
CORPORATE GOvERNANCE
CONDUCT OF SHAREHOLDER MEETINGS [PRINCIPLE 16]The Company encourages shareholders’ active participation at the AGM, which are held at accessible venues. Notice of the AGM and related information are provided to the shareholders within the prescribed timeline under the listing rules. The Company provides separate resolutions at general meetings for each key matter, including the election or re-election of Directors as well as explanatory notes for each item in the AGM agenda where necessary.
All shareholders are entitled to attend and vote at the AGM in person or by proxy. Each shareholder may appoint up to two proxies to vote at the AGM by submitting the proxy forms to the Company in advance. Intermediaries, such as banks and capital markets services licence holders that are providing custodial services, may appoint more than two proxies. This allows indirect investors, including CPF investors, to attend the AGM as proxies. Voting in absentia by mail or other electronic means are not supported presently due to authentication and other integrity-related issues.
At the AGM held in April 2017, the CEO updated the shareholders on the Group’s performance and strategies. The Board and the Management were present to address queries and feedback about the Group. They also used the opportunity to gather the shareholders’ feedback on specific issues. The Company’s external auditor also attended the AGM to address queries related to the audit.
All resolutions were passed by poll voting. An electronic poll voting system was used to register the number of votes by shareholders who were present at the AGM. An external party was engaged as scrutineer to provide independent oversight of the poll voting process. The result of each poll, including the number and percentage of votes cast in favour or against the resolution, was immediately computed and presented to the shareholders. The poll voting and proxy voting results were filed with SGX-ST on the same day as the AGM.
DEALING IN THE COMPANY’S SECURITIES
In compliance with Rule 1207(19) of the SGX-ST Listing Manual, the Group has adopted an Internal Code with regards to dealings in the securities of the Company by its officers. Amongst other restrictions, the Company’s officers are prohibited from dealing in the Company’s securities on short-term considerations when they have possession of any unpublished, price-sensitive information about the Company’s securities during the two-week period before the announcement of the Group’s quarterly and half-yearly financial results or one month before the announcement of the Group’s full-year financial results. The Directors and employees are expected to observe the insider trading laws at all times, even when dealing in securities outside the prohibited trading periods, and to refrain from short-term dealings in the Company’s securities.

Consolidated Statement of Changes in Equity 70Consolidated Cash Flow Statement 72 Notes to the Financial Statements 74
FINANCIALSDirectors’ Statement 61Independent Auditor’s Report 63Consolidated Statement of Comprehensive Income 67Balance Sheets 68
INDOFOOD AGRI RESOURCES LTD. & ITS SUBSIDIARIES Financial Statements

61 INDOFOOD AGRI RESOURCES LTD
ANNUAL REPORT 2017
The directors are pleased to present their statement to the members together with the audited consolidated financial statements of Indofood Agri Resources Ltd. (the “Company”) and its subsidiaries (collectively the “Group”) and the balance sheet of the Company for the financial year ended 31 December 2017.
OPINION OF THE DIRECTORS
In the opinion of the directors,
(i) the consolidated financial statements of the Group and the balance sheet of the Company are drawn up so as to give a true and fair view of the financial position of the Group and of the Company as at 31 December 2017 and of the financial performance of the business, changes in equity and cash flows of the Group for the financial year ended on that date; and
(ii) at the date of this statement, there are reasonable grounds to believe that the Company will be able to pay its debts as and when they fall due.
DIRECTORS
The directors of the Company in office at the date of this statement are:
Lee Kwong Foo, Edward ChairmanLim Hock San Vice ChairmanMark Julian Wakeford Chief Executive OfficerMoleonoto TjangSuaimi SuriadyTjhie Tje FieAxton SalimGoh Kian CheeHendra Susanto
In accordance with Clause 117 of the Company’s Constitution, Tjhie Tje Fie, Hendra Susanto, and Mark Julian Wakeford retire and, being eligible, offer themselves for re-election.
ARRANGEMENTS TO ENABLE DIRECTORS TO ACqUIRE SHARES AND DEBENTURES
Neither at the end of nor at any time during the financial year was the Company a party to any arrangement whose objects are, or one of whose objects is, to enable the directors of the Company to acquire benefits by means of the acquisition of shares or debentures of the Company or any other body corporate.
DIRECTORS’ INTERESTS IN SHARES AND DEBENTURES
The following director, who held office at the end of the financial year had, according to the register of directors’ shareholdings, required to be kept under section 164 of the Singapore Companies Act, Cap. 50, an interest in shares and share options of the Company and related corporations (other than wholly-owned subsidiaries) as stated below:
Direct interest Deemed interest
Name of director At the beginning
of the yearAt the end
of the yearAt the beginning
of the yearAt the end
of the year
Ordinary shares of the Company
Mark Julian Wakeford 300,000 300,000 200,000 200,000
There was no change in any of the above-mentioned interests in the Company between the end of the financial year and 21 January 2018.
DIRECTORS’ STATEMENT

62 INDOFOOD AGRI RESOURCES LTD
ANNUAL REPORT 2017
DIRECTORS’ INTERESTS IN SHARES AND DEBENTURES (CONT’D)
Except as disclosed in this report, no director who held office at the end of the financial year had interests in shares, share options, warrants or debentures of the Company, or of related corporations, either at the beginning of the financial year, or date of appointment if later, or at the end of the financial year.
OPTIONS
No option to take up unissued shares of the Company or its subsidiaries was granted during the year.
There were no shares issued during the year by virtue of the exercise of options to take up unissued shares of the Company or its subsidiaries whether granted before or during the year.
There were no unissued shares of the Company or its subsidiaries under option as at the end of the year.
AUDIT COMMITTEE
The Audit Committee performed the functions in accordance with section 201B(5) of the Singapore Companies Act, Cap. 50. The functions performed by the Audit Committee are described in the Report on Corporate Governance.
AUDITOR
Ernst & Young LLP have expressed their willingness to accept reappointment as auditor.
On behalf of the Board of Directors,
Mark Julian WakefordDirector
Moleonoto TjangDirector
Singapore16 March 2018
DIRECTORS’ STATEMENT

63 INDOFOOD AGRI RESOURCES LTD
ANNUAL REPORT 2017
REPORT ON THE AUDIT OF THE FINANCIAL STATEMENTS
Opinion
We have audited the financial statements of Indofood Agri Resources Ltd. (the “Company”) and its subsidiaries (collectively, the “Group”), which comprise the balance sheets of the Group and the Company as at 31 December 2017, the consolidated statement of changes in equity, the consolidated statement of comprehensive income, and the consolidated cash flow statement of the Group for the year then ended, and notes to the financial statements, including a summary of significant accounting policies.
In our opinion, the accompanying consolidated financial statements of the Group, the balance sheet and the statement of changes in equity of the Company are properly drawn up in accordance with the provisions of the Companies Act, Chapter 50 (the “Act”) and Financial Reporting Standards in Singapore (“FRSs”) so as to give a true and fair view of the consolidated financial position of the Group and the financial position of the Company as at 31 December 2017 and of the consolidated financial performance, consolidated changes in equity and consolidated cash flows of the Group and changes in equity of the Company for the year ended on that date.
Basis for opinion
We conducted our audit in accordance with Singapore Standards on Auditing (“SSAs”). Our responsibilities under those standards are further described in the Auditor’s Responsibilities for the Audit of the Financial Statements section of our report. We are independent of the Group in accordance with the Accounting and Corporate Regulatory Authority (“ACRA”) Code of Professional Conduct and Ethics for Public Accountants and Accounting Entities (“ACRA Code”) together with the ethical requirements that are relevant to our audit of the financial statements in Singapore, and we have fulfilled our other ethical responsibilities in accordance with these requirements and the ACRA Code. We believe that the audit evidence we have obtained is sufficient and appropriate to provide a basis for our opinion.
Key audit matters
Key audit matters are those matters that, in our professional judgement, were of most significance in our audit of the financial statements of the current period. These matters were addressed in the context of our audit of the financial statements as a whole, and in forming our opinion thereon, and we do not provide a separate opinion on these matters. For each matter below, our description of how our audit addressed the matter is provided in that context.
We have fulfilled our responsibilities described in the Auditor’s responsibilities for the audit of the financial statements section of our report, including in relation to these matters. Accordingly, our audit included the performance of procedures designed to respond to our assessment of the risks of material misstatement of the financial statements. The results of our audit procedures, including the procedures performed to address the matters below, provide the basis for our audit opinion on the accompanying financial statements.
INDEPENDENT AUDITOR’S REPORTto the members of Indofood Agri Resources Ltd.

64 INDOFOOD AGRI RESOURCES LTD
ANNUAL REPORT 2017
INDEPENDENT AUDITOR’S REPORTto the members of Indofood Agri Resources Ltd.
Key audit matters (cont’d)
We have identified the following matters as key audit matters:
(i) Impairment assessment of goodwill
FRS 36 – Impairment of Assets requires goodwill to be tested for impairment annually or more frequently if events or changes in circumstances indicate that it might be impaired. This annual goodwill impairment assessment is significant to our audit because the goodwill balance of Rp3,245.8 billion, which arose largely from the acquisition of PT Perusahaan Perkebunan London Sumatra Indonesia (“Lonsum”), is material to the financial statements and the recoverable value of the goodwill and the underlying assets associated with the acquired entities are determined by a value-in-use calculation using income approach which are complex, highly judgemental and subjective. Management engaged an independent valuer to determine the recoverable value of the goodwill only for Lonsum’s integrated plantation estates. The plantation estates under Lonsum are identified as a single cash generating unit (“CGU”) for impairment testing. The recoverable amount of other goodwills were determined internally by management.
Under the income approach, the expected future cash flows are discounted to the present value by using a discount rate. The estimation of future cash flows requires the use of a number of other significant operational and predictive assumptions, such as fresh fruit bunch yield rate, extraction rate, projected selling price, inflation rate, exchange rate and also factors in the terminal value after the implicit period of 5 years.
We reviewed the independent valuation reports and assessed the expertise, objectivity and competence of the independent valuer. We reviewed the discounted cash flow model to assess the appropriateness of the methodology employed by the valuer and management and the reasonableness of the key assumptions made. We compared the operational assumptions against historical data and trend to assess their reasonableness. We engaged the assistance of our internal valuation specialist to assess the reasonableness of the key predictive assumptions (among others, discount rate, inflation rate, exchange rate, and projected selling price).
We also reviewed the adequacy of the note disclosures concerning those key assumptions to which the outcome of the impairment test is most sensitive. The Group’s disclosures about goodwill are in Note 15 to the financial statements, which explain that changes in the key assumptions used could give rise to an impairment of the goodwill balance in the future.
(ii) Recoverability of deferred tax assets arising from tax losses carried forward
FRS 12 – Income Taxes allows the recognition of deferred tax asset on operating losses if it is probable that there will be sufficient taxable profits in future against which the tax losses can be utilised. The recognition of deferred tax asset is significant to our audit because the Group has recognised deferred tax asset of Rp1,347.0 billion, out of which Rp857.6 billion relating to unutilised tax losses carried forward, which is material to the financial statements. The recoverability of these deferred tax assets are subject to the ability of the Group’s subsidiaries to generate sufficient taxable income to utilise the brought forward tax losses before they expire.
The assessment of recoverability of deferred tax asset was undertaken internally by management. We reviewed the key assumptions such as projected selling price, exchange rate and inflation rate used by management in the financial projections used to determine the amount of future taxable profits for the next five years. We reviewed the financial projections to assess the appropriateness of the methodology and reasonableness of the assumptions made. We compared the operational assumptions such as production yield, production cost and extraction rate against historical data and trend to assess their reasonableness. We also engaged the assistance of our internal valuation expert to assess the reasonableness of certain key predictive assumptions.
The Group’s disclosures on deferred tax assets are in Note 17 to the financial statements.

65 INDOFOOD AGRI RESOURCES LTD
ANNUAL REPORT 2017
Other information
Management is responsible for other information. The other information comprises the information included in the annual report, but does not include the financial statements and our auditor’s report thereon.
Our opinion on the financial statements does not cover the other information and we do not express any form of assurance conclusion thereon.
In connection with our audit of the financial statements, our responsibility is to read the other information and, in doing so, consider whether the other information is materially inconsistent with the financial statements or our knowledge obtained in the audit or otherwise appears to be materially misstated. If, based on the work we have performed, we conclude that there is a material misstatement of this other information, we are required to report that fact. We have nothing to report in this regard.
Responsibilities of management and directors for the financial statements
Management is responsible for the preparation of financial statements that give a true and fair view in accordance with the provisions of the Act and FRSs, and for devising and maintaining a system of internal accounting controls sufficient to provide a reasonable assurance that assets are safeguarded against loss from unauthorised use or disposition; and transactions are properly authorised and that they are recorded as necessary to permit the preparation of true and fair financial statements and to maintain accountability of assets.
In preparing the financial statements, management is responsible for assessing the Group’s ability to continue as a going concern, disclosing, as applicable, matters related to going concern and using the going concern basis of accounting unless management either intends to liquidate the Group or to cease operations, or has no realistic alternative but to do so.
The directors’ responsibilities include overseeing the Group’s financial reporting process.
Auditor’s responsibilities for the audit of the financial statements
Our objectives are to obtain reasonable assurance about whether the financial statements as a whole are free from material misstatement, whether due to fraud or error, and to issue an auditor’s report that includes our opinion. Reasonable assurance is a high level of assurance, but is not a guarantee that an audit conducted in accordance with SSAs will always detect a material misstatement when it exists. Misstatements can arise from fraud or error and are considered material if, individually or in the aggregate, they could reasonably be expected to influence the economic decisions of users taken on the basis of these financial statements.
As part of an audit in accordance with SSAs, we exercise professional judgement and maintain professional scepticism throughout the audit. We also:
• Identify and assess the risks of material misstatement of the financial statements, whether due to fraud or error, design and perform audit procedures responsive to those risks, and obtain audit evidence that is sufficient and appropriate to provide a basis for our opinion. The risk of not detecting a material misstatement resulting from fraud is higher than for one resulting from error, as fraud may involve collusion, forgery, intentional omissions, misrepresentations, or the override of internal control.
• Obtain an understanding of internal control relevant to the audit in order to design audit procedures that are appropriate in the circumstances, but not for the purpose of expressing an opinion on the effectiveness of the Group’s internal control.
• Evaluate the appropriateness of accounting policies used and the reasonableness of accounting estimates and related disclosures made by management.
• Conclude on the appropriateness of management’s use of the going concern basis of accounting and, based on the audit evidence obtained, whether a material uncertainty exists related to events or conditions that may cast significant doubt on the Group’s ability to continue as a going concern. If we conclude that a material uncertainty exists, we are required to draw attention in our auditor’s report to the related disclosures in the financial statements or, if such disclosures are inadequate, to modify our opinion. Our conclusions are based on the audit evidence obtained up to the date of our auditor’s report. However, future events or conditions may cause the Group to cease to continue as a going concern.
INDEPENDENT AUDITOR’S REPORTto the members of Indofood Agri Resources Ltd.

66 INDOFOOD AGRI RESOURCES LTD
ANNUAL REPORT 2017
Auditor’s responsibilities for the audit of the financial statements (cont’d)
• Evaluate the overall presentation, structure and content of the financial statements, including the disclosures, and whether the financial statements represent the underlying transactions and events in a manner that achieves fair presentation.
• Obtain sufficient appropriate audit evidence regarding the financial information of the entities or business activities within the Group to express an opinion on the consolidated financial statements. We are responsible for the direction, supervision and performance of the Group audit. We remain solely responsible for our audit opinion.
We communicate with the directors regarding, among other matters, the planned scope and timing of the audit and significant audit findings, including any significant deficiencies in internal control that we identify during our audit.
We also provide the directors with a statement that we have complied with relevant ethical requirements regarding independence, and to communicate with them all relationships and other matters that may reasonably be thought to bear on our independence, and where applicable, related safeguards.
From the matters communicated with the directors, we determine those matters that were of most significance in the audit of the financial statements of the current period and are therefore the key audit matters. We describe these matters in our auditor’s report unless law or regulation precludes public disclosure about the matter or when, in extremely rare circumstances, we determine that a matter should not be communicated in our report because the adverse consequences of doing so would reasonably be expected to outweigh the public interest benefits of such communication.
Report on other legal and regulatory requirements
In our opinion, the accounting and other records required by the Act to be kept by the Company and by those subsidiary corporations incorporated in Singapore of which we are the auditors have been properly kept in accordance with the provisions of the Act.
The engagement partner on the audit resulting in this independent auditor’s report is Vincent Toong Weng Sum.
Ernst & Young LLPPublic Accountants andChartered AccountantsSingapore16 March 2018
INDEPENDENT AUDITOR’S REPORTto the members of Indofood Agri Resources Ltd.

67 INDOFOOD AGRI RESOURCES LTD
ANNUAL REPORT 2017
Note 2017 2016Rp million Rp million
Revenue 4 15,826,648 14,530,938
Cost of sales 5 (12,631,642) (11,042,202)
Gross profit 3,195,006 3,488,736
Selling and distribution expenses (608,223) (551,228)General and administrative expenses (980,554) (944,607)Foreign exchange (loss)/gain (14,450) 94,188Other operating income 6 82,323 213,826Other operating expenses 7 (151,989) (156,371)Share of results of associate companies (17,915) (67,400)Share of results of a joint venture 138,654 (33,109)Gain arising from changes in fair value of biological assets 13 34,839 219,000
Profit from operations 8 1,677,691 2,263,035
Finance income 9 107,505 92,124Finance expense 10 (647,043) (665,618)
Profit before tax 1,138,153 1,689,541Income tax expense 11 (485,268) (897,252)
Net profit for the year 652,885 792,289
Profit for the year attributable to:
Owners of the Company 447,314 506,540Non-controlling interests 205,571 285,749
652,885 792,289
Other comprehensive income:
Items that may be reclassified subsequently to profit or lossForeign currency translation (469) 28,890Items that will not be reclassified to profit or lossRe-measurement loss of employee benefits liability 28 (184,821) (1,645)Income tax effect related to re-measurement loss of
employee benefits liability 11 46,206 411Share of other comprehensive (loss)/gain of associate companies
and a joint venture (14,100) 41,220
Other comprehensive income for the year, net of tax (153,184) 68,876
Total comprehensive income for the year 499,701 861,165
Total comprehensive income attributable to:
Owners of the Company 349,356 591,629Non-controlling interests 150,345 269,536
Total comprehensive income for the year 499,701 861,165
Earnings per share (in Rupiah) 12– basic 320 363– diluted 320 363
CONSOLIDATED STATEMENT OF COMPREHENSIvE INCOME For the financial year ended 31 December 2017
The accompanying accounting policies and explanatory notes form an integral part of the financial statements.

68 INDOFOOD AGRI RESOURCES LTD
ANNUAL REPORT 2017
Group CompanyNote 31.12.2017 31.12.2016 31.12.2017 31.12.2016
Rp million Rp million Rp million Rp million
Non-current assets
Biological assets 13 313,305 325,102 – –Property, plant and equipment 14 21,178,399 21,396,796 39,986 43,576Goodwill 15 3,245,837 3,253,637 – –Claims for tax refund 16 126,732 178,704 – –Deferred tax assets 17 1,346,976 1,240,194 – –Investment in subsidiary companies 18 – – 10,533,516 10,533,516Investment in associate companies 19 1,358,774 1,002,247 551,139 551,139Investment in a joint venture 20 874,911 751,850 – –Amount due from a subsidiary 21 – – 730,000 730,000Advances and prepayments 21 385,116 425,917 – –Other non-current receivables 21 1,209,487 1,174,662 10 9
Total non-current assets 30,039,537 29,749,109 11,854,651 11,858,240
Current assets
Inventories 22 2,204,549 2,270,749 – –Trade and other receivables 23 1,200,404 1,122,774 76,172 78,142Advances and prepayments 23 188,330 240,215 228 197Prepaid taxes 273,845 251,107 – –Biological assets 13 536,821 464,722 – –Assets held for sale 14 41,795 – – –Cash and cash equivalents 24 2,929,674 2,404,838 664,267 532,896
Total current assets 7,375,418 6,754,405 740,667 611,235
Total assets 37,414,955 36,503,514 12,595,318 12,469,475
Current liabilities
Trade and other payables and accruals 25 1,631,014 1,499,716 104,739 14,843Advances and other payables 25 194,703 453,672 – –Interest-bearing loans and borrowings 26 4,462,704 2,481,405 – –Income tax payable 91,731 215,515 18 –
Total current liabilities 6,380,152 4,650,308 104,757 14,843
Net current assets 995,266 2,104,097 635,910 596,392
BALANCE SHEETSAs at 31 December 2017
The accompanying accounting policies and explanatory notes form an integral part of the financial statements.

69 INDOFOOD AGRI RESOURCES LTD
ANNUAL REPORT 2017
Group CompanyNote 31.12.2017 31.12.2016 31.12.2017 31.12.2016
Rp million Rp million Rp million Rp million
Non-current liabilities
Interest-bearing loans and borrowings 26 6,067,793 7,545,936 1,013,390 1,002,997Amounts due to related parties
and other payables 27 364,106 569,779 – –Provision and other liabilities 27 34,149 31,086 – –Employee benefits liabilities 28 2,361,278 1,980,219 – –Deferred tax liabilities 17 784,827 848,134 – –
Total non-current liabilities 9,612,153 10,975,154 1,013,390 1,002,997
Total liabilities 15,992,305 15,625,462 1,118,147 1,017,840
Net assets 21,422,650 20,878,052 11,477,171 11,451,635
Equity attributable to owners of the Company
Share capital 29 3,584,279 3,584,279 10,912,411 10,912,411Treasury shares 29 (390,166) (390,166) (390,166) (390,166)Revenue reserves 30 8,327,924 8,050,399 810,774 785,238Other reserves 30 582,329 590,123 144,152 144,152
12,104,366 11,834,635 11,477,171 11,451,635Non-controlling interests 9,318,284 9,043,417 – –
Total equity 21,422,650 20,878,052 11,477,171 11,451,635
BALANCE SHEETSAs at 31 December 2017
The accompanying accounting policies and explanatory notes form an integral part of the financial statements.

70 INDOFOOD AGRI RESOURCES LTD
ANNUAL REPORT 2017
Attributable to owners of the Company
NoteShare
capitalTreasury
sharesOther
reservesRevenuereserves
Totalreserves
Non-controlling
interestsTotal
equityRp million Rp million Rp million Rp million Rp million Rp million Rp million
At 1 january 2017 3,584,279 (390,166) 590,123 8,050,399 8,640,522 9,043,417 20,878,052
Profit for the year – – – 447,314 447,314 205,571 652,885
Other comprehensive income – – (14,794) (83,164) (97,958) (55,226) (153,184)
Total comprehensive income for the year – – (14,794) 364,150 349,356 150,345 499,701
Contributions by and distribution to owners:
Dividend payments by subsidiary companies – – – – – (154,147) (154,147)
Dividend payment to Company’s shareholders 30(c) – – – (86,554) (86,554) – (86,554)
Additional capital contributions from non-controlling shareholder to subsidiary companies – – – – – 260,483 260,483
Acquisition of non-controlling interest – – (12,883) (71) (12,954) 12,954 –
Share of changes in an associate’s other reserves – – 12,117 – 12,117 – 12,117
Share of an associate’s employee share based compensation reserve – – 77 – 77 – 77
Gain on deemed disposal of an associate – – 7,689 – 7,689 5,232 12,921
Total transactions with owners in their capacity as owners – – 7,000 (86,625) (79,625) 124,522 44,897
Balance at 31 December 2017 3,584,279 (390,166) 582,329 8,327,924 8,910,253 9,318,284 21,422,650
Other reserves comprise capital reserves of subsidiary companies, gain on sale of treasury shares and foreign currency translation differences.
CONSOLIDATED STATEMENT OF CHANGES IN EqUITY For the financial year ended 31 December 2017
The accompanying accounting policies and explanatory notes form an integral part of the financial statements.

71 INDOFOOD AGRI RESOURCES LTD
ANNUAL REPORT 2017
Attributable to owners of the Company
NoteShare
capitalTreasury
sharesOther
reservesRevenuereserves
Totalreserves
Non-controlling
interestsTotal
equityRp million Rp million Rp million Rp million Rp million Rp million Rp million
At 1 january 2016 (As previously stated) 3,584,279 (390,166) 452,154 10,743,482 11,195,636 9,855,945 24,245,694
Cumulative effect of adopting the Amendments to FRS16 & FRS41 – – 21,083 (3,129,976) (3,108,893) (956,953) (4,065,846)
At 1 january 2016 (As restated) 3,584,279 (390,166) 473,237 7,613,506 8,086,743 8,898,992 20,179,848
Profit for the year – – – 506,540 506,540 285,749 792,289
Other comprehensive income – – 86,448 (1,359) 85,089 (16,213) 68,876
Total comprehensive income for the year – – 86,448 505,181 591,629 269,536 861,165
Contributions by and distribution to owners:
Dividend payments by subsidiary companies – – – – – (125,596) (125,596)
Dividend payment to Company’s shareholders 30(c) – – – (68,288) (68,288) – (68,288)
Additional capital contributions from non-controlling shareholder to subsidiary company – – – – – 21 21
Increase of share capital in subsidiaries – – 727 – 727 – 727
Share of changes in an associate’s other reserves – – 28,380 – 28,380 464 28,844
Share of an associate’s employee share based compensation reserve – – 1,331 – 1,331 – 1,331
Total transactions with owners in their capacity as owners – – 30,438 (68,288) (37,850) (125,111) (162,961)
Balance at 31 December 2016 3,584,279 (390,166) 590,123 8,050,399 8,640,522 9,043,417 20,878,052
Other reserves comprise capital reserves of subsidiary companies, gain on sale of treasury shares and foreign currency translation differences.
CONSOLIDATED STATEMENT OF CHANGES IN EqUITYFor the financial year ended 31 December 2017
The accompanying accounting policies and explanatory notes form an integral part of the financial statements.

72 INDOFOOD AGRI RESOURCES LTD
ANNUAL REPORT 2017
Note 2017 2016Rp million Rp million
Cash flows from operating activities
Profit before taxation 1,138,153 1,689,541Adjustments for:Depreciation and amortisation 8 1,430,421 1,402,187Realisation of deferred costs 149,373 148,595Unrealised foreign exchange loss/(gain) 14,065 (121,030)Gain arising from changes in fair value of biological assets (34,839) (219,000)Impairment loss/(recovery) of financial assets 31(a) 41,394 (6,887)Gain on disposal and write-off of property, plant and equipment (1,859) (569)Provision for unrecoverable advances 7 38,952 56,456Changes in allowance for decline in market value
and obsolescence of inventories 5,22 5,163 65,171Changes in provision for asset dismantling costs 7,27 3,063 3,608Changes in estimated liability for employee benefits 349,017 307,017Effective interest rate amortisation of financial assets 21,608 13,556Share of results of associate companies 17,915 67,400Loss on significance influence over an associate – 9,071Share of results of a joint venture (138,654) 33,109Impairment of goodwill 15 7,800 –Finance income 9 (107,505) (92,124)Finance expense 10 647,043 665,618
Operating cash flows before changes in working capital 3,581,110 4,021,719
Changes in working capital:
Increase in other non-current receivables (117,462) (266,112)Decrease/(increase) in inventories 61,037 (399,189)Increase in trade and other receivables (73,537) (204,610)Decrease/(increase) in advances to suppliers 51,462 (108,975)(Decrease)/increase in prepaid taxes, advances and other payable (306,122) 226,395Decrease in trade and other payables and accruals (11,857) (182,882)
Cash flows from operations 3,184,631 3,086,346
Interest received 106,910 91,454Interest paid (632,229) (637,274)Income tax paid (710,866) (503,616)
Net cash flows from operating activities 1,948,446 2,036,910
CONSOLIDATED CASH FLOW STATEMENT For the financial year ended 31 December 2017
The accompanying accounting policies and explanatory notes form an integral part of the financial statements.

73 INDOFOOD AGRI RESOURCES LTD
ANNUAL REPORT 2017
Note 2017 2016Rp million Rp million
Cash flows from investing activities
Additions to property, plant and equipment (1,164,738) (1,281,259)Additions to biological assets 13 (4,481) (2,436)Increase in plasma receivables 31(a) (135,183) (189,696)Proceeds from disposal of property, plant and equipment 5,426 6,092Advances for projects and purchases of fixed assets (76,954) (101,019)Investment in associate companies (349,350) –Capital reduction in an associate company – 30,960Acquisition of a subsidiary, net of cash acquired – (54,996)
Net cash flows used in investing activities (1,725,280) (1,592,354)
Cash flows from financing activities
Proceeds from interest-bearing loans and borrowings 3,128,000 4,129,767Repayment of interest-bearing loans and borrowings (2,662,474) (4,143,253)Proceeds from amount due to related parties 12,000 202,805Dividend payments by subsidiaries to non-controlling interest (154,147) (125,596)Dividend payment to Company’s shareholders 30 (86,554) (68,288)Capital contributions from non-controlling interest 58,043 7,000
Net cash flows from financing activities 294,868 2,435
Net increase in cash and cash equivalents 518,034 446,991
Effect of changes in exchange rates on cash and cash equivalents 6,802 (11,253)Cash and cash equivalents at the beginning of the financial year 2,404,838 1,969,100
Cash and cash equivalents at the end of the financial year 24 2,929,674 2,404,838
CONSOLIDATED CASH FLOW STATEMENT For the financial year ended 31 December 2017
The accompanying accounting policies and explanatory notes form an integral part of the financial statements.

74 INDOFOOD AGRI RESOURCES LTD
ANNUAL REPORT 2017
1. CORPORATE INFORMATION
Indofood Agri Resources Ltd. (the “Company”) is a public limited liability company incorporated and domiciled in Singapore and is listed on the Singapore Exchange Securities Trading Limited (“SGX-ST”). The registered office and principal place of business of the Company is located at 8 Eu Tong Sen Street, #16-96/97 The Central, Singapore 059818.
The Group is a vertically-integrated agribusiness group, with its principal activities comprising research and development, oil palm seed breeding, cultivation of oil palm plantations, production and refining of crude palm oil (“CPO”), cultivation of rubber, sugar cane and industrial timber plantations and marketing and selling these end products. The Group is also involved in managing and cultivating small portions of cocoa and tea plantations, and marketing and selling the related products.
These activities are carried out through the Company’s subsidiary and associate companies. The principal activity of the Company is that of an investment holding company. The principal activities of the subsidiary companies are set out in Note 18 to the financial statements.
PT Indofood Sukses Makmur Tbk (“PT ISM”), incorporated in Indonesia, and First Pacific Company Limited, incorporated in Hong Kong, are the penultimate and ultimate parent company of the Company, respectively. The immediate holding company is Indofood Singapore Holdings Pte Ltd, incorporated in Singapore.
2. SUMMARY OF SIGNIFICANT ACCOUNTING POLICIES
2.1 Basis of preparation
The consolidated financial statements of the Group and the balance sheet of the Company have been prepared in accordance with Singapore Financial Reporting Standards (“FRS”).
The financial statements have been prepared on the historical cost basis, except as disclosed in the accounting policies below.
The financial statements are presented in Indonesian Rupiah (“Rp”) and all values are rounded to the nearest million (Rp million) except when otherwise indicated.
Convergence with International Financial Reporting Standards
For annual financial period beginning on or after 1 January 2018, Singapore-incorporated companies listed on the Singapore Exchange will apply Singapore Financial Reporting Framework (International), a new financial reporting framework identical to International Financial Reporting Standards. The Group will adopt SFRS(I) on 1 January 2018.
The Group has performed an assessment of the impact of adopting SFRS(I) based on the current available information. On transition to the new financial reporting framework, the Group expects the deferred tax liability to increase. The Group does not expect material impact on the financial statements upon transition to the new financial reporting framework. This assessment may be subject to changes arising from ongoing analysis until the Group adopt SFRS(I) in 2018.
Other than the potential deferred tax liability as described above and the impact on adoption of the SFRS(I) 15 and SFRS(I) 9, the Group expects that adoption of SFRS(I) will have no material impact on the financial statements in the year of initial application. The Group expects the impact of adopting SFRS(I) 15 and SFRS(I) 9 will be similar to the impact on adoption of FRS 115 and FRS 109 as disclosed in Note 2.3.
2.2 Changes in accounting policies
The accounting policies adopted are consistent with those of the previous financial year except in the current financial year, the Group has adopted all the new and revised standards which are effective for annual financial periods beginning on or after 1 January 2017, including the Amendments to FRS 7 Disclosure Initiative. The adoption of these standards did not have any material effect on the financial performance or position of the Group and the Company.
NOTES TO THE FINANCIAL STATEMENTS For the financial year ended 31 December 2017

NOTES TO THE FINANCIAL STATEMENTS For the financial year ended 31 December 2017
75 INDOFOOD AGRI RESOURCES LTD
ANNUAL REPORT 2017
2. SUMMARY OF SIGNIFICANT ACCOUNTING POLICIES (CONT’D)
2.3 Standards issued but not yet effective
The Group has not adopted the following standards and interpretations that have been issued but not yet effective:
Description
Effective for annual periods beginning
on or
Amendments to FRS 102 Classification and Measurement of Share-based Payment Transactions
1 January 2018
Amendments to FRS 40 Transfers of Investment Property 1 January 2018 FRS 109 Financial Instruments 1 January 2018 FRS 115 Revenue from Contracts with Customers 1 January 2018 Improvements to FRSs (December 2016) – Amendments to FRS 28 Investments in Associates and Joint Ventures
1 January 2018
INT FRS 122 Foreign Currency Transactions and Advance Consideration 1 January 2018FRS 116 Leases 1 January 2019INT FRS 123 Uncertainty over Income Tax Treatments 1 January 2019Amendments to FRS 109 Prepayment Features with Negative Compensation 1 January 2019Amendments to FRS 28 Long-term Interests in Associates and Joint Ventures 1 January 2019Improvements to FRSs (March 2018) 1 January 2019– Amendments to FRS 103 Business Combinations– Amendments to FRS 111 Joint Arrangements– Amendments to FRS 12 Income Taxes– Amendments to FRS 23 Borrowing CostsAmendments to FRS 110 and FRS 28 Sale or Contribution of
Assets between an Investor and its Associate or Joint Venture Date to be determined
As disclosed in Note 2.1, the Group will adopt SFRS(I) on 1 January 2018. Upon adoption of SFRS(I) on 1 January 2018, the SFRS(I) equivalent of the above standards that are effective on 1 January 2018 will be adopted at the same time.
Except for SFRS(I) 9, SFRS(I) 15 and SFRS(I) 16, the directors expect that the adoption of the SFRS(I) equivalent of the above standards will have no material impact on the financial statements in the year of initial application. The nature of the impending changes in accounting policy on adoption of SFRS(I) 9, SFRS(I) 15 and SFRS(I) 16 are described below.
SFRS(I) 15 Revenue from Contracts with Customers
SFRS(I) 15 establishes a five-step model to account for revenue arising from contracts with customers, and introduces new contract cost guidance. Under SFRS(I) 15, revenue is recognised at an amount that reflects the consideration which an entity expects to be entitled in exchange for transferring goods or services to a customer. The new revenue standard is effective for annual periods beginning on or after 1 January 2018.
Step 1 – Identify contract(s) with a customer:
A contract is defined as an agreement between two or more parties that creates enforceable rights and obligations and sets out the criteria for every contract that must be met.
Step 2 – Identify performance obligations in the contract:
A performance obligation is a promise in a contract with a customer to transfer a good or service to the customer.
Step 3 – Determine the transaction price:
The transaction price is the amount of consideration to which the Group expects to be entitled in exchange for transferring promised goods or services to a customer, excluding amounts collected on behalf of third parties.

NOTES TO THE FINANCIAL STATEMENTS For the financial year ended 31 December 2017
76 INDOFOOD AGRI RESOURCES LTD
ANNUAL REPORT 2017
2. SUMMARY OF SIGNIFICANT ACCOUNTING POLICIES (CONT’D)
2.3 Standards issued but not yet effective (cont’d)
SFRS(I) 15 Revenue from Contracts with Customers (cont’d)
Step 4 – Allocate the transaction price to the performance obligations in the contract:
For a contract that has more than one performance obligation, the Group allocates the transaction price to each performance obligation in an amount that depicts the amount of consideration to which the Group expects to be entitled in exchange for satisfying each performance obligation.
Step 5 – Recognise revenue when (or as) the Group satisfies a performance obligation.
The Group satisfies a performance obligation and recognises revenue over time, if one of the following criteria is met:
(a) The Group’s performance does not create an asset with an alternate use to the Group and the Group has as an enforceable right to payment for performance completed to date.
(b) The Group’s performance creates or enhances an asset that the customer controls as the asset is created or enhanced.
(c) The customer simultaneously receives and consumes the benefits provided by the Group’s performance as the Group performs.
For performance obligations where one of the above conditions are not met, revenue is recognised at the point in time at which the performance obligation is satisfied. When the Group satisfies a performance obligation by delivering the promised goods or services it creates a contract based asset on the amount of consideration earned by the performance. Where the amount of consideration received from a customer exceeds the amount of revenue recognised this gives rise to a contract liability.
Revenue is measured at the fair value of the consideration received or receivable, taking into account contractually defined terms of payment and excluding discounts, rebates, taxes and duty. Under FRS 115, variable consideration is estimated and is constrained to the extent that it is highly probable that a significant reversal in the amount of cumulative revenue recognised will not occur when the associate uncertainty is subsequently resolved. The Group assesses its revenue arrangements against specific criteria to determine if it is acting as principal or agent.
Taking the above into consideration, the Group has performed a preliminary impact assessment of adopting SFRS(I) 15 based on currently available information. This assessment may be subject to changes arising from ongoing analysis until the Group adopts SFRS(I) 15 in 2018.
The Group is a vertically-integrated agribusiness group, with its principal activities comprising research and development, oil palm seed breeding, cultivation of oil palm plantations, production and refining of crude palm oil (“CPO”), cultivation of rubber, sugar cane and industrial timber plantations and marketing and selling these end products. The Group is also involved in managing and cultivating small portions of cocoa and tea plantations, and marketing and selling the related products. The Group’s business segments are (i) Plantations and (ii) Edible Oils and Fats (“EOF”).
The Group has assessed and identified the following variable considerations based on the current contracts of the Group with the customers.
• Cash incentives at EOF division• Right of return at EOF division• Volume discount for palm seeds at plantation division • Change of price due to difference in CPO quality
The Group does not expect material impact on the financial statements in the year of initial application, except the reclassification of cash incentives from selling and distribution expenses to a deduction in revenue.
The Group plans to apply the changes in accounting policies retrospectively to each reporting year presented, using the full retrospective approach.

NOTES TO THE FINANCIAL STATEMENTS For the financial year ended 31 December 2017
77 INDOFOOD AGRI RESOURCES LTD
ANNUAL REPORT 2017
2. SUMMARY OF SIGNIFICANT ACCOUNTING POLICIES (CONT’D)
2.3 Standards issued but not yet effective (cont’d)
SFRS(I) 9 Financial Instruments
SFRS(I) 9 introduces new requirements for classification and measurement of financial assets, impairment of financial assets and hedge accounting, and is effective for annual periods beginning on or after 1 January 2018. Financial assets are classified according to their contractual cash flow characteristics and the business model under which they are held. The impairment requirements in SFRS(I) 9 are based on an expected credit loss (“ECL”) model and replace the FRS 39 incurred loss model.
The Group plans to apply the changes in accounting policies retrospectively to each reporting year presented, using the full retrospective approach.
The Group has performed a preliminary impact assessment of adopting SFRS(I) 9 and identified the accounts which would have the following impacts upon the adoption of SFRS(I) 9. This assessment may be subject to changes arising from ongoing analysis, until the Group adopts SFRS(I) 9 in 2018.
(a) Classification and measurement
The Group’s debt instruments are expected to give rise to cash flows representing solely payments of principal and interest. Except the available-for-sale unquoted equity, the Group intends to hold its current financial to collect contractual cash flows, and accordingly measured at amortised cost when it applies SFRS(I) 9.
For available-for-sale unquoted equity, the Group will elect to measure it at fair value through other comprehensive income. Any subsequent changes in fair value of the available-for-sale will be recognized to other comprehensive income without recycling to profit or loss.
The Group does not expect any significant impact to arise from these changes.
(b) Impairment
SFRS(I) 9 requires the Group and the Company to record expected credit losses (“ELC”) on all of its debt securities, loans, trade receivables and financial guarantees, either on a 12-month or lifetime basis.
The Group expects to apply the simplified approach and record lifetime expected losses on all trade receivables.
For financial assets that contain significant financing component such as the Group’s plasma receivables and the Company’s amount due from subsidiary companies, the Group and the Company expects to apply general approach. Under the general approach, the Group assessed if there are any significant changes in credit risk of the plasma receivables to determine whether to provide credit losses based on 12-month or lifetime basis.
Upon application of the expected credit loss model, The Group does not expect material impact on the ECL and on the financial statements in the year of initial application of the standard.

NOTES TO THE FINANCIAL STATEMENTS For the financial year ended 31 December 2017
78 INDOFOOD AGRI RESOURCES LTD
ANNUAL REPORT 2017
2. SUMMARY OF SIGNIFICANT ACCOUNTING POLICIES (CONT’D)
2.3 Standards issued but not yet effective (cont’d)
SFRS(I) 16 Leases
SFRS(I) 16 requires lessees to recognise most leases on balance sheets to reflect the rights to use the leased assets and the associated obligations for lease payments as well as the corresponding interest expense and depreciation charges. The standard includes two recognition exemptions for lessees – leases of ‘low value’ assets and short-term leases. The new leases standard is effective for annual periods beginning on or after 1 January 2019.
The Group has performed a preliminary impact assessment of the adoption of FRS 116 and expects that the adoption of SFRS(I) 16 will result in increase in total assets and total liabilities, EBITDA and gearing ratio.
The Group plans to adopt the new standard on the required effective date by applying SFRS(I) 16 retrospectively, to adjust the opening balance of each affected component of equity for the earliest prior period presented and the other comparative amounts for each prior period presented as if the entity has always applied the requirements of the new standard.
The Group is currently in the process of analysing the transitional approaches and practical expedients to be elected on transition to SFRS(I) 16 and assessing the possible impact of adoption.
2.4 Basis of consolidation and business combinations
(a) Basis of consolidation
The consolidated financial statements comprise the financial statements of the Company and its subsidiaries as at the end of the reporting period. The financial statements of the subsidiaries used in the preparation of the consolidated financial statements are prepared for the same reporting date as the Company. Consistent accounting policies are applied to like transactions and events in similar circumstances.
All intra-group balances, income and expenses and unrealised gains and losses resulting from intra-group transactions and dividends are eliminated in full.
Subsidiaries are consolidated from the date of acquisition, being the date on which the Group obtains control, and continue to be consolidated until the date that such control ceases.
Losses within a subsidiary are attributed to the non-controlling interest even if that results in a deficit balance.
A change in the ownership interest of a subsidiary, without a loss of control, is accounted for as an equity transaction. If the Group loses control over a subsidiary, it:
– Derecognises the assets (including goodwill) and liabilities of the subsidiary at their carrying amounts at the date when controls are lost;
– Derecognises the carrying amount of any non-controlling interest;– Derecognises the cumulative translation differences recorded in equity;– Recognises the fair value of the consideration received;– Recognises the fair value of any investment retained;– Recognises any surplus or deficit in profit or loss;– Re-classifies the Group’s share of components previously recognised in other comprehensive income
to profit or loss or retained earnings, as appropriate.

NOTES TO THE FINANCIAL STATEMENTS For the financial year ended 31 December 2017
79 INDOFOOD AGRI RESOURCES LTD
ANNUAL REPORT 2017
2. SUMMARY OF SIGNIFICANT ACCOUNTING POLICIES (CONT’D)
2.4 Basis of consolidation and business combinations (cont’d)
(b) Business combinations
Business combinations are accounted for by applying the acquisition method. Identifiable assets acquired and liabilities assumed in a business combination are measured initially at their fair values at the acquisition date. Acquisition-related costs are recognised as expenses in the periods in which the costs are incurred and the services are received.
Any contingent consideration to be transferred by the acquirer will be recognised at fair value at the acquisition date. Subsequent changes to the fair value of the contingent consideration which is deemed to be an asset or liability, will be recognised in profit or loss.
The Group elects for each individual business combination, whether non-controlling interest in the acquiree (if any), that are present ownership interests and entitle their holders to a proportionate share of net assets in the event of liquidation, is recognised on the acquisition date at fair value, or at the non-controlling interest’s proportionate share of the acquiree’s identifiable net assets. Other components of non-controlling interests are measured at their acquisition date fair value, unless another measurement basis is required by another FRS.
Any excess of the sum of the fair value of the consideration transferred in the business combination, the amount of non-controlling interest in the acquiree (if any), and the fair value of the Group’s previously held equity interest in the acquiree (if any), over the net fair value of the acquiree’s identifiable assets and liabilities is recorded as goodwill. The accounting policy for goodwill is set out in Note 2.10(a). In instances where the latter amount exceeds the former, the excess is recognised as gain on bargain purchase in profit or loss on the acquisition date.
2.5 Transactions with non-controlling interests
Non-controlling interest represents the equity in subsidiaries not attributable, directly or indirectly, to owners of the Company.
Changes in the Company’s ownership interest in a subsidiary that do not result in a loss of control are accounted for as equity transactions. In such circumstances, the carrying amounts of the controlling and non-controlling interests are adjusted to reflect the changes in their relative interests in the subsidiary. Any difference between the amount by which the non-controlling interest is adjusted and the fair value of the consideration paid or received is recognised directly in equity and attributed to owners of the Company.
2.6 Foreign currency
The Group’s consolidated financial statements are presented in Indonesian Rupiah (“Rp”), which is also the Company’s functional currency. Each entity in the Group determines its own functional currency and items included in the financial statements of each entity are measured using that functional currency.
(a) Transactions and balances
Transactions in foreign currencies are measured in the respective functional currencies of the Company and its subsidiaries and are recorded on initial recognition in the functional currencies at exchange rates approximating those ruling at the transaction dates. Monetary assets and liabilities denominated in foreign currencies are translated at the rate of exchange ruling at the end of the reporting period. Non-monetary items that are measured in terms of historical cost in a foreign currency are translated using the exchange rates as at the dates of the initial transactions. Non-monetary items measured at fair value in a foreign currency are translated using the exchange rates at the date when the fair value was measured.
Exchange differences arising on the settlement of monetary items or on translating monetary items at the end of the reporting period are recognised in profit or loss.

NOTES TO THE FINANCIAL STATEMENTS For the financial year ended 31 December 2017
80 INDOFOOD AGRI RESOURCES LTD
ANNUAL REPORT 2017
2. SUMMARY OF SIGNIFICANT ACCOUNTING POLICIES (CONT’D)
2.6 Foreign currency (cont’d)
(b) Consolidated financial statements
For consolidation purpose, the assets and liabilities of foreign operations are translated into Rp at the rate of exchange ruling at the end of the reporting period and their profit or loss are translated at the exchange rates prevailing at the date of the transactions. The exchange differences arising on the translation are recognised in other comprehensive income. On disposal of a foreign operation, the component of other comprehensive income relating to that particular foreign operation is recognised in profit or loss.
In the case of a partial disposal without loss of control of a subsidiary that includes a foreign operation, the proportionate share of the cumulative amount of the exchange differences are re-attributed to non-controlling interest and are not recognised in profit or loss. For partial disposals of associates or jointly controlled entities that are foreign operations, the proportionate share of the accumulated exchange differences is reclassified to profit or loss.
2.7 Property, plant and equipment
(a) Bearer Plants
Bearer plants are living plants used in the production or supply of agricultural produce; they are expected to bear produce for more than one period; and have a remote likelihood of being sold as agricultural produce, except for incidental scrap sales.
The Group’s bearer plants comprise mainly oil palm, rubber and sugar cane plantations. The Group elected to account for its bearer plants using the cost model under FRS 16. Immature bearer plants are accounted for at accumulated cost, which consist mainly of the accumulated cost of land clearing, planting, fertilising, up-keeping and maintaining the plantations, and allocations of indirect overhead costs up to the time the trees become commercially productive and available for harvest. Costs also include capitalised borrowing costs and other charges incurred in connection with the financing of the development of immature plantations. Immature plantations are not amortised.
Immature plantations are reclassified to mature plantations when they are commercially productive and available for harvest. In general, an oil palm plantation takes about 3 to 4 years to reach maturity from the time of planting the seedlings, while a rubber plantation takes about 5 to 6 years to reach maturity. A sugar cane plantation takes about a year to reach maturity, and can be harvested for an average of 4 times after the initial planting.
Mature plantations are stated at cost, and are amortised using the straight-line method over their estimated useful lives of the primary bearer plants as follows:
• Oil palm plantations 25 years• Rubber plantations 25 years• Sugar cane plantations 4 years
The carrying amounts of bearer plants are reviewed for impairment when events or changes in circumstances indicate that the carrying values may not be fully recoverable.
The carrying amount of an item of bearer plants is derecognised upon disposal or when no future economic benefits are expected from its use or disposal. Any gain or loss arising from derecognition of the asset (calculated as the difference between the net disposal proceeds and the carrying amount of the asset) is directly included in the profit or loss when the item is derecognised.
The assets useful lives and amortisation method are reviewed at each year end and adjusted prospectively if necessary.
Upkeep and maintenance costs are recognised in profit or loss when they are incurred. The cost of major renovation and restoration is included in the carrying amount of the related asset when it is probable that future economic benefits in excess of the originally assessed standard of performance of the existing asset will flow to the Group, and is depreciated over the remaining useful life of the related asset.

NOTES TO THE FINANCIAL STATEMENTS For the financial year ended 31 December 2017
81 INDOFOOD AGRI RESOURCES LTD
ANNUAL REPORT 2017
2. SUMMARY OF SIGNIFICANT ACCOUNTING POLICIES (CONT’D)
2.7 Property, plant and equipment (cont’d)
(b) Other Property, Plant and Equipment
All other property, plant and equipment are initially recognised at cost, which comprises its purchase price and any costs directly attributable in bringing the asset to its working condition and to the location where it is intended to be used. Such cost also includes initial estimation at present value of the costs of dismantling and removing items of property, plant and equipment in certain CPO refinery and fractionation plants and margarine plants of the Group located in rented sites, costs of restoring the said rented sites, as well as costs of replacing part of such property, plant and equipment when that cost is incurred, if the recognition criteria are met.
Subsequent to initial recognition, property, plant and equipment are carried at cost less any subsequent accumulated depreciation and impairment losses.
Depreciation is computed on a straight-line basis over the estimated useful lives of the assets as follows:
• Land use rights 8 to 40 years• Buildings and improvements 10 to 25 years• Plant and machinery 4 to 20 years• Heavy equipment, transportation equipment and vessel 5 to 30 years• Furniture, fixtures and office equipment 4 to 10 years
Assets under construction included in plant and equipment are not depreciated as these assets are not yet available for use.
The carrying values of property, plant and equipment are reviewed for impairment when events or changes in circumstances indicate that the carrying value may not be recoverable.
The residual value, useful life and depreciation method are reviewed at each financial year-end, and adjusted prospectively, if appropriate.
An item of property, plant and equipment is derecognised upon disposal or when no future economic benefits are expected from its use or disposal. Any gain or loss on derecognition of the asset is included in profit or loss in the year the asset is derecognised.
Repairs and maintenance costs are taken to the profit or loss when they are incurred. The cost of major renovation and restoration is included in the carrying amount of the related asset when it is probable that future economic benefits in excess of the originally assessed standard of performance of the existing asset will flow to the Group, and is depreciated over the remaining useful life of the related asset.
2.8 Biological assets
The Group’s biological assets comprise timber plantations and agriculture produce of the bearer plants, which primarily comprise of oil palm and sugar cane.
The Group recognised the fair value of biological assets in accordance with FRS 41. Biological assets are stated at fair value less costs to sell. Gains or losses arising on initial recognition of biological assets and from the change in fair value of biological assets at each reporting date are recognised in the profit or loss for the period in which they arise.
The Group adopted the income approach to measure the fair value of the biological assets. For the valuation of unharvested produce of oil palm and rubber trees, the Group has applied the actual harvest data subsequent to year end to derive the fair value of unharvested produce of oil palm and rubber trees at year end. For the valuation of sugar cane, the Group has applied discounted cash flow models to derive its fair value.
For timber plantations, the Group appoints an independent valuer to determine the fair value of timber at year end and any resultant gains or losses arising from the changes in fair values is recognised in the profit or loss. The independent valuer adopts the income approach for the fair valuation of timber using a discounted cash flow model. The cash flow models estimate the relevant future cash flows which are expected to be generated in the future, and are discounted to the present value by using a discount rate. Please refer to Note 13 for more information.

NOTES TO THE FINANCIAL STATEMENTS For the financial year ended 31 December 2017
82 INDOFOOD AGRI RESOURCES LTD
ANNUAL REPORT 2017
2. SUMMARY OF SIGNIFICANT ACCOUNTING POLICIES (CONT’D)
2.9 Plasma receivables
Certain subsidiaries within the Group (collectively referred to as the “Nucleus Companies”), have commitments with several rural cooperatives (“KUD” or Koperasi Unit Desa) representing plasma farmers to develop plantations as required by the Indonesian government. The Nucleus Companies is to provide guidance and sharing of knowledge in developing the oil palm plasma plantations up to the productive stage. The financing of these plasma plantations are mainly provided by the banks. In the situation where the plasma farmers’ plantations have yet to generate positive cashflows to meet its repayment obligations to the banks, the Nucleus Companies provide temporary loans to help the plasma farmers to develop the plantation and to repay the principal and interest. Several Nucleus Companies provide corporate guarantees to the related credit facilities provided by the banks. The plasma receivables presented in the consolidated statement of financial position consist of accumulated development costs incurred and the funding provided by the Nucleus Companies to the KUD or plasma farmers less the funds received from banks on behalf of the KUD or plasma farmers and accumulated impairment loss. Plasma receivables also include advances to plasma farmers for topping up the loan interest and instalment payments to banks, and advances for fertilizers and other agriculture supplies. These advances shall be reimbursed by the plasma farmers. Plasma receivables are classified as loans and receivables under FRS 39. The accounting policy for financial instruments is set out in Note 2.15.
2.10 Intangible assets
(a) Goodwill
Goodwill is initially measured at cost. Following initial recognition, goodwill is measured at cost less any accumulated impairment losses.
For the purpose of impairment testing, goodwill acquired in a business combination is, from the acquisition date, allocated to the Group’s cash-generating units that are expected to benefit from the synergies of the combination, irrespective of whether other assets or liabilities of the acquiree are assigned to those units.
The cash-generating units to which goodwill has been allocated are tested for impairment annually and whenever there is an indication that the cash-generating unit may be impaired. Impairment is determined for goodwill by assessing the recoverable amount of each cash-generating unit (or group of cash-generating units) to which the goodwill relates.
(b) Other intangible assets
Intangible assets acquired separately are measured initially at cost. Following initial acquisition, intangible assets are carried at cost less any accumulated amortisation and any accumulated impairment losses. Internally generated intangible assets, excluding capitalised development costs, are not capitalised and expenditure is reflected in profit or loss in the year in which the expenditure is incurred.
The useful lives of intangible assets are assessed to be either finite or indefinite.
Intangible assets with finite lives are amortised over the estimated useful lives and assessed for impairment whenever there is an indication that the intangible asset may be impaired. The amortisation period and the amortisation method are reviewed at least at each financial year-end. Changes in the expected useful life or the expected pattern of consumption of future economic benefits embodied in the asset is accounted for by changing the amortisation period or method, as appropriate, and are treated as changes in accounting estimates.
Intangible assets with indefinite useful lives or not yet available for use are tested for impairment annually, or more frequently if the events and circumstances indicate that the carrying value may be impaired either individually or at the cash-generating unit level. Such intangible assets are not amortised. The useful life of an intangible asset with an indefinite life is reviewed annually to determine whether the useful life assessment continues to be supportable. If not, the change in useful life from indefinite to finite is made on a prospective basis.

NOTES TO THE FINANCIAL STATEMENTS For the financial year ended 31 December 2017
83 INDOFOOD AGRI RESOURCES LTD
ANNUAL REPORT 2017
2. SUMMARY OF SIGNIFICANT ACCOUNTING POLICIES (CONT’D)
2.10 Intangible assets (cont’d)
(b) Other intangible assets (cont’d)
Gains or losses arising from derecognition of an intangible asset are measured as the difference between the net disposal proceeds and the carrying amount of the asset and are recognised in the profit or loss when the asset is derecognised.
(c) Research and development costs
Research costs are expensed as incurred. Deferred development costs arising from development expenditures on an individual project are recognised as an intangible asset when the Group can demonstrate the technical feasibility of completing the intangible asset so that it will be available for use or sale, its intention to complete and its ability to use or sell the asset, how the asset will generate future economic benefits, the availability of resources to complete and the ability to measure reliably the expenditure during the development.
Following initial recognition of the development costs as an intangible asset, it is carried at cost less accumulated amortisation and any accumulated losses. Amortisation of the intangible asset begins when development is complete and the asset is available for use. Deferred development costs have a finite useful life and are amortised over the period of expected sales from the related project on a straight line basis.
2.11 Impairment of non-financial assets
The Group assesses at each reporting date whether there is an indication that an asset may be impaired. If any such indication exists, or when annual impairment testing for an asset is required, the Group makes an estimate of the asset’s recoverable amount.
An asset’s recoverable amount is the higher of an asset’s or cash-generating unit’s (“CGUs”) fair value less costs of disposal and its value in use and is determined for an individual asset, unless the asset does not generate cash inflows that are largely independent of those from other assets or group of assets. Where the carrying amount of an asset or cash-generating unit exceeds its recoverable amount, the asset is considered impaired and is written down to its recoverable amount.
In assessing value in use, the estimated future cash flows expected to be generated by the asset are discounted to their present value using a pre-tax discount rate that reflects current market assessments of the time value of money and the risks specific to the asset. In determining fair value less costs of disposal, an appropriate valuation model is used, such as discounted cash flow method.
The Group bases its impairment calculation on detailed budgets and forecast calculations which are prepared separately for each of the Group’s CGUs to which the individual assets are allocated. These budgets and forecast calculations generally cover a period of ten years. For longer periods, a long term growth rate is calculated and applied to projected future cash flows after the tenth year.
Impairment losses of continuing operations are recognised in profit or loss, except for assets that are previously revalued where the revaluation was taken to other comprehensive income. In this case, the impairment is also recognised in other comprehensive income up to the amount of any previous revaluation.
For assets excluding goodwill, an assessment is made at each annual reporting period as to whether there is any indication that previously recognised impairment losses recognised for an asset may no longer exist or may have decreased. If such indication exists, the Group estimates the asset’s or CGU’s recoverable amount. A previously recognised impairment loss for an asset other than goodwill is reversed only if there has been a change in the estimates used to determine the asset’s recoverable amount since the last impairment loss was recognised. If that is the case, the carrying amount of the asset is increased to its recoverable amount. That increased amount cannot exceed the carrying amount that would have been determined, net of depreciation, had no impairment loss been recognised for the asset previously. Such reversal is recognised in the profit or loss.

NOTES TO THE FINANCIAL STATEMENTS For the financial year ended 31 December 2017
84 INDOFOOD AGRI RESOURCES LTD
ANNUAL REPORT 2017
2. SUMMARY OF SIGNIFICANT ACCOUNTING POLICIES (CONT’D)
2.12 Subsidiaries
A subsidiary is an investee that is controlled by the Group. The Group controls an investee when it is exposed, or has the rights, to variable returns from its involvement with the investee and has the ability to affect those returns through its power over the investee.
In the Company’s separate financial statements, investments in subsidiaries are accounted for at cost less impairment losses.
2.13 Associates
An associate is an entity over which the Group has the power to participate in the financial and operating policy decisions of the investee but does not have control or joint control of those policies.
The Group accounts for its investment in associates using the equity method from the date on which it becomes an associate.
Under the equity method, the investment in associates are carried in the balance sheet at cost plus post-acquisition changes in the Group’s share of net assets of the associates. The profit or loss reflects the share of results of the operations of the associates. Goodwill relating to the associate is included in the carrying amount of the investment and is neither amortised nor individually tested for impairment. Any excess of the Group’s share of the net fair value of the associate’s identifiable assets and liabilities over the cost of the investment is included as income in the determination of the Group’s share of the associate’s profit or loss in the period in which the investment is acquired.
Where there has been a change recognised in other comprehensive income by the associates, the Group recognises its share of such changes in other comprehensive income. Unrealised gains and losses resulting from transactions between the Group and the associates are eliminated to the extent of the interest in the associates.
The Group’s share of the profit or loss of its associates is the profit attributable to equity holders of the associates and, therefore is the profit or loss after tax and non-controlling interest in the subsidiaries of associates.
When the Group’s share of losses in an associate equals or exceeds its interest in the associate, the Group does not recognise further losses, unless it has incurred obligations or made payments on behalf of the associate.
After application of the equity method, the Group determines whether it is necessary to recognise an additional impairment loss on the Group’s investment in associate. The Group determines at the end of each reporting period whether there is any objective evidence that the investment in the associate is impaired. If this is the case, the Group calculates the amount of impairment as the difference between the recoverable amount of the associate and its carrying value and recognises the amount in profit or loss.
The financial statements of the associates are prepared as the same reporting date as the Company. Where necessary, adjustments are made to bring the accounting policies in line with those of the Group.
Upon loss of significant influence over the associate, the Group measures and recognises the retained interest at fair value. Any difference between the fair value of the aggregate of the retained interest and proceeds from disposal and the carrying amount of the investment at the date the equity method was discontinued is recognised in profit or loss.

NOTES TO THE FINANCIAL STATEMENTS For the financial year ended 31 December 2017
85 INDOFOOD AGRI RESOURCES LTD
ANNUAL REPORT 2017
2. SUMMARY OF SIGNIFICANT ACCOUNTING POLICIES (CONT’D)
2.14 joint venture
A joint venture is a contractual arrangement whereby two or more parties have joint control and provides the right to the net assets of the arrangement. Joint control is the contractually agreed sharing of control of an arrangement, which exists only when decisions about the relevant activities require the unanimous consent of the parties sharing control.
The Group recognises its interest in the joint venture as an investment and accounts for the investment using the equity method from the date on which it becomes a joint venture.
On acquisition of the investment, any excess of the cost of the investment over the Group’s share of the net fair value of the investee’s identifiable assets and liabilities is accounted as goodwill and is included in the carrying amount of the investment. Any excess of the Group’s share of the net fair value of the investee’s identifiable assets and liabilities over the cost of the investment is included as income in the determination of the Group’s share of the joint venture’s profit or loss in the period in which the investment is acquired.
Under the equity method, the investment in joint venture is carried in the balance sheet at cost plus post-acquisition changes in the Group’s share of net assets of the joint venture. Goodwill relating to the joint venture is included in the carrying amount of the investment and is neither amortised nor individually tested for impairment. Any excess of the Group’s share of the net fair value of the joint venture’s identifiable assets and liabilities over the cost of the investment is included as income in the determination of the Group’s share of the joint venture’s profit or loss in the period in which the investment is acquired.
The financial statements of the joint venture are prepared as the same reporting date as the Company. Where necessary, adjustments are made to bring the accounting policies in line with those of the Group.
Upon loss of joint control over the joint venture, the Group measures the retained interest at fair value. Any difference between the fair value of the aggregate of the retained interest and proceeds from disposal and the carrying amount of the investment at the date the equity method was discontinued is recognised in profit or loss.
2.15 Financial instruments
(a) Financial assets
Initial recognition and measurement
Financial assets are recognised when, and only when, the Group becomes a party to the contractual provisions of the financial instrument. The Group determines the classification of its financial assets at initial recognition.
When financial assets are recognised initially, they are measured at fair value plus, in the case of financial assets not at fair value through profit or loss, directly attributable transaction costs.
Subsequent measurement
The subsequent measurement of financial assets depends on their classification as follows:
(a) Financial assets at fair value through profit or loss
Financial assets at fair value through profit or loss include financial assets held for trading. Financial assets are classified as held for trading if they are acquired for the purpose of selling or repurchasing in the near term. This category includes derivative financial instruments entered into by the Group. Derivatives, including separated embedded derivatives are also classified as held for trading.
Subsequent to initial recognition, financial assets at fair value through profit or loss are measured at fair value. Any gains or losses arising from changes in fair value of the financial assets are recognised in profit or loss. Net gains or net losses on financial assets at fair value through profit or loss include exchange differences, interest and dividend income.

NOTES TO THE FINANCIAL STATEMENTS For the financial year ended 31 December 2017
86 INDOFOOD AGRI RESOURCES LTD
ANNUAL REPORT 2017
2. SUMMARY OF SIGNIFICANT ACCOUNTING POLICIES (CONT’D)
2.15 Financial instruments (cont’d)
(a) Financial assets (cont’d)
(a) Financial assets at fair value through profit or loss (cont’d)
Derivatives embedded in host contracts are accounted for as separate derivatives and recorded at fair value if their economic characteristics and risks are not closely related to those of the host contracts and the host contracts are not measured at fair value with changes in fair value recognised in profit or loss. These embedded derivatives are measured at fair value with changes in fair value recognised in profit or loss. Reassessment only occurs if there is a change in the terms of the contract that significantly modifies the cash flows that would otherwise be required.
(b) Loans and receivables
Non-derivative financial assets with fixed or determinable payments that are not quoted in an active market are classified as loans and receivables. Subsequent to initial recognition, loans and receivables are measured at amortised cost using the effective interest method, less impairment. Gains and losses are recognised in profit or loss when the loans and receivables are derecognised or impaired, and through the amortisation process.
(c) Available-for-sale financial assets
Available-for-sale financial assets include equity and debt securities. Equity investments classified as available-for-sale are those, which are neither classified as held for trading nor designated at fair value through profit or loss. Debt securities in this category are those which are intended to be held for an indefinite period of time and which may be sold in response to needs for liquidity or in response to changes in the market conditions.
After initial recognition, available-for-sale financial assets are subsequently measured at fair value. Any gains or losses from changes in fair value of the financial assets are recognised in other comprehensive income, except that impairment losses, foreign exchange gains and losses on monetary instruments and interest calculated using the effective interest method are recognised in profit or loss. The cumulative gain or loss previously recognised in other comprehensive income is reclassified from equity to profit or loss as a reclassification adjustment when the financial asset is derecognised.
Investments in equity instruments whose fair value cannot be reliably measured are measured at cost less impairment loss.
Derecognition
A financial asset is derecognised when the contractual right to receive cash flows from the asset has expired. On derecognition of a financial asset in its entirety, the difference between the carrying amount and the sum of the consideration received and any cumulative gain or loss that had been recognised in other comprehensive income is recognised in profit or loss.
Regular way purchase or sale of a financial asset
All regular way purchases and sales of financial assets are recognised or derecognised on the trade date i.e. the date that the Group commits to purchase or sell the asset. Regular way purchases or sales are purchases or sales of financial assets that require delivery of assets within the period generally established by regulation or convention in the market place concerned.

NOTES TO THE FINANCIAL STATEMENTS For the financial year ended 31 December 2017
87 INDOFOOD AGRI RESOURCES LTD
ANNUAL REPORT 2017
2. SUMMARY OF SIGNIFICANT ACCOUNTING POLICIES (CONT’D)
2.15 Financial instruments (cont’d)
(b) Financial liabilities
Initial recognition and measurement
Financial liabilities are recognised when, and only when, the Group becomes a party to the contractual provisions of the financial instrument. The Group determines the classification of its financial liabilities at initial recognition.
All financial liabilities are recognised initially at fair value plus, in the case of financial liabilities not at fair value through profit or loss, directly attributable transaction costs.
Subsequent measurement
The measurement of financial liabilities depends on their classification as follows:
(a) Financial liabilities at fair value through profit or loss
Financial liabilities at fair value through profit or loss includes financial liabilities held for trading. Financial liabilities are classified as held for trading if they are acquired for the purpose of selling in the near term. This category includes derivative financial instruments entered into by the Group that are not designated as hedging instruments in hedge relationships. Separated embedded derivatives are also classified as held for trading unless they are designated as effective hedging instruments.
Subsequent to initial recognition, financial liabilities at fair value through profit or loss are measured at fair value. Any gains or losses arising from changes in fair value of the financial liabilities are recognised in profit or loss.
The Group has not designated any financial liabilities upon initial recognition at fair value through profit or loss.
(b) Financial liabilities at amortised cost
After initial recognition, financial liabilities that are not carried at fair value through profit or loss are subsequently measured at amortised cost using the effective interest method. Gains and losses are recognised in profit or loss when the liabilities are derecognised, and through the amortisation process.
Derecognition
A financial liability is derecognised when the obligation under the liability is discharged or cancelled or expires. When an existing financial liability is replaced by another from the same lender on substantially different terms, or the terms of an existing liability are substantially modified, such an exchange or modification is treated as a derecognition of the original liability and the recognition of a new liability, and the difference in the respective carrying amounts is recognised in profit or loss.
2.16 Impairment of financial assets
The Group assesses at each end of the reporting period whether there is any objective evidence that a financial asset is impaired.
(a) Financial assets carried at amortised cost
For financial assets carried at amortised cost, the Group first assesses whether objective evidence of impairment exists individually for financial assets that are individually significant, or collectively for financial assets that are not individually significant. If the Group determines that no objective evidence of impairment exists for an individually assessed financial asset, whether significant or not, it includes the asset in a group of financial assets with similar credit risk characteristics and collectively assesses them for impairment. Assets that are individually assessed for impairment and for which an impairment loss is, or continues to be recognised are not included in a collective assessment of impairment.

NOTES TO THE FINANCIAL STATEMENTS For the financial year ended 31 December 2017
88 INDOFOOD AGRI RESOURCES LTD
ANNUAL REPORT 2017
2. SUMMARY OF SIGNIFICANT ACCOUNTING POLICIES (CONT’D)
2.16 Impairment of financial assets (cont’d)
(a) Financial assets carried at amortised cost (cont’d)
If there is objective evidence that an impairment loss on financial assets carried at amortised cost has been incurred, the amount of the loss is measured as the difference between the asset’s carrying amount and the present value of estimated future cash flows discounted at the financial asset’s original effective interest rate. If a loan has a variable interest rate, the discount rate for measuring any impairment loss is the current effective interest rate. The carrying amount of the asset is reduced through the use of an allowance account. The impairment loss is recognised in profit or loss.
When the asset becomes uncollectible, the carrying amount of impaired financial asset is reduced directly or if an amount was charged to the allowance account, the amounts charged to the allowance account are written off against the carrying value of the financial asset.
To determine whether there is objective evidence that an impairment loss on financial assets has been incurred, the Group considers factors such as the probability of insolvency or significant financial difficulties of the debtor and default or significant delay in payments.
If in a subsequent period, the amount of the impairment loss decreases and the decrease can be related objectively to an event occurring after the impairment was recognised, the previously recognised impairment loss is reversed to the extent that the carrying amount of the asset does not exceed its amortised cost at the reversal date. The amount of reversal is recognised in profit or loss.
(b) Financial assets carried at cost
If there is objective evidence (such as significant adverse changes in the business environment where the issuer operates, probability of insolvency or significant financial difficulties of the issuer) that an impairment loss on financial assets carried at cost has been incurred, the amount of the loss is measured as the difference between the asset’s carrying amount and the present value of estimated future cash flows discounted at the current market rate of return for a similar financial asset. Such impairment losses are not reversed in subsequent periods.
(c) Available-for-sale financial assets
In the case of equity investments classified as available-for-sale, objective evidence of impairment include (i) significant financial difficulty of the issuer or obligor, (ii) information about significant changes with an adverse effect that have taken place in the technological, market, economic or legal environment in which the issuer operates, and indicates that the cost of the investment in equity instrument may not be recovered; and (iii) a significant or prolonged decline in the fair value of the investment below its costs.
If an available-for-sale financial asset is impaired, an amount comprising the difference between its acquisition cost (net of any principal repayment and amortisation) and its current fair value, less any impairment loss previously recognised in profit or loss, is transferred from other comprehensive income and recognised in profit or loss. Reversals of impairment losses in respect of equity instruments are not recognised in profit or loss; increase in their fair value after impairment are recognised directly in other comprehensive income.
In the case of debt instruments classified as available-for-sale, impairment is assessed based on the same criteria as financial assets carried at amortised cost. However, the amount recorded for impairment is the cumulative loss measured as the difference between the amortised cost and the current fair value, less any impairment loss on that investment previously recognised in profit or loss. Future interest income continues to be accrued based on the reduced carrying amount of the asset, using the rate of interest used to discount the future cash flows for the purpose of measuring the impairment loss. The interest income is recorded as part of finance income. If, in a subsequent year, the fair value of a debt instrument increases and the increases can be objectively related to an event occurring after the impairment loss was recognised in profit or loss, the impairment loss is reversed in profit or loss.

NOTES TO THE FINANCIAL STATEMENTS For the financial year ended 31 December 2017
89 INDOFOOD AGRI RESOURCES LTD
ANNUAL REPORT 2017
2. SUMMARY OF SIGNIFICANT ACCOUNTING POLICIES (CONT’D)
2.17 Cash and cash equivalents
Cash and cash equivalents comprise cash on hand and in banks, and short term deposits with an original maturity of 3 months or less at the time of placements and are readily convertible to known amounts of cash which are subject to an insignificant risk of changes in value.
Cash and cash equivalents carried in the consolidated balance sheet are classified and accounted for as loans and receivables under FRS 39. The accounting policy for this category of financial assets is stated in Note 2.15.
2.18 Inventories
Inventories are stated at the lower of cost and net realisable value. Cost is calculated using weighted-average method.
Cost incurred in bringing each product to its present location and condition is accounted for as follows:
Raw materials, goods in transit, spare parts and factory supplies – purchase cost; and
Finished goods and work in progress – cost of direct materials and labour and a proportion of manufacturing overheads based on normal operating capacity but excluding borrowing costs.
Where necessary, allowance is provided for damaged, obsolete and slow moving items to adjust the carrying value of inventories to the lower of cost and net realisable value.
Net realisable value is the estimated selling price in the ordinary course of business, less estimated costs of completion and the estimated costs necessary to make the sale.
2.19 Provisions
Provisions are recognised when the Group has a present obligation (legal or constructive) where, as a result of a past event, it is probable that an outflow of resources embodying economic benefits will be required to settle the obligation and the amount of the obligation can be estimated reliably.
Provisions are reviewed at the end of each reporting period and adjusted to reflect the current best estimate. If it is no longer probable that an outflow of resources embodying economic benefits will be required to settle the obligation, the provision is reversed. If the effect of the time value of money is material, provisions are discounted using a current pre-tax rate that reflects, where appropriate, the risks specific to the liability. When discounting is used, the increase in the provision due to the passage of time is recognised as a finance cost.
2.20 Financial guarantee
A financial guarantee contract is a contract that requires the issuer to make specified payments to reimburse the holder for a loss it incurs because a specified debtor fails to make payment when due in accordance with the terms of a debt instrument.
Financial guarantees are recognised initially as a liability at fair value, adjusted for transaction costs that are directly attributable to the issuance of the guarantee. Subsequent to initial recognition, financial guarantees are recognised as income in profit or loss over the period of the guarantee. If it is probable that the liability will be higher than the amount initially recognised less amortisation, the liability is recorded at the higher amount with the difference charged to profit or loss.

NOTES TO THE FINANCIAL STATEMENTS For the financial year ended 31 December 2017
90 INDOFOOD AGRI RESOURCES LTD
ANNUAL REPORT 2017
2. SUMMARY OF SIGNIFICANT ACCOUNTING POLICIES (CONT’D)
2.21 Borrowing costs
Borrowing costs are capitalised as part of the cost of a qualifying asset if they are directly attributable to the acquisition, construction or production of that asset. Capitalisation of borrowing costs commences when the activities to prepare the asset for its intended use or sale are in progress and the expenditures and borrowing costs are incurred. Borrowing costs are capitalised until the assets are substantially completed for their intended use or sale. All other borrowing costs are expensed in the period they occur. Borrowing costs consist of interest and other costs that an entity incurs in connection with the borrowing of funds.
2.22 Employee benefits
(a) Defined contribution plans
The Group participates in the national pension schemes as defined by the laws of the countries in which it has operations. In particular, the Singapore companies in the Group make contributions to the Central Provident Fund scheme in Singapore, a defined contribution pension scheme. Contributions to national pension schemes are recognised as an expense in the period in which the related service is performed.
Certain subsidiaries in the Group have defined contribution retirement plans covering all of its qualified permanent employees. The Group’s contributions to the funds are computed at 10.0% and 7.0% of the basic pensionable income for staff and non-staff employees, respectively. The related liability arising from the difference between the cumulative funding since the establishment of the program and the cumulative pension costs charged to the profit or loss during the same period is recognised as employee benefits liabilities in the consolidated balance sheet.
(b) Defined benefit plans
The Group also provides additional provisions for employee service entitlements in order to meet the minimum benefits required to be paid to qualified employees, as required under the Indonesian Labour Law No.13/2003 (the “Labour Law”). The said additional provisions, which are unfunded, are estimated by actuarial calculations using the projected unit credit method.
The estimated liability for employee benefits is the aggregate of the present value of the defined benefit obligations at the end of the reporting period.
Defined benefit costs comprise the following:
– Service cost– Net interest on the net defined benefit liability; and– Remeasurements of the net defined benefit liability
Service costs which include current service costs, past service costs and gains or losses on non-routine settlements are recognised as expense in profit or loss. Past service costs are recognised when plan amendment or curtailment occurs.
Net interest on the net defined benefit liability is the change during the period in the net defined benefit liability that arises from the passage of time, which is determined by applying the discount rate to the net defined benefit liability. Net interest on the net defined benefit liability is recognised as expense or income in profit or loss.
Remeasurements comprising actuarial gains and losses are recognised immediately in other comprehensive income in the period in which they arise. Remeasurements are recognised in retained earnings within equity and are not reclassified to profit or loss in subsequent periods.

NOTES TO THE FINANCIAL STATEMENTS For the financial year ended 31 December 2017
91 INDOFOOD AGRI RESOURCES LTD
ANNUAL REPORT 2017
2. SUMMARY OF SIGNIFICANT ACCOUNTING POLICIES (CONT’D)
2.23 Leases
The determination of whether an arrangement is, or contains a lease is based on the substance of the arrangement at inception date: whether fulfilment of the arrangement is dependent on the use of a specific asset or assets or the arrangement conveys a right to use the asset, even if that right is not explicitly specified in an arrangement.
(a) As lessee
Finance leases which transfer to the Group substantially all the risks and rewards incidental to ownership of the leased item, are capitalised at the inception of the lease at the fair value of the leased asset or, if lower, at the present value of the minimum lease payments. Any initial direct costs are also added to the amount capitalised. Lease payments are apportioned between the finance charges and reduction of the lease liability so as to achieve a constant rate of interest on the remaining balance of the liability. Finance charges are charged to profit or loss. Contingent rents, if any, are charged as expenses in the periods in which they are incurred.
Capitalised leased assets are depreciated over the shorter of the estimated useful life of the asset and the lease term, if there is no reasonable certainty that the Group will obtain ownership by the end of the lease term.
Operating lease payments are recognised as an expense in profit or loss on a straight-line basis over the lease term. The aggregate benefit of incentives provided by the lessor is recognised as a reduction of rental expense over the lease term on a straight-line basis.
(b) As lessor
Leases in which the Group does not transfer substantially all the risks and rewards of ownership of the asset are classified as operating leases. Initial direct costs incurred in negotiating an operating lease are added to the carrying amount of the leased asset and recognised over the lease term on the same bases as rental income. The accounting policy for rental income is set out in Note 2.25(c).
(c) Land use rights
Land leases are considered finance leases since the arrangements transfer the substantial risks and rewards incidental to ownership of the land. As such, land leases are presented as part of property, plant and equipment.
Included as part of the land leases are the costs associated with the legal transfer or renewal of land right title, such as legal fees, land survey and re-measurement fees, taxes and other related expenses.
Land use rights are initially measured at cost. Following initial recognition, land use rights are measured at cost less accumulated amortisation. The land use rights are amortised on a straight-line basis over the lease term ranging from 8 to 40 years.
2.24 Non-current asset held for sale
Non-current assets classified as held for sale are measured at the lower of their carrying amount and fair value less costs to sell. Non-current assets are classified as held for sale if their carrying amounts will be recovered principally through a sale transaction rather than through continuing use. Property, plant and equipment and intangible assets once classified as held for sale are not depreciated or amortised.

NOTES TO THE FINANCIAL STATEMENTS For the financial year ended 31 December 2017
92 INDOFOOD AGRI RESOURCES LTD
ANNUAL REPORT 2017
2. SUMMARY OF SIGNIFICANT ACCOUNTING POLICIES (CONT’D)
2.25 Revenue
Revenue is recognised to the extent that it is probable that the economic benefits will flow to the Group and the revenue can be reliably measured, regardless of when the payment is made. Revenue is measured at the fair value of consideration received or receivable, taking into account contractually defined terms of payment and excluding taxes or duty. The Group assesses its revenue arrangements to determine if it is acting as principal or agent. The following specific recognition criteria must also be met before revenue is recognised:
(a) Sale of goods
Revenue from sales arising from physical delivery of CPO, palm kernel (“PK”), palm-based products, copra-based products, edible oils and other agricultural products is recognised when significant risks and rewards of ownership of goods are transferred to the buyer, which generally coincide with their delivery and acceptance.
(b) Interest income
Interest income is recognised using the effective interest method.
(c) Rental and storage income
Rental and storage income is recognised on a straight-line basis over the lease terms on an ongoing basis.
(d) Dividend income
Dividend income is recognised when the right to receive payment is established.
2.26 Taxes
(a) Current income tax
Current income tax assets and liabilities for the current and prior periods are measured at the amount expected to be recovered from or paid to the taxation authorities. The tax rates and tax laws used to compute the amount are those that are enacted or substantively enacted by the end of the reporting period, in the countries where the Group operates and generates taxable income.
Current income taxes are recognised in profit or loss except to the extent that the tax relates to items recognised outside profit or loss, either in other comprehensive income or directly in equity. Management periodically evaluates positions taken in the tax returns with respect to situations in which applicable tax regulations are subject to interpretation and establishes provisions where appropriate.
(b) Deferred tax
Deferred tax is provided using the liability method on temporary differences at the end of the reporting period between the tax bases of assets and liabilities and their carrying amounts for financial reporting purposes.
Deferred tax liabilities are recognised for all temporary differences, except:
– Where the deferred tax liability arises from the initial recognition of goodwill or of an asset or liability in a transaction that is not a business combination and, at the time of the transaction, affects neither the accounting profit nor taxable profit or loss; and
– In respect of taxable temporary differences associated with investments in subsidiaries, associates and interests in joint ventures, where the timing of the reversal of the temporary differences can be controlled and it is probable that the temporary differences will not reverse in the foreseeable future.

NOTES TO THE FINANCIAL STATEMENTS For the financial year ended 31 December 2017
93 INDOFOOD AGRI RESOURCES LTD
ANNUAL REPORT 2017
2. SUMMARY OF SIGNIFICANT ACCOUNTING POLICIES (CONT’D)
2.26 Taxes (cont’d)
(b) Deferred tax (cont’d)
Deferred tax assets are recognised for all deductible temporary differences, carry forward of unused tax credits and unused tax losses, to the extent that it is probable that taxable profit will be available against which the deductible temporary differences, and the carry forward of unused tax credits and unused tax losses can be utilised except:
– Where the deferred tax asset relating to the deductible temporary difference arises from the initial recognition of an asset or liability in a transaction that is not a business combination and, at the time of the transaction, affects neither the accounting profit nor taxable profit or loss; and
– In respect of deductible temporary differences associated with investments in subsidiaries, associates and interests in joint ventures, deferred income tax assets are recognised only to the extent that it is probable that the temporary differences will reverse in the foreseeable future and taxable profit will be available against which the temporary differences can be utilised.
The carrying amount of deferred tax assets is reviewed at the end of each reporting period and reduced to the extent that it is no longer probable that sufficient taxable profit will be available to allow all or part of the deferred tax asset to be utilised. Unrecognised deferred tax assets are reassessed at the end of each reporting period and are recognised to the extent that it has become probable that future taxable profit will allow the deferred tax asset to be recovered.
Deferred tax assets and liabilities are measured at the tax rates that are expected to apply to the year when the asset is realised or the liability is settled, based on tax rates and tax laws that have been enacted or substantively enacted at the end of each reporting period.
Deferred tax relating to items recognised outside profit or loss is recognised outside profit or loss. Deferred tax items are recognised in correlation to the underlying transaction either in other comprehensive income or directly in equity and deferred tax arising from a business combination is adjusted against goodwill on acquisition.
Deferred tax assets and deferred tax liabilities are offset, if a legally enforceable right exists to set off current income tax assets against current income tax liabilities and the deferred income taxes relate to the same taxable entity and the same taxation authority.
(c) value-added tax (“vAT”)
Revenues, expenses and assets are recognised net of the amount of VAT except:
– Where the VAT incurred on a purchase of assets or services is not recoverable from the taxation authority, in which case the VAT is recognised as part of the cost of acquisition of the asset or as part of the expense item as applicable; and
– Receivables and payables that are stated with the amount of VAT included.
The net amount of VAT recoverable from, or payable to, the taxation authority is included as part of receivables or payables in the consolidated balance sheet.

NOTES TO THE FINANCIAL STATEMENTS For the financial year ended 31 December 2017
94 INDOFOOD AGRI RESOURCES LTD
ANNUAL REPORT 2017
2. SUMMARY OF SIGNIFICANT ACCOUNTING POLICIES (CONT’D)
2.27 Segment reporting
For management purposes, the Group is organised into operating segments based on their products and services which are independently managed by the respective segment managers responsible for the performance of the respective segments under their charge. The segment managers report directly to the management who regularly review the segment results in order to allocate resources to the segments and to assess the segment performance. Additional disclosures on each of these segments are shown in Note 36, including the factors used to identify the reportable segments and the measurement basis of segment information.
2.28 Share capital and share issuance expenses
Proceeds from issuance of ordinary shares are recognised as share capital in equity. Incremental costs directly attributable to the issuance of ordinary shares are deducted against share capital.
2.29 Treasury shares
The Group’s own equity instruments, which are reacquired (treasury shares) are recognised at cost and deducted from equity. No gain or loss is recognised in profit or loss on the purchase, sale, issue or cancellation of the Group’s own equity instruments. Any difference between the carrying amount of treasury shares and the consideration received, if reissued, is recognised directly in equity. Voting rights relating to treasury shares are nullified for the Group and no dividends are allocated to them respectively.
2.30 Contingencies
A contingent liability is:
(a) a possible obligation that arises from past events and whose existence will be confirmed only by the occurrence or non-occurrence of one or more uncertain future events not wholly within the control of the Group; or
(b) a present obligation that arises from past events but is not recognised because:
(i) It is not probable that an outflow of resources embodying economic benefits will be required to settle the obligation; or
(ii) The amount of the obligation cannot be measured with sufficient reliability.
A contingent asset is a possible asset that arises from past events and whose existence will be confirmed only by the occurrence or non-occurrence of one or more uncertain future events not wholly within the control of the Group.
Contingent liabilities and assets are not recognised on the balance sheet of the Group, except for contingent liabilities assumed in a business combination that are present obligations and which the fair values can be reliably determined.

NOTES TO THE FINANCIAL STATEMENTS For the financial year ended 31 December 2017
95 INDOFOOD AGRI RESOURCES LTD
ANNUAL REPORT 2017
3. SIGNIFICANT ACCOUNTING ESTIMATES AND jUDGEMENTS
The preparation of the Group’s consolidated financial statements requires management to make judgements, estimates and assumptions that affect the reported amounts of revenues, expenses, assets and liabilities, and the disclosure of contingent liabilities at the end of each reporting period. Uncertainty about these assumptions and estimates could result in outcomes that require a material adjustment to the carrying amount of the asset or liability affected in the future periods.
3.1 judgements made in applying accounting policies
In the process of applying the Group’s accounting policies, management has made the following judgements which have the most significant effect on the amounts recognised in the consolidated financial statements:
(a) Allowance for doubtful debts
Individual assessment
The Group evaluates specific accounts where it has information that certain customers are unable to meet their financial obligations. In these cases, the Group uses judgement, based on the best available facts and circumstances, including but not limited to, the length of its relationship with the customer and the customer’s current credit status based on third party credit reports and known market factors, to record specific allowance against amount due from such customers to reduce its receivable to the amount the Group expects to collect. These specific allowances are re-evaluated and adjusted as additional information received affects the amounts of allowance for doubtful debts.
Collective assessment
If the Group determines that no objective evidence of impairment exists for individually assessed trade receivables, whether significant or not, it includes the asset in a group of financial assets with similar credit risk characteristics and collectively assesses them for impairment. The characteristics chosen are relevant to the estimation of future cash flows for groups of such trade receivables by being indicative of the customers’ ability to pay all amounts due. Future cash flows in a group of trade receivables that are collectively evaluated for impairment are estimated on the basis of historical loss experience for the trade receivables with credit risk characteristics similar to those in the group.
The carrying amount of the Group’s trade receivables before allowance for doubtful debts as at 31 December 2017 is Rp1,073.9 billion (2016: Rp1,012.1 billion). Further details are disclosed in Note 23.
(b) Allowance for uncollectible plasma receivables
The Group evaluates the excess of accumulated development costs over the banks’ and Group’s funding on the amount committed by the plasma farmers. In such cases, the Group uses judgement, based on available facts and circumstances, to record allowance for uncollectible plasma receivables. These provisions are re-evaluated and adjusted as additional information received. The net carrying amount of the Group’s plasma receivables as of 31 December 2017 and 2016 is disclosed in Notes 21 and 23.

NOTES TO THE FINANCIAL STATEMENTS For the financial year ended 31 December 2017
96 INDOFOOD AGRI RESOURCES LTD
ANNUAL REPORT 2017
3. SIGNIFICANT ACCOUNTING ESTIMATES AND jUDGEMENTS (CONT’D)
3.2 Key sources of estimation uncertainty
The key assumptions concerning the future and other key sources of estimation uncertainty at the end of the reporting period are discussed below. The Group based its assumptions and estimates on parameters available when the financial statements were prepared. Existing circumstances and assumptions about future developments, however, may change due to market changes or circumstances arising beyond the control of the Group. Such changes are reflected in the assumptions when they occur.
(a) Goodwill impairment
Application of acquisition method requires extensive use of accounting estimates to allocate the purchase price to the fair market values of the assets and liabilities acquired, including intangible assets. Certain business acquisitions of the Group have resulted in goodwill, which is not amortised but subject to impairment testing, and whenever circumstances indicate that the carrying amount of the cash-generating unit where the goodwill was allocated into may be impaired.
Determining the fair values of biological assets, property, plant and equipment, and other non-current assets of the acquirees at the date of business combination, requires the determination of future cash flows expected to be generated from the continued use and ultimate disposition of such assets, requires the Group to make estimates and assumptions that can materially affect its consolidated financial information. Future events could cause the Group to conclude that the assets are impaired. The preparation of estimated future cash flows involves significant estimations. While the Group believes that its assumptions are appropriate and reasonable, significant changes in its assumptions may materially affect its assessment of recoverable values and may lead to impairment charge in the future.
Impairment review is performed when certain impairment indication is present. In the case of goodwill, such assets are subject to annual impairment test and whenever there is an indication that such asset may be impaired. Management has to use its judgement in estimating the recoverable value.
The carrying amount of the Group’s goodwill as at 31 December 2017 is Rp3,245.8 billion (2016: Rp3,253.6 billion). Further details are disclosed in Note 15.
(b) Pension and employee benefits
The determination of the Group’s obligations and cost for pension and employee benefits liabilities is dependent on its selection of certain assumptions used by independent actuaries in calculating such amounts. Those assumptions include among others, discount rates, future annual salary increase, annual employee turnover rate, disability rate, retirement age and mortality rate. Actuarial gains or losses arising from experience adjustments and changes in actuarial assumptions are recognised immediately in other comprehensive income as and when they occur. While the Group believes that its assumptions are reasonable and appropriate, significant differences in the Group’s actual experiences or significant changes in the Group’s assumptions may materially affect its estimated liabilities for pension and employee benefits and net employee benefits expense.
The carrying amount of the Group’s employee benefits liabilities as at 31 December 2017 is Rp2,361.3 billion (2016: Rp1,980.2 billion). The key assumptions applied in the determination of pension and employee benefits liabilities including a sensitivity analysis, are disclosed and further explained in Note 28.
(c) Depreciation of property, plant and equipment
The cost of property, plant and equipment are depreciated on a straight-line basis over their estimated useful lives. Management estimates the useful lives of these property, plant and equipment to be within 4 to 40 years. These are common life expectancies applied in the industries where the Group conducts its businesses. Changes in the expected level of usage and technological development could impact the economic useful lives and the residual values of these assets, and therefore future depreciation charges could be revised. The net carrying amount of the Group’s property, plant and equipment as at 31 December 2017 is disclosed in Note 14.

NOTES TO THE FINANCIAL STATEMENTS For the financial year ended 31 December 2017
97 INDOFOOD AGRI RESOURCES LTD
ANNUAL REPORT 2017
3. SIGNIFICANT ACCOUNTING ESTIMATES AND jUDGEMENTS (CONT’D)
3.2 Key sources of estimation uncertainty (cont’d)
(d) Biological assets
The Group recognises its timber plantations and agriculture produce of bearer plants at fair value less costs to sell, which requires the use of accounting estimates and assumptions.
The Group adopts the income approach to measure the fair value of unharvested produce of bearer plants and timber plantations. The significant assumptions applied to determine the fair value of biological assets included the projected selling prices, production yields, discount rate, inflation rate and exchange rates. For the valuation of unharvested fruit bunches of oil palm, the Group has applied the actual harvest data subsequent to year end to derive the fair value of unharvested produce of oil palm at year end. For the valuation of sugar cane and timber, the Group has applied discounted cash flow models to derive its fair value.
The amount of changes in fair values would differ if there are changes to the assumptions used. Any changes in fair values of these agriculture produces would affect the Group’s profit or loss and equity. The carrying amount of the Group’s biological assets as at 31 December 2017 (under Non-current assets and Current assets) is Rp850.1 billion (2016: Rp789.8 billion). The key assumptions applied in the determination of fair value of biological assets including a sensitivity analysis, are disclosed and further explained in Note 13.
(e) Income tax
Significant judgement is involved in determining provision for income tax. Uncertainties exist with respect to the interpretation of tax regulations, changes in tax laws, and the amount and timing of future taxable income which requires future adjustments to tax income and expense already recorded. There are certain transactions and computation for which the ultimate tax determination is uncertain during the ordinary course of business. The Group recognises liabilities for expected income tax issues based on estimates of whether additional income taxes will be due. Where the final income tax outcome of these matters is different from the amounts that were initially recognised, such differences will impact the income tax and deferred income tax in the year in which such decision is made by the taxation authority. The carrying amount of the Group’s tax payables as at 31 December 2017 is Rp91.7 billion (2016: Rp215.5 billion).
Deferred tax assets are recognised for all unused tax losses to the extent that it is probable that taxable profit will be available against which the losses can be utilised. Significant management estimates are required to determine the amount of deferred tax assets that can be recognised, based upon the likely timing and the level of future taxable profits together with future tax planning strategies. The carrying amount of the Group’s deferred tax assets as at 31 December 2017 is Rp1,347.0 billion (2016: Rp1,240.2 billion). Further details are disclosed in Note 17.
(f) Allowance for decline in market value of inventories and obsolescence of inventories
Allowance for decline in market value of inventories and obsolescence of inventories is estimated based on the best available facts and circumstances, including but not limited to, the inventories’ own physical conditions, their market selling prices, estimated costs of completion and estimated costs to be incurred for their sales. The provisions are re-evaluated and adjusted as additional information received affects the amount estimated. The carrying amount of the Group’s inventories as at 31 December 2017 is Rp2,204.5 billion (2016: Rp2,270.7 billion). Further details are disclosed in Note 22.
4. REvENUE
Revenue mainly comprise of net sales of palm oil, rubber, sugar, edible oils, and other agricultural products.
During the years ended 31 December 2017 and 2016, the Group sold edible oils and fats products totalling Rp1,784.6 billion or 11.28% of total consolidated revenue (2016: Rp1,665.2 or 11.46%) to PT Indofood CBP Sukses Makmur Tbk (“PT ICBP”), a related company.

NOTES TO THE FINANCIAL STATEMENTS For the financial year ended 31 December 2017
98 INDOFOOD AGRI RESOURCES LTD
ANNUAL REPORT 2017
5. COST OF SALES
GroupNote 2017 2016
Rp million Rp million
Raw materials used 5,297,782 4,893,304Harvesting, upkeep and cultivation costs 2,332,662 1,990,655Manufacturing and other overhead expenses 3,418,006 3,306,781Cost of inventories recognised as expenses 22 1,578,029 786,291Allowance for decline in market value and
obsolescence of inventories 22 5,163 65,171
Total 12,631,642 11,042,202
6. OTHER OPERATING INCOME
GroupNote 2017 2016
Rp million Rp million
Sundry sales of oil palm seedlings 3,696 5,977Management fee income 6,765 7,052Sale of green palm certificates 8,319 9,234Gain on disposal of property, plant and equipment 2,728 2,430Sale of scraps 1,436 633Sale of palm kernel shells 12,399 12,555Net difference in offsetting financial asset and
liability (settlement of contracts) 31(e) – 107,308Adjustment arising from loss on significant influence
over an associate company – 28,231Others 46,980 40,406
Total 82,323 213,826
7. OTHER OPERATING EXPENSES
GroupNote 2017 2016
Rp million Rp million
Impairment loss of an available-for-sale asset 40,957 –Plasma plantation charges and allowance for impairment 24,214 41,043Write-off of property, plant and equipment 869 1,861Amortisation of deferred charges 9,981 22,302Changes in provision for assets dismantling costs 27 3,063 3,608Provision for unrecoverable advances 38,952 56,456Others 33,953 31,101
Total 151,989 156,371
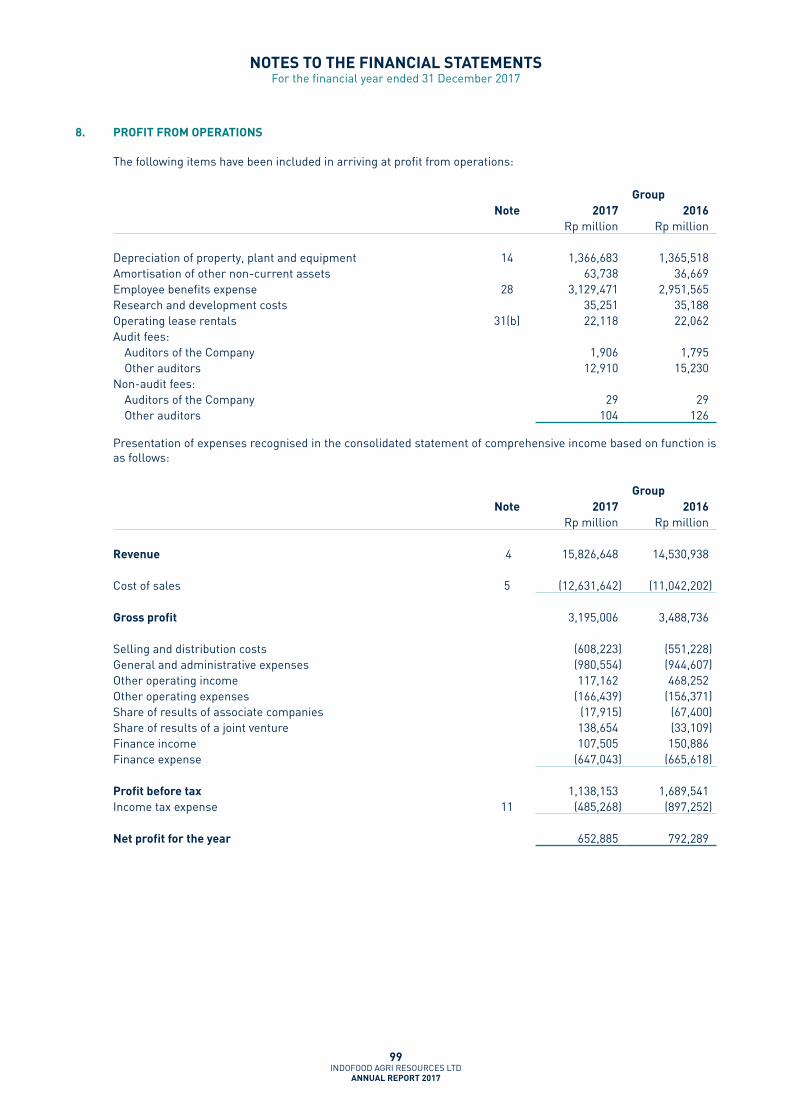
NOTES TO THE FINANCIAL STATEMENTS For the financial year ended 31 December 2017
99 INDOFOOD AGRI RESOURCES LTD
ANNUAL REPORT 2017
8. PROFIT FROM OPERATIONS
The following items have been included in arriving at profit from operations:
GroupNote 2017 2016
Rp million Rp million
Depreciation of property, plant and equipment 14 1,366,683 1,365,518Amortisation of other non-current assets 63,738 36,669Employee benefits expense 28 3,129,471 2,951,565Research and development costs 35,251 35,188Operating lease rentals 31(b) 22,118 22,062Audit fees:
Auditors of the Company 1,906 1,795Other auditors 12,910 15,230
Non-audit fees:Auditors of the Company 29 29Other auditors 104 126
Presentation of expenses recognised in the consolidated statement of comprehensive income based on function is as follows:
GroupNote 2017 2016
Rp million Rp million
Revenue 4 15,826,648 14,530,938
Cost of sales 5 (12,631,642) (11,042,202)
Gross profit 3,195,006 3,488,736
Selling and distribution costs (608,223) (551,228)General and administrative expenses (980,554) (944,607)Other operating income 117,162 468,252Other operating expenses (166,439) (156,371)Share of results of associate companies (17,915) (67,400)Share of results of a joint venture 138,654 (33,109)Finance income 107,505 150,886Finance expense (647,043) (665,618)
Profit before tax 1,138,153 1,689,541Income tax expense 11 (485,268) (897,252)
Net profit for the year 652,885 792,289

NOTES TO THE FINANCIAL STATEMENTS For the financial year ended 31 December 2017
100 INDOFOOD AGRI RESOURCES LTD
ANNUAL REPORT 2017
9. FINANCE INCOME
Group2017 2016
Rp million Rp million
Interest on current accounts and short-term deposits 106,411 90,826Others 1,094 1,298
Total 107,505 92,124
10. FINANCE EXPENSE
Group2017 2016
Rp million Rp million
Interest expense on:– Bank loans 609,192 623,296– Others 23,303 26,897Bank charges 14,548 15,425
Total 647,043 665,618
11. INCOME TAX EXPENSE
Major components of income tax expense
The major components of income tax expense for the years ended 31 December 2017 and 2016 are:
Group2017 2016
Rp million Rp million
Consolidated statement of comprehensive income:Current income tax– Current year income tax 587,110 634,791– Adjustments in respect of previous years 22,042 49,460
609,152 684,251Deferred income tax (Note 17)– Current year deferred income tax (273,834) (79,475)– Adjustments in respect of previous years 149,950 292,476
(123,884) 213,001
Total 485,268 897,252
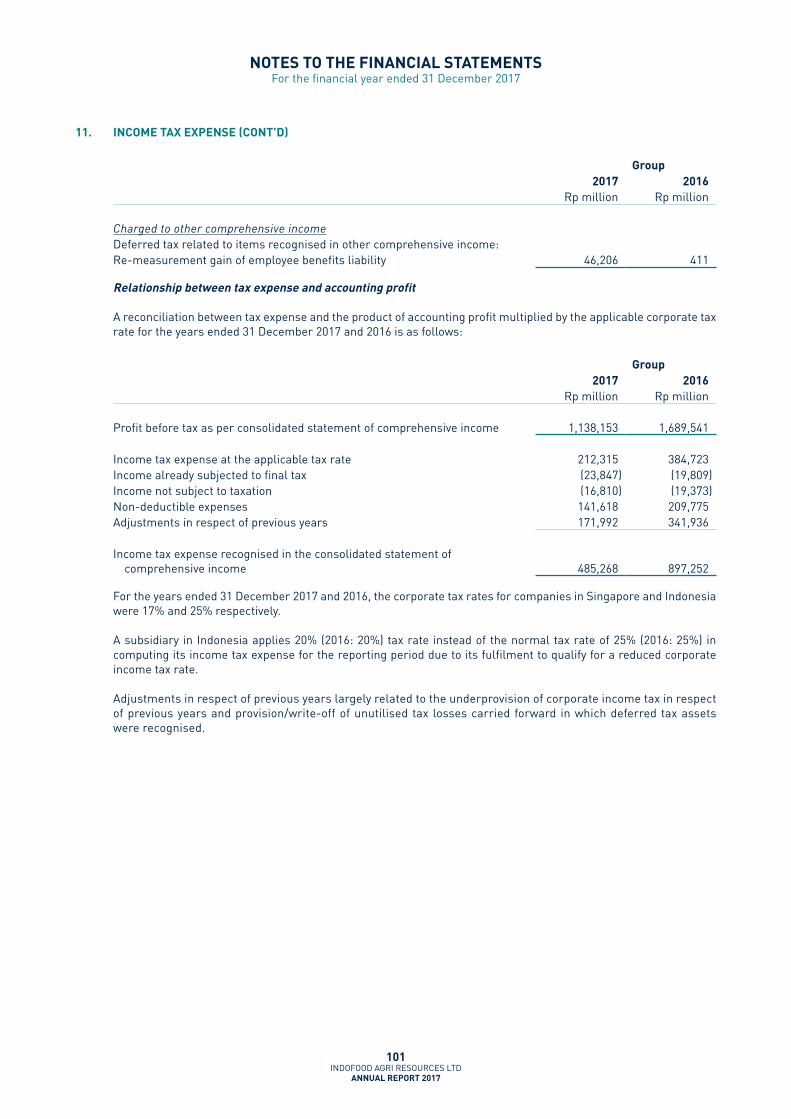
NOTES TO THE FINANCIAL STATEMENTS For the financial year ended 31 December 2017
101 INDOFOOD AGRI RESOURCES LTD
ANNUAL REPORT 2017
11. INCOME TAX EXPENSE (CONT’D)
Group2017 2016
Rp million Rp million
Charged to other comprehensive incomeDeferred tax related to items recognised in other comprehensive income:Re-measurement gain of employee benefits liability 46,206 411
Relationship between tax expense and accounting profit
A reconciliation between tax expense and the product of accounting profit multiplied by the applicable corporate tax rate for the years ended 31 December 2017 and 2016 is as follows:
Group2017 2016
Rp million Rp million
Profit before tax as per consolidated statement of comprehensive income 1,138,153 1,689,541
Income tax expense at the applicable tax rate 212,315 384,723Income already subjected to final tax (23,847) (19,809)Income not subject to taxation (16,810) (19,373)Non-deductible expenses 141,618 209,775Adjustments in respect of previous years 171,992 341,936
Income tax expense recognised in the consolidated statement of comprehensive income 485,268 897,252
For the years ended 31 December 2017 and 2016, the corporate tax rates for companies in Singapore and Indonesia were 17% and 25% respectively.
A subsidiary in Indonesia applies 20% (2016: 20%) tax rate instead of the normal tax rate of 25% (2016: 25%) in computing its income tax expense for the reporting period due to its fulfilment to qualify for a reduced corporate income tax rate.
Adjustments in respect of previous years largely related to the underprovision of corporate income tax in respect of previous years and provision/write-off of unutilised tax losses carried forward in which deferred tax assets were recognised.

NOTES TO THE FINANCIAL STATEMENTS For the financial year ended 31 December 2017
102 INDOFOOD AGRI RESOURCES LTD
ANNUAL REPORT 2017
12. EARNINGS PER SHARE
Basic earnings per share are calculated by dividing profit for the year attributable to owners of the Company by the weighted average number of ordinary shares outstanding during the year.
Diluted earnings per share amounts are calculated by dividing profit for the year attributable to owners of the Company by the weighted average number of ordinary shares outstanding during the year plus the weighted average number of ordinary shares that would be issued on the conversion of all the dilutive potential ordinary shares into ordinary shares.
The following table reflects the profit and share data used in the computation of basic and diluted earnings per share for the years ended 31 December:
GroupAs at
31 December 2017
As at31 December
2016Rp million Rp million
Profit attributable to owners of the Company 447,314 506,540
No. of shares No. of shares
Weighted average number of ordinary shares for basic earnings per share computation* 1,395,904,530 1,395,904,530
* The weighted average number of shares takes into account the weighted average effect of changes in treasury shares transactions during the year.
There were no dilutive potential ordinary shares as at 31 December 2017 and 2016.

NOTES TO THE FINANCIAL STATEMENTS For the financial year ended 31 December 2017
103 INDOFOOD AGRI RESOURCES LTD
ANNUAL REPORT 2017
13. BIOLOGICAL ASSETS
Biological assets primarily comprise timber plantations, and the unharvested agricultured produce of bearer plants. The carrying amount of the Group’s biological assets as at 31 December 2017 is Rp850.1 billion (2016: Rp789.8 billion).
Fair values of biological assets
Biological assets under Non-current assets – Timber Plantations
For timber plantations, the Group appointed an independent valuer to determine the fair value of timber annually and any resultant gains or losses arising from the changes in fair values is recognised in the profit or loss. The independent valuer adopted the income approach for the fair valuation of timber using a discounted cash flow model. The cash flow models estimate the relevant future cash flows which are expected to be generated in the future and discounted to the present value by using a discount rate.
The key assumptions applied are as follows:
(i) Timber tree is available for harvest only once about 8 years after initial planting.
(ii) Discount rate used represents the asset specific rate for the Group’s timber plantations operations which are applied in the discounted future cash flows calculation.
(iii) The projected selling price of logs over the projection period are based on actual domestic price of the produce which is extrapolated based on changes of plywood log price published by World Bank.
The movements for timber plantations are as follows:
Group As at
31 December 2017
As at 31 December
2016Rp million Rp million
TimberAt fair value
At 1 January 325,102 360,802Additions 4,481 2,436Decreases due to harvest (3,994) –Loss arising from changes in fair value of biological assets (12,284) (38,136)
At 31 December 313,305 325,102
Biological assets under Current assets – Agricultured produce of bearer plants
The Group adopted the income approach to measure the fair value of the unharvested produce of bearer plants which mainly comprise of oil palm and sugar cane. For the valuation of unharvested produce of oil palm, the Group has further applied the actual harvest data subsequent to year end to derive the fair value of unharvested produce of oil palm at year end.
The key assumptions applied on the fair value of fruit bunches are as follows:
(i) Estimated volume of subsequent harvest as of reporting date.
(ii) Selling price of fresh fruit bunches based on the market price at year end.
The key assumptions applied on the fair value of sugarcane are as follows:
(i) Cane tree is available for annual harvest for 12 months after initial planting.
(ii) Discount rate used represents the asset specific rate for the cane produce which is applied in the discounted future cash flows calculation.
(iii) The projected selling price of sugar over the projection period are based on the extrapolation of historical selling prices and the forecasted price trend from the World Bank or the minimum sugar price imposed by the Ministry of Trade of Indonesia, whichever is higher.

NOTES TO THE FINANCIAL STATEMENTS For the financial year ended 31 December 2017
104 INDOFOOD AGRI RESOURCES LTD
ANNUAL REPORT 2017
13. BIOLOGICAL ASSETS (CONT’D)
The movements for agriculture produce of bearer plants, which comprise mainly oil palm and sugar cane are as follows:
Group As at
31 December 2017
As at 31 December
2016Rp million Rp million
At fair value
At 1 January 464,722 191,994Additions 3,623,656 2,372,281Decreases due to harvest (3,598,680) (2,356,689)
489,698 207,586Gain arising from changes in fair value of biological assets 47,123 257,136
At 31 December 536,821 464,722
Key inputs to valuation on biological assets
Range of quantitative unobservable inputs used in determining the fair values of the biological assets are as follows:
Range of quantitative inputsInputs (Hierarchy) Oil palm Sugar cane Timber
Discount rate (Level 2) – 13.48% (2016:12.10%)
11.98% (2016: 8.98%)
Price of processedagricultured produce: Level 2 Rp1,716/kg
(2016:Rp1,856/kg)– –
Level 3 – Rp578,370/tonne(2016: Rp573,742/tonne)
Rp489,486 to Rp1,429,571/m3 (2016:Rp541,279 toRp1,470,100/m3)
Average production yield of agricultured produce:
Level 2 14.8 tonnes/hectare(2016: 14.6 tonnes/hectare)
– –
Level 3 – 65 tonnes/hectare (2016: 71 tonnes/hectare)
112 m3/hectare (2016: 129 m3/hectare)
Exchange rate (Level 3)
– Rp13,400 to Rp13,700/US$1(2016: Rp13,300 to Rp13,600/US$1)
Inflation rate (Level 3) – 3.50% (2016: 3.50% to 4.00%)

NOTES TO THE FINANCIAL STATEMENTS For the financial year ended 31 December 2017
105 INDOFOOD AGRI RESOURCES LTD
ANNUAL REPORT 2017
13. BIOLOGICAL ASSETS (CONT’D)
The narrative sensitivity analysis of unobservable inputs used in determining the fair values of the biological assets are as follows:
Inputs (Hierarchy) Sensitivity of the inputs to the fair value
Discount rate (Level 2) An increase / (decrease) in the discount rate will cause a (decrease) / increase in the fair value of biological assets.
Selling price of processed agriculture produce (Level 2/3)
An increase / (decrease) in the commodity prices would result in an increase / (decrease) in the fair value of biological assets.
Production yield (Level 3) An increase / (decrease) in production yields would result in an increase / (decrease) in the fair value of biological assets.
Exchange rate (Level 3) An increase / (decrease) in the exchange rate would result in an increase / (decrease) in the fair value of biological assets.
Inflation rate (Level 3) An increase / (decrease) in the inflation rate would result in a (decrease) / increase in the fair value of biological assets.
Areas of the Group’s biological assets:
Total area of timber plantations as at 31 December 2017 is 16,357 hectares (2016: 16,191 hectares) (unaudited).
Physical quantities of agriculture produces:
Agriculture produce harvestedduring the financial year
Bearer plants from which produce harvested
2017(in ’000 tonnes)
(unaudited)
2016(in ’000 tonnes)
(unaudited)
Fresh fruit bunches Oil palm plantations 3,109 2,981Sugar cane Cane plantations 639 861

NOTES TO THE FINANCIAL STATEMENTS For the financial year ended 31 December 2017
106 INDOFOOD AGRI RESOURCES LTD
ANNUAL REPORT 2017
14. PROPERTY, PLANT AND EqUIPMENT
Land userights
Bearerplants
Buildings and
improvementsPlant and
machinery
Heavy equipment,
transportation equipmentand vessels
Furniture, fixtures
and office equipment Total
Rp million Rp million Rp million Rp million Rp million Rp million Rp million
Group
Cost
At 31 December 2015 and 1 January 2016 2,543,486 13,325,225 6,803,569 5,180,000 1,858,118 368,339 30,078,737
Additions 26,395 744,163 404,398 169,169 52,318 17,026 1,413,469Additions through
business combination 54,228 536 245 – – 8 55,017
Reclassification – (77,269) (75,709) 39,083 27,378 387 (86,130)Disposals and write-off – (20,087) (7,229) (21,405) (8,345) (4,130) (61,196)
At 31 December 2016 and 1 January 2017 2,624,109 13,972,568 7,125,274 5,366,847 1,929,469 381,630 31,399,897
Additions 32,050 733,867 213,296 236,637 84,174 18,234 1,318,258Reclassification (81,432) (1) (52,338) (77,422) 72,993 4,490 (44) (133,753)Disposals and write-off – (17,985) (3,233) (3,945) (7,275) (622) (33,060)
At 31 December 2017 2,574,727 14,636,112 7,257,915 5,672,532 2,010,858 399,198 32,551,342
Accumulated depreciation
At 31 December 2015 and 1 January 2016 633,769 3,420,206 1,304,002 2,019,977 1,034,308 264,972 8,677,234
Depreciation charge for the year 71,806 411,216 336,923 340,760 160,999 43,814 1,365,518
Reclassification – (107) 2,718 (2,280) 2,586 226 3,143Disposals and write-off – (3,931) (5,683) (20,744) (8,345) (4,091) (42,794)
At 31 December 2016 and 1 January 2017 705,575 3,827,384 1,637,960 2,337,713 1,189,548 304,921 10,003,101
Depreciation charge for the year 73,011 452,880 352,421 307,493 144,113 36,765 1,366,683
Reclassification (39,637) (1) – 14,135 29,684 14,160 284 18,626Disposals and write-off – (3,249) (1,637) (3,591) (6,407) (583) (15,467)
At 31 December 2017 738,949 4,277,015 2,002,879 2,671,299 1,341,414 341,387 11,372,943
Net carrying amountAt 31 December 2016 1,918,534 10,145,184 5,487,314 3,029,134 739,921 76,709 21,396,796
At 31 December 2017 1,835,778 10,359,097 5,255,036 3,001,233 669,444 57,811 21,178,399
Vessels are presented within the class of Heavy equipment and transportation equipment due to its similar nature of use, which is for the transportation of the Group’s commodities.
(1) Reclassification to “Assets held for Sale” account in the Balance Sheet amounting to Rp41.8 billion.

NOTES TO THE FINANCIAL STATEMENTS For the financial year ended 31 December 2017
107 INDOFOOD AGRI RESOURCES LTD
ANNUAL REPORT 2017
14. PROPERTY, PLANT AND EqUIPMENT (CONT’D)
Buildings and improvements
Furniture, fixtures
and office equipment Total
Rp million Rp million Rp million
Company
Cost
At 1 January 2016 74,049 541 74,590Additions – 31 31
At 31 December 2016 and 1 January 2017 74,049 572 74,621Additions – 69 69Write off – (157) (157)
At 31 December 2017 74,049 484 74,533
Accumulated depreciationAt 1 January 2016 26,878 480 27,358Depreciation charge for the year 3,629 58 3,687
At 31 December 2016 and 1 January 2017 30,507 538 31,045Depreciation charge for the year 3,629 28 3,657Write off – (155) (155)
At 31 December 2017 34,136 411 34,547
Net carrying amountAt 31 December 2016 43,542 34 43,576
At 31 December 2017 39,913 73 39,986
Assets under construction
Property, plant and equipment of the Group as at 31 December 2017 included immature bearer plants in the course of cultivation, and building and machinery in the course of construction amounting to Rp4,067.6 billion (2016: Rp4,292.1 billion).
Bearer plants
The Group’s bearer plants comprise mainly oil palm, rubber and sugar cane plantations.
Assets held for sale
A parcel of land of PT Perusahaan Perkebunan London Sumatra Indonesia (“Lonsum”), a subsidiary, with an area approximately of 125 hectares at the Province of Banten is classified as asset held for sale as Lonsum entered into a Sale and Purchase Agreement with PT ICBP, entity under common control, on 21 December 2017. The disposal of such parcel of land is expected to be completed in 2018.
Fully depreciated assets still in use
As at 31 December 2017, the cost of the Group’s property, plant and equipment that have been fully depreciated but still in use amounting to Rp1,749.3 billion (2016: Rp1,477.7 billion), which mainly comprise of bearer plants, buildings and improvements, plant and machinery, heavy equipment and transportation equipment.

NOTES TO THE FINANCIAL STATEMENTS For the financial year ended 31 December 2017
108 INDOFOOD AGRI RESOURCES LTD
ANNUAL REPORT 2017
14. PROPERTY, PLANT AND EqUIPMENT (CONT’D)
Capitalisation of borrowing costs
During the year ended 31 December 2017, borrowing costs capitalised by certain subsidiaries to their immature bearer plants under cultivation, and building and machineries under constructions amounted to Rp109.3 billion (2016: Rp161.4 billion) based on capitalisation rates ranging from 5.30% to 9.80% (2016: 7.29% to 11.36%).
Assets under finance lease
Land use rights
The Group has land use rights with terms ranging from 8 to 40 years which will expire between 2018 to 2051. The cost incurred in obtaining the land use rights are depreciated in a manner that reflects the benefits to be derived from them. The management also believes that these land use rights can be renewed/extended upon expiration.
The Group’s bearer plants are planted and managed on the area which have obtained Rights to Cultivate (Hak Guna Usaha or the HGU), or have obtained location permits and in the process of obtaining HGU.
The net carrying amount of land use rights to be amortised at the end of the reporting period is as follows:
Group2017 2016
Rp million Rp million
Amount to be amortised– Not later than one year 61,941 69,371– Later than one year but not later than five years 239,050 277,326– Later than five years 1,534,787 1,571,837
1,835,778 1,918,534
15. GOODWILL
Group2017 2016
Rp million Rp million
At 1 January 3,253,637 3,253,637Impairment of goodwill (7,800) –
At 31 December 3,245,837 3,253,637
Goodwill arising from business combination was allocated to the following cash-generating units (“CGU”) for impairment testing:
Integrated plantation estates of Lonsum 2,909,757 2,909,757Plantation estates of PT GS 8,055 8,055Plantation estates of PT MPI 2,395 2,395Plantation estates of PT SBN 234 234Plantation estates of PT KGP 29,140 29,140Integrated plantation estates of PT CNIS 7,712 7,712Plantation estates of PT LPI 37,230 37,230Plantation estates and research facility of PT SAIN 113,936 113,936Plantation estates of PT RAP 3,388 3,388Plantation estates of PT JS 1,533 1,533Integrated plantation estates of PT MISP 34,087 34,087Plantation estates of PT IBP 519 8,319Plantation estates of PT SAL 86,996 86,996Plantation estates of PT WKL 4,750 4,750Plantation estates of PT MLI 6,105 6,105
Total 3,245,837 3,253,637

NOTES TO THE FINANCIAL STATEMENTS For the financial year ended 31 December 2017
109 INDOFOOD AGRI RESOURCES LTD
ANNUAL REPORT 2017
15. GOODWILL (CONT’D)
Goodwill was tested for impairment as at 31 October 2017 and 2016. As at 31 December 2017 and 2016, there was no significant change in the assumptions used by management that could have significant impact in determining the recoverable value of the goodwill.
No impairment loss was recognised as at 31 October 2017 and 2016 as the recoverable amounts of the goodwill were in excess of their respective carrying values, except as disclosed in the following paragraph.
As of 31 October 2017, CGU of PT IBP, which is a part of Plantations Segment, was impaired by Rp7.8 billion as the recoverable amount of the CGU, its value-in-use, was lower than the carrying amount.
The summary of impairment testing on the goodwill is disclosed in the succeeding paragraphs. Except for goodwill allocated to the plantation estates of Lonsum, PT LPI, PT IBP and PT SBN, the recoverable value of the goodwill allocated to all other plantation estates as at 31 October 2017 was determined based on fair value less costs of disposal (“FVLCD”), using discounted cash flow method. The FVLCD derived is categorised under Level 3 of the fair value hierarchy.
The recoverable value of the goodwill allocated to the plantation estates of Lonsum, PT LPI, PT IBP and PT SBN has been determined based on value-in-use calculations.
The following key assumptions had been used:
Pre-tax discount rateGrowth rate after
forecast period
Cash generating units
Carryingamount of goodwill
31October
2017
31October
2016
31October
2017
31October
2016
Recoverable amount assessment based on value-in-use
Integrated plantation estates of Lonsum 2,909,757 15.03% 13.37% 5.40% 5.15%Plantation estates of PT LPI 37,230 14.85% 11.91% 5.40% 5.15%Plantation estates of PT IBP 519 15.22% 14.09% 5.40% 5.15%Plantation estates of PT SBN 234 15.52% 14.16% 5.40% 5.15%
Sub-total 2,947,740
Recoverable amount assessment based on FvLCD
Plantation estates of PT GS 8,055 16.44% 14.93% 5.40% 5.15%Plantation estates of PT MPI 2,395 16.25% 14.63% 5.40% 5.15%Plantation estates of PT KGP 29,140 17.75% 14.83% 5.40% 5.15%Integrated plantation estates of PT CNIS 7,712 15.91% 14.44% 5.40% 5.15%Plantation estates and research facility
of PT SAIN 113,936 16.87% 15.35% 5.40% 5.15%Plantation estates of PT RAP 3,388 16.15% 14.21% 5.40% 5.15%Plantation estates of PT JS 1,533 15.71% 14.11% 5.40% 5.15%Integrated plantation estates of PT MISP 34,087 16.33% 15.14% 5.40% 5.15%Plantation estates of PT SAL 86,996 11.52% 9.70% 5.40% 5.15%Plantation estates of PT WKL 4,750 12.11% 9.27% 5.40% 5.15%Plantation estates of PT MLI 6,105 15.81% 12.76% 5.40% 5.15%
Sub-total 298,097
Grand total 3,245,837

NOTES TO THE FINANCIAL STATEMENTS For the financial year ended 31 December 2017
110 INDOFOOD AGRI RESOURCES LTD
ANNUAL REPORT 2017
15. GOODWILL (CONT’D)
The recoverable value calculation of the CGU applied a discounted cash flow model based on cash flow projections covering a period of 10 years for plantation estates in early development stage and 5 years for established plantations.
The primary selling prices used in the cashflow model are projected prices of CPO, rubber, sugar and logs. The projected prices of the CPO are based on the World Bank forecasts for the projection period. The projected prices of rubber (RSS1 and other rubber products of the Group) over the projection period are based on the extrapolation of historical selling prices and the forecasted price trend from the World Bank. The sugar prices used in the projection are based on the extrapolation of historical selling prices and the forecasted price trend from the World Bank or the minimum sugar price imposed by the Ministry of Trade of Indonesia, whichever is higher. The projected prices of logs are based on the actual domestic price of the produce which are extrapolated based on changes of plywood log price published by the World Bank.
The cash flows beyond the projected periods are extrapolated using the estimated terminal growth rate indicated above. The terminal growth rate used does not exceed the long-term average growth rate of the industry in countries where the entities operate. The discount rate applied to the cash flow projections is derived from the weighted average cost of capital of the respective CGUs.
Changes to the assumptions used by the management to determine the recoverable value, in particular the discount and terminal growth rate, can have significant impact on the results of the assessment. Management is of the opinion that no reasonably possible change in any of the key assumptions stated above would cause the carrying amount of the goodwill for each of the CGU to materially exceed their respective recoverable value, except for the following CGUs:
Impairment loss
CGU
Reasonably possible changes on key assumptions that
would cause the CGU starts to be impaired
Further change in key assumptions
Further Impairment loss to be recognised for the assigned change of key
assumptions
Plantation estate of KGP CPO price: 2.9% lower 0.1% Rp 32.1 billion
Management believes that there were no indicators of impairment existed on the above-mentioned goodwill for the year ended 31 December 2017 that required the Group to perform impairment tests of goodwill other than the annual tests.
16. CLAIMS FOR TAX REFUND
Claims for tax refund represent (a) advance tax payment made by each entity within the Group which is creditable against their respective corporate income tax payable; and (b) tax assessments being appealed to the taxation authorities.

NOTES TO THE FINANCIAL STATEMENTS For the financial year ended 31 December 2017
111 INDOFOOD AGRI RESOURCES LTD
ANNUAL REPORT 2017
17. DEFERRED TAX
Deferred tax as at 31 December relates to the following:
Group2017 2016
Rp million Rp million
Temporary tax differences:
Property, plant and equipment (992,693) (997,443)Biological assets (178,673) (145,073)Withholding tax on undistributed profit of foreign subsidiaries (15,051) (15,819)Allowance for impairment and amortised costs adjustments of
plasma receivables 103,070 97,372Allowance for employees benefit expenses 29,730 40,862Allowance for decline in market value and obsolescence of inventories 86,962 27,326Allowance for unrecoverable advance 14,677 4,939Employee benefits liabilities 579,201 486,457Deferred inter-company profits 76,886 68,887Tax losses carry forward 857,564 823,883Others 476 669
Total 562,149 392,060
Classified as:
Deferred tax assets 1,346,976 1,240,194
Deferred tax liabilities (784,827) (848,134)
For purposes of presentation in the consolidated balance sheet, the asset or liability classification of the deferred tax effect of each of the above temporary differences is determined based on the net deferred tax position (net assets or net liabilities) on a per entity basis.
Deferred tax assets and liabilities cover the future tax consequences attributable to differences between the financial and tax reporting bases of assets and liabilities and the benefits of tax loss carry forwards.

NOTES TO THE FINANCIAL STATEMENTS For the financial year ended 31 December 2017
112 INDOFOOD AGRI RESOURCES LTD
ANNUAL REPORT 2017
17. DEFERRED TAX (CONT’D)
Deferred tax income or expense recognised in consolidated statement of comprehensive income
Group2017 2016
Rp million Rp million
Deferred income tax movements:
Property, plant and equipment (4,750) (11,070)Biological assets 33,600 113,293Allowance for impairment and amortised costs adjustments of
plasma receivables (5,698) (1,774)Write-back for allowance of decline in market value and
obsolescence of inventories (59,636) (16,253)Employee benefits liabilities (46,539) (57,286)Deferred inter-company profits (7,999) (27,159)Provision for employee benefits expense 11,132 3,196Allowance for unrecoverable advances (9,738) (4,939)Tax losses carry forward (33,681) 206,817Withholding tax on distributable profit of foreign subsidiaries (768) 8,047Others 193 129
Net deferred tax benefit reported in the consolidated statement of comprehensive income (Note 11) (123,884) 213,001
Unrecognised tax losses
At the end of the reporting period, the Group has total tax losses amounting to Rp4,503.3 billion (2016: Rp4,502.0 billion) that are available for offset against future taxable profits for up to five years from the date the losses were incurred as the tax losses in Indonesia generally expire after 5 years. Deferred tax benefits of Rp267.4 billion (2016: Rp300.8 billion) attributable to Rp1,069.7 billion (2016: Rp1,203.2 billion) of these tax losses were not recognised as the recoverability was considered not probable.
Unrecognised temporary differences relating to investments in subsidiaries
The Group has not recognised a deferred tax liability of Rp610.5 billion (2016: Rp597.2 billion) as at 31 December 2017 in respect of undistributed profits of subsidiaries as the distribution is controlled and there is currently no intention for the profits to be remitted to Singapore.
Unrecognised temporary differences relating to unremitted foreign-sourced interest income
The Group has not recognised deferred tax liability of Rp109.5 billion (2016: Rp93.8 billion) as at 31 December 2017 in respect of unremitted foreign-sourced interest income as the Group has control over the remittance and there is currently no intention for the income to be remitted to Singapore. The potential deferred tax liabilities are before taking into account the foreign tax credit claim on the Indonesia withholding tax suffered by the Company on the interest income (if applicable).

NOTES TO THE FINANCIAL STATEMENTS For the financial year ended 31 December 2017
113 INDOFOOD AGRI RESOURCES LTD
ANNUAL REPORT 2017
18. INvESTMENT IN SUBSIDIARY COMPANIES
Company2017 2016
Rp million Rp million
Shares, at cost 10,533,516 10,533,516
The Group held less than 50% effective shareholdings in certain subsidiaries but owned, directly and indirectly, more than half of the voting power in these subsidiaries.
(a) Composition of the Group
The Group has the following investment in subsidiaries:
Name of subsidiariesCountry of
incorporationEffective percentage
of equity held Principal activities %
2017 2016
Name (Abbreviated name)
Held by the Company
PT Salim Ivomas Pratama Tbk (PT SIMP) 2
Indonesia 73.46 73.46 Ownership of oil palm plantations, mills and production of cooking oil, margarine, shortening, and other related products
IFAR Brazil Pte. Ltd. 1 Singapore 100.00 100.00 Investment holding
IndoAgri Brazil Participações Ltda * Brazil 100.00 100.00 Investment holding
Held by PT Salim Ivomas Pratama Tbk
IndoInternational Green Energy Resources Pte. Ltd. (IGER) 1
Singapore 44.08 44.08 Investment holding
PT Indoagri Inti Plantation (PT IIP) 2
Indonesia 72.73 72.73 Investment holding, management services and transportation
Silveron Investments Limited (SIL) *
Mauritius 73.46 73.46 Investment holding
PT Kebun Mandiri Sejahtera (PT KMS) 3
Indonesia 71.89 68.64 Ownership of rubber and oil palm plantations
PT Manggala Batama Perdana (PT MBP) *
Indonesia 73.46 73.46 Non-operating
PT Sarana Inti Pratama (PT SAIN) 3
Indonesia 73.45 73.45 Investment, research, management and technical services, oil palm seed breeding, and ownership of oil palm plantations

NOTES TO THE FINANCIAL STATEMENTS For the financial year ended 31 December 2017
114 INDOFOOD AGRI RESOURCES LTD
ANNUAL REPORT 2017
18. INvESTMENT IN SUBSIDIARY COMPANIES (CONT’D)
(a) Composition of the Group (cont’d)
Name of subsidiariesCountry of
incorporationEffective percentage
of equity held Principal activities %
2017 2016
Held by PT Salim Ivomas Pratama Tbk (cont’d)
PT Mentari Subur Abadi (PT MSA) 3
Indonesia 39.65 21.87 Investment and ownership of oil palm plantations
PT Mega Citra Perdana (PT MCP) 4
Indonesia 21.83 21.83 Investment holding
PT Swadaya Bhakti Negaramas (PT SBN) 3
Indonesia 42.67 21.91 Ownership of oil palm plantations
PT Lajuperdana Indah (PT LPI) 2
Indonesia 22.44 22.44 Ownership of sugar cane plantations and sugar mills/refineries
PT Mitra Inti Sejati Plantation (PT MISP) 3
Indonesia 73.46 73.46 Ownership of oil palm plantations and mill
PT PP London Sumatra Indonesia Tbk (Lonsum) 2
Indonesia 43.72 43.72 Business of breeding, planting, milling and selling of oil palm products, rubber and other crops
PT Cakra Alam Makmur (PT CAM) 3
Indonesia 73.46 73.46 Ownership of bulking facilities
PT Hijaupertiwi Indah Plantations (PT HPIP) 3
Indonesia 73.46 73.46 Ownership of oil palm plantations
PT Cangkul Bumisubur (PT CBS) 3
Indonesia 73.46 73.46 Ownership of oil palm plantations
PT Samudera Sejahtera Pratama (PT SSP) 3
Indonesia 73.46 73.46 Transportation service
PT Kebun Ganda Prima (PT KGP) 3
Indonesia 73.46 73.46 Ownership of oil palm plantations
PT Riau Agrotama Plantation (PT RAP) 3
Indonesia 73.46 73.46 Ownership of oil palm plantations and mill
PT Citra Kalbar Sarana (PT CKS) 3
Indonesia 73.46 73.46 Ownership of oil palm plantations
PT Jake Sarana (PT JS) 3
Indonesia 73.46 73.46 Ownership of oil palm plantations
PT Pelangi Inti Pertiwi (PT PIP) 3
Indonesia 73.46 73.46 Ownership of oil palm plantations

NOTES TO THE FINANCIAL STATEMENTS For the financial year ended 31 December 2017
115 INDOFOOD AGRI RESOURCES LTD
ANNUAL REPORT 2017
18. INvESTMENT IN SUBSIDIARY COMPANIES (CONT’D)
(a) Composition of the Group (cont’d)
Name of subsidiariesCountry of
incorporationEffective percentage
of equity held Principal activities %
2017 2016
Held by PT Salim Ivomas Pratama Tbk (cont’d)
PT Mentari Pertiwi Makmur (PT MPM) 7
Indonesia 58.53 58.53 Investment holding
PT Citranusa Intisawit (PT CNIS) 3
Indonesia 73.46 73.46 Ownership of oil palm plantations and mill
Held by IndoInternational Green Energy Resources Pte. Ltd.
PT Mentari Subur Abadi (PT MSA) 3
Indonesia 4.42 22.20 Investment and ownership of oil palm plantations and mill
PT Mega Citra Perdana (PT MCP) 4
Indonesia 22.25 22.25 Investment holding
PT Swadaya Bhakti Negaramas (PT SBN) 3
Indonesia 1.40 22.17 Ownership of oil palm plantations
PT Lajuperdana Indah (PT LPI) 2
Indonesia 22.72 22.72 Ownership of sugar cane plantations and sugar mills/refineries
Held by PT Indoagri Inti Plantation
PT Gunung Mas Raya (PT GMR) 2
Indonesia 72.00 72.00 Ownership of oil palm plantations and mill
PT Indriplant (PT IP) 2
Indonesia 72.00 72.00 Ownership of oil palm plantations and mill
PT Serikat Putra (PT SP) 2
Indonesia 72.00 72.00 Ownership of oil palm plantations and mill
PT Cibaliung Tunggal Plantations (PT CTP) 2
Indonesia 72.00 72.00 Ownership of oil palm plantations
Held by PT Serikat Putra
PT Intimegah Bestari Pertiwi (PT IBP) 2 Indonesia 72.01 72.01
Ownership of oil palm plantations
PT Kencana Subur Sejahtera (PT KSS) 8 Indonesia 72.01 72.01
Macronutrients mix fertilizer industry
PT Pratama Citra Gemilang (PT PCG) 8 Indonesia 72.01 72.01 Prefabrication industry

NOTES TO THE FINANCIAL STATEMENTS For the financial year ended 31 December 2017
116 INDOFOOD AGRI RESOURCES LTD
ANNUAL REPORT 2017
18. INvESTMENT IN SUBSIDIARY COMPANIES (CONT’D)
(a) Composition of the Group (cont’d)
Name of subsidiariesCountry of
incorporationEffective percentage
of equity held Principal activities %
2017 2016
Held by Silveron Investments Limited
Asian Synergies Limited (ASL) 3
British Virgin Islands 73.46 73.46 Investment holding
Held by PT Mentari Subur Abadi
PT Agro Subur Permai (PT ASP) 3 Indonesia 44.07 44.07
Ownership of oil palm plantations
Held by PT Mega Citra Perdana
PT Gunta Samba (PT GS) 4 Indonesia 44.07 44.07
Ownership of oil palm plantations
PT Multi Pacific International (PT MPI) 4 Indonesia 44.08 44.08
Ownership of oil palm plantations
Held by PT PP London Sumatra Indonesia Tbk
PT Multi Agro Kencana Prima (PT MAKP) 5 Indonesia 43.71 43.71 Rubber mill and trading
Lonsum Singapore Pte. Ltd. (LSP) 6 Singapore 43.72 43.72 Trading and marketing
PT Tani Musi Persada (PT TMP) 5 Indonesia 43.68 43.68
Ownership of oil palm plantations
PT Sumatra Agri Sejahtera (PT SAS) 5 Indonesia 43.71 43.71
Ownership of oil palm plantations
PT Tani Andalas Sejahtera (PT TAS) 5 Indonesia 39.35 39.35
Ownership of oil palm plantations
Agri Investment Pte. Ltd. (AIPL) 6 Singapore 43.72 43.72 Investment holding
PT Wushan Hijau Lestari (PT WHL) 3 Indonesia 28.41 28.41
Agriculture, forestry, fishing and trading
Held by PT Mentari Pertiwi Makmur
PT Sumalindo Alam Lestari (PT SAL) 7 Indonesia 58.53 58.53
Development of industrial timber plantations

NOTES TO THE FINANCIAL STATEMENTS For the financial year ended 31 December 2017
117 INDOFOOD AGRI RESOURCES LTD
ANNUAL REPORT 2017
18. INvESTMENT IN SUBSIDIARY COMPANIES (CONT’D)
(a) Composition of the Group (cont’d)
Name of subsidiariesCountry of
incorporationEffective percentage
of equity held Principal activities %
2017 2016
Held by PT Sumalindo Alam Lestari and PT Mentari Pertiwi Makmur
PT Wana Kaltim Lestari (PT WKL) 7
Indonesia 58.53 58.53 Development of industrial timber plantations
Held by Lonsum Singapore Pte. Ltd.
Sumatra Bioscience Pte. Ltd. (SBPL) *
Singapore 43.72 43.72 Non-operating
Held by PT Lajuperdana Indah
PT Madusari Lampung Indah (PT MLI) 8
Indonesia 45.16 45.16 Ownership of sugar cane plantations
Held by PT Wushan Hijau Lestari
PT Perusahaan Perkebunan, Perindustrian dan Perdagangan Umum Pasir Luhur (PT PL) 3
Indonesia 28.41 28.41 Trading, agricultural,industrial and agency/representative
* Not required to be audited in the country of incorporation
Audited by:1 Ernst & Young LLP, Singapore2 Purwantono, Sungkoro & Surja, Indonesia (member firm of Ernst & Young Global)3 Kanaka Puradiredja, Suhartono, Indonesia4 Paul Hadiwinata, Hidajat, Arsono, Ade Fatma & Rekan, Indonesia (member firm of Grant Thornton International)5 Aria Kanaka, Indonesia (member firm of Parker Randall)6 Eisner Amper PAC, Singapore7 Anwar, Sugiharto & Rekan, Indonesia8 Jimmy Budhi & Rekan, Indonesia
(b) Interest in a subsidiary with material non-controlling interest (NCI)
The Group has the following subsidiary that has NCI that are material to the Group.
Name of subsidiaryPrincipal place
of business
Proportion of ownership
interest held bynon-controlling
interest
Profitallocated to
NCI during thereporting
period
AccumulatedNCI at the end
of reportingperiod
Dividendspaid to NCI
% Rp million Rp million Rp million
31 December 2017:PT SIMP Indonesia 26.54 87,686 4,027,278 113,276
31 December 2016:PT SIMP Indonesia 26.54 96,417 3,799,355 105,029

NOTES TO THE FINANCIAL STATEMENTS For the financial year ended 31 December 2017
118 INDOFOOD AGRI RESOURCES LTD
ANNUAL REPORT 2017
18. INvESTMENT IN SUBSIDIARY COMPANIES (CONT’D)
(c) Summarised financial information about a subsidiary with material NCI
Summarised financial information including goodwill on acquisition and consolidation adjustments but before intercompany eliminations of the subsidiary with material non-controlling interests is as follows:
PT SIMP(1)
As at31 December
2017
As at31 December
2016Rp million Rp million
Summarised balance sheet
Current
Assets 6,703,938 6,214,972Liabilities (6,282,923) (4,646,657)
Net current assets 421,015 1,568,315
Non-current
Assets 28,191,303 28,014,462Liabilities (9,313,711) (10,686,337)
Net non-current assets 18,877,592 17,328,125
Net assets 19,298,607 18,896,440
Summarised statement of comprehensive income
Revenue 15,826,648 14,530,938Profit before income tax 1,000,036 1,684,557Income tax expense (464,927) (872,190)
Profit after tax 535,109 812,367Other comprehensive loss (138,057) (41,582)
Total comprehensive income 397,052 770,785
Other summarised information
Net cash flows from operations 1,846,364 1,992,546
(1) The financial information of PT SIMP is based on the IFRS consolidated financial statements of PT SIMP and its subsidiaries. The list of subsidiaries held under PT SIMP is disclosed in Note 18 (a).
NOTES TO THE FINANCIAL STATEMENTS For the financial year ended 31 December 2017
119 INDOFOOD AGRI RESOURCES LTD
ANNUAL REPORT 2017
19. INvESTMENT IN ASSOCIATE COMPANIES
The Group’s investments in associate companies are summarised below:
Group2017 2016
Rp million Rp million
Associate companies which are strategic to the Group activitiesFP Natural Resources Limited 503,335 509,219Asian Assets Management Pte Ltd 743,951 487,244PT Prima Sarana Mustika 6,050 5,784PT Indoagri Daitocacao 105,438 –
1,358,774 1,002,247
Group2017 2016
Rp million Rp million
Cost of investment, at cost 1,394,853 1,045,503Share of results and other comprehensive loss of associate companies (108,037) (98,146)Foreign currency translation 59,037 54,890Gain from deemed disposal 12,921 –
Carrying value of investment in associate companies 1,358,774 1,002,247
Name of associateCountry of
incorporationEffective percentage of
equity held Principal activities%
2017 2016
Held by the Company
FP Natural Resources Limited (FPNRL) (i)
British Virgin Islands
30.00 30.00 Investment holdings
Held by PT PP London Sumatra Indonesia Tbk (Lonsum)
Asian Assets Management Pte. Ltd.(AAM) (ii)
Singapore 10.92* 21.85 Investment holdings
Held by PT Salim Ivomas Pratama Tbk (PT SIMP)
PT Prima Sarana Mustika (PT PSM) (iii)
Indonesia 29.38 29.38 Construction services, rental of heavy equipment and trading of agriculture equipment
PT Indoagri Daitocacao (Daitocacao) (iv)
Indonesia 36.00 – Manufacture and marketing of chocolate for industrial use.
* The Group held less than 20% effective shareholdings in certain associates but owned, directly and indirectly, more than 20% shareholdings in these associates.
(i) Audited by Ernst & Young (HK)(ii) Audited by Pinebridge LLP, Singapore(iii) Audited by Paul Hadiwinata, Hidajat, Arsono, Ade Fatma & Rekan, Indonesia (member firm of Grant Thornton International)(iv) Audited by KAP Satrio Bing Eny & Rekan, Indonesia

NOTES TO THE FINANCIAL STATEMENTS For the financial year ended 31 December 2017
120 INDOFOOD AGRI RESOURCES LTD
ANNUAL REPORT 2017
19. INvESTMENT IN ASSOCIATE COMPANIES (CONT’D)
FP Natural Resources Limited (“FPNRL”)
FPNRL is incorporated in British Virgin Islands in July 2013. It is a 30%:70% joint venture between the Company and its ultimate holding company, First Pacific Company Limited. FPNRL is an investment holding company which in turn owns 62.9% (2016: 59.7%) in Roxas Holdings Inc (“RHI”) and 100% (2016:100%) interest in First Coconut Manufacturing Inc.(“FCMI”) respectively. RHI is engaged in processing of sugar cane for the production and marketing of sugar and ethanol in the Philippines.
Asian Assets Management Pte. Ltd.(“AAM”)
In June 2015, Lonsum and a subsidiary of PT ISM, PT ICBP jointly invested 100% equity interest in AAM, whereby each entity subscribed for 56,700,000 of new shares representing 50% equity interest in AAM for S$56.7 million (approximately Rp519 billion). AAM became a 50% associate company of Lonsum. AAM is a private limited company incorporated and domiciled in Singapore, which in turn owns 100% equity interest in PT Aston Inti Makmur, an Indonesian-incorporated company engages in the property business and operates an office building.
In March 2016, AAM reduced its capital by S$6.6 million (equivalent to Rp61.9 billion) and returned the funds to Lonsum and PT ICBP in proportion to their 50%:50% shareholdings in AAM.
During this financial year, Lonsum, PT ICBP and its parent company, PT ISM made additional capital contributions in AAM. Post this capital contributions, AAM is now owned by Lonsum, PT ICBP and PT ISM in the proportion of 24.98%, 50.00% and 25.02% respectively. The capital contributions from PT ICBP and PT ISM dilute the shareholding owned by Lonsum. As a result of the dilution effect, Lonsum recorded a gain on deemed disposal of AAM of Rp12.9 billion in equity. The carrying value of the investment in AAM as at 31 December 2017 is Rp744.0 billion (2016: Rp487.2 billion).
PT Prima Sarana Mustika (“PT PSM”)
In January 2015, PT Wahana Inti Selaras (“PT WIS”), a related party, and PT SIMP established PT PSM with a total issued and fully paid share capital of Rp15 billion. PT SIMP’s capital contribution was Rp6.0 billion representing 40% interest in PT PSM. PT PSM is engaged primarily in the development of plantations’ infrastructures, land clearing, rental services of heavy equipment, transportation and trading of agricultural equipment.
PT Indoagri Daitocacao (“Daitocacao”)
On 7 February 2017, SIMP and Daitocacao Co. Ltd. in Japan entered into an Agreement, to establish a 49%:51% entity, Daitocacao under the laws of Indonesia. On 5 April 2017, SIMP contributed its first capital injection of Rp104.5 billion. Daitocacao is still in its development stage at year end.

NOTES TO THE FINANCIAL STATEMENTS For the financial year ended 31 December 2017
121 INDOFOOD AGRI RESOURCES LTD
ANNUAL REPORT 2017
19. INvESTMENT IN ASSOCIATE COMPANIES (CONT’D)
The summarised financial information in respect of FPNRL, AAM and Daitocacao, based on its FRS financial statements and a reconciliation with the carrying amount of the investment in the consolidated financial statements are as follows:
Summarised balance sheet
FPNRL AAM Daitocacao2017 2016 2017 2016 2017
Rp million Rp million Rp million Rp million Rp million
Current assets 1,863,162 1,769,011 140,702 92,153 98,796Non-current assets 5,135,098 5,094,206 3,228,653 954,899 119,016
Total assets 6,998,260 6,863,217 3,369,355 1,047,052 217,812
Current liabilities 2,670,812 2,111,736 5,810 6,571 2,656Non-current liabilities 1,655,417 2,048,520 384,929 65,993 –
Total liabilities 4,326,229 4,160,256 390,739 72,564 2,656
Net assets 2,672,031 2,702,961 2,978,616 974,488 215,156
Proportion of the Group’s ownership 30.00% 30.00% 24.98% 50.00% 49.00%
Group’s share of net assets 801,609 810,888 731,030 487,244 105,426Foreign currency translation (298,274) (301,669) – – 12Deemed disposal gain – – 12,921 – –
Carrying amount of the investment 503,335 509,219 743,951 487,244 105,438
Summarised statement of comprehensive income
FPNRL AAM Daitocacao2017 2016 2017 2016 2017
Rp million Rp million Rp million Rp million Rp million
Revenue 3,392,316 3,370,093 – – –(Loss)/profit after tax (43,741) 573 (3,873) (11,590) 1,868Other comprehensive loss
for the year (3,310) (119,618) – – –
The aggregate information of the Group’s cost of investments in associate companies that are not individually material are as follows:
Group2017 2016
Rp million Rp million
Share of profit/(loss) after tax and other comprehensive loss 50 (216)

NOTES TO THE FINANCIAL STATEMENTS For the financial year ended 31 December 2017
122 INDOFOOD AGRI RESOURCES LTD
ANNUAL REPORT 2017
20. INvESTMENT IN A jOINT vENTURE
The Group has 50% (2016: 50%) interest in a jointly-controlled entity, Companhia Mineira de Açúcar e Álcool Participações (“CMAA”) that is held through the Company’s wholly-owned subsidiaries, IFAR Brazil Pte Ltd and IndoAgri Brazil Participações Ltda.
The joint venture is incorporated in Brazil and is a strategic venture. The Group jointly controls the venture with the other partner under the contractual agreement and requires unanimous consent for all major decisions over the relevant activities.
The joint venture company is engaged in the cultivation and processing of sugar cane for the production and marketing of sugar and ethanol, as well as co-generation of electric power from sugar cane bagasse in Brazil.
On acquisition of CMAA in June 2013, the Group completed a Purchase Price Allocation (“PPA”) exercise in 2014 to identify any intangible assets and/or goodwill from the acquisition. As at 31 December 2017, goodwill amounting to Rp298.3 billion has been determined and included in the carrying amount of the investment.
The external auditor of CMAA is KPMG Auditores Independentes.
Group2017 2016
Rp million Rp million
Cost of investment in a joint venture (including acquisition related costs) 878,614 878,614Share of results and other comprehensive loss of a joint venture 63,615 (65,109)Foreign currency translation (67,318) (61,655)
Carrying value of investment in a joint venture 874,911 751,850
Summarised financial information in respect of CMAA based on its FRS financial statements, and reconciliation with the carrying amount of the investment in the consolidated financial statements are as follows:
Summarised balance sheet
Group2017 2016
Rp million Rp million
Cash and cash equivalents 448,969 124,343Other current assets 1,851,743 1,222,495
Current assets 2,300,712 1,346,838Non-current assets 2,253,364 2,444,326
Total assets 4,554,076 3,791,164
Current liabilities 1,921,090 2,104,562Total non-current liabilities 1,793,397 1,084,013
Total liabilities 3,714,487 3,188,575
Net assets 839,589 602,589
Proportion of the Group’s ownership 50.0% 50.0%
Group’s share of net assets 419,794 301,295 Acquisition costs capitalised 52,405 52,405 Goodwill on acquisition 298,336 298,336 Foreign currency translation 104,376 99,814
Carrying value of the investment 874,911 751,850

NOTES TO THE FINANCIAL STATEMENTS For the financial year ended 31 December 2017
123 INDOFOOD AGRI RESOURCES LTD
ANNUAL REPORT 2017
20. INvESTMENT IN A jOINT vENTURE (CONT’D)
Summarised statement of comprehensive income
Group2017 2016
Rp million Rp million
Revenue 2,672,835 2,352,246Depreciation and amortisation (312,187) (318,124)Interest income 756,755 456,818Interest expense (1,044,959) (1,004,260)Other operating expenses (1,724,444) (1,591,499)
Profit/(Loss) before tax 348,000 (104,819)Income tax expense/refund (56,035) 29,360
Profit/(Loss) after tax 291,965 (75,459)Other comprehensive income/(loss) 35,069 (15,619)
Total comprehensive income/(loss) 327,034 (91,078)
21. OTHER NON-CURRENT ASSETS
Group CompanyNote 2017 2016 2017 2016
Rp million Rp million Rp million Rp million
Non-current:
Non-financial assetsAdvances 169,239 308,133 – –Prepayments 9,796 10,829 – –Others 206,081 106,955 – –
Total advances and prepayments 385,116 425,917 – –
Financial assetsAmount due from a subsidiary – – 730,000 730,000Loans to employees 16,070 26,361 – –Available-for-sale financial asset 33(a) 19,439 60,027 – –Plasma receivables 31(a) 1,158,659 1,064,600 – –Deposits 15,319 23,674 10 9
Total other non-current receivables 1,209,487 1,174,662 730,010 730,009
Total other non-current assets 1,594,603 1,600,579 730,010 730,009
NOTES TO THE FINANCIAL STATEMENTS For the financial year ended 31 December 2017
124 INDOFOOD AGRI RESOURCES LTD
ANNUAL REPORT 2017
21. OTHER NON-CURRENT ASSETS (CONT’D)
Amount due from a subsidiary
Amount due from a subsidiary is non-trade related, unsecured, bears interest at long-term commercial lending rates, repayable in November 2020 and is to be settled in cash.
Available-for-sale financial asset
Available-for-sale financial asset mainly relates to the unquoted equity investment in Heliae Technology Holdings, Inc. (“Heliae”) owned by Agri Investment Pte. Ltd. (“AIPL”), a subsidiary of Lonsum. Heliae is a private entity engaged in technology and production solutions for the algae industry.
The fair value of available-for-sale financial asset is determined by using a discounted cash flow model. During the financial year, the Group recognised the Impairment loss of Rp41.0 billion in profit or loss as the fair value was below its carrying amount in the book, indicating that the cost of the investment may not be recovered.
Advances and deposits
Advances and deposits mainly relate to utility and rental deposits, advance payments for land and payments made to suppliers and contractors in relation to the purchases of capital equipment and services.
Loans to employees
The Group provides non-interest bearing loans to officers and employees subject to certain terms and criteria. Such loans, which are being collected through monthly salary deductions over five years, from the date of the loan, are carried at amortised cost using effective interest method, with discount rate of 5.98% (2016: 7.58%) per annum.
22. INvENTORIES
GroupNote 2017 2016
Rp million Rp million
Balance sheet:
Raw materials 828,065 694,957Finished goods 941,141 1,164,560Spare parts and factory supplies 435,343 411,232
Total inventories at the lower of cost and net realisable value 2,204,549 2,270,749
Consolidated statement of comprehensive income:
Inventories recognised as an expense in cost of sales, net 5 1,578,029 786,291
Inclusive of the following charges:– Allowance for decline in market value and obsolescence
of inventories 8,732 70,115– Reversal of decline in market value and obsolescence
of inventories (3,569) (4,944)
5 5,163 65,171

NOTES TO THE FINANCIAL STATEMENTS For the financial year ended 31 December 2017
125 INDOFOOD AGRI RESOURCES LTD
ANNUAL REPORT 2017
23. RECEIvABLES
Group CompanyNote 2017 2016 2017 2016
Rp million Rp million Rp million Rp million
Current:
Financial assetsTrade receivables
Third parties 502,589 506,916 – –Related parties 571,323 505,154 – –Provision for impairment
of trade receivables (53) (53) – –
Other receivablesPlasma receivables 31(a) 17,486 14,412 – –Loans to employees 7,481 8,637 – –Subsidiary companies – – 73,965 75,712Related parties 2,110 1,568 – –Tax recoverable – 12,516 – –Others 99,468 73,624 2,207 2,430
Total trade and other receivables 1,200,404 1,122,774 76,172 78,142
Non-financial assetsAdvances and prepayments
Advances to suppliers 169,060 220,522 – –Prepayments 19,270 19,693 228 197
Total advances and prepayments 188,330 240,215 228 197
Total receivables 1,388,734 1,362,989 76,400 78,339
Trade receivables are non-interest bearing and are generally on 1 to 35 days’ terms. All trade receivables will be settled in cash. They are recognised at their original invoice amounts which represent their fair values on initial recognition. The Group’s trade receivables relate to a large number of diversified customers, there is no concentration of credit risk.
Other receivables from related parties and receivables from subsidiary companies are unsecured, interest-free and are generally settled within the next 12 months in cash.

NOTES TO THE FINANCIAL STATEMENTS For the financial year ended 31 December 2017
126 INDOFOOD AGRI RESOURCES LTD
ANNUAL REPORT 2017
23. RECEIvABLES (CONT’D)
The Group and Company’s receivables denominated in foreign currencies are as follows:
Group Company2017 2016 2017 2016
Rp million Rp million Rp million Rp million
US Dollars 95,650 57,741 67,153 65,359Others 457 715 1,339 4,560
Receivables that are past due but not impaired
The Group has trade receivables amounting to Rp417.4 billion (2016: Rp338.2 billion) that are past due at the end of the reporting period but not impaired. These receivables are unsecured and the analysis of their aging at the end of the reporting period is as follows:
Group2017 2016
Rp million Rp million
Overdue but not impaired:1 - 30 days 283,725 272,77931 - 60 days 69,447 17,24361 - 90 days 31,837 13,111More than 90 days 32,387 35,038
417,396 338,171
Advances to suppliers
Advances to suppliers represent advance payments to suppliers and contractors in relation to the following purchases:
Group2017 2016
Rp million Rp million
Raw materials 65,681 173,108Factory supplies, spare parts and others 103,379 47,414
169,060 220,522
Advances to suppliers are unsecured, interest-free and obligations of the suppliers are expected to be fulfilled within the next 12 months.

NOTES TO THE FINANCIAL STATEMENTS For the financial year ended 31 December 2017
127 INDOFOOD AGRI RESOURCES LTD
ANNUAL REPORT 2017
24. CASH AND CASH EqUIvALENTS
Group Company2017 2016 2017 2016
Rp million Rp million Rp million Rp million
Cash at bank and in hand 874,904 756,456 81,481 4,927Short term deposits 2,054,770 1,648,382 582,786 527,969
Cash and cash equivalents 2,929,674 2,404,838 664,267 532,896
Cash and cash equivalents denominated in foreign currencies are as follows:
Group Company2017 2016 2017 2016
Rp million Rp million Rp million Rp million
US Dollars 722,576 414,941 228,717 1,432Singapore Dollars 9,223 2,723 8,377 2,078Others 3,789 2,903 – –
Cash at bank earns interest at floating rates based on daily bank deposit rates. Short-term deposits are made for varying periods ranging from one day to three months, depending on the immediate cash requirements of the Group, and earn interest at the respective short-term deposit rates.
Short term deposits denominated in US dollars and Rupiah earned interest at annual rates between 1.00% to 2.10% (2016: 1.25% to 1.50%) and 4.00% to 8.75% (2016: 4.75% to 9.60%), respectively.
NOTES TO THE FINANCIAL STATEMENTS For the financial year ended 31 December 2017
128 INDOFOOD AGRI RESOURCES LTD
ANNUAL REPORT 2017
25. PAYABLES
Group Company2017 2016 2017 2016
Rp million Rp million Rp million Rp million
CurrentFinancial liabilities
Trade payablesThird parties 587,172 570,760 – –Related parties 34,377 26,218 – –
Other payables and accrualsThird parties 356,121 284,292 315 451Due to a parent company 66,692 39,048 – –Related parties 113,605 7,970 86,707 –Accrued operating expenses 288,911 339,019 17,717 14,392
Total trade and other payables and accruals 1,446,878 1,267,307 104,739 14,843Short-term employee benefits liabilities 184,136 232,409 – –
Total 1,631,014 1,499,716 104,739 14,843
Non-financial liabilitiesAdvances from customers 143,062 426,469 – –Taxes payable 51,641 27,203 – –
Total advances and taxes payable 194,703 453,672 – –
Total payables 1,825,717 1,953,388 104,739 14,843
Trade payables are normally settled on 1 to 60 days credit payment terms. These amounts are unsecured and will be settled in cash. The carrying amounts of the Group’s trade payables, other payables and accruals approximate their fair values.
Payables to a parent company and other payables to related parties are unsecured, repayable on demand and non-interest bearing. These amounts will be settled in cash.
Advances from customers represent advance payments relating to future sales of finished goods. These advances are trade in nature, unsecured, interest-free, and the obligations to the customers are expected to be fulfilled within the next 12 months.
The Group and Company’s payables denominated in foreign currencies are as follows:
Group Company2017 2016 2017 2016
Rp million Rp million Rp million Rp million
US Dollars 97,705 12,434 86,707 –Euro 3,995 1,326 – –Singapore Dollars 20,863 19,692 18,032 14,843Others 3,717 2,411 – –

NOTES TO THE FINANCIAL STATEMENTS For the financial year ended 31 December 2017
129 INDOFOOD AGRI RESOURCES LTD
ANNUAL REPORT 2017
26. INTEREST-BEARING LOANS AND BORROWINGS
Current loans and borrowings
Description of credit facility
End ofavailability
period
Amount
2017 2016
RupiahSubsidiaries
Unsecured facility from PT Bank Mandiri (Persero) Tbk June 2018 1,250,000 900,000
Unsecured facility from PT Bank Central Asia Tbk December 2018 745,000 325,000
Unsecured facilities from PT Bank Rabobank International Indonesia (1) July 2018 20,000 –
Unsecured facility from PT Bank DBS Indonesia September 2018 250,000 –
Secured facilities from PT Bank Rabobank International Indonesia (1)(2) July 2018 157,600 157,600
Secured facility from PT Bank DBS Indonesia (2) September 2018 680,000 700,000
Secured facilities from PT Bank Central Asia Tbk (2) December 2018 354,000 103,000
Total short-term loans 3,456,600 2,185,600
Current portion of long-term loans 1,006,104 295,805
Total 4,462,704 2,481,405
(1) These credit facilities are denominated in US Dollar currency but can be drawdown in Rupiah currency.(2) Corporate guarantee from PT SIMP in proportion to its equity ownership in the respective subsidiary.
Effective interest rates
The short-term loans denominated in Rupiah bear yearly interest rates ranging from 4.75% to 9.25% (2016: 5.65% to 10.75%) for the year ended 31 December 2017. The credit facilities denominated in US Dollar bear interest rates ranging from 1.93% to 2.13% for the year ended December 2016.
Covenants
The above-mentioned credit agreements obtained by the subsidiaries are subject to several negative covenants, include among others, to merge or consolidate with other entity; to change the Constitution; to reduce their share capital; making new investments and capital expenditures in excess of certain thresholds; to sell or dispose off significant portion of their assets used in the operations; as well as granting/obtaining credit facilities to/from other parties which would affect their ability to perform their obligation under the related credit agreements. The subsidiaries are also required to maintain certain financial ratios.
Compliance with loan covenants
As at 31 December 2017 and 2016, the Group has complied with all of the covenants of the above-mentioned short-term loans as stipulated in the respective loan agreements.

NOTES TO THE FINANCIAL STATEMENTS For the financial year ended 31 December 2017
130 INDOFOOD AGRI RESOURCES LTD
ANNUAL REPORT 2017
26. INTEREST-BEARING LOANS AND BORROWINGS (CONT’D)
Non-current loans and borrowings
Description of credit facility
Schedule ofinstalment and
maturities
Amount
2017 2016
RupiahSubsidiariesLoans for working capitalUnsecured facility PT Bank Sumitomo Mitsui Indonesia March 2019 300,000 –
Loan for refinancing, investment and working capitalSecured facility from PT Rabobank International Indonesia (1) – – 50,000
Unsecured facility from PT Bank Permata TbkQuarterly until
December 2018 2,295 7,201
Secured facility from PT Bank Sumitomo Mitsui Indonesia (1) March 2019 700,000 700,000
Secured facilities from PT Bank Central Asia Tbk (1)
Quarterly until December 2027 4,125,182 4,434,187
Secured facility from PT Bank Rakyat Indonesia (Persero) Tbk (2) – 3,746 (3) 9,746 (3)
Sub-total 5,131,223 5,201,134
US DollarThe CompanyLoans for refinancing and investmentUnsecured facility from Sumitomo Mitsui Banking Corporation,
Singapore May 2019 1,013,390 1,002,997
Subsidiaries Loans for refinancing, investment and working capitalUnsecured facility from Sumitomo Mitsui Banking Corporation,
Singapore October 2018 677,400 1,343,600
Secured facility from PT Bank UOB Indonesia (1)
Quarterly until November 2019 304,830 362,772
Sub-total 1,995,620 2,709,369
Total 7,126,843 7,910,503
Less deferred charges on bank loan 52,946 68,762
Less current portion 1,006,104 295,805
Total 6,067,793 7,545,936
(1) Corporate guarantee from the PT SIMP in proportion to its equity ownership in the subsidiary.(2) For plasma investment credit facilities: land rights under the name of the plasma farmers as the members KUD, plasma plantations and
infrastructures, and corporate guarantee from a subsidiary.(3) This loan will be offset with the related plasma receivables when the plasma plantations are handed over to the plasma farmers.
NOTES TO THE FINANCIAL STATEMENTS For the financial year ended 31 December 2017
131 INDOFOOD AGRI RESOURCES LTD
ANNUAL REPORT 2017
26. INTEREST-BEARING LOANS AND BORROWINGS (CONT’D)
Effective interest rates
The long-term loans denominated in US Dollar and Rupiah bear yearly interest rates ranging from 2.13% to 4.47% and 5.25% to 10.00%, respectively, for the year ended 31 December 2017 (2016: 1.57% to 4.28% and 7.66% to 10.80%).
Covenants
The above-mentioned credit agreements obtained by the Group provides for several negative covenants for the subsidiaries, include among others, to pledge their assets to other parties (except for the existing assets already pledged as at the credit agreement date); to lend money to unaffiliated parties; to merge or consolidate with other entity unless the subsidiaries will be the surviving legal entity; to change the current course of their businesses; to reduce their share capital; making new investments and capital expenditures in excess of certain threshold; to sell or dispose off significant portion of their assets used in the operations in excess of certain thresholds; to change their legal status; to pay dividends exceeding 50% of the previous year net profit; as well as to obtain credit facilities from other parties which would affect their ability to perform their obligation under the related credit agreements. The subsidiaries are also required to maintain certain financial ratios.
Compliance with loan covenants
As at 31 December 2017 and 2016, the Group has complied with all of the covenants of the above-mentioned short-term loans as stipulated in the respective loan agreements.
A reconciliation of liabilities arising from financing activities are as follows:
Non-cash changes31
December2016 Cash Flows
Foreign exchange
movement
Amortisation of deferred charges Other
31December
2017Rp million Rp million Rp million Rp million Rp million Rp million
Current:Interest-bearing loans
and borrowings 2,481,405 975,195 − − 1,006,104 4,462,704
Non-Current:Interest-bearing loans
and borrowings 7,545,936 (509,669) 21,814 15,816 (1,006,104) 6,067,793
Total 10,027,341 465,526 21,814 15,816 − 10,530,497
Non-cash changes31
December2015 Cash Flows
Foreign exchange
movement
Amortisation of deferred charges Other
31December
2016Rp million Rp million Rp million Rp million Rp million Rp million
Current:Interest-bearing loans
and borrowings 4,398,801 (2,204,622) (8,579) − 295,805 2,481,405
Non-Current:Interest-bearing loans
and borrowings 5,741,803 2,191,136 (77,108) (13,966) (295,929) 7,545,936
Total 10,140,604 (13,486) (85,687) (13,966) (124) 10,027,341
The “Other” column relates to reclassification of non-current portion to current due to passage of time and the reclassification to plasma receivables for temporary funding under plasma scheme.

NOTES TO THE FINANCIAL STATEMENTS For the financial year ended 31 December 2017
132 INDOFOOD AGRI RESOURCES LTD
ANNUAL REPORT 2017
26. INTEREST-BEARING LOANS AND BORROWINGS (CONT’D)
Compliance with loan covenants
S$500 million Euro Medium Term Note (the “MTN”)
In September 2013, the Company established a 5-year S$500 million Euro MTN Programme. Under the Programme, the Company may from time to time issue notes (the “Notes”) in series or tranches. Each series or tranche of Notes may be issued in any currency, in various amounts and tenors, and may bear interest at a fixed, floating, variable or hybrid rates (as applicable), as agreed between the Company and the relevant dealer(s).
As at 31 December 2017 and 2016, the Company has not issued any Notes under the programme.
27. OTHER NON-CURRENT PAYABLES
Group2017 2016
Rp million Rp million
Non-current:
Financial liabilitiesDue to related parties 351,659 542,099Others 12,447 27,680
Total amount due to related parties and other payables 364,106 569,779
Non-financial liabilitiesProvision for assets dismantling costs 34,149 31,086
Total other non-current payables 398,255 600,865
The amounts due to related parties represents loans provided to the subsidiaries by their non-controlling shareholders, which are not expected to be repaid within 3 years and unsecured.
Provision for assets dismantling costs
Provision for assets dismantling costs represents estimated liabilities for the costs to dismantle, remove and restore the sites of refinery, fractionation and margarine plants located in Jakarta and Surabaya, Indonesia. Gain/(loss) arising from changes in estimates of provision for asset dismantling costs are presented as part of “Other Operating Expenses” accounts in the profit or loss, as shown in Note 7.
The movement in provision for assets dismantling costs is:
GroupNote 2017 2016
Rp million Rp million
Balance at 1 January 31,086 27,478Changes in present value due to the passage of time and changes
in discount rates 7 3,063 3,608
Balance at 31 December 34,149 31,086

NOTES TO THE FINANCIAL STATEMENTS For the financial year ended 31 December 2017
133 INDOFOOD AGRI RESOURCES LTD
ANNUAL REPORT 2017
28. EMPLOYEE BENEFITS
Certain subsidiaries of the Group have defined benefit retirement plans covering substantially all of their qualified permanent employees.
The Group’s contributions to the funds are computed at 10.0% and 7.0% of the basic pensionable income for staff and non-staff employees, respectively.
On top of the benefits provided under the above-mentioned defined benefit retirement plans, the Group has also recorded additional provisions for employee service entitlements in order to meet the minimum benefits required to be paid to the qualified employees, as required under the labor law in Indonesia. The amounts of such additional provisions were determined based on actuarial computations prepared by an independent firm of actuaries using the “Projected Unit Credit” method.
GroupNote 2017 2016
Rp million Rp million
Employee benefits expenses (including directors):
Wages and salaries 2,692,291 2,567,247Provision for employee benefits 349,017 307,019Contribution to defined contribution pension plan 25,753 19,382Training and education 62,410 57,917
8 3,129,471 2,951,565
As at 31 December 2017, the balance of the related actuarial liability for employee benefits is presented as “Employee benefits liabilities” in the consolidated balance sheet.
Changes in the employee benefit obligations are as follows:
Group2017 2016
Rp million Rp million
Benefit obligation at 1 January 1,980,219 1,744,191Benefits paid (152,779) (72,636)
Changes charged to profit or lossCurrent service cost 180,104 148,496Interest cost on benefit obligations 168,319 156,993Net actuarial loss recognised during the year 3,430 1,530Gains on curtailments and settlements (2,836) –
Sub-total 349,017 307,019
Re-measurement loss/(gain) in other comprehensive incomeActuarial changes arising from changes in financial assumptions 201,688 (2,567)Experience adjustments (16,867) 4,212
Sub-total 184,821 1,645
Benefit obligation at 31 December 2,361,278 1,980,219

NOTES TO THE FINANCIAL STATEMENTS For the financial year ended 31 December 2017
134 INDOFOOD AGRI RESOURCES LTD
ANNUAL REPORT 2017
28. EMPLOYEE BENEFITS (CONT’D)
The principal assumptions used in determining post-employment obligations for the Group’s plan are as follows:
Annual discount rate : 6.7% and 6.9% (2016: 8.5%)Future annual salary increase : 8.0% (2016: 8.5%)Annual employee turnover rate : 6.0% (2016: 6.0%) for employees under the age of 30 years and
linearly decrease until 0% at the age of 52 yearsDisability rate : 10% (2016: 10%) from mortality rate Mortality rate reference : Indonesian Mortality Table (“IMT”) 2011 (2016: IMT 2011)
Sensitivity analysis to the principal assumptions used in determining employee benefits obligations are as follows:
Assumptions
quantitative sensitivity analysis
Increase/(decrease)(Decrease)/increase in the net
employee benefits liabilitiesRp million
31 December 2017Annual discount rate 100 /(100) basis points (193,332) /223,405Future annual salary increase 100 /(100) basis points 227,565 /(199,711)
31 December 2016Annual discount rate 100 /(100) basis points (151,372) /172,596Future annual salary increase 100 /(100) basis points 178,069 /(157,727)
The sensitivity analysis above have been determined based on a method that extrapolates the impact on employee benefit obligation as a result of reasonable changes in key assumptions occurring at the end of the reporting period.
The following payments are expected contributions to the employee benefit plan obligation in future years:
2017 2016Rp million Rp million
Within the next 12 months 150,413 93,548Between 1 and 2 years 133,857 170,630Between 2 and 5 years 323,122 297,723Beyond 5 years 16,585,217 16,518,745
Total expected payments 17,192,609 17,080,646
The average duration of the employee benefit plan obligation at the end of the reporting period is 11.8 years (2016: 12.3 years).

NOTES TO THE FINANCIAL STATEMENTS For the financial year ended 31 December 2017
135 INDOFOOD AGRI RESOURCES LTD
ANNUAL REPORT 2017
29. SHARE CAPITAL AND TREASURY SHARES
(a) Share capital
Group2017 2016
No. of shares Rp million No. of shares Rp million
Balance as at 1 January/ 31 December 1,447,782,830 3,584,279 1,447,782,830 3,584,279
Company2017 2016
No. of shares Rp million No. of shares Rp million
Balance as at 1 January/ 31 December 1,447,782,830 10,912,411 1,447,782,830 10,912,411
The holders of ordinary shares (except treasury shares) are entitled to receive dividends as and when declared by the Company. Each ordinary share carries one vote per share without restriction. The ordinary share has no par value.
(b) Treasury shares
Company2017 2016
No. of shares Rp million No. of shares Rp million
Balance as at 1 January/ 31 December 51,878,300 390,166 51,878,300 390,166
Treasury shares relate to ordinary shares of the Company that is held by the Company.

NOTES TO THE FINANCIAL STATEMENTS For the financial year ended 31 December 2017
136 INDOFOOD AGRI RESOURCES LTD
ANNUAL REPORT 2017
30. RESERvES
(a) Revenue reserves
Company2017 2016
Rp million Rp million
Retained earnings:
Balance at 1 January 785,238 769,401Dividends (86,554) (68,288)Profit for the year 112,090 84,125
Balance at 31 December 810,774 785,238
(b) Other reserves
Company2017 2016
Rp million Rp millionOther reserves:
Balance at 1 January and 31 December 144,152 144,152
Other reserve of the Company pertains to the gain on sale of treasury shares in the previous financial year.
Movement in the reserves of the Group are shown in the Consolidated statement of changes in equity.
(c) Dividends
Company2017 2016
Rp million Rp million
Declared and paid during year:
Dividends on ordinary shares:– Final tax exempt (one-tier) dividend for 2016: 0.65
Singapore cents (2015: 0.50 Singapore cents) per share 86,554 68,288
Proposed but not recognised as a liability as at 31 December:
Dividends on ordinary shares, subject to shareholders’ approval at the forthcoming AGM:
– Final tax exempt (one-tier) dividend for 2017: 0.70 Singapore cents (2016: 0.65 Singapore cents) per share 99,023 84,373

NOTES TO THE FINANCIAL STATEMENTS For the financial year ended 31 December 2017
137 INDOFOOD AGRI RESOURCES LTD
ANNUAL REPORT 2017
31. COMMITMENTS AND CONTINGENCIES
(a) Plasma receivables
The Indonesian government requires oil palm plantation companies to develop new plantations together with the local small landholders. This form of assistance to local small landholders is generally known as the “Plasma Scheme”. Once developed, the plasma plantations are transferred to the small landholders who then operate the plasma plantations under the supervision of the developer. In line with this requirement, certain subsidiary companies of the Group have commitments to develop plantations under the Plasma Scheme. The funding for the development of the plantations under the Plasma Scheme is provided by the designated banks and/or by the subsidiary companies. This includes the subsidiary companies providing corporate guarantees for the loans advanced by the banks.
When the plasma plantations start to mature, the plasma farmers are obliged to sell all their harvests to the subsidiary companies and a portion of the resulting proceeds will be used to repay the loans from the banks or the subsidiary companies. In situations where the sales proceeds are insufficient to meet the repayment obligations to the banks, the subsidiary companies also provide temporary funding to the plasma farmers to develop the plasma plantations and to repay the instalment and interest payments to the banks. The plasma farmers will repay the temporary funding to the subsidiary companies once the plantations have positive cash flows.
The loans advanced by the banks under the Plasma Scheme are secured by the sales proceeds of fresh fruit bunches (“FFB”) of the respective plasma plantations and corporate guarantees from certain subsidiary companies for a maximum amount of Rp719.0 billion (2016: Rp805.3 billion) as at 31 December 2017.
The Group recorded an allowance for uncollectible plasma receivables in its consolidated balance sheet amounting to Rp153.5 billion (2016: Rp153.1 billion). Based on a review of the plasma receivables of each project as at 31 December 2017, management believes that the above-mentioned allowance for uncollectible plasma receivables is sufficient to cover possible losses arising from the uncollectible plasma receivables.
An analysis of the movement in allowance for uncollectible plasma receivables is as follows:
Group2017 2016
Rp million Rp million
At 1 January 153,113 160,135Allowance/(reversal) of allowance 413 (7,022)
At 31 December 153,526 153,113
The accumulated development costs net of funds received are presented as Plasma receivables in the consolidated balance sheet and in the Plantations segment. An analysis of the movement in the plasma receivables is as follows:
GroupNote 2017 2016
Rp million Rp million
Balance at 1 January 1,079,012 795,633Allowance for uncollectible and loss arising from changes in
amortised costs of plasma receivables (22,816) (7,118)Additional net investment 135,183 189,696Reclassifications (15,234) 100,801
Balance at 31 December 21,23 1,176,145 1,079,012

NOTES TO THE FINANCIAL STATEMENTS For the financial year ended 31 December 2017
138 INDOFOOD AGRI RESOURCES LTD
ANNUAL REPORT 2017
31. COMMITMENTS AND CONTINGENCIES (CONT’D)
(b) Operating lease commitments
As lessee
The Group has entered into commercial leases to lease land and buildings, equipment and transportation equipment. These non-cancellable operating leases have remaining lease terms from 1 to 3 years. Operating lease payments recognised in the statement of comprehensive income in 2017 amounted to Rp22.1 billion (2016: Rp22.1 billion).
Future minimum lease payments under non-cancellable operating leases at the end of the reporting period are as follows:
2017 2016Rp million Rp million
Within one year 21,139 15,117After one year but not more than five years 9,998 241
31,137 15,358
As lessor
The Group has entered into a short-term commercial lease on its storage tanks. Operating lease income recognised in the Consolidated statement of comprehensive income for the financial year ended 31 December 2017 amounted to Rp4.9 billion (2016: Rp4.3 billion).
(c) Sales commitments
As at 31 December 2017, the Group has sales commitments to deliver the following products to local and overseas customers within the next three months:
2017 2016(Tonnes) (Tonnes)
Palm products 6,363 37,053Rubber 544 1,143Tea 79 137Cocoa 37 129
Total 7,023 38,462
As at 31 December 2017, Lonsum also has sales commitments to deliver 10,500 (2016: 122,225) of oil palm seeds to third party domestic customers within one month after the reporting date.
(d) Commitments for capital expenditures
As of 31 December 2017, capital expenditure contracted for but not recognised in the financial statements relating to purchase of property, plant and equipment as well as development of plantations amounting to Rp347 billion, US$3.4 million, and EUR 152,500 (2016: Rp471 billion, US$5.1 million, JP¥ 23.5 million and EUR 233,090).
(e) Settlement of contracts
In 2008, a subsidiary entered into a Supply Agreement with a contractor in China to supply machinery and equipment for a sugar factory with a contract value of US$84.3 million. The subsidiary also entered into a Construction Agreement with a contractor under the same group to construct a sugar factory with a contract value of US$33.7 million.
The contractor failed to fulfill its obligations under the Construction Agreement, forcing the subsidiary to perform remedial works to make the plant ready for use up to the intended capacity. In December 2016, the subsidiary and the contractors agreed to offset the claim receivables arising from the said remedial works with the related retention payables by the subsidiary, the net difference of Rp107.3 billion was recorded as part of “Other Operating Income” in Note 6.

NOTES TO THE FINANCIAL STATEMENTS For the financial year ended 31 December 2017
139 INDOFOOD AGRI RESOURCES LTD
ANNUAL REPORT 2017
32. RELATED PARTY TRANSACTIONS
In addition to those related party information disclosed elsewhere in the relevant notes to the consolidated financial information, the following transactions between the Group and related parties took place during the financial year at terms agreed between the parties during the financial year:
Nature of transactions Year
Ashareholder of
the GroupRelated
companiesOther related
partiesRp million Rp million Rp million
Sales of goods 2017 1,207 3,533,385 1,462,7252016 1,587 3,424,550 1,151,516
Purchases of packaging materials 2017 – 116,139 –2016 – 114,150 –
Purchases of services, transportation equipment and spare parts 2017 – 8,306 61,363
2016 – 9,351 17,710
Royalty fee expenses 2017 4,746 – –2016 7,181 – –
Pump services expenses 2017 – – 8,9012016 – – 8,216
Rental expenses 2017 – – 57,8472016 – – 57,431
Insurance expenses 2017 – – 29,5902016 – – 26,739
Other operating income 2017 – 2,123 –2016 – 3,687 50
Compensation of key management personnel of the Group
2017 2016Rp million Rp million
Salaries and short-term employee benefits 201,242 189,694Termination benefits 40,275 1,553Post-employment benefits 20,326 9,243
Total compensation paid to the key management personnel 261,843 200,490
Comprise amounts paid to:– Directors of the Company 97,183 74,639– Other key management personnel 164,661 125,851
261,844 200,490

NOTES TO THE FINANCIAL STATEMENTS For the financial year ended 31 December 2017
140 INDOFOOD AGRI RESOURCES LTD
ANNUAL REPORT 2017
33. FAIR vALUE OF ASSETS AND LIABILITIES
(a) Fair value hierarchy
The Group measures non-financial assets, such as biological assets, at fair value at each reporting date.
The Group categories fair value measurements using a fair value hierarchy that is dependent on the valuation inputs used as follows:
– Level 1 – Quoted prices (unadjusted) in active market for identical assets or liabilities that the Group can access at the measurement date,
– Level 2 – Inputs other than quoted prices included within Level 1 that are observable for the asset or liability, either directly or indirectly, and
– Level 3 – Unobservable inputs for the asset or liability.
Fair value measurements that use inputs of different hierarchy levels are categorised in its entirety in the same level of the fair value hierarchy as the lowest level input that is significant to the entire measurement.
The following table provides the fair value hierarchy of the Group’s assets and liabilities in accordance with the level of inputs to valuation techniques used to measure fair value:
quoted prices inactive markets
for identicalassets (Level 1)
Significantother
observableinputs
(Level 2)
Significantunobservable
inputs (Level 3)
Rp million Rp million Rp million
As at 31 December 2017Recurring fair value measurementsBiological assets – timber plantations (Note 13) – – 313,305Biological assets – agriculture produce (Note 13) – 220,729 316,092Available-for-sale financial asset (Note 21) – – 19,439
As at 31 December 2016Recurring fair value measurementsBiological assets – timber plantations (Note 13) – – 325,102Biological assets – agriculture produce (Note 13) – 217,837 246,885Available-for-sale financial asset (Note 21) – – 60,027
For assets and liabilities that are recognised in the financial statements on a recurring basis, the Group determines whether transfers have occurred between Levels in the hierarchy by re-assessing categorisation (based on the lowest level input that is significant to the fair value measurement as a whole) at the end of each reporting period.

NOTES TO THE FINANCIAL STATEMENTS For the financial year ended 31 December 2017
141 INDOFOOD AGRI RESOURCES LTD
ANNUAL REPORT 2017
33. FAIR vALUE OF ASSETS AND LIABILITIES (CONT’D)
(b) valuation policy
The Group’s financial reporting team in charge of valuation (“Valuation Team”) determines the policies and procedures for recurring fair value measurement, such as biological assets and fair value (less costs of disposal) of CGUs (for goodwill impairment test purpose).
External valuers are involved for valuation of significant assets. Involvement of external valuers is decided annually by the Valuation Team after discussion with and approval by the Group’s executive directors. Selection criteria include market knowledge, reputation, independence and whether professional standards are maintained. The Valuation Team decides, after discussions with the Group’s external valuers, which valuation techniques and inputs to use.
The Valuation Team, in conjunction with the Group’s external valuers, also compares each of the changes in the fair value of each asset with relevant external sources to determine whether the change is reasonable. On an interim basis, the Valuation Team and the Group’s external valuers present the valuation results to the Group’s independent auditors. This includes a discussion of the major assumptions used in the valuations as well as the integrity of the model and reasonableness of the key inputs.
For the purpose of fair value disclosures, the Group has determined classes of assets and liabilities on the basis of the nature, characteristics and risks of the asset or liability and the level of the fair value hierarchy as explained above.
(c) Financial instruments carried at fair value or amortised cost
Plasma receivables and long-term loans to employees are carried at amortised cost using the effective interest method and the discount rates used are the current market incremental lending rate for similar types of lending. The effective yearly interest rates were ranging from 5.98% to 12.00% (2016: 7.58% to 12.00%) for the year ended 31 December 2017.
The fair value of available-for-sale financial asset was estimated using income approach based on discounted cash flows of Heliae for five years plus terminal value after the forecast period.
The significance of the unobservable inputs used in the fair value measurement of available-for-sale financial asset is categorised within Level 3 of the fair value hierarchy together with a quantitative sensitivity analysis as at 31 December 2017 and 2016 are as shown below:
Unobservable Inputs quantitative Inputs
Sensitivity Analysis
Sensitivity UsedEffect to Fair value
Rp million
31 December 2017Discount rate 13.10% 50 basis points (4,141)/4,592
Growth rate after forecast period 1.8% 5 basis points 346/(343)
31 December 2016Discount rate 14.44% 50 basis points (9,800)/10,760
Growth rate after forecast period 2.2% 5 basis points 763/(757)
The carrying amounts of cash and cash equivalents, current trade and other receivables, current trade and other payables and accruals, and current/short-term bank loans and borrowings are the approximations of their fair values because they are mostly short-term in nature.
The carrying amounts of long-term loans and borrowings and due to related parties with floating interest rates are the approximations of their fair values as they are re-priced frequently.

NOTES TO THE FINANCIAL STATEMENTS For the financial year ended 31 December 2017
142 INDOFOOD AGRI RESOURCES LTD
ANNUAL REPORT 2017
34. FINANCIAL RISK MANAGEMENT OBjECTIvES AND POLICIES
The Group and the Company are exposed to financial risks arising from its operations and the use of financial instruments. The key financial risks include interest rate risk, market risk (including currency risk and commodity price risk), credit risk and liquidity risk. The Audit & Risk Management Committee provides independent oversight to the effectiveness of the risk management process. It is, and has been throughout the current and previous financial year, the Group’s policy that no trading in financial instruments shall be undertaken.
The following sections provide details regarding the Group and Company’s exposure to the above mentioned financial risks and the objectives, policies and processes for the management of these risks.
There has been no change to the Group’s exposure to these financial risks or the manner in which it manages and measures the risks.
(a) Interest rate risk
Interest rate risk is the risk that the fair value or future cash flows of the Group’s and the Company’s financial instruments will fluctuate because of changes in market interest rates. The Group’s and the Company’s exposure to interest rate risk mainly arises from loans and borrowings for working capital and investment purposes. There are no loans and borrowings of the Group at fixed interest rates.
Currently, the Group does not have a formal hedging policy for interest rate exposures.
Sensitivity analysis for interest rate risk
Based on a sensible simulation, with all other variables held constant, sensitivity analysis on the floating interest rate of borrowings is as follows:
variable Increase/(Decrease)
(Decrease)/Increase in Profit Before Tax
Rp million
31 December 2017Floating interest rate 50/(50) basis points (Rp8,928)/Rp8,928
31 December 2016Floating interest rate 50/(50) basis points (Rp8,242)/Rp8,242
(b) Foreign currency risk
The Group’s reporting currency is Indonesian Rupiah. The Group faces foreign exchange risk as its borrowings, export sales and the costs of certain key purchases which are either denominated in the United States dollars or whose price is significantly influenced by their benchmark price movements in foreign currencies (mainly US Dollar) as quoted on international markets. To the extent that the revenue and purchases of the Group are denominated in currencies other than Indonesian Rupiah, and are not evenly matched in terms of quantum and/or timing, the Group has exposure to foreign currency risk.
The Group does not have any formal hedging policy for foreign exchange exposure. Whenever possible, the Group seeks to maintain a natural hedge through the matching of liabilities against assets in the same currency to minimise foreign exchange exposure.

NOTES TO THE FINANCIAL STATEMENTS For the financial year ended 31 December 2017
143 INDOFOOD AGRI RESOURCES LTD
ANNUAL REPORT 2017
34. FINANCIAL RISK MANAGEMENT OBjECTIvES AND POLICIES (CONT’D)
(b) Foreign currency risk (cont’d)
Based on a sensible simulation, with all other variables held constant, sensitivity analysis on the change of exchange rate of Rupiah against US Dollar is as follows:
variable Increase/(Decrease)
(Decrease)/Increase inProfit Before Tax
Rp million
31 December 2017Exchange rate of Rupiah against US Dollar 10%/(10%) (Rp120,795)/Rp120,795
31 December 2016Exchange rate of Rupiah against US Dollar 10%/(10%) (Rp218,376)/Rp218,376
(c) Commodity price risk
Commodity price risk is the risk that the fair value or future cash flows of the Group’s financial instrument will fluctuate because of changes in market prices. The Group is exposed to commodity price risk due to certain factors, such as weather, government policy, level of demand and supply in the market and the global economic environment. Such exposure mainly arises from its purchase of CPO where the profit margin on sale of its finished products may be affected if the cost of CPO (which is the main raw material used in the refinery plants to manufacture cooking oils and fats products) increases and the Group is unable to pass such cost increases to its customers.
During 2017 and 2016, it is, and has been, the Group’s policy that no hedging in financial instruments shall be undertaken.
The Group’s policy is to minimise the risks of its raw material costs arising from the fluctuations in the commodity prices by increasing self-sufficiency in CPO for the refinery operations (through the purchase of CPO from the Group’s own plantations).
(d) Credit risk
Credit risk is the risk of loss that may arise on outstanding financial instruments should a counterparty default on its obligations.
The Group has credit risk arising from the credit granted to its customers and plasma farmers and placement of current accounts and deposits in the banks.
Other than as disclosed below, the Group has no concentration of credit risk.
Cash and cash equivalents
Credit risk arising from placements of current accounts and deposits is managed in accordance with the Group’s policy. Such limits are set to minimise the concentration of credit risk and therefore mitigate financial loss through potential failure of the banks.

NOTES TO THE FINANCIAL STATEMENTS For the financial year ended 31 December 2017
144 INDOFOOD AGRI RESOURCES LTD
ANNUAL REPORT 2017
34. FINANCIAL RISK MANAGEMENT OBjECTIvES AND POLICIES (CONT’D)
(d) Credit risk (cont’d)
Trade receivables
The Group has policies in place to ensure that sales of products are made only to creditworthy customers with proven track record or good credit history. It is the Group’s policy that all customers who wish to trade on credit terms are subject to credit verification procedures. For export sales, the Group requires cash against the presentation of documents of title. For domestic sales, the Group may grant its customers credit terms from 1 to 35 days from the issuance of invoice. The Group has policies that the limit amount of credit exposure to any particular customer, such as, requiring sub-distributors to provide bank guarantees. In addition, receivable balances are monitored on an ongoing basis to reduce the Group’s exposure to bad debts.
When a customer fails to make payment within the credit terms granted, the Group will contact the customer to act on the overdue receivables. If the customer does not settle the overdue receivable within a reasonable time, the Group will proceed to commence legal proceedings. Depending on the Group’s assessment, specific provisions may be made if the debt is deemed uncollectible. To mitigate credit risk, the Group will cease the supply of all products to customers in the event of late payment and/or default. See Note 23 for details.
Plasma Receivables
As disclosed in Notes 2.9 and 31(a), plasma receivables represent costs incurred for plasma plantation development which include costs for plasma plantations funded by the banks and temporarily self funded by the subsidiaries awaiting banks’ funding.
Plasma receivables also include advances to plasma farmers for topping up loan instalments to the banks, advances for fertilisers and other agriculture supplies. These advances shall be reimbursed by the plasma farmers and the collateral in form of titles of ownership of the plasma plantations will be handed over to the plasma farmers once the plasma receivables have been fully repaid.
The Group through partnership scheme also provides technical assistance to the plasma farmers to maintain the productivity of plasma plantations as part of the Group’s strategy to strengthen relationship with plasma farmers which is expected to improve the repayments of plasma receivables.
At the end of the reporting period, the Group’s maximum exposure to credit risk is represented by the carrying amount of each class of financial assets recognised in the balance sheets.
(e) Liquidity risk
Liquidity risk is the risk that the Group will encounter difficulty in meeting financial obligations due to shortage of funds. The Group’s exposure to liquidity risk arises primarily from mismatches of maturities in its financial assets and liabilities. The Group manages its liquidity profile to be able to finance its capital expenditure and service its maturing debts by maintaining sufficient cash and marketable securities, and the availability of funding through an adequate amount of committed credit facilities.
The Group regularly evaluates its projected and actual cash flow information and continuously assesses conditions in the financial markets for opportunities to pursue fund-raising initiatives. These initiatives may include bank loans and borrowings and equity market issues.

NOTES TO THE FINANCIAL STATEMENTS For the financial year ended 31 December 2017
145 INDOFOOD AGRI RESOURCES LTD
ANNUAL REPORT 2017
34. FINANCIAL RISK MANAGEMENT OBjECTIvES AND POLICIES (CONT’D)
(e) Liquidity risk(cont’d)
The table below summarises the maturity profile of the Group’s financial liabilities at the end of reporting period based on contractual undiscounted repayment obligations:
One yearor less
One tofive years
More than5 years Total
Rp million Rp million Rp million Rp million
Group
As at 31 December 2017
Financial liabilities:
Non-current interest-bearing loans and borrowings 118,645 4,007,919 2,736,791 6,863,355
Other payables (non-current) 17,876 369,535 – 387,411Trade and other payables
and accruals 1,631,014 – – 1,631,014Current interest-bearing loans
and borrowings 4,914,344 1,013,390 – 5,927,734
Total undiscounted financial liabilities 6,681,879 5,390,844 2,736,791 14,809,514
As at 31 December 2016
Financial liabilities:
Non-current interest-bearing loans and borrowings 117,914 5,180,930 3,627,536 8,926,380
Other payables (non-current) 31,139 604,377 – 635,516Trade and other payables
and accruals 1,499,716 – – 1,499,716Current interest-bearing loans
and borrowings 3,047,763 1,002,997 – 4,050,760
Total undiscounted financial liabilities 4,696,532 6,788,304 3,627,536 15,112,372

NOTES TO THE FINANCIAL STATEMENTS For the financial year ended 31 December 2017
146 INDOFOOD AGRI RESOURCES LTD
ANNUAL REPORT 2017
34. FINANCIAL RISK MANAGEMENT OBjECTIvES AND POLICIES (CONT’D)
(e) Liquidity risk (cont’d)
Undiscounted loans and borrowings with floating rates had been determined with reference to the applicable rates as at balance sheet dates.
One yearor less
One tofive years
More than5 years Total
Rp million Rp million Rp million Rp million
Company
As at 31 December 2017
Financial liabilities:
Trade and other payables and accruals 104,739 – – 104,739Current interest-bearing loans
and borrowings 8,375 1,013,390 – 1,021,765
Total undiscounted financial liabilities 113,114 1,013,390 – 1,126,504
As at 31 December 2016
Financial liabilities:
Trade and other payables and accruals 14,843 – – 14,843
Current interest-bearing loans and borrowings 6,368 1,002,997 – 1,009,365
Total undiscounted financial liabilities 21,211 1,002,997 – 1,024,208
35. CAPITAL MANAGEMENT
The primary objective of the Group’s capital management is to ensure that it maintains healthy capital ratios in order to support its business and maximise shareholder value.
Certain subsidiary companies are required to comply with loan covenants imposed by their lenders, such as maintaining the level of existing share capital. This externally imposed requirement has been complied with by the relevant subsidiary companies for the financial year ended 31 December 2017 and 2016. Additionally, certain subsidiary companies in Indonesia are required by the Corporate Law to maintain a non-distributable reserve until it reaches 20% of the issued and paid share capital. This externally imposed capital requirement will be complied by the relevant subsidiary companies by their next annual general meeting.
The Group manages its capital structure and makes adjustments to it, in light of changes in economic conditions. To maintain or adjust the capital structure, the Group may adjust the dividend payment to shareholders, return capital to shareholders or issue new shares. No changes were made in the objectives, policies or processes during the years ended 31 December 2017 and 2016.
The Group monitors capital using gearing ratios, by dividing net loans and borrowings with total equity. The Group’s policy is to keep the gearing ratio within the range of gearing ratios of leading companies in similar industry in Indonesia in order to secure access to finance at a reasonable cost.

NOTES TO THE FINANCIAL STATEMENTS For the financial year ended 31 December 2017
147 INDOFOOD AGRI RESOURCES LTD
ANNUAL REPORT 2017
35. CAPITAL MANAGEMENT (CONT’D)
2017 2016Rp million Rp million
Non-current interest-bearing loans and borrowings 6,067,793 7,545,936Current interest-bearing loans and borrowings 4,462,704 2,481,405
10,530,497 10,027,341Less: Cash and cash equivalents (2,929,674) (2,404,838)
Net debts 7,600,823 7,622,503
Total equity 21,422,650 20,878,052
Gearing ratio 35% 37%
36. SEGMENT INFORMATION
For management purposes, the Group is organised into business units based on their products and services and has two reportable operating segments as follows:
Plantations segment
Plantations segment is mainly involved in the development and maintenance of oil palm, rubber and sugar cane plantations and other business activities relating to palm oil, rubber and sugar cane processing, marketing and selling. This segment is also involved in the cultivation of cocoa, tea and industrial timber plantations.
Edible oils and fats segment
Edible oils and fats segment produces, markets and sells edible oil, margarine, shortening and other related products and its derivative products.
Management monitors the operating results of its business units separately for the purpose of making decisions about resource allocation and performance assessment. Segment performance is evaluated based on operating profit or loss and is measured consistently with operating profit or loss in the consolidated financial statements. However, Group financing (including finance costs and finance income), foreign exchange gains/losses and income taxes are managed on a group basis and are not allocated to operating segments.
Transfer prices between business segments are based on terms agreed between the parties. Segment revenues, segment expenses and segment results include transfers between business segments. Those transfers are eliminated for purposes of consolidation.
Others/eliminations for segment assets and liabilities relates primarily to eliminations between inter-segment receivables and payable, and the Company’s asset and liabilities.

NOTES TO THE FINANCIAL STATEMENTS For the financial year ended 31 December 2017
148 INDOFOOD AGRI RESOURCES LTD
ANNUAL REPORT 2017
36. SEGMENT INFORMATION (CONT’D)
The following table presents revenue and profit and certain asset and liability information regarding the Group’s business segments:
Business segments
PlantationsEdible Oils
and FatsOthers/
eliminations TotalRp million Rp million Rp million Rp million
Year ended 31 December 2017RevenueSales to external customers 5,440,797 10,385,851 – 15,826,648Inter-segment sales 4,696,763 28,842 (4,725,605) –
Total sales 10,137,560 10,414,693 (4,725,605) 15,826,648
Share of results of associate companies 140 – (18,055) (17,915)Share of results of a joint venture – – 138,654 138,654Segment results 1,588,331 116,651 (133,580) 1,571,402
Net finance expense (539,538)Foreign exchange loss (14,450)
Profit before tax 1,138,153Income tax expense (485,268)
Net profit for the year 652,885
Assets and liabilitiesSegment assets 27,415,649 4,120,777 885,139 32,421,565Goodwill 3,245,837 – – 3,245,837
Prepaid taxes 273,845Deferred tax assets 1,346,976Claims for tax refund 126,732
Total assets 37,414,955
Segment liabilities 3,359,564 1,746,542 (589,124) 4,516,982
Unallocated liabilities 10,598,765Deferred tax liabilities 784,827Income tax payable 91,731
Total liabilities 15,992,305
Other segment information:Investment in associate companies 855,439 – 503,335 1,358,774Capital expenditure 1,277,919 200,775 69 1,478,763Depreciation and amortisation 1,309,337 117,428 3,656 1,430,421Gain from changes in fair value of
biological assets 34,839 – – 34,839Provision for employee benefits 291,086 57,931 – 349,017

NOTES TO THE FINANCIAL STATEMENTS For the financial year ended 31 December 2017
149 INDOFOOD AGRI RESOURCES LTD
ANNUAL REPORT 2017
36. SEGMENT INFORMATION (CONT’D)
Business segments (cont’d)
PlantationsEdible Oils
and FatsOthers/
eliminations TotalRp million Rp million Rp million Rp million
Year ended 31 December 2016RevenueSales to external customers 4,964,597 9,566,341 – 14,530,938Inter-segment sales 4,111,365 43,080 (4,154,445) –
Total sales 9,075,962 9,609,421 (4,154,445) 14,530,938
Share of results of associate companies (50,840) – (16,560) (67,400)Share of results of a joint venture – – (33,109) (33,109)Segment results 2,156,075 257,058 (143,777) 2,269,356
Net finance expense (573,494)Foreign exchange gain 94,188
Profit before tax 1,689,541Income tax expense (897,252)
Net profit for the year 792,289
Assets and liabilitiesSegment assets 27,418,240 3,683,555 478,077 31,579,872Goodwill 3,253,637 – – 3,253,637
Prepaid taxes 251,107Deferred tax assets 1,240,194Claims for tax refund 178,704
Total assets 36,503,514
Segment liabilities 3,223,751 1,897,839 (856,219) 4,265,371
Unallocated liabilities 10,296,442Deferred tax liabilities 848,134Income tax payable 215,515
Total liabilities 15,625,462
Other segment information:Investment in associate companies 493,028 – 509,219 1,002,247Capital expenditure 1,546,081 39,714 31 1,585,826Depreciation and amortisation 1,280,543 117,957 3,687 1,402,187Gain from changes in fair value of biological
assets 219,000 – – 219,000Provision for employee benefits 256,354 50,663 – 307,017

NOTES TO THE FINANCIAL STATEMENTS For the financial year ended 31 December 2017
150 INDOFOOD AGRI RESOURCES LTD
ANNUAL REPORT 2017
36. SEGMENT INFORMATION (CONT’D)
Geographical segments
The following table presents sales to customers based on the geographical location of the customers:
2017 2016Rp million Rp million
Region
Indonesia 14,463,046 13,515,784Singapore 170,284 197,085China 522,846 363,225Nigeria 107,072 114,161Malaysia 112,617 23,619Philippines 50,063 44,339Timor Leste 88,486 68,744South Korea 109,115 45,986Others (each below Rp50.0 billion) 203,119 157,995
Segment revenue 15,826,648 14,530,938
The Group’s capital expenditure and segment assets are primarily incurred and located in Indonesia.
37. EvENT OCCURRING AFTER THE REPORTING PERIOD
Pursuant to a Share Subscription Agreement entered between the Company’s 100%-owned subsidiary, IndoAgri Brazil Participações Ltda. (“IndoAgri Brazil”) and its joint venture partner, JF Investimentos S.A. (“JF”), each partner will contribute an initial capital of BRL 23.6 million (equivalent to Rp96.6 billion). Following the capital injection by both parties, Canápolis will become a 50% : 50% joint venture between IndoAgri Brazil and JF. IndoAgri Brazil has contributed its 50% share of capital on 15 February 2018.
Canápolis Group was incorporated in November 2017 and in December 2017 acquired a sugar mill in Minas Gerais in Brazil with an annual cane crushing capacity of 1.8 million tonnes and 6,048 hectares of land (“Assets”) through a court auction process due to the bankruptcy of the previous owner. The acquisition price for the Assets is approximately BRL 137.8 million (equivalent to Rp564.0 billion) to be paid in four installments, the final payment being in June 2019. Canápolis Group expects to start operating the mill in 2020 after the completion of cane planting and rehabilitation of the mill. The capital expenditures for the cane planting and rehabilitation will be mainly funded by bank borrowings.
38. AUTHORISATION OF FINANCIAL STATEMENTS FOR ISSUE
The financial statements for the year ended 31 December 2017 were authorised for issue in accordance with a resolution of the directors on 16 March 2018.

151 INDOFOOD AGRI RESOURCES LTD
ANNUAL REPORT 2017
Interested person transactions (“IPT’) carried out during the financial year ended 31 December 2017 pursuant to the Shareholders’ Mandate obtained under Chapter 9 of the Listing Manual of the Singapore Exchange Securities Trading Limited (“SGX-ST”) by the Group are as follows:
Name of Interested Person
Aggregate value of all IPT during the financial year under review
(excluding transactions less than $100,000 and transactions conducted under shareholders’ mandate pursuant to Rule 920)
Aggregate value ofall IPT conducted undershareholders’ mandate
pursuant to Rule 920(excluding transactions
less than $100,000)Rp ’billion Rp ’billion USD ’million
PT ISM Group • Sales of cooking oil, margarine and others – 3,537 –• Purchase of goods, services and assets – 132 –• Capital injection 245 – –
Salim Group• Sales of cooking oil, seeds and material – 1,481 –• Purchases of goods and services – 544 –• Shareholder loans – 1,332 –• Corporate guarantees – 2,712 16
INTERESTED PERSON TRANSACTIONS
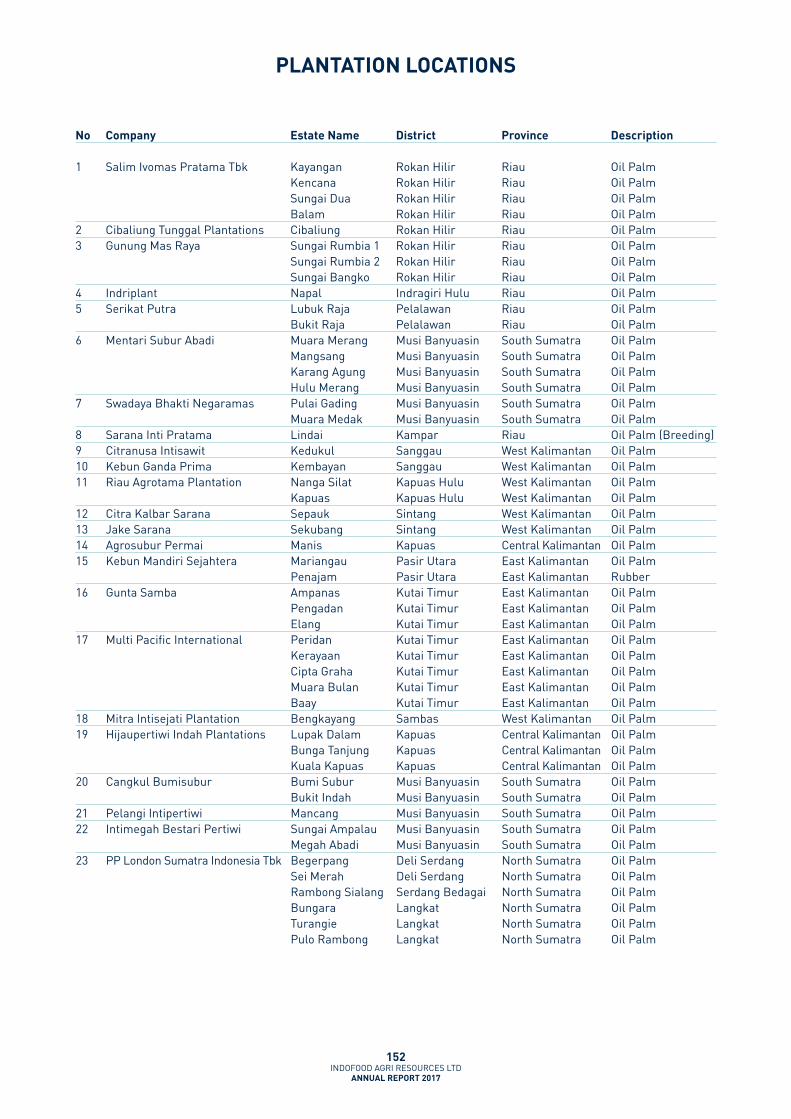
152 INDOFOOD AGRI RESOURCES LTD
ANNUAL REPORT 2017
PLANTATION LOCATIONS
No Company Estate Name District Province Description
1 Salim Ivomas Pratama Tbk Kayangan Rokan Hilir Riau Oil PalmKencana Rokan Hilir Riau Oil PalmSungai Dua Rokan Hilir Riau Oil PalmBalam Rokan Hilir Riau Oil Palm
2 Cibaliung Tunggal Plantations Cibaliung Rokan Hilir Riau Oil Palm3 Gunung Mas Raya Sungai Rumbia 1 Rokan Hilir Riau Oil Palm
Sungai Rumbia 2 Rokan Hilir Riau Oil PalmSungai Bangko Rokan Hilir Riau Oil Palm
4 Indriplant Napal Indragiri Hulu Riau Oil Palm5 Serikat Putra Lubuk Raja Pelalawan Riau Oil Palm
Bukit Raja Pelalawan Riau Oil Palm6 Mentari Subur Abadi Muara Merang Musi Banyuasin South Sumatra Oil Palm
Mangsang Musi Banyuasin South Sumatra Oil PalmKarang Agung Musi Banyuasin South Sumatra Oil PalmHulu Merang Musi Banyuasin South Sumatra Oil Palm
7 Swadaya Bhakti Negaramas Pulai Gading Musi Banyuasin South Sumatra Oil PalmMuara Medak Musi Banyuasin South Sumatra Oil Palm
8 Sarana Inti Pratama Lindai Kampar Riau Oil Palm (Breeding)9 Citranusa Intisawit Kedukul Sanggau West Kalimantan Oil Palm10 Kebun Ganda Prima Kembayan Sanggau West Kalimantan Oil Palm11 Riau Agrotama Plantation Nanga Silat Kapuas Hulu West Kalimantan Oil Palm
Kapuas Kapuas Hulu West Kalimantan Oil Palm12 Citra Kalbar Sarana Sepauk Sintang West Kalimantan Oil Palm13 Jake Sarana Sekubang Sintang West Kalimantan Oil Palm14 Agrosubur Permai Manis Kapuas Central Kalimantan Oil Palm15 Kebun Mandiri Sejahtera Mariangau Pasir Utara East Kalimantan Oil Palm
Penajam Pasir Utara East Kalimantan Rubber16 Gunta Samba Ampanas Kutai Timur East Kalimantan Oil Palm
Pengadan Kutai Timur East Kalimantan Oil PalmElang Kutai Timur East Kalimantan Oil Palm
17 Multi Pacific International Peridan Kutai Timur East Kalimantan Oil PalmKerayaan Kutai Timur East Kalimantan Oil PalmCipta Graha Kutai Timur East Kalimantan Oil PalmMuara Bulan Kutai Timur East Kalimantan Oil PalmBaay Kutai Timur East Kalimantan Oil Palm
18 Mitra Intisejati Plantation Bengkayang Sambas West Kalimantan Oil Palm19 Hijaupertiwi Indah Plantations Lupak Dalam Kapuas Central Kalimantan Oil Palm
Bunga Tanjung Kapuas Central Kalimantan Oil PalmKuala Kapuas Kapuas Central Kalimantan Oil Palm
20 Cangkul Bumisubur Bumi Subur Musi Banyuasin South Sumatra Oil PalmBukit Indah Musi Banyuasin South Sumatra Oil Palm
21 Pelangi Intipertiwi Mancang Musi Banyuasin South Sumatra Oil Palm22 Intimegah Bestari Pertiwi Sungai Ampalau Musi Banyuasin South Sumatra Oil Palm
Megah Abadi Musi Banyuasin South Sumatra Oil Palm23 PP London Sumatra Indonesia Tbk Begerpang Deli Serdang North Sumatra Oil Palm
Sei Merah Deli Serdang North Sumatra Oil PalmRambong Sialang Serdang Bedagai North Sumatra Oil Palm Bungara Langkat North Sumatra Oil PalmTurangie Langkat North Sumatra Oil PalmPulo Rambong Langkat North Sumatra Oil Palm

153 INDOFOOD AGRI RESOURCES LTD
ANNUAL REPORT 2017
No Company Estate Name District Province Description
23 PP London Sumatra Indonesia Tbk Bah Lias Simalungun North Sumatra Oil Palm, Cocoa & Seed Breeding
Bah Bulian Simalungun North Sumatra Oil PalmDolok Batubara North Sumatra Oil PalmGunung Malayu Asahan North Sumatra Oil PalmSibulan Serdang Bedagai North Sumatra Oil PalmSei Rumbiya Labuhan Batu
SelatanNorth Sumatra Oil Palm & Rubber
Tirta Agung Musi Banyuasin South Sumatra Oil PalmBudi Tirta Musi Banyuasin South Sumatra Oil PalmSuka Damai Musi Banyuasin South Sumatra Oil PalmSei Punjung Musi Banyuasin South Sumatra Oil PalmSuka Bangun Musi Banyuasin South Sumatra Oil PalmBangun Harjo Musi Banyuasin South Sumatra Oil PalmRiam Indah Musi Rawas Utara South Sumatra Oil PalmSei Lakitan Musi Rawas & Musi
Rawas UtaraSouth Sumatra Oil Palm
Sei Gemang Musi Rawas Utara South Sumatra Oil PalmGunung Bais Musi Rawas South Sumatra Oil PalmPering Permai Musi Rawas South Sumatra Oil PalmMentari Kulim Musi Rawas South Sumatra Oil PalmKelingi Lestari Musi Rawas South Sumatra Oil PalmSei Kepayang Musi Rawas Utara South Sumatra Oil PalmKetapat Bening Musi Rawas Utara South Sumatra Oil PalmBelani Elok Musi Rawas Utara South Sumatra Oil PalmBatu Cemerlang Musi Rawas Utara South Sumatra Oil PalmBukit Hijau Musi Rawas Utara South Sumatra Oil PalmTerawas Indah Musi Rawas South Sumatra Oil PalmArta Kencana Lahat South Sumatra Oil PalmKencana Sari Lahat South Sumatra Oil PalmTulung Gelam Ogan Komering Ilir South Sumatra RubberKubu Pakaran Ogan Komering Ilir South Sumatra RubberBebah Permata Ogan Komering Ilir South Sumatra RubberIsuy Makmur Kutai Barat East Kalimantan Oil PalmPahu Makmur Kutai Barat East Kalimantan Oil PalmKedang Makmur Kutai Barat East Kalimantan Oil PalmJelau Makmur Kutai Barat East Kalimantan Oil PalmSeniung Makmur Kutai Barat East Kalimantan Oil PalmTanjung Makmur Kutai Barat East Kalimantan Oil PalmBalombissie Bulukumba South Sulawesi RubberPalang Isang Bulukumba South Sulawesi RubberPungkol Minahasa North Sulawesi CocoaTreblasala Banyuwangi East Java CocoaKertasarie Bandung West Java TeaPasir Luhur Cianjur West Java Tea
24 Lajuperdana Indah Komering Sugar Ogan Komering Ulu Timur
South Sumatra Sugar Cane
25 Madusari Lampung Indah Madusari Ogan Komering Ulu Timur
South Sumatra Sugar Cane
26 Sumalindo Alam Lestari – Berau/Kutai Timur East Kalimantan Industrial Timber27 Wana Kaltim Lestari – Berau East Kalimantan Industrial Timber
PLANTATION LOCATIONS

154 INDOFOOD AGRI RESOURCES LTD
ANNUAL REPORT 2017
Number of Issued Shares : 1,447,782,830Number of Issued Shares (excluding Treasury Shares) : 1,395,904,530 ordinary sharesNumber/Percentage of Treasury Shares : 51,878,300 (3.58%)Class of Shares : Ordinary Sharesvoting Rights (excluding Treasury Shares) : 1 vote per share
DISTRIBUTION OF SHAREHOLDINGS
Size Of ShareholdingsNumber of
Shareholders %Number. of
Shares %
1 – 99 17 0.22 291 0.00100 – 1,000 681 8.86 443,625 0.031,001 – 10,000 4,182 54.45 24,822,019 1.7810,001 – 1,000,000 2,775 36.13 141,474,088 10.131,000,001 and above 26 0.34 1,229,164,507 88.06
Total 7,681 100.00 1,395,904,530 100.00
TWENTY LARGEST SHAREHOLDERS
No. NameNumber of
Shares %**
1 UOB KAY HIAN PRIVATE LIMITED 1,021,587,230 73.182 CITIBANK NOMINEES SINGAPORE PTE LTD 63,178,447 4.533 HSBC (SINGAPORE) NOMINEES PTE LTD 27,123,271 1.944 DBS NOMINEES (PRIVATE) LIMITED 23,006,530 1.655 RAFFLES NOMINEES (PTE) LIMITED 19,978,268 1.436 UNITED OVERSEAS BANK NOMINEES (PRIVATE) LIMITED 9,374,878 0.677 DBS VICKERS SECURITIES (SINGAPORE) PTE LTD 6,994,100 0.508 MAYBANK KIM ENG SECURITIES PTE. LTD. 6,564,650 0.479 DBSN SERVICES PTE. LTD. 6,083,283 0.4410 SCS TRUST PTE LTD 6,000,000 0.4311 OCBC SECURITIES PRIVATE LIMITED 5,524,045 0.4012 CGS-CIMB SECURITIES (SINGAPORE) PTE. LTD. 4,761,180 0.3413 NOMURA SINGAPORE LIMITED 4,305,000 0.3114 CILIANDRA FANGIONO OR FANG ZHIXIANG 3,848,000 0.2815 PHILLIP SECURITIES PTE LTD 3,773,691 0.2716 OCBC NOMINEES SINGAPORE PRIVATE LIMITED 2,752,400 0.2017 RHB SECURITIES SINGAPORE PTE. LTD. 1,858,100 0.1318 HL BANK NOMINEES (SINGAPORE) PTE LTD 1,741,000 0.1219 BPSS NOMINEES SINGPORE (PTE.) LTD. 1,662,927 0.1220 CHUA KEE TEE 1,600,000 0.11
Total 1,221,717,000 87.52
** Percentage is calculated based on 1,395,904,530 shares (excluding treasury shares of the Company).
STATISTICS OF SHAREHOLDINGSAS AT 15 MARCH 2018

155 INDOFOOD AGRI RESOURCES LTD
ANNUAL REPORT 2017
STATISTICS OF SHAREHOLDINGSAS AT 15 MARCH 2018
LIST OF SUBSTANTIAL SHAREHOLDERS’ INTERESTS
Name of Substantial Shareholder Number of shares heldDirect
InterestDeemedInterest
Total Interest
Shareholding% **
Indofood Singapore Holdings Pte. Ltd. (“ISHPL”) 998,200,000 – 998,200,000 71.51PT Indofood Sukses Makmur Tbk (“PT ISM”) (1) 39,560,830 998,200,000 1,037,760,830 74.34CAB Holdings Limited (“CAB”) (2) – 1,037,760,830 1,037,760,830 74.34First Pacific Company Limited (“First Pacific”) (3) – 1,037,760,830 1,037,760,830 74.34First Pacific Investments Limited (“FPIL”) (4) 1,125,344 1,037,760,830 1,038,886,174 74.42First Pacific Investments (B.V.I.) Limited (“FPIL BvI”) (4) 882,444 1,037,760,830 1,038,643,274 74.41Salerni International Limited (“Salerni”) (4) (5) – 1,038,643,274 1,038,643,274 74.41Asian Capital Finance Limited (“ACFL”) (6) – 1,038,886,174 1,038,886,174 74.42Anthoni Salim (7) – 1,039,768,618 1,039,768,618 74.49
Notes:
** Percentage is calculated based on 1,395,904,530 shares (excluding treasury shares of the Company).(1) PT ISM is a holding company of ISHPL with an interest of approximately 83.84% of the total number of issued shares in ISHPL. Accordingly, PT ISM is
deemed to be interested in the Shares held by ISHPL. (2) CAB owns more than 50% of the issued share capital of PT ISM. Accordingly, CAB is deemed to be interested in the Shares held by ISHPL and PT ISM.(3) First Pacific owns 100% of the issued share capital of CAB. Accordingly, First Pacific is deemed to be interested in the Shares held by ISHPL and PT ISM.(4) FPIL, together with FPIL BVI, collectively own not less than 20% of the issued share capital of First Pacific. Accordingly, FPIL, FPIL BVI and Salerni are
deemed to be interested in the Shares held by ISHPL and PT ISM.(5) Salerni owns more than 50% of the issued share capital of FPIL BVI. Accordingly, Salerni is deemed to be interested in the Shares held by ISHPL, PT
ISM and FPIL BVI.(6) ACFL owns more than 50% of the issued share capital of FPIL. Accordingly, ACFL is deemed to be interested in the Shares held by ISHPL, PT ISM and FPIL.(7) Mr Anthoni Salim owns 100% of the issued share capital of Salerni and ACFL. Accordingly, Mr Anthoni Salim is deemed interested in the Shares held
by ISHPL, PT ISM, FPIL and FPIL BVI.
PUBLIC FLOAT
Based on the information available to the Company as at 15 March 2018, approximately 25.48% of the issued ordinary shares of the Company is held by the public. Therefore, the public float requirement under Rule 723 of the Listing Manual issued by the Singapore Exchange Securities Trading Limited is complied with.

156 INDOFOOD AGRI RESOURCES LTD
ANNUAL REPORT 2017
NOTICE IS HEREBY GIVEN that the Annual General Meeting of the Company will be held at Swissôtel Merchant Court Singapore, Merchant Court Ballroom, Section B, 20 Merchant Road, Singapore 058281, on Friday, 27 April 2018 at 3.00 p.m., to transact the following business:
AS ORDINARY BUSINESS
1. To receive and adopt the Directors’ statement and audited financial statements for the year ended 31 December 2017 and the Auditors’ Report thereon. [Resolution 1]
2 To declare a first and final tax-exempt (one-tier) dividend of 0.70 Singapore cents per share for the year ended 31 December 2017 (2016: 0.65 Singapore cents per share). [Resolution 2]
3. To approve the Directors’ Fees of S$345,000 (2016: S$345,000) for the year ended 31 December 2017.[Resolution 3]
4a. To re-elect Mr Tjhie Tje Fie, the Director who retires under Article 117 of the Company’s Constitution.[Resolution 4a]
4b. To re-elect Mr Hendra Susanto, the Director who retires under Article 117 of the Company’s Constitution.[Resolution 4b]
4c. To re-elect Mr Mark Julian Wakeford, the Director who retires under Article 117 of the Company’s Constitution.[Resolution 4c]
5. To re-appoint Messrs Ernst & Young LLP as the Company’s Auditors and to authorise the Directors to fix their remuneration. [Resolution 5]
AS SPECIAL BUSINESS
To consider and, if thought fit, to pass, with or without modifications, the following Resolutions Nos. 6 to 8 as Ordinary Resolutions and Resolution No. 9 as a Special Resolution:
6. That authority be and is hereby given to the directors of the Company to:
(i) (aa) issue shares in the Company (“Shares”) whether by way of rights, bonus or otherwise; and/or
(bb) make or grant offers, agreements or options (collectively, “Instruments”) that might or would require Shares to be issued during the continuance of this authority or thereafter, including but not limited to the creation and issue of (as well as adjustments to) warrants, debentures or other instruments convertible into Shares,
at any time and upon such terms and conditions and for such purposes and to such persons as the directors may, in their absolute discretion, deem fit; and
(ii) issue Shares in pursuance of any Instrument made or granted by the directors while such authority was in force (notwithstanding that such issue of Shares pursuant to the Instruments may occur after the expiration of the authority contained in this Resolution),
Provided that: (iii) the aggregate number of the Shares to be issued pursuant to such authority (including the Shares to be
issued in pursuance of Instruments made or granted pursuant to such authority):
(aa) by way of renounceable rights issues where shareholders of the Company (“Shareholders”) are given the opportunity to participate in the same on a pro-rata basis (“Renounceable Rights Issues”) does not exceed 100% of the total number of issued Shares (as calculated in accordance with paragraph (v) below; and
NOTICE OF ANNUAL GENERAL MEETING

157 INDOFOOD AGRI RESOURCES LTD
ANNUAL REPORT 2017
(bb) otherwise than by way of Renounceable Rights Issues (“Other Share Issues”) does not exceed 50% of the total number of issued Shares (as calculated in accordance with paragraph (v) below), and provided further that where Shareholders are not given the opportunity to participate in the same on a pro-rata basis (“non pro-rata basis”), then the Shares to be issued under such circumstances (including the Shares to be issued in pursuance of Instruments made or granted pursuant to such authority) shall not exceed 20% of the total number of issued Shares (as calculated in accordance with paragraph (v) below);
(iv) the Renounceable Rights Issues and Other Share Issues shall not, in aggregate, exceed 100% of the total number of issued Shares (as calculated in accordance with paragraph (v) below);
(v) (subject to such manner of calculation as may be prescribed by the Singapore Exchange Securities Trading Limited (the “SGX-ST”)) for the purpose of determining the aggregate number of the Shares that may be issued under paragraph (iii) above, the total number of issued Shares shall be based on the total number of issued Shares of the Company (excluding treasury shares and subsidiary holdings) at the time such authority was conferred, after adjusting for:
(aa) new Shares arising from the conversion or exercise of any convertible securities;
(bb) new Shares arising from exercising share options or the vesting of share awards which are outstanding or subsisting at the time such authority was conferred; and
(cc) any subsequent bonus issue, consolidation or subdivision of the Shares;
and, in relation to an Instrument, the number of Shares shall be taken to be that number as would have been issued had the rights therein been fully exercised or effected on the date of the making or granting of the Instrument;
(vi) in this Resolution, “subsidiary holdings” shall refer to Shares of the Company held by any subsidiary of the Company in accordance with the provisions of the Companies Act, Chapter 50 (the “Companies Act”); and
(vii) (unless revoked or varied by the Company in general meeting), the authority conferred by this Resolution shall continue in force until the conclusion of the next annual general meeting of the Company or the date by which the next annual general meeting of the Company is required by law to be held, whichever is the earlier.
[Resolution 6]
7. The proposed renewal of the shareholders’ mandate on Interested Person Transactions
That approval be and is hereby given, for the purposes of Chapter 9 of the Listing Manual of the SGX-ST, for the Company and its subsidiaries and associated companies (if any) which are considered to be “entities at risk” under Chapter 9, or any of them, to enter into any of the transactions falling within the types of Interested Person Transactions as set out in the Company’s Addendum to Shareholders dated 4 April 2018 (being an addendum to the Annual Report of the Company for the financial year ended 31 December 2017) (the “Addendum”), with any party who is of the class of Interested Persons described in the Addendum, provided that such transactions are made on normal commercial terms and in accordance with the review procedures for such Interested Person Transactions as set out in the Addendum (the “Proposed IPT Mandate”);
That the Proposed IPT Mandate shall, unless revoked or varied by the Company in general meeting, continue in force until the next annual general meeting of the Company is held or is required by law to be held, whichever is the earlier;
That the Audit & Risk Management Committee of the Company be and is hereby authorised to take such action as it deems proper in respect of the procedures and/or to modify or implement such procedures as may be necessary to take into consideration any amendment to Chapter 9 of the Listing Manual of the SGX-ST which may be prescribed by the SGX-ST from time to time; and
That the directors of the Company be and are hereby authorised to complete and do all such acts and things (including executing all such documents as may be required) as they may in their discretion deem necessary, desirable or expedient in the interests of the Company to give effect to the Proposed IPT Mandate and/or this Resolution.
[Resolution 7]
NOTICE OF ANNUAL GENERAL MEETING
158 INDOFOOD AGRI RESOURCES LTD
ANNUAL REPORT 2017
8. The proposed renewal of the Share Purchase Mandate
That:
(a) for the purposes of Sections 76C and 76E of the Companies Act, as may be amended or modified from time to time, the exercise by the directors of the Company of all the powers of the Company to purchase or otherwise acquire issued and fully paid ordinary shares of the Company (the “Shares”) not exceeding in aggregate the Prescribed Limit (as hereinafter defined), at such price or prices as may be determined by the directors of the Company from time to time up to the Maximum Price (as hereinafter defined), whether by way of:
(i) market purchases (each a “Market Purchase”) on the SGX-ST; and/or
(ii) off-market purchases (each an “Off-Market Purchase”) effected otherwise than on the SGX-ST in accordance with any equal access scheme(s) as may be determined or formulated by the directors of the Company as they consider fit, which scheme(s) shall satisfy all the conditions prescribed by the Companies Act,
and otherwise in accordance with all other laws, regulations and listing rules of the SGX-ST as may for the time being be applicable, be and is hereby authorised and approved generally and unconditionally (the “Share Purchase Mandate”);
(b) unless varied or revoked by the Company in general meeting, the authority conferred on the directors of the Company pursuant to the Share Purchase Mandate in paragraph (a) of this Resolution may be exercised by the directors of the Company at any time and from time to time during the period commencing from the date of the passing of this Resolution and expiring on the earliest of:
(i) the date on which the next annual general meeting of the Company is held; or
(ii) the date by which the next annual general meeting of the Company is required by law to be held; or
(iii) the date on which purchases or acquisitions of Shares are carried out to the full extent mandated;
(c) in this Resolution:
“Prescribed Limit” means 10% of the total number of issued Shares of the Company (excluding subsidiary holdings and any Shares which are held as treasury shares) as at the date of the passing of this Resolution; and
“Maximum Price”, in relation to a Share to be purchased, means an amount (excluding brokerage, stamp duties, applicable goods and services tax and other related expenses) not exceeding:
(i) in the case of a Market Purchase, 105% of the Average Closing Price (as defined hereinafter); and
(ii) in the case of an Off-Market Purchase, 110% of the Average Closing Price (as defined hereinafter),
where:
“Average Closing Price” means the average of the Closing Market Prices of the Shares over the last five Market Days on the SGX-ST, on which transactions in the Shares were recorded, immediately preceding the day of the Market Purchase or, as the case may be, the date of the making of the offer (as hereinafter defined) pursuant to the Off-Market Purchase, and deemed to be adjusted, in accordance with the listing rules of the SGX-ST, for any corporate action that occurs after such five-Market Day period;
“Closing Market Price” means the last dealt price for a Share transacted through the SGX-ST’s trading system as shown in any publication of the SGX-ST or other sources;
“date of the making of the offer” means the date on which the Company announces its intention to make an offer for the purchase or acquisition of Shares from shareholders of the Company, stating the purchase price (which shall not be more than the Maximum Price calculated on the foregoing basis) for each Share and the relevant terms of the equal access scheme for effecting the Off-Market Purchase;
NOTICE OF ANNUAL GENERAL MEETING

159 INDOFOOD AGRI RESOURCES LTD
ANNUAL REPORT 2017
“Market Day” means a day on which the SGX-ST is open for trading in securities; and
“subsidiary holdings” shall refer to Shares of the Company held by any subsidiary of the Company in accordance with the provisions of the Companies Act; and
(d) the directors of the Company be and are hereby authorised to complete and do all such acts and things (including executing such documents as may be required) as they may in their discretion deem necessary, desirable or expedient in the interests of the Company to give effect to the transactions contemplated by this Resolution. [Resolution 8]
9. The proposed adoption of the New Constitution of the Company
That:
(a) the regulations contained in the New Constitution submitted to this meeting, and as set out in the Addendum, be approved and adopted as the Constitution of the Company in substitution for, and to the exclusion of, the existing Constitution; and
(b) the Directors be and are hereby authorised to complete and do all such acts and things (including executing such documents as may be required) as they may consider expedient or necessary to give effect to this Resolution.
[Resolution 9]10. To transact any other routine business.
By Order of the Board
MAK MEI YOOKLEE SIEW jEE, jENNIFERCompany Secretaries
SingaporeDate: 4 April 2018
NOTICE OF ANNUAL GENERAL MEETING
160 INDOFOOD AGRI RESOURCES LTD
ANNUAL REPORT 2017
NOTES:
1. Each of the resolutions to be put to the vote of members at the Annual General Meeting (and at any adjournment thereof) will be voted on by way of poll.
2. (a) A member who is not a relevant intermediary is entitled to appoint not more than two proxies to attend, speak and vote at the Meeting. Where such member’s proxy form appoints more than one proxy, the proportion of the shareholding concerned to be represented by each proxy shall be specified in the proxy form.
(b) A member who is a relevant intermediary is entitled to appoint more than two proxies to attend, speak and vote at the Meeting, but each proxy must be appointed to exercise the rights attached to a different share or shares held by such member. Where such member’s proxy form appoints more than two proxies, the number and class of shares in relation to which each proxy has been appointed shall be specified in the proxy form.
“Relevant intermediary” has the meaning ascribed to it in Section 181 of the Companies Act, Chapter 50 of Singapore.
3. A proxy need not be a member of the Company.
4. The instrument appointing a proxy and the power of attorney, if any, under which it is signed or a notarially certified copy thereof, must be deposited at the registered office of the Company at 8 Eu Tong Sen Street, #16-96/97 The Central, Singapore 059818 not less than 48 hours before the time appointed for holding the Meeting. The sending of a proxy form by a member does not preclude him/her from attending and voting in person if he/she finds that he/she is able to do so. In such event, the relevant proxy forms will be deemed to be revoked.
EXPLANATORY NOTE TO RESOLUTION 4A:
Mr Tjhie Tje Fie is a Non-Executive Director of the Company. He is a member of the Remuneration Committee and Nominating Committee. He will, upon re-election, continue to serve as a member of each of the Remuneration and Nominating Committees.
EXPLANATORY NOTE TO RESOLUTION 4B:
Mr Hendra Susanto is an Independent Director of the Company and he is also member of the Audit & Risk Management Committee and the Nominating Committee. He will, upon re-election, continue to serve as a member of the Audit & Risk Management and the Nominating Committees.
EXPLANATORY NOTE TO RESOLUTION 4C:
Mr Mark Julian Wakeford is an Executive Director and the Chief Executive Officer (“CEO”) of the Company. He will, upon re-election, continue to serve as a member of the Board and CEO.
EXPLANATORY NOTES ON SPECIAL BUSINESS TO BE TRANSACTED:
The ordinary resolution proposed in item (6) above, if passed, will empower the directors of the Company from the date of the above Meeting until the next Annual General Meeting, to issue shares and to make or grant instruments (such as warrants or debentures) convertible into shares, and to issue shares in pursuance of such instruments, up to a number not exceeding (i) 100 per cent. for Renounceable Rights Issues, and (ii) 50 per cent. for Other Share Issues (the “50% Limit”), with a sub-limit (“Sub-Limit”) of 20 per cent. for issues other than on a pro rata basis to all Shareholders provided that the total number of Shares which may be issued pursuant to (i) and (ii) shall not exceed 100% of the total number of issued shares in the capital of the Company (excluding treasury Shares and subsidiary holdings) at the time that the Resolution in passed. For the purpose of determining the aggregate number of shares that may be issued, the percentage of issued shares shall be based on the total number of issued shares in the capital of the Company (excluding treasury shares and subsidiary holdings) at the time that the resolution (6) above is passed, after adjusting for (a) new shares arising from the conversion or exercise of any convertible securities or share options or vesting of share awards which are outstanding or subsisting at the time that the resolution (6) is passed, and (b) any subsequent bonus issue, consolidation or subdivision
NOTICE OF ANNUAL GENERAL MEETING
161 INDOFOOD AGRI RESOURCES LTD
ANNUAL REPORT 2017
of shares. This authority will, unless previously revoked or varied at a general meeting, expire at the next Annual General Meeting of the Company or the date by which the next Annual General Meeting of the Company is required by law to be held, whichever is the earlier. The authority for the 100% Limit is proposed pursuant to Practice Note 8.3 issued by the SGX-ST on 13 March 2017, which was aimed at widening the available fund-raising avenues of issuers that may be facing challenges amid the then current uncertainties and the tightening of financial conditions. Under Practice Note 8.3, the SGX-ST has decided to modify the requirement under Rule 806(2) of the SGX-ST Listing Manual to provisionally raise the limit for renounceable rights issues from 50% to 100% (“Enhanced Rights Issue Limit”), subject to the conditions set out in the Practice Note. The Enhanced Rights Issue Limit will take effect from 13 March 2017 until 31 December 2018 by which date the shares issued pursuant to the Enhanced Rights Issue Limit must be listed. The board of directors of the Company is of the view that the Enhanced Rights Issue Limit is in the interests of the Company and its Shareholders.
Shareholders should note that presently, the controlling shareholders of the Company include First Pacific Company Limited and PT Indofood Sukses Makmur Tbk, which are listed on the Hong Kong Stock Exchange Limited and the Indonesia Stock Exchange (Bursa Efek Indonesia), respectively. Prior to any exercise of the authority conferred upon them by the ordinary resolution in item (6) above, the directors of the Company intend to take into account, inter alia, any approval that may be required from any such controlling shareholders and/or their respective shareholders and/or from such stock exchanges.
For practical reasons and in order to avoid any violation of the securities legislation applicable in countries other than Singapore, the offering documents for the issue of shares and Instruments pursuant to such authority may NOT be despatched to Shareholders with registered addresses outside Singapore as at the applicable books closure date and who have not, by the stipulated period prior to the books closure date, provided to The Central Depository (Pte) Limited or the Share Registrar, as the case may be, with addresses in Singapore for the service of notices and documents.
The ordinary resolution proposed in item (7) above, if passed, will empower the directors of the Company to enter into Interested Person Transactions, more information of which is set out in the Addendum. Such authority will, unless revoked or varied by the Company in general meeting, continue in force until the next Annual General Meeting of the Company and Shareholders’ approval will be sought for its renewal at every Annual General Meeting of the Company.
The ordinary resolution proposed in item (8) above, if passed, will empower the directors of the Company to make purchases (whether by way of market purchases or off-market purchases on an equal access scheme) from time to time of up to 10 per cent. of the total number of issued Shares as at the date of the above Meeting at the price up to but not exceeding the Maximum Price (as defined in the Resolution). The rationale for the Share Purchase Mandate, the source of funds to be used for the Share Purchase Mandate, the impact of the Share Purchase Mandate on the Company’s financial position, the implications arising as a result of the Share Purchase Mandate under The Singapore Code on Take-overs and Mergers and on the listing of the Company’s Shares on the SGX-ST, as well as the number of Shares purchased by the Company in the previous twelve months are set out in the Addendum.
The special resolution proposed in item (9) above, if passed, will result in the adoption of a New Constitution in substitution for, and replacement of, the Company’s existing Constitution. The New Constitution contains regulations that take into account the wide-ranging changes to the Companies Act, Chapter 50 introduced by the Companies (Amendment) Act 2014, the Companies (Amendment) Act 2017, and other updates to the regulatory framework. Please refer to the Addendum for more details.
PERSONAL DATA PRIvACY:
By submitting an instrument appointing a proxy(ies) and/or representative(s) to attend, speak and vote at the Annual General Meeting and/or any adjournment thereof, a member of the Company (i) consents to the collection, use and disclosure of the member’s personal data by the Company (or its agents or service providers) for the purpose of the processing, administration and analysis by the Company (or its agents or service providers) of proxies and representatives appointed for the Annual General Meeting (including any adjournment thereof) and the preparation and compilation of the attendance lists, minutes and other documents relating to the Annual General Meeting (including any adjournment thereof), and in order for the Company (or its agents or service providers) to comply with any applicable laws, listing rules, take-over rules, regulations and/or guidelines (collectively, the “Purposes”), (ii) warrants that where the member discloses the personal data of the member’s proxy(ies) and/or representative(s) to the Company (or its agents or service providers), the member has obtained the prior consent of such proxy(ies) and/or representative(s) for the collection, use and disclosure by the Company (or its agents or service providers) of the personal data of such proxy(ies) and/or representative(s) for the Purposes, and (iii) agrees that the member will indemnify the Company in respect of any penalties, liabilities, claims, demands, losses and damages as a result of the member’s breach of warranty.
NOTICE OF ANNUAL GENERAL MEETING

162 INDOFOOD AGRI RESOURCES LTD
ANNUAL REPORT 2017
NOTICE OF BOOKS CLOSURE
NOTICE IS HEREBY GIvEN that subject to the approval of the shareholders for the Final Dividend being obtained at the Annual General Meeting, the Share Transfer Books and Register of Members of Indofood Agri Resources Ltd will be closed at 5.00 p.m. on 08 May 2018 for the purpose of determining shareholders’ entitlements to the proposed Final Dividend and shall reopen on the following working day.
Duly completed and stamped registrable transfers received by the Company’s Registrar, Boardroom Corporate & Advisory Services Pte. Ltd., at 50 Raffles Place #32-01 Singapore Land Tower, Singapore 048623 up to 5.00 p.m. on 08 May 2018 will be registered to determine shareholders’ entitlements to the said dividend. Members whose securities accounts with The Central Depository (Pte) Limited are credited with shares as at 5.00 p.m. on 08 May 2018 will be entitled to the proposed Final Dividend.
Payment of the Final Dividend, if approved by the members at the AGM to be held on 27 April 2018, will be made on 22 May 2018.
NOTICE OF ANNUAL GENERAL MEETING

PROXY FORMINDOFOOD AGRI RESOURCES LTD.
(Company Registration No. 200106551G)(Incorporated in the Republic of Singapore)
IMPORTANT
1. Relevant intermediaries as defined in Section 181 of the Companies Act, Chapter 50 of Singapore, may appoint more than two (2) proxies to attend, speak and vote at the Meeting.
2. For CPF/SRS investors who have used their CPF/SRS monies to buy shares of Indofood Agri Resources Ltd., this form of proxy is not valid for use and shall be ineffective for all intents and purposes if used or purported to be used by them. CPF/SRS investors should contact their respective Agent Banks/SRS Operators if they have any queries regarding their appointment as proxies.
3. By submitting an instrument appointing a proxy(ies) and/or representative(s), the member accepts and agrees to the personal data privacy terms set out in the Notice of Annual General Meeting dated 4 April 2018.
I/We (Name) (NRIC/Passport/Co. Reg No.)
of (Address)
being a *member/members of Indofood Agri Resources Ltd., hereby appoint:
Name Address NRIC/Passport Number
Number of Shares Represented
Proportion of Shareholdings (%)
and/or (delete as appropriate)
or failing him/her, the Chairman of the Meeting as my/our proxy/proxies to vote for me/us on my/our behalf at the Annual General Meeting of the Company to be held Swissôtel Merchant Court Singapore, Merchant Court Ballroom, Section B, 20 Merchant Road, Singapore 058281 on Friday, 27 April 2018 at 3.00 p.m., and at any adjournment thereof.
The proxy is required to vote as indicated with an “X” on the resolutions set out in the Notice of Meeting and summarised below. If no specific direction as to voting is given, the proxy/proxies may vote or abstain at his discretion.
No. Resolution For AgainstORDINARY BUSINESS 1. To receive and adopt the Directors’ statement and audited financial statements for the
year ended 31 December 2017 and the Auditor’s Report thereon.2. To declare a first and final tax-exempt (one-tier) dividend of 0.70 Singapore cents per
share for the year ended 31 December 2017 (2016: 0.65 Singapore cents per share).
3.To approve the Directors’ Fees of S$345,000/- (2016: S$345,000/-) for the year ended 31 December 2017.
4a. To re-elect Mr Tjhie Tje Fie, the Director who retires under Article 117 of the Company’s Constitution.
4b. To re-elect Mr Hendra Susanto, the Director who retires under Article 117 of the Company’s Constitution.
4c. To re-elect Mr Mark Julian Wakeford, the Director who retires under Article 117 of the Company’s Constitution.
5. To re-appoint Messrs Ernst & Young LLP as the Company’s Auditors and to authorise the Directors to fix their remuneration.
SPECIAL BUSINESS6. To approve the general mandate for issues of shares.7. To approve the proposed renewal of the Mandate for Interested Person Transactions.8. To approve the proposed renewal of the Share Purchase Mandate.9. The proposed adoption of the New Constitution of the Company.
Signed this day of 2018.
Signature(s) of Member(s)/Common Seal

Notes:
(a) A member who is not a relevant intermediary (as defined in Section 181 of the Companies Act, Chapter 50 of Singapore) is entitled to appoint not more than two proxies to attend, speak and vote at the Annual General Meeting. Where such member’s proxy form appoints more than one proxy, the proportion of the shareholding concerned to be represented by each proxy shall be specified in the proxy form.
(b) A member who is a relevant intermediary (as defined in Section 181 of the Companies Act, Chapter 50 of Singapore) is entitled to appoint more than two proxies to attend, speak and vote at the Annual General Meeting, but each proxy must be appointed to exercise the rights attached to a different share or shares held by such member. Where such member’s proxy form appoints more than two proxies, the number and class of shares in relation to which each proxy has been appointed shall be specified in the proxy form.
(c) A proxy need not be a member of the Company.
(d) A member appointing the Chairman of the Meeting as his/her proxy, must indicate how he/she wishes the Chairman to vote on his/her behalf for Resolution No. 7. Otherwise, the Chairman shall abstain from voting on this resolution.
(e) The instrument appointing a proxy shall be in writing under the hand of the appointor or of his attorney duly authorised in writing or, if such appointor is a corporation, under its common seal or under the hand of its attorney. A body corporate which is a member may also appoint an authorised representative or representatives in accordance with its Constitution and Section 179 of the Companies Act, Chapter 50 of Singapore, to attend and vote for and on behalf of such body corporate.
(g) The instrument appointing a proxy must be deposited at the registered office of the Company at 8 Eu Tong Sen Street, #16-96/97 The Central, Singapore 059818 not less than 48 hours before the time appointed for holding the meeting. The sending of a proxy form by a member does not preclude him/her from attending and voting in person if he/she finds that he/she is able to do so. In such event, the relevant proxy forms will be deemed to be revoked.
(f) The Company shall be entitled to reject a Proxy Form which is incomplete, improperly completed, illegible or where the true intentions of the appointor are not ascertainable from the instructions of the appointor specified on the Proxy Form. In addition, in the case of shares entered in the Depository Register, the Company may reject a Proxy Form if the member, being the appointor, is not shown to have shares entered against his name in the Depository Register as at 72 hours before the time appointed for holding the Meeting, as certified by The Central Depository (Pte) Limited to the Company.
Personal Data Privacy
By attending the Annual General Meeting of the Company and/or any adjournment thereof or submitting an instrument appointing a proxy(ies) and/or representative(s), the member accepts and agrees to the personal data privacy terms set out in the Notice of Annual General Meeting dated 4 April 2018.


8 Eu Tong Sen Street,
#16-96/97 The Central, Singapore 059818
Tel: +65 6557 2389 Fax: +65 6557 2387
Company Reg. No. 200106551G
a subsidiary of: