emerging issues in food safety - choices magazine online · emerging issues in food safety sandra...
TRANSCRIPT

4 CHOICES 2ndQuarter2009•24(2)
The magazine of food, farm, and resource issues
©1999–2009 CHOICES. All rights reserved. Articles may be reproduced or electronically distributed as long as attribution to Choices and the Agricultural &Applied Economics Association is maintained. Choices subscriptions are free and can be obtained through http://www.choicesmagazine.org.
AAEAAgricultural & AppliedEconomics Association
A publication of the Agricultural & Applied Economics Association
Emerging Issues in Food SafetySandra Hoffmann and Neal H . Hooker
We live in a country that has a globalized food market and high consumer expectations for safety and product in-novation. Fifty years ago, fresh California spinach served on plates in New York in November would be a luxury. Now it’s common place. Forty years ago, most areas had local slaughter houses and small scale butchers were com-mon. Thirty years ago, fresh peaches from Chile on Min-nesota grocery shelves in January were a rarity. Even fifteen years ago, few would expect that the United States would today import over 40% of its fruit, 15% of its vegetables and 80% of its fish and seafood.
We also live in a world that no longer takes food safety for granted. The European BSE incidents of 1990s led to reorganization of food safety authorities across Canada, Europe, Australia, and New Zealand, though not here in the United States. Highly publicized outbreaks of food-borne disease from more commonplace pathogens, like Salmonella and E. coli as well as international supply chain failures due to product adulteration are putting pressure on the U.S. Congress for major reform. In the United States, another response has been efforts to promote locally pro-duced food, in part, based on safety. But these remain small scale efforts. Most Americans are likely to continue to get most of the food they eat from large scale, commercial sup-pliers.
Given data limitations, we may never know whether food today is safer or more hazardous than it was in the past. One thing is certain, the system is different. Prob-lems that were once local are now increasingly national or international and they are increasingly visible. Distance, increased diversity of sources and products, and consumer demand for minimally processed ready-to-eat foods—all of these factors contribute to the complexity and challenge of keeping the food supply safe.
The papers in this Choices theme identify and exam-ine some of the impacts of this increased complexity on
consumers and producers. They also review efforts the government and industry are making to respond. In the background of many of these responses lie large scale in-stitutional reforms to develop governance structures which can manage safety in our increasingly complex food supply system.
In the public sector, there has been what may be an un-paralleled level of international coordination and technical cooperation. Under the umbrella of the United Nations Food and Agricultural Organization and the World Health Organization (Codex Alimentarius Commission), govern-ments and their technical experts are making progress to-ward a consensus on the basic elements of a modern risk management framework for food safety. Such a consensus is critical to safety in a world of globalized food supply markets. Several of the articles in this issue discuss specific actions that are part of the U.S. effort to build such a risk-based food safety system consistent with its trade commit-ments through the World Trade Organization Sanitary and
Articles in this Theme:
Knowing Which Foods Are Making Us Sick . . . . . . . . . . 6
FDA Refusals of Food Imports by Exporting Country Group . . . . . . . . . . . . . . . . . . . . . 11
Food Safety and Defense Risks in the U.S.-Mexico Produce Supply Chain . . . . . . . . . . . . . . . . . . . . . . . . 16
Public Response to Large-Scale Produce Contamination . . . . . . . . . . . . . . . . . . . . . . 21
E. coli Outbreaks Affect Demand for Salad Vegetable. . . . . . . . . . . . . . . . . . . . . . . . . . . . . 26

2ndQuarter2009•24(2) CHOICES 5
Phytosanitary Agreement.Market incentives have also
pushed industry to develop innovative governance mechanisms. European food markets are increasingly domi-nated by large retailers whose exten-sive international supply chains are governed by contractual relationships with specific safety requirements. Wal-Mart and other food retailers are developing similar structures in the United States. The companies that lead these large supply chains, as well as smaller firms who supply particular products, are increasingly turning to new information technology to help tighten control over inventory and safety. Several of the articles in this issue of Choices look to such new in-formation technologies and how they can assist decision makers.
In the first article, Hoffmann ex-plains the challenges faced by public health authorities in estimating the level of foodborne illness in the Unit-ed States and identifying its sources. She describes some of the innovative efforts underway to establish better systems of tracking foodborne illness and the ways this information can be used to develop more effective and efficient food safety policy. This is a challenging process, requiring a de-tailed exploration of federal, state and local data aided by expert elicitation to help fill in gaps. Such ranking exer-cises can highlight those target patho-gens, foods, consumer populations or institutions that are most in need of additional innovation.
Buzby and Regmi examine FDA import retention data to assess what available evidence can tell us about distribution of food safety problems across importing countries and prod-ucts. Their study highlights a neces-sary feature of this sort of analysis—that proxies or indirect indicators of food safety risk are often the best or
only information available. Though practical as a regulatory approach, de-cisions made based on these proxies must be validated against actual risks to ensure public health goals are at-tained.
Nganje and his coauthors explore one example of this approach—the use of electronic sensors and Threat, Vulnerability, and Consequence Pre-vention (TVCP) assessment in an ef-fort to improve U.S.-Mexican border produce inspection practices. The authors provide evidence of how food safety and defense priorities may be jointly addressed by a suite of public-private programs.
The final two papers assess con-sumer issues surrounding responses to food safety information. Cutie and Hallman describe two sets of survey data assessing knowledge and behav-ior changes in response to the 2006 spinach and 2008 tomato and pepper advisories. They find that while con-sumers appeared to be well informed about the events, they were confused about key details and some chose to disregard the advice. Fahs, Mittel-hammer and McCluskey use scanner data from food retailers in 10 western states to assess the impact of the 2006 advisory on sales of spinach, substi-tute and complementary products. They find that consumers substituted other products for spinach during, and even after, the advisory. Subse-quent produce events had similar ef-fects on demand.
Several themes can be drawn from this set of studies of emerging food safety issues. Both government and the private sector have a press-ing need for greater precision of data to help them meet the risk manage-ment challenges of an increasingly complex food supply. This informa-tion should be detailed by product associated with the contamination,
by contaminant, by stage of the sup-ply chain, and by affected population. The articles also point to promising contributions that can be made by life sciences and information technology in meeting these information needs. Additional research is needed to bet-ter characterize where vulnerabilities tend to arise in the food system so that private management and public policy can be tailored to focus control efforts more efficiently.
Our increasingly global food sup-ply requires trans-national efforts to better coordinate standards and in-spection protocols. The data collected through audits are of great value and efforts to share such among supply chain partners and regulatory agen-cies should be pursued. This leads to a perennial concern—the interac-tion between voluntary and manda-tory systems. Recent efforts to better understand the role of coregulation in the control of food safety risks, particularly within this international trade environment, have great po-tential, but need additional analysis. Finally, we need to better understand, and when necessary know how to change, consumer food safety behav-iors. This is a nascent field but one that is vital, for the best designed risk mitigation strategies will not be effec-tive without an appreciation of how consumers respond.
Sandra Hoffmann ([email protected]) is a Fellow with Resources for the Fu-ture and Neal H. Hooker ([email protected]) is an Associate Professor in the Department of Agricultural, Environ-mental and Development Economics, The Ohio State University.
The views offered are those of the au-thors and should not be attributed to Resources for the Future or to The Ohio State University.

6 CHOICES 2ndQuarter2009•24(2)
The magazine of food, farm, and resource issues
©1999–2009 CHOICES. All rights reserved. Articles may be reproduced or electronically distributed as long as attribution to Choices and the Agricultural &Applied Economics Association is maintained. Choices subscriptions are free and can be obtained through http://www.choicesmagazine.org.
AAEAAgricultural & AppliedEconomics Association
A publication of the Agricultural & Applied Economics Association
Knowing Which Foods Are Making Us SickSandra Hoffmann
JEL Classifications: D18, I18
Over the past three years, USA Today has run a major story on a food safety problem almost every month. U.S. consumers may be a bit shell shocked by the barrage of headlines warning of foodborne pathogens (disease-caus-ing organisms) or harmful chemicals. American consum-ers—as well as those in the agriculture and food processing industries—are undoubtedly asking, what next? Prediction is always difficult. Unfortunately, with foodborne illness it is even difficult to say which foods have been the biggest problem in the past. The reasons are actually as simple as these: the evidence gets eaten or thrown out, illness may follow food consumption by days or even years, and hu-man memory, particularly when trying to remember what one had for dinner even three days ago, is frail. Just as un-fortunately, it is important to know which foods caused the most illnesses in the past in order to reduce illness in the future.
This article focuses on foodborne illnesses caused by pathogens (bacteria, viruses, and parasites that can con-taminate foods and cause illnesses). It explores why it is important to know which pathogens on which foods are causing illness in the U.S. and why we don’t know more than we do about this relationship. It then looks at what is being done to improve our estimates of the numbers of illnesses associated with particular pathogens and foods and how federal agencies can use this knowledge to help improve food safety in the United States.
Importance of Knowing Which Foods Are Riskiest There are compelling substantive reasons—for all parties involved—to want to invest time and effort in developing information on the sources of foodborne illness. Consum-ers need to know how to handle foods safely, and many also would like information about the relative riskiness of particular foods to guide their purchase decisions. Produc-
ers would like to know whether the types of foods they produce are likely to be the next story on the front page of The New York Times so they can develop strategies to avoid potential financial risk. Supply chain managers want to know about the relative riskiness of the different sources of a product so they can appropriately weigh the costs and benefits of each source. Governments want to know about the relative riskiness of foods to effectively design laws and target efforts to protect the public from health risks.
There are also important procedural reasons for want-ing quantitative data on the sources of foodborne illness—reasons related to assuring that regulations are actually needed and do not unfairly burden trade. Both industry and consumers are often concerned about special interests having undue influence on government agencies or about government agencies writing rules that favor one firm over another. To help assure that regulations are even-handed and serve their legislative purpose, the Administrative Pro-cedures Act requires federal agencies to show a basis in fact for new regulations. Similar issues arise in international trade. Under the Sanitary and Phytosanitary Agreement that the United States signed as part of the Uruguay Round of trade talks, signatory countries are encouraged to adopt standards developed cooperatively through the interna-tional Codex Alimentarius Commission. If they choose to adopt stricter standards, they must be supported by scien-tific evidence or risk imposition of trade sanctions.
Government agencies in the United States and abroad rely on formal risk assessment as a primary means of un-derstanding how health risks arise in the food supply. Risk assessment is a process of quantifying and modeling the pathway from contamination through exposure to health outcomes. It typically relies on dose-response relationships to predict illnesses or deaths. Risk assessment methods were initially developed in the context of managing chemi-

2ndQuarter2009•24(2) CHOICES 7
of the outbreak, the investigations do try to identify both the pathogen and the food sources involved. Some-times, as in last summers’ tomato and jalapeño pepper Salmonella outbreak, the fact that foods contain more than one ingredient, along with recall is-sues, pose challenges to investiga-tors. OutbreakNet data collection is national in scope, but outbreaks are estimated to account for only about 10% of total foodborne illness, so the vast majority of foodborne illnesses are not captured by outbreak inves-tigations. Further, studies show that cases of illnesses associated with out-breaks and those that are scattered, or sporadic cases of illness (the other 90% of foodborne illness), may not follow the same pattern of association with foods (Mead, et al. 1999).
OutbreakNet is now aided by PulseNet. PulseNet is a national net-work of state, local and federal public health laboratories with the capacity to genetically “fingerprint” foodborne pathogens using pulsed-field gel elec-trophoresis. Participating laboratories subtype (or “fingerprint”) bacteria from suspect human and food sam-ples. These genetic “fingerprints” are then entered into an electronic data-base. Both the laboratory and CDC analyze the database regularly looking for statistical patterns of multiple oc-currences of the same pathogen. This system has increased the rate of out-break detection over the conventional clinician reporting system. This is par-ticularly important because the struc-ture of the food supply has changed. With wide national and international distribution of food, outbreaks may involve small numbers of cases spread over wide distances—something con-ventional clinician based outbreak detection is less likely to pick up. But it also means that part of the apparent increase in outbreaks is an increase in detection.
FoodNet began in 1995 and is a collaborative program including CDC, 10 of the U.S.’s most active
cal and radiological hazards where dose-response relationships can be estimated using laboratory tests on animals and extrapolated to human populations. When efforts were made to extend this paradigm to microbial foodborne hazards in the early 1990s, it became apparent that the use of a dose-response function would be a stumbling block. Estimating a patho-gen dose-response relationship is dif-ficult because pathogens tend to be species specific, and human testing is considered to be unethical. An alter-native is to estimate disease incidence from epidemiological data and then attribute it back to the source of in-fection—in other words, a food attri-bution estimate.
Determining Riskiest Foods is DifficultDespite the need for food attribution estimates, it is difficult to get them. There are two basic reasons for this. First, it is difficult to estimate the in-cidence of foodborne illness. Second, it is difficult to attribute these illness-es to their sources.
There is a great deal of uncertainty in estimates of the number of cases of foodborne illness in the United States. each year. This is not unique to the United States. Health statis-tics depend heavily on reporting by physicians and medical laboratories. Most cases of foodborne illness are probably mild and never show up at a doctor’s office. When someone with foodborne illness does seek medical attention, the physician or medical laboratory may not report the illness to public health authorities. Even if a case of foodborne illness is reported to public health authorities, it may be identified only as a case of infectious disease not specifically foodborne in-fection. This results in significant un-derreporting of foodborne illness. The Centers for Disease Control scientists estimate that for many pathogens, only one in 38 cases of foodborne ill-ness are reported (Mead et al. 1999).
There is even greater uncertainty about the food sources of foodborne illness. Food safety managers and public health officials need to know which pathogens on which foods are making people sick. Physicians can determine which pathogen made a patient sick by ordering a laboratory test. Often tests are not ordered be-cause they are more useful for public health surveillance than for patient care. Even if a physician suspects that an illness is foodborne, it will typi-cally be difficult to pinpoint the food. Individuals’ ability to recall the foods they ate is notoriously poor. There may be a few days delay between in-fection and illness. Then it is a guess as to which food was actually associ-ated with the illness. Again, there is usually no clinical reason to investi-gate the matter further.
Assessing the Riskiness of FoodsIn part in response to these report-ing problems, CDC and state public health surveillance authorities have developed three major foodborne illness surveillance programs—Out-breakNet, PulseNet and FoodBorne Diseases Active Surveillance Network (FoodNet). While these systems pro-vide information that is useful about the sources of foodborne illness, fur-ther work is needed to make them truly useful for food attribution in policy analysis.
The oldest of these three programs is OutbreakNet. An outbreak of in-fectious disease is the occurrence of multiple cases of illness associated with a single source of infection in a limited time period. An example is the recent peanut product-associated outbreak of Salmonellosis. The pur-pose of outbreak investigation is to gather information needed to stop the spread of an infectious disease outbreak. Like clinical data from visits to physicians, data from out-break investigations is reactive, not proactive, in nature. But because the purpose is to prevent further spread

8 CHOICES 2ndQuarter2009•24(2)
of outbreak and case-control study data. Microbiologists also continue to work on the problem of developing predictive dose-response models for human foodborne pathogens.
In the absence of hard data, judg-ment-based estimates are also used. Usually, this is done informally. Cur-rent estimates attributing the inci-dence of foodborne illness to specific pathogens rely heavily on the expert judgments of a group of researchers at the Centers for Disease Control and Prevention to fill gaps in the litera-ture (Mead, et al. 1999). More formal methods are being developed. Evi-dence-based medicine has developed a set of criteria for evaluating studies through systematic literature reviews that are used to identify best clinical practices (Cochrane Collaboration, 2009). Risk analysis in environmen-tal and safety policy has long relied on structured elicitations of expert judg-ment for subjective estimates of miss-ing parameter values (Morgan and Henrion, 1990; Cooke and Schrader-Frechette, 1991).
What Do Experts Say about Food Risks?Recently, colleagues and I conducted an expert elicitation on foodborne ill-ness source attribution as part of an effort to develop a foodborne illness risk ranking model for use in broad federal-level policy evaluation. Forty two of the country’s leading food safety experts participated in the sur-vey. These experts were able to draw on a broad range of knowledge to inform their judgments—knowledge of microbial ecology, food science, consumption patterns, and food han-dling practices as well as epidemio-logical data. For each of 11 prevalent foodborne pathogens, experts were asked to provide their best judgments of the percentage of cases caused by the pathogen that is associated with consumption of different food cat-egories in a typical year (Hoffmann, et al. 2007a; 2007b). They were
also provided 90% credible intervals around their best judgments. The food categories spanned the food sup-ply. We then applied these percentag-es to CDC estimates of the incidence of illness, hospitalization and death caused by each pathogen to estimate the cases of foodborne illness caused by the pathogen on different foods. These estimates were examined in-dividually and aggregated to provide estimates of foodborne illness by food categories.
The purpose of the study was three-fold. First, we needed a con-sistent set of estimates—spanning all foods—of the association of food-borne illness with food consumption. Second, we aimed to capture infor-mation on sporadic illnesses as well as outbreaks. And third, we intended to assess the extent of agreement among experts and the degree of confidence that food safety experts have in their own understanding of the association between foodborne illness and the consumption of specific foods.
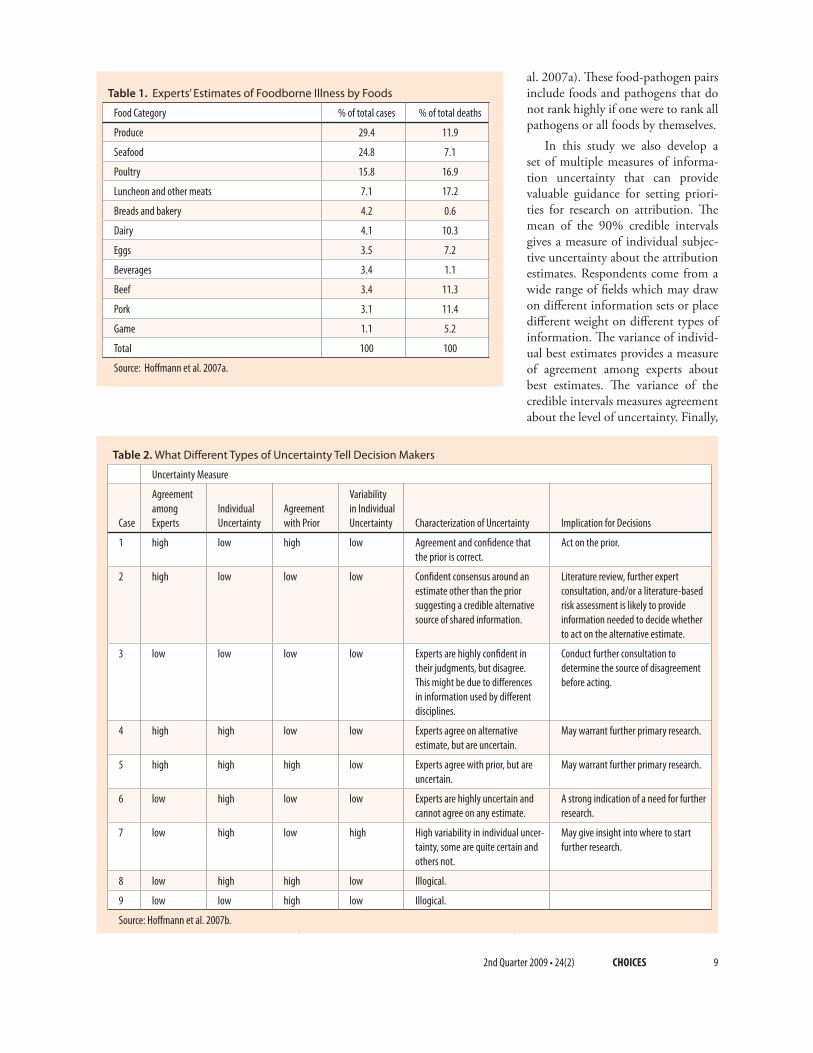
The most marked finding is the relatively high public health impact of a small number of pathogens and foods. Results from Mead et al. (1999) indicate that the three highest ranked pathogens account for 96.9% of all foodborne illnesses. Our results suggest that incidence is also highly concentrated by food. Four foods (produce, seafood, poultry and ready-to-eat meats) accounted for 60% of all illnesses, 59% of all hospitaliza-tions and 46% of all deaths (Hoff-mann et al. 2007a).
The results also show the impor-tance of focusing public and private intervention efforts on particular pathogen/food combinations. A small number of food-pathogen pairs account for most of the public health burden from foodborne pathogens. Fifteen out of 121 food-pathogen pairs accounted for 90% of all ill-nesses; 25 pairs accounted for 90% of hospitalizations and 21 pairs account-ed for 90% of deaths (Hoffmann et
state health departments, USDA and FDA. FoodNet conducts active surveillance of nine pathogens, and one syndrome. In addition, FoodNet conducts epidemiologic and popu-lation studies to better understand factors that may have contributed to illness. One example of an epide-miologic study that FoodNet uses is case-control studies which match a population of ill patients with statis-tically similar subjects who are not ill. Interviews are used to determine behaviors and consumption patterns within a specific time period. Statisti-cal comparisons are used to identify factors that may have contributed to developing the illness. Though data provides valuable additional infor-mation for attribution assessments it also has limitations. As with outbreak investigations, dietary recall can be a problem. The fact that the number of states involved is small and the states self-select for participation may lead to biased estimates. In addition the fact that the studies tend to be fairly specific in focus, makes it difficult to use FoodNet data by themselves to gain an aggregate picture of the distri-bution of foodborne illness across the food supply. Expansion of FoodNet and PulseNet programs could provide better surveillance data on the sources of foodborne illness, but there is also a need for research and development targeted specifically at getting better attribution estimates
A number of efforts are underway within federal agencies to adapt this data or to create new data to meet the need for attribution estimates (Batz, et al. 2005). Most of these efforts are targeted at specific regulatory needs. For example, the Food Safety Inspec-tion Service is working on attribution of Salmonellosis to food products un-der its jurisdiction using a sampling and genetic subtyping protocol devel-oped in Denmark. CDC is working on two food-system-wide approach-es, one based on outbreak case data that could be updated in real time, and another that relies on a blend
2ndQuarter2009•24(2) CHOICES 9
al. 2007a). These food-pathogen pairs include foods and pathogens that do not rank highly if one were to rank all pathogens or all foods by themselves.
In this study we also develop a set of multiple measures of informa-tion uncertainty that can provide valuable guidance for setting priori-ties for research on attribution. The mean of the 90% credible intervals gives a measure of individual subjec-tive uncertainty about the attribution estimates. Respondents come from a wide range of fields which may draw on different information sets or place different weight on different types of information. The variance of individ-ual best estimates provides a measure of agreement among experts about best estimates. The variance of the credible intervals measures agreement about the level of uncertainty. Finally,
Table 1. Experts’ Estimates of Foodborne Illness by Foods
Food Category % of total cases % of total deaths
Produce 29.4 11.9
Seafood 24.8 7.1
Poultry 15.8 16.9
Luncheon and other meats 7.1 17.2
Breads and bakery 4.2 0.6
Dairy 4.1 10.3
Eggs 3.5 7.2
Beverages 3.4 1.1
Beef 3.4 11.3
Pork 3.1 11.4
Game 1.1 5.2
Total 100 100
Source: Hoffmann et al. 2007a.
Table 2. What Different Types of Uncertainty Tell Decision Makers
Uncertainty Measure
Case
Agreement among Experts
Individual Uncertainty
Agreement with Prior
Variability in Individual Uncertainty Characterization of Uncertainty Implication for Decisions
1 high low high low Agreement and confidence that the prior is correct.
Act on the prior.
2 high low low low Confident consensus around an estimate other than the prior suggesting a credible alternative source of shared information.
Literature review, further expert consultation, and/or a literature-based risk assessment is likely to provide information needed to decide whether to act on the alternative estimate.
3 low low low low Experts are highly confident in their judgments, but disagree. This might be due to differences in information used by different disciplines.
Conduct further consultation to determine the source of disagreement before acting.
4 high high low low Experts agree on alternative estimate, but are uncertain.
May warrant further primary research.
5 high high high low Experts agree with prior, but are uncertain.
May warrant further primary research.
6 low high low low Experts are highly uncertain and cannot agree on any estimate.
A strong indication of a need for further research.
7 low high low high High variability in individual uncer-tainty, some are quite certain and others not.
May give insight into where to start further research.
8 low high high low Illogical.
9 low low high low Illogical.
Source: Hoffmann et al. 2007b.

10 CHOICES 2ndQuarter2009•24(2)
a comparison with attribution esti-mates based on outbreak case data measures the extent to which experts believe outbreak case data accurately captures food source attribution. De-mographic data on the experts was used to test for systematic patterns in the measures.
Taken together these uncertainty measures provide a means of char-acterizing the quality of information available about attribution by patho-gens, foods, and food/pathogen pairs (Hoffmann et al. 2007b). There are some food/pathogen pairs, such as Vibrio on seafood, where experts’ best judgments are highly correlated with each other and with the outbreak-based attribution estimate, and their mean credible interval is narrow with low variance. There are others, like Campylobacter on produce where the mean and variance of the credible in-tervals are small, but the correlation between expert judgment and out-break data is low. This is a case where experts agree that outbreak data does not provide a good attribution esti-mate, but have agreement based on other information. Then there are cases such as Toxoplasma on many foods where expert best estimates are not highly correlated with each other or the outbreak based estimate, and the mean and variance of the cred-ible intervals are relatively high. Here there is evidence of poor information on attribution. This information on uncertainty on attribution provides part of the foundation for a value-of-information approach to deciding where to invest in further research and data collection on disease surveil-lance.
Federal Food Safety Policy and Attribution EstimatesU.S. agencies are proposing to or are currently making use of food attribu-tion estimates in a number of ways including risk-based inspections, health-based performance standards, and the rationalization of federal food
For More InformationBatz, M., Doyle, M. P., Morris, J.G.
Jr., Painter, J., Singh, R., Tauxe, R, Taylor, M., Lo Fo Wong, D., Food Attribution Working Group. (2005). Attributing illness to food. Emerging Infectious Dis-eases, 11(7), 993-999.
Cooke, R.M., and Schrader-Fre-chette, K. (1991). Experts in un-certainty: opinion and subjective probability in science. Oxford, U.K: Oxford University Press.
Cochrane Collaboration. (2009).Cochrane Reviews. Available on-line: http://www.cochrane.org/reviews/
Hoffmann, S., Fischbeck, P., Krupnick, A., and McWilliams, M. (2007a). Using expert elicita-tion to link foodborne illnesses in the United States to food. Journal of Food Protection, 70(5), 1220-1229.
Hoffmann, S., Fischbeck, P., Krupnick, A., and McWilliams, M. (2007b). Elicitation from large, heterogeneous expert pan-els: using multiple uncertainty measures to characterize informa-tion quality for decision analysis. Decision Analysis, 4(2), 91-109.
Mead, P.S., Slutsker, L., Dietz, V., McCaig, L.F., Bresee, J.S., Sha-piro, C., Griffin, P, Tauxe, R. (1999). Food-related illness and death in the United States. Emerg-ing Infectious Diseases, 5, 607-625.
Morgan, M.G., and Henrion, M. (1990). Uncertainty: a guide to dealing with uncertainty in quan-titative risk and policy analysis. Cambridge, U.K: Cambridge University Press.
de Swarte, C., and Donker, R.A. (2005). Towards an FSOP/ALOP based food safety policy. Food Control, 16, 825-830.
Sandra Hoffmann ([email protected]) is a fellow at Resources for the Future, Washington, D.C.
safety policy. In an effort to priori-tize the use of limited inspection re-sources, FDA’s Food Protection Plan includes risk-based targeting of in-spection of both domestic plants and imports. USDA’s Food Safety Inspec-tion Service has also proposed risk-based inspections of domestic meat-processing and slaughter facilities. Both efforts have proven controver-sial. Consumer groups have expressed concern that a move from random or uniform allocation of inspection re-sources to risk-based allocation may not ensure product safety and that existing data are not adequate to sup-port the shift. Consumer groups and others including the Government Accountability Office and the Codex Alimentarius Food Hygiene Commit-tee would like to see HACCP regula-tions designed to meet specific pub-lic health goals. But this will require empirical estimates of the relation-ship between different levels of food contamination and foodborne illness. Source attribution estimates may play a role here (de Swarte and Donker, 2005).
Closing ObservationsOne would think that every indus-trialized country would have good information on how foodborne ill-ness is distributed across the food supply. But data on this relationship are more difficult to collect than one might imagine. Changes in interna-tional trade law have also made the collection of such data more crucial than it may have been in the past. Governments around the world, in-cluding the United States, have made a focused effort over the past 10 to 15 years to improve the quality of infor-mation on the distribution of food-borne illness across foods. Eventually, this information will help both gov-ernment agencies and private firms do a more effective, more efficient job of protecting the public from food-borne illness. But for now, a great deal of work remains to be done.

The magazine of food, farm, and resource issues
©1999–2009 CHOICES. All rights reserved. Articles may be reproduced or electronically distributed as long as attribution to Choices and the Agricultural &Applied Economics Association is maintained. Choices subscriptions are free and can be obtained through http://www.choicesmagazine.org.
2ndQuarter2009•24(2) CHOICES 11
AAEAAgricultural & AppliedEconomics Association
A publication of the Agricultural & Applied Economics Association
FDA Refusals of Food Imports by Exporting Country GroupJean C . Buzby and Anita Regmi
JEL Classifications: F1, I18, Q17
U.S. food imports grew rapidly in recent years, and some of the fastest growing imports came from the developing countries. Brooks, Buzby, and Regmi (2009) found that the share of total U.S. food imports from high-income countries declined from 51% in 2002 to 47% in 2007. In general, four-fifths of the total U.S. food imports from high-income countries are sourced either from Canada or the European Union. The loss of market share for these countries was accompanied by a growth in U.S. import market share for developing countries, particularly mid-dle-income countries, such as Mexico, Chile, and China. In many cases, lower-income countries may not have as extensive or effective food safety standards, practices, and regulations in place as those in the United States or in other more developed countries. This challenges their food safety systems to keep pace with the growth in their food exports.
Buzby, Unnevehr, and Roberts (2008) analyzed U.S. Food and Drug Administration (FDA) refusals of food imports between 1998 and 2004 due to violations of the laws FDA enforces. These laws mostly cover product adul-teration, such as unsafe chemical residues and microbial contamination, and misbranding, such as inadequate label-ing. Given the growth in food imports, particularly from developing countries, there is a need to closely examine the nature of U.S. food import growth and the correlation between FDA import refusals and different levels of eco-nomic development of exporting countries.
How Was the Study Conducted?We analyzed FDA data on refusals of food offered for im-portation into the United States during 1998 to 2004 by food industry group and by type of violation to see if there was a correlation between import source and FDA import refusals. Here, the term violation refers to products that ap-
pear to violate one or more of the laws enforced by FDA. Imports of most meat products fall under the jurisdiction of USDA’s Food Safety and Inspection Service (FSIS) and not FDA’s, so only a few meat products are recorded in the FDA import refusals data.
In order to properly interpret the FDA data, it is im-portant to understand that import violations do not neces-sarily imply that a particular product posed food safety or other risks but rather they highlight problems associated with certain products, manufacturers/shippers, and coun-tries that appear to recur in trade and where the FDA has focused its import alerts and monitoring efforts (see Figure 1). FDA relies on risk-based criteria to guide its actions, in-cluding data on products and manufacturers with a history of violating U.S. import regulations. Because FDA looks more closely where there have been problems in the past, there will be a higher incidence of refusals for some prod-ucts, manufacturers/shippers, and countries. A violation or a refusal of a shipment does not necessarily mean that there was a violative product, but rather that the product appeared to be violative in FDA’s judgment. According to England (2000): Section 801(a) of the Food, Drug, and Cosmetic act, “gives the authority to FDA to refuse admis-sion of any article that “appears” to be in violation” of one of the laws enforced by FDA. “The significance of the ap-pearance standard under FDA law is that the Government is NOT required to prove an ACTUAL VIOLATION of law or the regulations has occurred. Rather, the FDA must be able to show that there exists an “appearance” of a vio-lation to refuse admission of goods. The appearance of a violation may arise by the examination of physical samples, a field examination, review of entry documents, or based upon the history of prior violative shipments made from the same shipper.”

12 CHOICES 2ndQuarter2009•24(2)
The World Bank’s list of econo-mies (July 2006 version) was used to identify the distribution of all im-port violations among low-, lower middle-, upper middle-, and high-income countries. We consider high-income countries to represent devel-oped countries and the other three groups to represent developing coun-tries. We examined commodity and country level trade data from the U.S. Department of Commerce for fiscal years 1998–2007 to understand the volume and value of food trade from different countries and to estimate the number of violations per billion dollars of imports.
What Did We Find?Of the 70,366 FDA violations for food during 1998–2004, 70,333 identified the country of origin for the food shipment. In general, there were roughly twice as many viola-tions in each of the last three years of the data than in each of the previ-ous four years. Some of this growth may reflect the strengthening of the reporting system in later years. The distribution of FDA violations across the country groups somewhat mir-rors the distribution for the value of total U.S. food imports across simi-lar groups of source countries. As the
developed country share of food im-port value started to decrease in 2002, their share of the total number of FDA import violations also began to decline from 38% in 2002 to 29% in 2004 (Figure 2). The share attributed to low-income countries increased fairly consistently over the period, from 12% in 1998 to 15% in 2002, and 18% in 2004, while the share for lower middle-income countries has generally been rising since its low in 2000. Meanwhile the share of total FDA violations for upper middle-income countries appears to be on a declining trend, perhaps indicative of improving food standards, regula-tions, and practices.
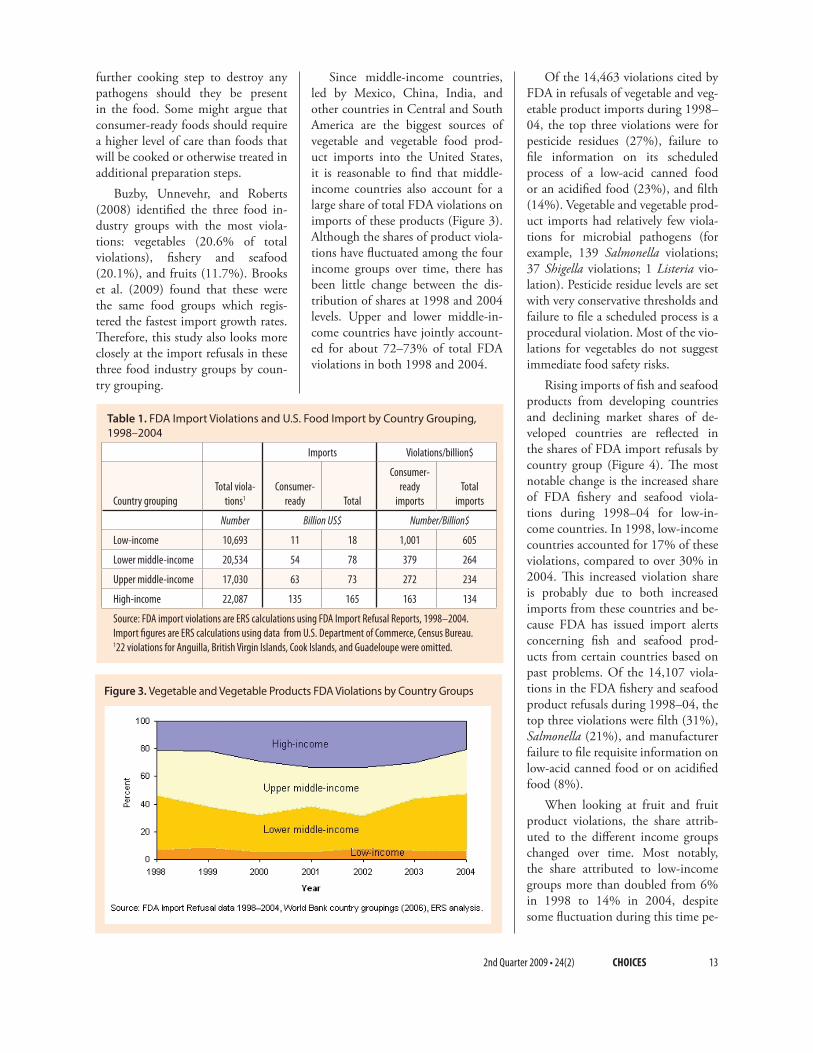
In addition to higher growth in the number of import refusals dur-ing 2002–04, developing countries also registered a greater number of FDA refusals per billion dollars of U.S. food imports during 1998–04 (Table 1). The estimate is highest for low-income countries at 605 import refusals per billion dollars, followed by lower middle-income countries at 264 refusals per billion dollars. This finding helps support the need to tar-get capacity building and technical assistance to less-developed countries that export food to the United States. For example, the number of viola-tions due to package labeling that were incomplete or not in English could be reduced in the future with greater clarity of U.S. import require-ments and greater capacity building. Additionally, information sharing on good agricultural and manufacturing practices can help reduce the contam-ination of food with filth and micro-bial pathogens.
Total imports in billions of dollars and the number of import violations per billion dollars are also presented by country group for consumer-ready foods (Table 1). This is important for food safety reasons because these foods include items, such as fruit, vegetables, meat, seafood, and pro-cessed foods, that may not have a
Figure 1. Import Alerts and Detention without Physical Examination
Import alerts were developed by the FDA to communicate guidance for import coverage to FDA personnel in field offices, as well as to identify and disseminate import information on problems and violative trends. Import alerts facilitate uniform and effective import coverage. They identify problem products and/or manufacturers/shippers, such as those that have met the criteria for detention withoutphysicalexamination.ThesealertsarepostedonFDA’sImportAlertRetrievalSystem(FIARS)ontheirwebsite(www.fda.gov/ora/fiars/ora_import_alerts.html).Example: Import Alert 21-03 calls for increased surveillance of all dried apricots and apricot paste from all countries because of historical problems with insect and rodent filth.Detention without physical examination (DWPE) is a notice in an import alert that means that subsequent shipments for a specific product and manufacturer/shipper will be refused entry into U.S. commerce unless evidence is presented, such as test results, to FDA proving the item meetssafetyrequirements(FDA,CFSAN,Feb./March2002).Example: Import Alert 16-81 calls for detention without physical examination of specific seafood products due to Salmonella contamination from specific manufacturers/shippers in several countries, including, frozen rock lobster tails from a specific firm in Brazil and frozen shrimp from a specific firm in Vietnam.
Figure 2. Share of Total FDA Import Violations by Country Groups
2ndQuarter2009•24(2) CHOICES 13
further cooking step to destroy any pathogens should they be present in the food. Some might argue that consumer-ready foods should require a higher level of care than foods that will be cooked or otherwise treated in additional preparation steps.
Buzby, Unnevehr, and Roberts (2008) identified the three food in-dustry groups with the most viola-tions: vegetables (20.6% of total violations), fishery and seafood (20.1%), and fruits (11.7%). Brooks et al. (2009) found that these were the same food groups which regis-tered the fastest import growth rates. Therefore, this study also looks more closely at the import refusals in these three food industry groups by coun-try grouping.
Since middle-income countries, led by Mexico, China, India, and other countries in Central and South America are the biggest sources of vegetable and vegetable food prod-uct imports into the United States, it is reasonable to find that middle-income countries also account for a large share of total FDA violations on imports of these products (Figure 3). Although the shares of product viola-tions have fluctuated among the four income groups over time, there has been little change between the dis-tribution of shares at 1998 and 2004 levels. Upper and lower middle-in-come countries have jointly account-ed for about 72–73% of total FDA violations in both 1998 and 2004.
Of the 14,463 violations cited by FDA in refusals of vegetable and veg-etable product imports during 1998–04, the top three violations were for pesticide residues (27%), failure to file information on its scheduled process of a low-acid canned food or an acidified food (23%), and filth (14%). Vegetable and vegetable prod-uct imports had relatively few viola-tions for microbial pathogens (for example, 139 Salmonella violations; 37 Shigella violations; 1 Listeria vio-lation). Pesticide residue levels are set with very conservative thresholds and failure to file a scheduled process is a procedural violation. Most of the vio-lations for vegetables do not suggest immediate food safety risks.
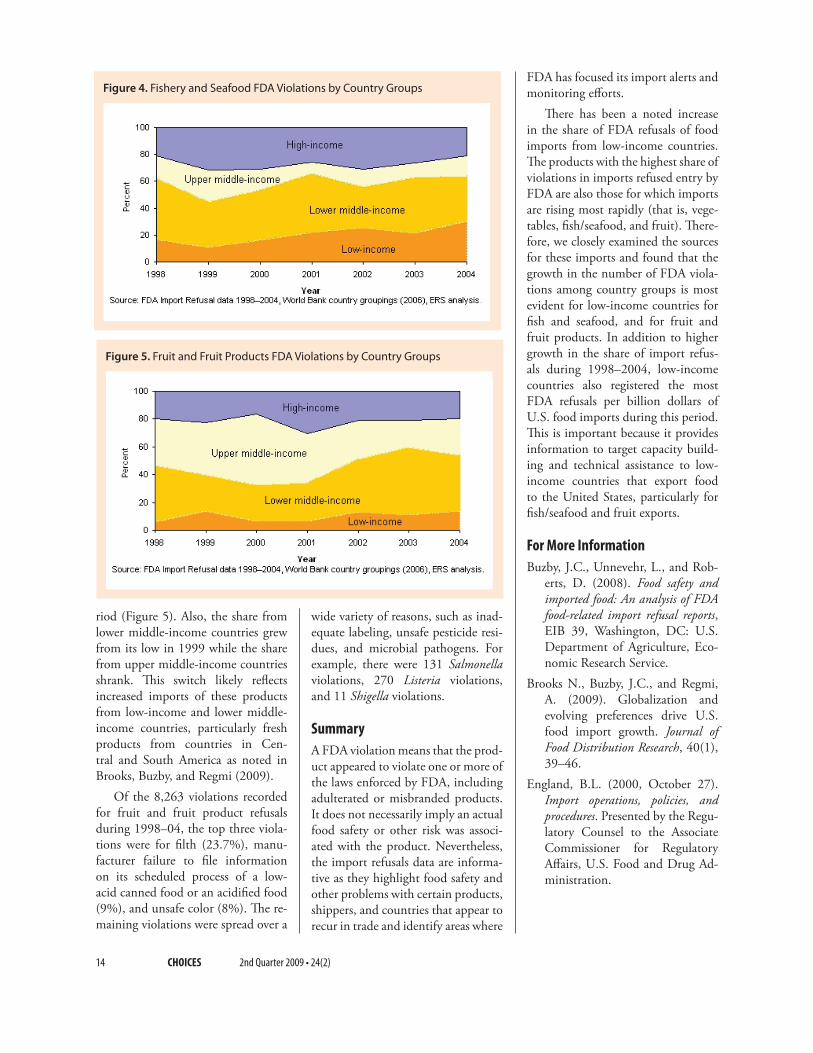
Rising imports of fish and seafood products from developing countries and declining market shares of de-veloped countries are reflected in the shares of FDA import refusals by country group (Figure 4). The most notable change is the increased share of FDA fishery and seafood viola-tions during 1998–04 for low-in-come countries. In 1998, low-income countries accounted for 17% of these violations, compared to over 30% in 2004. This increased violation share is probably due to both increased imports from these countries and be-cause FDA has issued import alerts concerning fish and seafood prod-ucts from certain countries based on past problems. Of the 14,107 viola-tions in the FDA fishery and seafood product refusals during 1998–04, the top three violations were filth (31%), Salmonella (21%), and manufacturer failure to file requisite information on low-acid canned food or on acidified food (8%).
When looking at fruit and fruit product violations, the share attrib-uted to the different income groups changed over time. Most notably, the share attributed to low-income groups more than doubled from 6% in 1998 to 14% in 2004, despite some fluctuation during this time pe-
Table 1. FDA Import Violations and U .S . Food Import by Country Grouping, 1998–2004
Imports Violations/billion$
Country groupingTotal viola-
tions1
Consumer-ready Total
Consumer-ready
importsTotal
imports
Number Billion US$ Number/Billion$
Low-income 10,693 11 18 1,001 605
Lower middle-income 20,534 54 78 379 264
Upper middle-income 17,030 63 73 272 234
High-income 22,087 135 165 163 134
Source:FDAimportviolationsareERScalculationsusingFDAImportRefusalReports,1998–2004. Import figures are ERS calculations using data from U.S. Department of Commerce, Census Bureau. 122 violations for Anguilla, British Virgin Islands, Cook Islands, and Guadeloupe were omitted.
Figure 3. Vegetable and Vegetable Products FDA Violations by Country Groups
14 CHOICES 2ndQuarter2009•24(2)
riod (Figure 5). Also, the share from lower middle-income countries grew from its low in 1999 while the share from upper middle-income countries shrank. This switch likely reflects increased imports of these products from low-income and lower middle-income countries, particularly fresh products from countries in Cen-tral and South America as noted in Brooks, Buzby, and Regmi (2009).
Of the 8,263 violations recorded for fruit and fruit product refusals during 1998–04, the top three viola-tions were for filth (23.7%), manu-facturer failure to file information on its scheduled process of a low-acid canned food or an acidified food (9%), and unsafe color (8%). The re-maining violations were spread over a
wide variety of reasons, such as inad-equate labeling, unsafe pesticide resi-dues, and microbial pathogens. For example, there were 131 Salmonella violations, 270 Listeria violations, and 11 Shigella violations.
SummaryA FDA violation means that the prod-uct appeared to violate one or more of the laws enforced by FDA, including adulterated or misbranded products. It does not necessarily imply an actual food safety or other risk was associ-ated with the product. Nevertheless, the import refusals data are informa-tive as they highlight food safety and other problems with certain products, shippers, and countries that appear to recur in trade and identify areas where
FDA has focused its import alerts and monitoring efforts.
There has been a noted increase in the share of FDA refusals of food imports from low-income countries. The products with the highest share of violations in imports refused entry by FDA are also those for which imports are rising most rapidly (that is, vege-tables, fish/seafood, and fruit). There-fore, we closely examined the sources for these imports and found that the growth in the number of FDA viola-tions among country groups is most evident for low-income countries for fish and seafood, and for fruit and fruit products. In addition to higher growth in the share of import refus-als during 1998–2004, low-income countries also registered the most FDA refusals per billion dollars of U.S. food imports during this period. This is important because it provides information to target capacity build-ing and technical assistance to low-income countries that export food to the United States, particularly for fish/seafood and fruit exports.
For More InformationBuzby, J.C., Unnevehr, L., and Rob-
erts, D. (2008). Food safety and imported food: An analysis of FDA food-related import refusal reports, EIB 39, Washington, DC: U.S. Department of Agriculture, Eco-nomic Research Service.
Brooks N., Buzby, J.C., and Regmi, A. (2009). Globalization and evolving preferences drive U.S. food import growth. Journal of Food Distribution Research, 40(1), 39–46.
England, B.L. (2000, October 27). Import operations, policies, and procedures. Presented by the Regu-latory Counsel to the Associate Commissioner for Regulatory Affairs, U.S. Food and Drug Ad-ministration.
Figure 5. Fruit and Fruit Products FDA Violations by Country Groups
Figure 4. Fishery and Seafood FDA Violations by Country Groups

2ndQuarter2009•24(2) CHOICES 15
The Word Bank. (2006). World De-velopment Indicators. Available online: http://devdata.worldbank.org/wdi2006/contents/index2.htm
U.S. Department of Commerce, Bu-reau of the Census, Foreign Ag-ricultural Service. (2008). U.S. trade internet system. Available online: http://www.fas.usda.gov/ustrade/.
U.S. Food and Drug Administra-tion (FDA). (2009). Import alert retrieval system (FIARS), Available online: www.fda.gov/ora/fiars/ora_import_alerts.html.
U.S. Food and Drug Administra-tion (FDA). (2007, April 1 re-vision). Code of federal regula-tions, Title 21, Volume 6, CITE: 21CFR582.20.
Jean C. Buzby ([email protected]) and Anita Regmi ([email protected]) are both economists with the U.S. Department of Agriculture’s Economic Research Service, Washing-ton, D.C.

16 CHOICES 2ndQuarter2009•24(2)
The magazine of food, farm, and resource issues
©1999–2009 CHOICES. All rights reserved. Articles may be reproduced or electronically distributed as long as attribution to Choices and the Agricultural &Applied Economics Association is maintained. Choices subscriptions are free and can be obtained through http://www.choicesmagazine.org.
AAEAAgricultural & AppliedEconomics Association
A publication of the Agricultural & Applied Economics Association
Food Safety and Defense Risks in U.S.-Mexico Produce TradeWilliam Nganje, Timothy Richards, Jesus Bravo, Na Hu, Albert Kagan, Ram Acharya, and Mark Edwards
JEL Classifications: I18, I28, L51
The demand for Mexican-grown fruits and vegetables in the United States is increasing because off-season demand is not being met by domestic production. Approximately 6.2 billion pounds of fresh fruits and vegetables were im-ported from Mexico to the United States in 2005, 6.49 billion pounds in 2006 and 7.24 billion pounds in 2007 (USDA-FAS, 2008). The large volume of fresh produce imports introduces food safety and food defense risks all along the supply chain. Food safety policy has convention-ally addressed prevention of unintentional contamination of food and economic adulteration (Acheson, 2007). Food defense policy reduces the likelihood or impact of inten-tional contamination to cause harm. These could include a wide range of actors from disgruntled employees to inter-national terrorists. In this article, we evaluate the use of in-telligent inspection systems to mitigate both types of risks.
The Food and Drug Administration (FDA) inspects about 1% of the imported foods it regulates at the border due to resource limitations, down from 8% in 1992 when imports were far less common (U.S. CBP, 2008). Ideally, an inspection procedure should protect food imports from outbreaks of food-borne illnesses that may cause recalls. However, due to limited resources, high volumes and bor-der facility limitations, it is impossible to inspect all pro-duce at the Port of Entry (POE) with a random inspection system, which may require the selection of representative samples. Intelligent systems could alleviate some of these challenges and improve the safety of imported foods.
Science-based intelligent inspection systems have been used in a variety of fields in engineering and manufacturing. The general idea is to develop highly adaptive inspection methodologies, which over time can incorporate on-line sensors. For example, the COOLTRAX (http://www.cool-trax.com) system provides real time “journey based” data on temperature, vibration and geographical position linked
to an internet data base that can be accessed by multiple entities and agencies. Information on produce shipments can be shared and used to target inspection resources to high risk cargos. If a truck is diverted from its normal route and tampered with, causing temperature changes that may result in higher levels of produce spoilage and pathogen growth, that load can be designated as a high risk cargo and inspected accordingly. This can also address other problems related to drug trafficking with produce shipments.
In this article we use a threat, vulnerability and conse-quence prevention (TVCP) model to evaluate the effective-ness of current inspection procedures and tools. We then discuss how on-going preliminary findings on the use of intelligent systems support their use to improve the safety of imported produce from Mexico. Intelligent systems could address issues related to information sharing, cost-effective use of limited resources, and mitigating potential market failure problems in food imports.
Food Safety/Defense Risks and Market FailureWe now know that food safety/defense failures can cause complete market failure. Historically, firms may have con-sidered supply chain risks and protection in the context of the potential threats and disruptions to their own op-erations. However, the interconnectedness of firms, prod-ucts and transportation infrastructure in high-speed global supply chains multiplies the potential costs of these risks. When limited inspection resources are not efficiently dis-tributed, market failure may arise from negative externali-ties or from the failure of public agencies to provide the minimum acceptable level of safety. Negative externalities may occur when some participants in the supply chain implement a food safety measure but yet are impacted by a food recall due to problems caused by others who have not implemented similar recommended measures. When

2ndQuarter2009•24(2) CHOICES 17
inspection systems fail to mitigate ill-ness outbreaks from food pathogens, then food recalls and illness outbreaks can be attributed to a government failure of the responsible domestic or international agencies.
Recent outbreaks from interna-tional sources are consequences of market failure. These examples in-clude the 2008 Salmonella enterica outbreak of fresh jalapeño and serrano peppers from Mexico which caused at least 1,329 cases of salmonellosis food poisoning in 43 states throughout the United States, 257 hospitalizations and two deaths; the 2003 green onion Hepatitis A outbreak with over 650 cases in four states and four deaths (Clark, 2005); and the loss of the can-taloupe market in the United States for most growers in Mexico following repeated outbreaks of Salmonella in 1997 and 2000. Chalk (2003) notes that in the last century, there were 12 documented cases where pathogenic agents were used to infect livestock or contaminate food intentionally.
Inspection by government agen-cies is a major strategy to minimize outbreaks and resolve market failure problems. The U.S. Department of Agriculture can inspect produce at foreign farms or in foreign country packing and processing facilities. In this inspection program, however, their focus is more on ensuring com-pliance with quality and grading stan-dards rather than pathogen testing. The Food and Drug Administration conducts pathogen testing at the Port-of-Entry at the same time as various other state and federal agencies which are charged with providing protec-tions from various other problems. The involvement of multiple agen-cies responsible to ensure the safety of imported foods creates additional administrative challenges like infor-mation sharing and identifying high risk imports from multiple risk fac-tors such as location, pest, pathogens, and chemical agents. While TVCP is only a public policy instrument, it is
helpful to explore how it is a response to fundamental economic problems in the industry, addressing structural causes of market failure that are per-vasive in supply chains of all types. Adoption of intelligent systems may allow more efficient use of limited re-sources and minimize market failure risk from food imports.
Evaluating Import Safety with the TVCP FrameworkThe Threat, Vulnerability and Con-sequence Prevention (TVCP) frame-work is an extension of the Threat, Vulnerability and Consequence (TVC) analysis used extensively in event modeling by the U.S. Navy, Department of Homeland Security, and the Environmental Protection Agency (Cox, 2008). Threats are weak links along the supply chain. Vulnerabilities are those threats that could not be eliminated with alterna-tive risk mitigation strategies. Conse-quence prevention puts the emphasis on prevention or risk premiums in-dustry is willing to pay for alternative risk mitigation technologies. Several important risk analyses now utilize the TVC framework in setting priori-ties for protecting U.S. infrastructures against terrorist attacks based on the formula: Risk=Threat×Vulnerability ×Consequence.
One distinction between the TVCP and TVC analyses is that the former focuses on risk mitigating preventive measures that allow for resource allocation while the later fo-cuses on aggregate consequence in the event of a food safety recall and food terrorism attack. The TVCP can be structured as a two-level, or multiple-level, hierarchical optimization model to evaluate risk mitigation alterna-tives. In such two-level optimization models, participants along the sup-ply chain can determine in level one whether or not to test for pathogens or chemical agents and in level two determine the optimal sampling in-tensity or sample size based on alter-native capacity limitations. Figure 1 presents a schematic representation of the TVCP framework and the accom-panying box defines the terminology used. This extension of the TVC is more appropriate in analyzing and mitigating potential food safety and food defense risks.
Assessment of Threat and Vulner-abilityCurrently, the Nogales Port-of-Entry (POE) uses a risk-based sampling process for selecting high and low risk samples. However, the level of inspection for each commodity is based on analysis of crop pest risks. Food safety/food defense risk factors
Figure 2. Conceptual TVCP Framework, Hu, 2008.
Estimates of probability of contamination with alternative intervention strategies (e.g. CARVER+ Shock, C-TPAT & FAST, HACCP, etc.)
Testing and sampling
Value of risk reduction
Target commodity, pest or pathogen
Estimates of probability of contamination at threat points (based supply chain model).
High risk produce
Low risk produce
Assessment of vulnerability Consequence prevention
Assessment of threat
Figure 1. Conceptual TVCP Framework, Hu, 2008 .

18 CHOICES 2ndQuarter2009•24(2)
are not explicitly incorporated in the current risk based sampling process. Other public and private sector ini-tiatives currently used at the Nogales POE to categorize commodities into high and low risks and to address food safety and food terrorism threats and vulnerabilities have been devel-oped in recent years by USDA, FDA and the Department of Homeland Security. Examples are the CARVER plus Shock approach, the Custom Trade Partnership against Terrorism (C-TPAT) and Fast and Secure Trade (FAST) (see Figure 2). These tools have broader applications not related solely to agriculture and food trade.
We conducted a study that cus-tomized the U.S. Department of Ag-riculture’s Food Safety and Inspection Service (USDA-FSIS) “Food Safety/Defense Plan Assessment Survey” to identify the threats and vulnerability along the U.S.-Mexico produce sup-ply chain. The survey had six major sections to elicit information on the gaps in food protection for each par-ticipant along the international food supply chain. Data was collected on
1) CARVER plus Shock, C-TPAT and FAST usage; 2) type and volume of commodities grown, processed, and distributed; 3) availability and usage of security measures (person-nel, inside plant, outside plant, wa-ter, ingredient and chemical storage security); 4) pathogen and chemical testing; 5) knowledge and perception of risks; and 6) demographic factors. The survey was extensively reviewed, pilot tested, and translated into Span-ish to ensure content validity. A ran-dom sample was used to collect the data representing all participants along the supply chain. Data were collected from 403 growers and grow-er employees, 84 truckers and trucker employees, and 55 distributors and packers. Six major commodities were examined: peppers, watermelons, to-matoes, green onions, broccoli, and oranges.
Statistical and stochastic simula-tion analyses were used to assess the risk each participant poses to the sup-ply chain and the vulnerability of the system. Threat or risk along the sup-ply chain was measured by whether or
not participants were C-TPAT/FAST certified or to what degree they have implemented components of these programs. The simulation model was used to determine vulnerability or optimal testing and sampling inten-sity that could minimize food safety and defense threats. The model was used to determine whether or not to test at a particular location, and if so, at what intensity or sample size.
Results revealed that most par-ticipants were not C-TPAT/FAST certified but they do implement com-ponents of these programs, indicat-ing moderate risk levels or threats. Trucking constitutes the greatest vulnerability to not implementing components of C-TPAT/FAST with 50.62% threat probability. Grower/packers follow with 29.62% prob-ability and finally distributors have the lowest threat probability with 19.76%. This indicates that targeting intelligent inspection systems on the trucking segment could significantly improve food protection for the U.S.-Mexico produce supply chain. For each participant, personnel security
Figure 2. Description of CARVER + Shock, C-TPAT, and FAST
Program & Definition Description
CARVER plus Shock CARVER: Criticality—measures public health and economic impacts of a system attack; Accessibility—ability to physically access protectedassets(target);Recuperability—abilityofthesystem(channel)torecoverfromanattack;Vulnerability–easeofac-complishing an attack; Effect —amount of direct loss from an attack as measured by loss in production; and Reconcilability – ease of identifying the target. In addition, the modified CARVER tool evaluates a seventh attribute, the combined health, economic, and psychological impacts of an attack, or the Shock attributes of a terrorist event upon the targeted assets.
C-TPAT TheCustoms-TradePartnershipAgainstTerrorism(C-TPAT)isajointvoluntarygovernment-businessinitiativetobuildcooperativerelationshipsthatstrengthenandimproveoverallinternationalsupplychainoperationsandU.S.bordersecurity(U.S.CBP,2008).Throughthisinitiative,CustomsandBorderProtection(CBP)asksbusinessestoensuretheintegrityoftheirsecuritypracticesandcommunicate and verify the security guidelines of their business partners within the supply chain.
FAST FASTallowsU.S./CanadaandU.S./Mexicopartneringimportersexpeditedreleaseforqualifyingcommercialshipments”(U.S.CBP,2008).Atthesouthernborder,theFASTprogramisavoluntaryinitiativebetweentheU.S.andMexicodesignedtoensuresecurityand safety while enhancing the economic prosperity of both countries. The initial phase of FAST for United States and Mexico bound commercial shipments began on Sept. 27, 2003 at the Port of El Paso, Texas. By Aug. 31, 2006, the FAST program was expanded to 14POEsonthesouthernborder.TobeeligibleforjoiningtheFASTprogram,participantssuchasdrivers,carriers,importersandsouthern border manufacturers are asked to submit an application, a C-TPAT member agreement, and undergo a security profile assessment dependent upon their role in the C-TPAT. For instance, the vehicle driver only needs to submit the application; however, the carrier has to submit a C-TPAT Highway Carrier agreement with the application to prove that the firm is a certified C-TPAT partner. An importer or southern border manufacturer has to submit the “Importer Security Profile” or “Supply Chain Security Profile” form to supplement the other required documents. The C-TPAT/FAST programs qualify those known low-risk participants for receiving expedited border processing access.
(CARVER + Shock Primer, 2009)

2ndQuarter2009•24(2) CHOICES 19
and inside plant security contributed the most variability or threat while outside plant and storage security followed with less threat probability. For inside plant security and person-nel security, not many firms perform background checks of their employees and most do not have cameras located in processing and storage areas. Most participants do have facilities that are secured or have outside plant secu-rity to prevent entry by unauthorized persons, hence lowering threat. Also, visitors are not allowed easy access to produce storage areas.
Consequence Prevention The simulation model used to assess vulnerability was used simultaneously to derive the risk premium (expected net returns minus a certainty equiva-lent return) or value of risk reduc-tion from C-TPAT/FAST usage for each low or high risk produce. The use of net returns, to derive the risk premium, enables us to evaluate cost-effectiveness of the C-TPAT/FAST programs. The simulation model was built using data from the survey and additional data on shipment flows and prices for fresh fruits and veg-etables from 1998 to 2007 obtained from the USDA’s Agricultural Mar-keting Service Fruit and Vegetable Market News. Lot size, or the truck trailer compartment capacity, is as-sumed to be 40,000 lbs. per ship-ment delivering fresh produce across the U.S.-Mexico border.
Our results show that in order to appropriately mitigate food safety and defense risks, USDA’s Food Safety Inspection Service should be testing almost 24% of peppers, 44% of wa-termelons, and 44.27% of tomatoes compared to inspecting less than 1% of commodities based on crop pest risk. It should also be noted that even though all trucks containing products that post a high risk for crop pests are currently inspected, only 2%-3% of the boxes within each truck are in-spected. Further, foods that have ex-
perienced food safety outbreaks and recalls in recent years like peppers and green onions are not viewed as high risk under the current system’s focus on crop pest risks.
However, simply increasing or de-creasing the total sample size without considering time and facility limita-tions may not be an optimal solu-tion to the inspection problem. With available resources, it will be impossi-ble to inspect 24% or 44% of imports as results indicate. Intelligent systems on trucks to provide safety informa-tion from “journey based” data could be more effective, given that trucking presents the greatest source of food defense risk for produce imported from Mexico.
Intelligent Systems and Cost-Effec-tiveness of Inspection ProcessesTo determine whether intelligent systems could be more effective at detecting food defense risks and to test their usefulness in evaluating food safety risks, we installed three COOLTRAX and ACR SmartBut-ton units on trucks carrying fresh fruits and vegetables from Mexico to the United States. Each unit cost approximately $880, including $680 for the unit and $200 for installation and monthly data access. Throughout the journey from farm to the border, the units sent real-time data on tem-perature, location, and vibration to a secured location on the internet. The data can be used to reevaluate the consequence prevention model. The units also capture data pertinent to the inspection decision problems faced by the federal agents at the U.S. POE. The collected data can also be used to evaluate performance of the supply chain, allowing improvement of delivery times and minimizing temperature fluctuations that may encourage pathogen growth. Infor-mation gained from intelligent sys-tems can also be used by government inspectors to efficiently allocate lim-ited resources to higher risks cargos
compared to inefficient allocation that may be based on increasing ran-dom sample size for inspection.
Preliminary results from analysis of the journey data indicate that in-telligent systems could minimize the cost of two types of errors. The first type of error occurs when a truck is declared “safe” and allowed to proceed into the United States when, in fact, its contents are not safe. This type of error is a kind of market failure risk, called buyer risk. Such “buyer risks” resulted in last summers’ outbreaks of Salmonellosis associated with jalapeno and serano peppers from Mexico. The second type of error occurs when a truck’s load is declared “not-safe” and authorities impede its movement into the United States when in fact the contents are safe. This second type of inspection error creates market failure risks called seller risk. Several false alarms occur during inspection at the border causing millions of dol-lars of losses to participants along the U.S.-Mexico produce supply chain. An example of a false alarm is the jalapeño peppers outbreak that was first attributed to tomatoes. Prelimi-nary results suggest that a decrease in food protection risks, with the use of intelligent systems, will lead to a de-crease in both buyer and seller risks and improve the cost-effectiveness of the inspection process.
Policy ImplicationsPolicies leaning towards increasing sample size and the number of micro-bial tests will not optimally improve the safety of imported produce. In-specting every container arriving at U.S.-Mexico POEs would be neither physically possible nor cost-effective. The United States cannot build bor-der facilities that will enable the in-spection of all produce shipments or the sample sizes determined in our analysis, due to resource limitations and facility constraints.
Real-time intelligent technologies offer the promise of more efficient

20 CHOICES 2ndQuarter2009•24(2)
monitoring of safety in the U.S.-Mex-ico produce supply chain. This moni-toring could be useful to both private industry and government agencies charged with assuring the safety of these imports into the United States. Further analysis is required to assess optimal deployment of these technol-ogies, but our research indicates they are technologically effective. Partici-pants along the U.S.-Mexico produce supply chain should be encouraged to explore obtaining C-TPAT/FAST certification or voluntarily imple-ment portions of these programs in combination with real-time intelli-gent technologies. These systems will reduce buyer and seller risks and ap-pear to be more cost-effective in pre-venting food safety and defense fail-ures, compared to current inspection systems. Real-time “journey based” information could also be shared by multiple agencies and partners, re-ducing the cost of information gath-ering. If extended to distributors and retail facilities in the United States the real-time database could also be used for traceability, reducing market failure cost of delay tracking or false alarm. Keeping a database on origin and trajectory of products might have avoided implicating tomatoes as the initial cause of the 2008 Salmonella Saintpaul outbreak.
One major limitation of the cur-rent inspection system is that require-ments in Mexico are different from those in the United States. Even within the United States, local, state, and federal inspection agencies face significant challenges with informa-tion gathering and sharing. Research should be encouraged to advance the science and security of real-time intel-ligent systems to enable such systems to provide reliable data on microbial and chemical contamination signals. This approach might provide a more comprehensive solution to improving the safety of imported produce.
For More InformationAcheson, D. (Speaker). (2007). Food
defense,CARVER+Shock [Video]. Center for Food Safety and Ap-plied Nutrition (CFSAN) train-ing videos. Retrieved August 22, 2007, from http://www.cfsan.fda.gov/~comm/vltache.html.
CARVER + Shock Primer. (2006). CAFSP. http://www.vet.utk.edu/cafsp/resources/. Accessed May 31, 2009.
Cox, L. A. Jr. (2008). Some Limita-tions of “Risk = Threat × Vulner-ability × Consequence for Risk Analysis of Terrorist Attacks. Risk Analysis, Vol. 28, Number 6, pp.1749-1761(13).
Chalk, P. (2003). The Bio-terrorist Threat to Agricultural Livestock and Produce, CT-213 Testimony, presented before the Government Affairs Committee of the United States Senate, 19 November.
Clark, M. (2005). Chi-Chi’s to settle lawsuit. Message posted to http://www.marlerclark.com/case_news/detail/chi-chis-to-settle-lawsuit
Hu, N. (2008). An Intelligent Sam-pling Method for Fresh Fruits and Vegetables Imported from Mexico. Unpublished MS Thesis, Arizona State University. December, 2008.
United States Customs and Border Protection (CBP), (2008). FAST: Free and Secure Trade program. Retrieved May 24, 2008, from http://www.cbp.gov/xp/cgov/trade/cargo_security/ctpat/fast/
United States Department of Agri-culture (USDA), Foreign Agricul-tural Service (FAS). (2008). U.S. trade imports- FAS commodity aggregations. Retrieved April 16, 2008, from the FAS U.S. trade database.
William Nganje ([email protected]) is an Associate Professor, Tim-othy Richards ([email protected]), is a Professor, Jesus Bravo ([email protected]), is an Assistant Professor, Na Hu ([email protected]), is a Graduate Research Assistant, and Albert Kagan ([email protected]), is a Professor, all at the Morrison School of Management and Agribusiness, W. P. Carey School of Business, Arizona State University, Mesa, Ariz. Ram Acharya ([email protected]), is an Assistant Profes-sor at New Mexico State University, Las Cruces, N.M. Mark Edwards ([email protected]), is a Pro-fessor at the Morrison School of Man-agement and Agribusiness, W. P. Carey School of Business, Arizona State Uni-versity, Mesa, Ariz.
Our sincere thanks go to the reviewers and to David Forsyth for editing the manuscript. This study was funded in part by the National Center for Food Protection and Defense-DHS Grant # 020007-001. However, all inferences and suggestions are those of the authors.

The magazine of food, farm, and resource issues
©1999–2009 CHOICES. All rights reserved. Articles may be reproduced or electronically distributed as long as attribution to Choices and the Agricultural &Applied Economics Association is maintained. Choices subscriptions are free and can be obtained through http://www.choicesmagazine.org.
2ndQuarter2009•24(2) CHOICES 21
AAEAAgricultural & AppliedEconomics Association
A publication of the Agricultural & Applied Economics Association
Public Response to Large-Scale Produce ContaminationCara L . Cuite and William K . Hallman
JEL Classifications: D12, D01, Q13.
A recent article in the New York Times states that “food scares have become as common as midwestern tornadoes” (Harris and Belluck, 2009). It can certainly seem that way, especially with the recent series of high profile problems with a wide range of foods. Shortly after the government warned people to avoid all fresh spinach in the fall of 2006 (FDA, 2007), there was an extensive recall of pet food con-taminated by melamine in 2007 (FDA, 2008a). This was followed, in early 2008, by the largest meat recall in his-tory; more than 143 million pounds of beef were recalled because the company was slaughtering and selling the meat from “downer” cows (Healy and Schmit, 2008). During spring and summer of 2008, the United States had its largest foodborne illness outbreak in over a decade. More than 1,400 people became ill from Salmonella Saintpaul, originally believed to be caused by consuming fresh toma-toes, but ultimately linked to fresh jalapeno peppers from Mexico (FDA, 2008b). This year, the U.S. experienced the largest food recall in its history, with more than 2,100 food products recalled as a result of Salmonella Typhimurium contamination linked to the Peanut Corporation of Amer-ica (FDA, 2009a). A smaller but significant pistachio recall followed closely on the heels of the peanut butter recalls (FDA, 2009b).
Given this sequence of large, well-publicized, and closely timed food recalls, it may not be surprising that the American public’s confidence in our food supply is decreas-ing (Consumer Reports National Research Center, 2008).
Overview of Spinach and Tomato WarningsThe research presented here is derived from two national telephone surveys of Americans. The first survey was about the 2006 E. coli outbreak associated with fresh spinach, and it was fielded five weeks after the FDA advisory had been lifted. The second survey, regarding the 2008 warn-
ings to consumers to avoid eating tomatoes thought to have been contaminated with Salmonella Saintpaul, was fielded a week and a half after the FDA advisory was lifted. The results from these surveys provide valuable insights into the challenges and successes of communicating with the public about food safety. More details about the survey are presented after a brief description of each outbreak.
The two outbreaks studied were similar in that both were national in scope, involved fresh produce, and the advisories to consumers changed over time. At the begin-ning of each of these advisories, the warnings were about an entire class of fresh produce, and were not delimited by brand, lot number, or even geography, although in each case, as the investigation developed, the warnings changed and become increasingly specific.
Warning about E. coli O157:H7 in Spinach, 2006
On Sept. 14, 2006, the U.S. Food and Drug Administra-tion (FDA) issued an advisory to consumers not to eat bagged fresh spinach because of suspected contamination by E. coli O157:H7. The advisory was ultimately lifted on Sept. 22, when the FDA advised the public that they could be confident in consuming spinach grown outside the three counties in California that had been implicated in the outbreak. Thus, the warning had been in effect for a total of one week and one day.
The information from the FDA changed slightly over the course of the advisory. In its second day, the adviso-ry was expanded to include all fresh spinach because the FDA had been informed that bagged spinach was some-times sold in an unbagged form at the retail level. As the investigation continued, the focus narrowed to products from Natural Selection Foods, LLC, of San Juan Bautista, California, with “Best if Used by Dates” of Aug. 17, 2006 through Oct. 1, 2006.

22 CHOICES 2ndQuarter2009•24(2)
It was not until Sept. 20th that the FDA mentioned that it was safe to eat frozen spinach, canned spinach and spinach included in premade meals manufactured by food companies. The following day, the FDA issued a statement that they, working closely with the CDC and the State of Cali-fornia, had determined that the spin-ach implicated in the outbreak had been grown in three counties in Cali-fornia. The FDA was cautious in stat-ing that produce other than spinach grown in these counties had not been implicated in the outbreak, however, the advisory against eating spinach was still in effect.
Ultimately, nearly 200 people in 26 states were reported to the CDC as having potentially been infected with the outbreak strain of E. coli O157:H7 (FDA, 2007). More than 100 of these cases were hospitalized, and 31 developed a form of kidney failure called hemolytic uremic syn-drome (HUS). This resulted in the deaths of three people in confirmed cases of infection associated with the outbreak.
Warnings about Salmonella Saintpaul in Peppers and Tomatoes, 2008
The Salmonella Saintpaul outbreak lasted considerably longer than the spinach warning, and the FDA’s ad-vice to consumers was much more complex. Although initially limited to consumers in Texas and New Mex-ico who were warned not to eat raw red plum, red Roma, or round red tomatoes, FDA expanded its warning to consumers nationwide on June 7, 2008.
Because not all types of toma-toes were implicated in the outbreak, FDA’s advice to consumers was com-plex. The public was told they could continue to eat cherry tomatoes, grape tomatoes, and tomatoes sold with the vine still attached, or toma-toes grown at home. In addition, the
FDA established, and subsequently updated, an online list of states, terri-tories, and countries where tomatoes are grown but which had not been as-sociated with the outbreak. Consum-ers were warned that they should not eat the implicated types of tomatoes unless they had been harvested in one of the areas on the FDA’s list.
On June 30, the CDC announced that they had not found any con-taminated tomatoes and they were broadening their investigation to encompass food items commonly consumed with tomatoes. On July 9, the CDC reported that accumulated data from its investigations indicated that jalapeño peppers caused some ill-nesses but did not explain all the cases associated with the outbreak, and it advised high-risk consumers—the immunocompromised, elderly and infants—to avoid consuming raw ja-lapeño and serrano peppers.
While the pepper warning re-mained in place, the FDA withdrew its tomato warning on July 17, stat-ing that investigators had determined that fresh tomatoes now available in the domestic market were not associ-ated with the current outbreak. Thus, the tomato warning had been in ef-fect for six weeks and two days, and the tomato warning continued to be covered in the news coverage of the ongoing investigation and pepper warning. Finally, on Aug. 28th, FDA declared the outbreak over and lifted its final warning regarding the con-sumption of jalapeño peppers and serrano peppers.
Ultimately, 1,442 reported cases of illness in 43 states were linked to the outbreak. Of these, at least 286 resulted in hospitalization, and the infection may have contributed to the deaths of two individuals. By the time it was over, the Salmonella Saintpaul contamination had resulted in the largest foodborne illness outbreak in over a decade.
Risk Communication Lessons from These OutbreaksWe contacted two large, indepen-dent samples of American adults by telephone (1200 in 2006 and 1101 in 2008). All of the data presented here have been weighted, so that our sample is representative of all Ameri-cans (within a margin of error of ap-proximately ± 4%). We posed many similar, but not identical, questions in each of the two surveys, and report a selection of our findings here (the full reports can be found at www.foodpolicyinstitute.org). We chose to focus on tomatoes, and not pep-pers, in the 2008 survey because the tomato warning received more media coverage and also because, unlike the pepper warning, it had ended by the time we began to field the survey. The spinach survey was fielded over the course of November, 2006, and all interviews were conducted five weeks or longer after the warning had been lifted. The tomato survey was fielded much sooner after the lifting of the warning, beginning one and a half weeks after the warning was lifted. However, it was in the field longer, for almost two months, during Au-gust and September, 2008.
The following sections provide an overview of the most important risk communication lessons that can be learned from these large national outbreaks.
The Vast Majority of Americans Heard about These Warnings
Communication about both the spinach and the tomato warnings was very successful. Eighty seven percent of Americans had heard about the spinach recall, and 93% about the tomato warning. Fewer had heard about the 2008 pepper warning, only 69%. This is likely because the warn-ing was in place for a shorter period of time, fewer Americans consume peppers (Blisard and Stewart, 2007), and because the warning focused on

2ndQuarter2009•24(2) CHOICES 23
high-risk groups. However, the per-centage aware of all three of these warnings is quite high when com-pared with awareness of other, local foodborne illness outbreaks (Patrick, Griffin, Voetsch and Mead, 2007).
We asked the 2006 respondents if they consumed spinach prior to the warning, and the 2008 respondents about their tomato consumption prior to the warning. For those re-spondents who had not heard of the warning, we simply asked “Do you consume [spinach/tomatoes]?” We found that among those who did not consume the affected food, there was a lower likelihood of being aware of the warning. It is not surprising that those who did not consume spinach or tomatoes were less aware of the re-spective warnings, and this indicates that some people may simply not pay attention to information about food recalls that they deem not relevant to them.
Americans Confused about Foods In-cluded in Warnings
In 2006, The FDA warned against eating any fresh spinach, and their advisory expanded in the first few days to explicitly include both bagged and loose fresh spinach. Frozen and canned spinach were explicitly ex-cluded from the warning. While 95% of those aware of the spinach outbreak knew that “bagged fresh spinach” was recalled, only 68% knew that “loose fresh spinach” had been recalled. When we asked about the types of spinach that were NOT recalled, we found that about 1 in 5 incorrectly thought that frozen and canned spin-ach had been recalled (22% and 16%, respectively). Of note is that similar percentages said that they did not know if frozen or canned spinach had been recalled (21% and 14%, respec-tively) which means that almost half of Americans were either wrong or unsure about whether these two types of spinach had been implicated in the outbreak.
The communications about the types of tomatoes that were consid-ered unsafe to eat were even more confusing than those about spinach. When asked how much they agree with the statement, “You knew which types of tomatoes the public was warned not to eat,” only 31% said that they “strongly agreed.” A signifi-cant number of respondents “strongly disagreed” (23%) and the remainder fell in the middle.
While the details differed in each of these instances, what did not dif-fer is that the specifics of the advice from the FDA were not clear to many Americans. The messages were neces-sarily complex, but the complexities left many confused. Unfortunately, there is no reason to think future re-calls will be less complex.
Most Americans Avoid the Contaminated Food
In both surveys, we asked a series of questions about whether Americans ate the potentially contaminated food during the warnings. This is of par-ticular concern given the potential public health consequences of ignor-ing these warnings. We found that approximately one-in-eight Ameri-cans (13%) who were aware of the re-call and ate spinach prior to the recall reported having eaten fresh spinach during the recall. Moreover, nearly three-quarters of these (74%) said that they knew about the recall when they ate it.
Similarly, we found that a small but significant percentage of Ameri-cans ate the implicated types of fresh tomatoes during the tomato warning. Eleven percent of Americans disre-garded the FDA’s advice, and know-ingly ate the types of tomatoes they had been warned not to eat.
People May Try to “Decontaminate” the Product
In both recalls, some Americans re-ported performing behaviors that they believed would make the po-
tentially contaminated food safe to eat, often in direct contradiction of what the FDA has stated. In both surveys, many of those who reported that they had knowingly eaten the foods that they had been warned not to eat told interviewers that they had done something they thought would make the food safe, such as wash-ing or cooking it. However, in both warnings, the FDA specifically stated that neither of those actions were suf-ficient to make the food safe to eat.
We asked additional questions about washing fresh produce in the 2006 survey. Regardless of whether they had heard of the spinach recall, 44% of Americans thought it true that properly washing contaminated food makes it safe to eat; it does not. Moreover, nearly half of those aware of the recall (48%) reported that the spinach recall caused them to wash foods, including those other than spinach, more thoroughly.
The issue of people trying to “de-contaminate” rather than discarding potentially contaminated foods may become even more relevant as the economy worsens and more Ameri-cans struggle to feed their families. Just as some families in need adopt strategies of eating food that is no longer fresh enough to consume (Kempson et al., 2002), an increasing number of Americans may be loathe to discard food that they have paid for, and may devise their own strat-egies, sometimes ill-advised, to at-tempt render the food edible for their family.
Americans More Aware of Advisories Beginning than Ending
By the time these national surveys were fielded, the relevant warn-ings had been lifted. In the case of the spinach survey, the warning had been lifted six weeks prior to the one month data collection period, and the tomato warning had been lifted one and a half weeks prior to the month of data collection.

24 CHOICES 2ndQuarter2009•24(2)
Moving ForwardAs our ability to identify these types of outbreaks improves, and as our food system becomes increasingly interconnected, we are likely to en-counter large scale recalls and warn-ings more frequently. In addition, our foodborne illness surveillance system requires time to accurately identify the food that is causing an outbreak, and as a result of this we are likely to continue to receive dynamic, chang-ing messages from the FDA.
Based on the data reported here, we know that the vast major-ity of Americans are hearing about the FDA’s warnings to avoid certain foods—the initial warning is get-ting through. However, the specifics of which products they are meant to avoid are often not well known. This is of particular importance in cases like the recent peanut butter recall, where over 1,800 products have cur-rently been recalled, but the major retail brands on the market have not been implicated. These messages in-volve many details about the specific products affected, and what is consid-ered “safe” to eat changes over time. Survey research conducted over the course of an outbreak, rather than once the warning has been lifted, may help to better understand the chal-lenges of adequately communicating about FDA warnings.
While the initial message is getting through to the public, the all-clear message is not. The results presented here do not tell us why this is the case: whether it is because the media are less likely to cover the all-clear messages, the complexity of the messages, or some other factors. However, future research should focus on understand-ing why this crucial piece of the warn-ing communication is not reaching such a large percentage of the public. Ideally, this research would happen during the recall and its immediate aftermath, unlike the two surveys dis-cussed here which both were fielded after the advisories had ended.
We asked all participants who were aware of the warnings a series of questions about whether the warn-ings had been lifted. Again, the sur-vey was fielded more than six weeks after the FDA had lifted the advisory, saying that consumers could be con-fident in eating spinach grown out-side the three counties in California that had been implicated in the E. coli contamination. Although a sig-nificant amount of time had passed, 13% of those aware of the warning reported incorrectly that “the spinach recall is still in effect” (a combination of 7% said this was definitely “true” and 6% said it was “likely true”) and nearly 18% said they were not sure. About half (55%) said that it was def-initely “false” that the spinach recall was still in effect and 14% said that it was “likely false.” Thus, at the time the survey was conducted, almost half (45%) of people who were aware of the spinach recall were not confident that the recall had ended.
We found a very similar story with the tomato warning. When we presented the statement, “The to-mato warning is currently in effect,” only 43% said that they “strongly disagreed.” Seven percent “strongly agreed,” and the remaining 50% ei-ther did not know or were not sure. One possible reason that fewer people were aware that the tomato warning was over may be that the interviews were conducted much closer to the date on which the warning was lifted.
Some Will Never Again Eat the Affected Food
We asked people whether they had eaten spinach and tomatoes since the warnings had been lifted. We told ev-ery respondent that the warnings had been lifted just prior to asking about postwarning consumption, so that even those who were not aware at the start of the interview were by the time we asked this question. Because of the complexity of the tomato warning, we simply asked if the respondents
had eaten any tomatoes since the warning, and not if they had eaten the kinds that were included in the warning. Of those who ate tomatoes prior to the warning, 74% reported that they had eaten tomatoes since the warning was lifted.
Fewer had gone back to eating spinach at the time of our interview. Just over four-in-ten respondents (44%) who had heard about the re-call and ate spinach reported that they had eaten spinach since the recall ended. These respondents re-ported that it took approximately two weeks after the recall ended for them to resume eating spinach. Those who had not yet eaten spinach since the recall said it would take an average of about two months for them to start eating fresh spinach again, and their estimates ranged from one day to one year. However, 5% of those who ate spinach and heard about the recall say they will never eat fresh spinach again.
Not only was a small minority of Americans saying that they would never eat spinach again in the wake of the E. coli contamination, but some reported avoiding other similar foods. Nearly one-fifth of those aware of the spinach recall said they were avoiding other bagged produce as a result of the spinach recall.
Even those who did not eat spin-ach prior to the warning were af-fected by the spinach outbreak. Many reported that they also stopped buy-ing bagged produce; in fact, with the same frequency as those who did eat spinach prior to the warning. There are a number of lessons to be learned here. Food recalls can have an impact on the sale of similar related items. In addition, even people who did not consume a recalled product prior to the recall are affected by it, and are likely to change their consumption habits.

2ndQuarter2009•24(2) CHOICES 25
One way of increasing awareness of the end of recalls and advisories is for retailers to send out the all-clear messages. Many retailers have begun the practice of letting their custom-ers know about advisories and recalls of foods they’ve purchased in the past, through letters, phone calls, and printed on receipts, so it would be a logical for them to also tell consumers when they have ended.
In sum, simplifying messages wherever possible, seeking multiple channels through which to commu-nicate with the public, and helping the public to understand why they should heed the advice of the FDA may help Americans better under-stand and better adhere to warnings about food safety.
For More InformationBlisard, N. and Stewart, H. (2007,
March). Food Spending in Ameri-can Households, Economic Infor-mation Bulletin No. (EIB-23) 115 pp.
Consumer Reports National Research Center (2008, November 11). Food-Labeling Poll 2008: Final Ta-bles. Retrieved February 14, 2009 from http://www.greenerchoices.org/pdf/foodpoll2008.pdf.
Food and Drug Administration (2007, March 23). FDA Finalizes Report on 2006 Spinach Outbreak. Retrieved June 15, 2009 from http://www.fda.gov/NewsEv-ents/Newsroom/PressAnnounce-ments/2007/ucm108873.htm
Food and Drug Administration (2008a, February 6). Pet Food Recall (Melamine)/Tainted Ani-mal Feed. Retrieved February 15, 2009 from http://www.fda.gov/oc/opacom/hottopics/petfood.html
Food and Drug Administration (2008b, August 28). Salmonella Saintpaul Outbreak. Retrieved February 15, 2009 from http://www.fda.gov/oc/opacom/hottop-ics/tomatoes.html
Food and Drug Administration (2009a, April 30). Peanut Product Recalls: Salmonella Typhimurium. Retrieved May 1, 2009 from http://www.fda.gov/oc/opacom/hottopics/Salmonellatyph.html
Food and Drug Administration (2009b, May 1). Pistachio Product Recalls: Salmonella. Retrieved June 15, 2009 from http://www.fda.gov/Safety/Recalls/MajorProduc-tRecalls/Pistachio
Harris, G. and Belluck, P. (2009, January 29). New look at food safety after peanut tainting. New York Times. Retrieved Febru-ary 15, 2009 from http://www.n y t i m e s . c o m / 2 0 0 9 / 0 1 / 3 0 /health/30peanut.html
Healey, J. and Schmit, J. (2008, Feb-ruary 17). USDA orders largest beef recall: 143.4 million pounds. USA Today. Retrieved Febru-ary 15, 2009 from http://www.usatoday.com/money/industries/food/2008-02-17-slaughter-house-recall_N.htm
Kempson, K.M., Keenan, D.P., Sadani, P.S., Ridlen, S. and Ro-sato, N.S. (2002). Food manage-ment practices used by people with limited resources to main-tain food sufficiency as reported by nutrition educators. Journal of the American Dietetic Association, 102(12), 1795-1799.
Patrick, M.E., P.M. Griffin, A.C. Voetsch, and Mead P.S. (2007). Effectiveness of recall notification: community response to a nation-wide recall of hot dogs and deli meats. Journal of Food Protection 70:2373-6.
Cara L. Cuite ([email protected]) is a research project manager at the Food Policy Institute, Rutgers, The State University of New Jersey, New Bruns-wick, NJ. William K. Hallman ([email protected]) is the Di-rector of the Food Policy Institute, and Professor in the Department of Human Ecology, Rutgers, The State University of New Jersey, New Brunswick, NJ.
The research described here was sup-ported by two grants provided to the Rutgers Food Policy Institute, one from the Grocery Manufacturers Association (GMA), the association of food, bever-age, and consumer products companies, and another from the Cooperative State Research, Education, and Extension Service (CSREES) of the United States Department of Agriculture (USDA) under the National Integrated Food Safety Initiative (NIFSI) grant # 2005-51110-02335 Food Biosecurity: Modeling the Health, Economic So-cial, and Psychological Consequences of Intentional and Unintentional Food Contamination, Dr. William K. Hall-man, Principal Investigator. The opin-ions expressed in the article are those of the authors and do not necessarily reflect official positions or policies of GMA, the USDA, or the Food Policy Institute, Rutgers, The State University of New Jersey

26 CHOICES 2ndQuarter2009•24(2)
The magazine of food, farm, and resource issues
©1999–2009 CHOICES. All rights reserved. Articles may be reproduced or electronically distributed as long as attribution to Choices and the Agricultural &Applied Economics Association is maintained. Choices subscriptions are free and can be obtained through http://www.choicesmagazine.org.
AAEAAgricultural & AppliedEconomics Association
A publication of the Agricultural & Applied Economics Association
E. coli Outbreaks Affect Demand for Salad VegetablesFaysal Fahs, Ron C . Mittelhammer, and Jill J . McCluskey
JEL Classifications: Q11, Q13
Fresh salad vegetables are generally considered safe-to-eat by consumers. However, the Centers for Disease Control and Prevention (CDC) found that vegetables contribut-ed to 5% of the food borne illnesses in the world during the period 1973 to 1987 (Bean and Griffin, 1990). Out-breaks of food borne diseases caused by E. coli (Escherichia coli) bacteria are a serious concern in the United States. The CDC estimates 73,000 cases of infection with E. coli 0157:H7 and 61 deaths on average occur in the United States every year (Seto, Soller, and Colford, 2007).
2006 E. coli Outbreaks in Spinach and LettuceOn Sept. 14, 2006, the U.S. Food and Drug Administra-tion (FDA) issued an alert to consumers about an E. coli O157:H7 outbreak associated with the consumption of bagged fresh spinach in multiple states. The FDA called for bagged fresh spinach to be removed from grocery store shelves and warned people not to eat fresh spinach or products containing fresh spinach. On Sept. 29, the FDA downgraded the warning to be only against specific brands packaged on specific dates, instead of all fresh spinach. By Oct. 6, the outbreak of E. coli O157:H7 in spinach caused at least 199 consumer illnesses and three deaths from 26 states (CDC Update, 2006). In California, where three-quarters of all domestic spinach is grown, the trade asso-ciation Western Growers estimated that the 2006 spinach outbreak could cost farmers up to $74 million (AP, 2006).
On Oct. 8, less than a week after the downgraded warn-ing on fresh spinach, the FDA issued a recall on lettuce grown in the Salinas Valley in California over concerns about E. coli contamination. The recall covered green leaf lettuce sold from Oct. 3 to Oct. 6 under a popular brand in grocery stores in Arizona, California, Idaho, Montana, Nevada, Oregon and Washington. In November and De-cember, a subsequent E. coli outbreak linked to Taco Bell
and Taco John’s restaurants involving five eastern states was found to be caused by prepackaged iceberg lettuce, which resulted in 71 infections, 53 hospitalized cases, and eight cases of kidney failure.
In contrast to the previous outbreaks, this outbreak was due to exposure to E. coli in restaurants. Initially the source of the contamination was thought to be green onions. Only after the outbreak had been contained was lettuce considered to be the culprit. Unlike the September out-break, there was no recall of lettuce and no FDA warning to consumers not to eat lettuce.
In this article, we discuss effects of the 2006 E. coli outbreaks on retail demand for salad vegetables in grocery stores located on the West Coast of the United States. In-teresting issues include how consumers responded to the outbreak in terms of buying substitutes, how demand re-covered, how the response to the first outbreak was differ-ent from the response to the second outbreak, and whether the response was different across demographic groups.
Retail Scanner Data AnalyzedThe discussion in this article is based on analysis of a retail scanner dataset containing information about the transac-tion dates, quantities sold, and markdowns of salad veg-etables. The stores included in the analysis are located in Washington, California and Oregon, with ten stores from each state. The stores were selected to ensure both geo-graphical dispersion throughout each state and representa-tion of both rural and urban areas. The daily observations represent purchases of salad vegetables for calendar year 2006, as well as household expenditures, quantities pur-chased, and demographic variables that are expected to in-fluence consumer behavior. The data includes observations on the purchases of tomatoes, onions, cabbage, lettuce, and spinach. These vegetable categories were chosen based on

2ndQuarter2009•24(2) CHOICES 27
the categories that experienced out-breaks (spinach and lettuce), a substi-tute (cabbage), and two major salad complements (tomatoes and onions), and considering the preferences of the retail chain for the analysis. The sam-ple contains 377,149 observations. The data were aggregated by the week of sale, and variables were created to indicate specific months.
Results of AnalysisA Quadratic Almost Ideal Demand System (QUAIDS) model in bud-get-share form was estimated using a generalized method of moments (GMM) approach. The details of the theory and estimation are presented in Fahs, Mittelhammer, and McClus-key (2009). In order to account for the seasonal nature of the demand for salad vegetables explicitly in the mod-el, a polynomial in time (months) was included in the model specification.
Findings include that the param-eters associated with the expendi-ture terms are statistically significant for all five types of salad vegetables. The coefficients associated with the prices are also significant. As ex-pected, households with different demographic profiles have different consumption preferences and exhibit different consumption patterns.
Of importance for this study, the indicator variables for specific months are statistically significant. In October, households preferred more tomatoes, cabbage and lettuce, and less spinach and onions. In No-vember, during the subsequent out-break, households preferred even less spinach and more of other vegetables compared to the initial outbreak in September. It is possible that house-holds during the later outbreaks were more alert and educated about the E. coli warnings, as the result of the first outbreak. This suggests that damage from a series of outbreaks can be cu-mulative. In December, households preferred more tomatoes, cabbage and lettuce, and less spinach and on-
ions. It is likely that households ad-justed their preferences for vegetables after the second outbreak. The esti-mated time trends also suggest that households consumed more salad vegetables in the summer months, which is typical of U.S. consumption patterns.
Figure 1 presents the predicted ex-penditure shares during the nonout-break period (January to August) and the two outbreak periods (September and November). Consumption of to-matoes, cabbage, lettuce and onions increased by 8.6%, 32.6%, 31.8% and 0.7%, respectively, in September; while the consumption of spinach decreased by 50.6%. Similarly, to-matoes, cabbage, lettuce and onions increased by 13.5%, 34.4%, 33.4% and 1.3%, respectively, in November; while spinach decreased by 54.2%. The results suggest that other salad vegetables were substituted for spin-ach during both outbreaks and that the second outbreak had an even greater impact on demand.
An “elasticity” is a measure of the responsiveness of one factor to a change in another factor. For ex-ample, “expenditure elasticity” is a measure of the responsiveness of de-mand to changes in expenditure on a bundle of similar goods. It shows how the quantity purchased changes in response to a change in the con-
sumer’s expenditure, which is a proxy for income (Economic Research Ser-vice, 2009). In order to gain insight into the effect of the E. coli outbreak on the consumer demand for salad vegetables, we compare the elasticities before the outbreak (i.e. Jan. to Aug.) to the elasticities during the first out-break (September) and during the second outbreak period (November) Then we calculate the percentage change in marginal effects due to the demographic variables on the con-sumption of salad vegetables before and during the outbreaks.
Figure 2 presents the expenditure elasticities during the nonoutbreak and the outbreak periods. The re-sults indicate that during the non-outbreak period, tomatoes (1.22), lettuce (1.13) and spinach (1.73) were expenditure elastic, while cab-bage (0.87) and onions (0.72) were expenditure inelastic. During the first outbreak, the expenditure elas-ticities of tomatoes (1.35), cabbage (1.06) and lettuce (1.31) were elas-tic, while onions (0.83) and spinach (0.81) were inelastic. The results for the subsequent outbreak period indi-cate that the expenditure elasticities for tomatoes (1.37), cabbage (1.06) and lettuce (1.51) were more elastic compared to the first outbreak, while spinach (0.73) became even more in-elastic than during the first outbreak.
Figure 1. Predicted Expenditure Shares during the Nonoutbreak and Out-break Periods

28 CHOICES 2ndQuarter2009•24(2)
Three main comparative observa-tions can be made. The expenditure elasticity for spinach changes from elastic during the nonoutbreak peri-od to inelastic during both outbreaks, which indicates that spinach demand was less responsive to expenditure changes during the outbreaks. This could be because households have heightened concern for their safety. The expenditure elasticity for cabbage changes from inelastic during the nonoutbreak period to elastic during both outbreaks, which indicates that consumers’ demand for cabbage was relatively more responsive to expen-diture changes during the outbreak periods. Tomatoes, cabbage and let-tuce are more elastic and spinach is
more inelastic during the second outbreak compared to the first out-break period. This indicates that the demands for tomatoes, cabbage and lettuce were more responsive, and the demand for spinach less responsive to expenditure changes in the second outbreak period than the first.
The “compensated” demand function explains the relationship between the price of a good and the quantity purchased of the good pur-chased under the assumption that other prices and utility (a measure of the satisfaction a consumer derives from a particular market basket) are held constant (Economic Research Service, 2009). Figure 3 presents the “compensated” price elasticities for
the nonoutbreak period and for the first and second outbreak periods, respectively. All compensated own-price elasticities are negative and have reasonable magnitudes consistent with economic theory. From these results, we observe that the price elas-ticity for spinach changes from elastic during the nonoutbreak period to in-elastic during both outbreak periods, indicating that consumers were less responsive to price changes during the outbreaks. In contrast, the price elasticity for cabbage changes from inelastic during the nonoutbreak pe-riod to elastic during both outbreak periods, indicating a greater respon-siveness of demand to price changes during the outbreak periods.
In the subsequent outbreak, the own-price elasticities for tomatoes, cabbage, and lettuce are more elastic, and thus demands are more sensitive to price changes, while spinach is more inelastic and thus demand less price sensitive compared to the first outbreak period. Tomatoes, cabbage, and lettuce were substituted for spin-ach during both outbreak periods, and this substitution was greater dur-ing the second outbreak.
Households with different demo-graphic profiles may have different consumption preferences and exhibit different consumption patterns. In a recent study, only about half of Amer-icans said they regularly ate spinach before the recall, and those with higher levels of education and in-come were more likely to eat spinach (Cuite, et al, 2007). Demographic factors that increase the substitution away from spinach include the pres-ence of children, the level of income, and residing in California. The effect of children suggests that consumers are more risk averse about food safety when there are children in the house-hold. Also, if food safety is a normal good, then one would expect for in-come to be significant and negatively related to consumption of a good af-fected by health concerns. The resi-
Figure 2. Expenditure Elasticities during the Nonoutbreak and Outbreak Periods
Figure 3. Compensated Price Elasticities during the Nonoutbreak and Out-break Periods
2ndQuarter2009•24(2) CHOICES 29
dence effect was expected, since the fact that the source of the outbreak was in California and it was heavily covered by the media. Age and mari-tal status did not have statistically significant effects on the demands for any of the salad vegetables.
Conclusions and Implications for Policy The impacts of the E. coli outbreaks that occurred in 2006 on consumer demand for salad vegetables on the West Coast of the United States were major. The results suggest that dur-ing and after the initial outbreak let-tuce and cabbage were substituted for spinach, indicating consumers’ re-sponse to health concerns. The expen-diture elasticity for spinach changes from elastic during the nonoutbreak period to inelastic during both out-breaks, which indicates that consum-ers were less responsive to expendi-ture changes as apprehension about their safety increased. Similarly, the price elasticity for spinach changes from elastic during the nonoutbreak period to inelastic during both out-breaks, indicating that consumers are less responsive to price changes dur-ing the outbreaks and suggesting, for instance, that a spinach “E. coli sale” in an attempt to increase sales would not fare very well.
Interestingly, the empirical results suggest that subsequent outbreaks had a greater impact on the consump-tion of salad vegetables than the first. We hypothesize that households dur-ing the second outbreak were more alert and educated about the E. coli warnings, as the result of the first outbreak, and responded accordingly. This also provides empirical evidence consistent with the hypothesis that negative market effects can be cumu-lative in magnitude.
This negative impact on spinach demand occurred even though the subsequent outbreaks were ultimately traced to lettuce with the highly pub-licized outbreaks contained to restau-rants. Given the initial confusion re-garding the source of the subsequent outbreaks, we conjecture that coming so soon after the initial and severe spinach outbreak, the market reacted to the initial noise by staying away from spinach purchases.
These findings coincide with re-search in behavioral economics on risk-related behavior. As Thaler and Sunstein, (2008) discuss, “Whether people buy insurance for natural di-sasters is greatly affected by recent experiences. In the aftermath of an earthquake, purchase of new earth-quake insurance policies rise sharp-ly—but purchases decline steadily from that point, as vivid memories recede,” (p. 25). As such, the food industry must be extra vigilant in the periods that follow food safety incidences in the food system. Fur-ther, it might be welfare enhancing to increase government monitoring or audits beyond what would normally appear to be optimal in the periods following an outbreak.
For More InformationAssociated Press (2006). Spinach farm-
ers try to grow public’s confidence. Available online: http://www.ms-nbc.msn.com/id/15095551/.
Bean, H., and Griffin, P. (1990). Foodborne disease outbreaks in the United States, 1973-1987: pathogens, vehicles, and trends, Journal of Food Protection, 53, 804-817.
Centers for Disease Control and Pre-vention (2006). Update on multi-state outbreak of E. coli O157:H7 infections from fresh spinach. Avail-able online: http://www.cdc.gov/foodborne/-ecolispinach/current.htm.
Cuite, C.L, Condry, S.C., Nucci, M.L., and Hallman, W.K. (2007). Public response to the contaminated spinach recall of 2006. FPI pub-lication number RR-0107-013. Available online: http://fpi.rut-gers.edu/docs/pubs/2007_Pub-l i c%20Response%20to%20the%20Contaminated%20Spin-ach%20Recall%20of%202006.pdf.
Economic Research Service, (2009). Commodity and food elasticities: glossary. Available online: http://www.ers.usda.gov/Data/Elastici-ties/Glossary.htm.
Fahs, F., Mittelhammer, R.C., and McCluskey, J.J. (2009). Impact of the 2006 E. coli outbreaks on con-sumer demand for salad vegetables (working paper). Pullman, Wash: School of Economic Sciences, Washington State University.
Seto, E.Y.W., Soller, J.A., and Col-ford, J.M., Jr. (2007). Strategies to reduce person-to-person trans-mission during widespread Esch-erichia coli O157:H7 outbreak. Emerging Infectious Diseases, 13, 860-866.
Thaler, R.H., and Sunstein, C.R. (2008). Nudge: improving deci-sions about health, wealth, and happiness. Yale University Press. New Haven.
Faysal Fahs ([email protected]) is a Senior Lecturer, Agribusiness and Ap-plied Economics, North Dakota State University. Ron C. Mittelhammer ([email protected]) is a Regents Pro-fessor and Director, School of Economic Sciences, Washington State University. Jill J. McCluskey ([email protected]) is a Professor, School of Economic Sci-ences, Washington State University.
The authors wish to thank Jon Yoder for insightful comments.