emerging markets payment index q2 2015: report by fortumo
TRANSCRIPT

Emerging Markets Payment Index: Q2 2015Report by Fortumo

Emerging Markets Payment Index: Q2 2015
The Emerging Markets Payment Index focuses on markets highlighted by GfK in its global forecast of top smartphone markets for growth by value in 2015: India, Indonesia, South Africa, Brazil, Pakistan, Nigeria, Egypt and Vietnam*. These markets have a significantly lower level of access to traditional online payments than mature economies. India and Vietnam for example have a credit card penetration below 2% and in Nigeria 99.3% of all card transactions are conducted on ATMs.
The payment index aggregates carrier billing data from various platforms (web, mobile web, feature phones, smartphones) and app stores using Fortumo carrier billing.
* - China and Bangladesh have been omitted from the index as Fortumoprovides carrier billing only for Android developers in China and does notoperate in Bangladesh.
The Emerging Markets Payment Index is intended to be used by web, game and app developers for benchmarking their revenue in markets with high smartphone growth and low credit card penetration.
Introduction
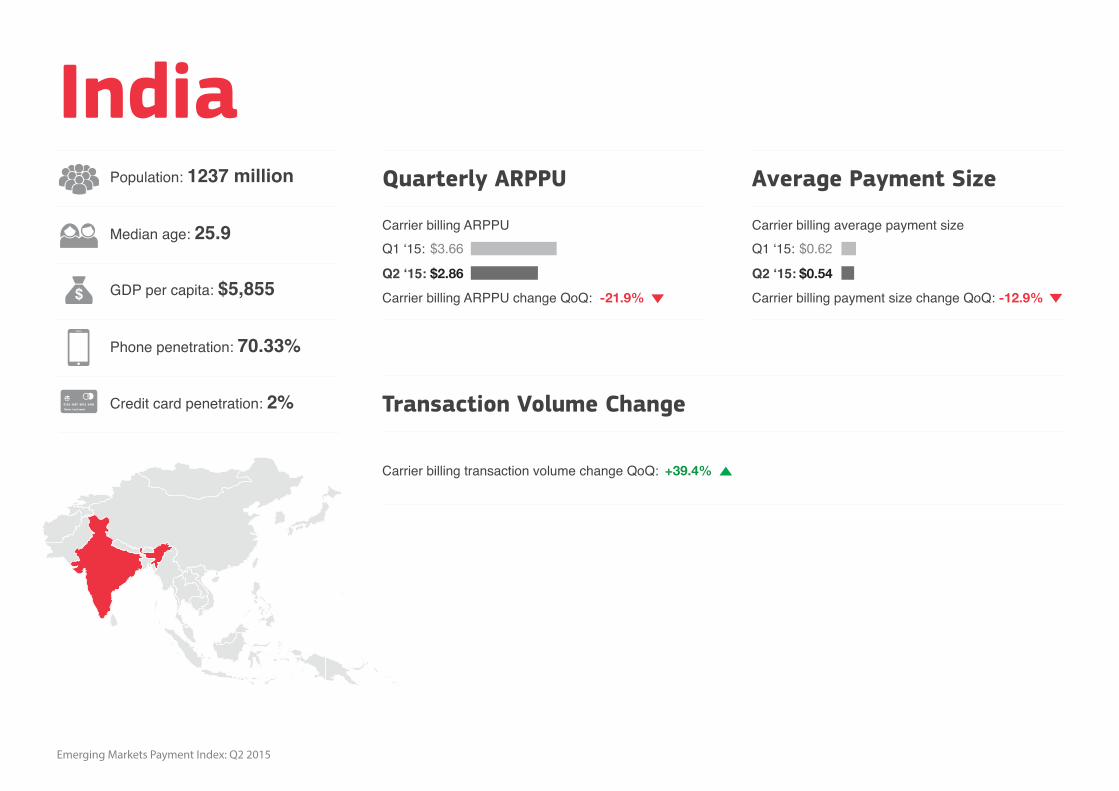
IndiaPopulation: 1237 million
Median age: 25.9
Phone penetration: 70.33%
Quarterly ARPPU
Emerging Markets Payment Index: Q2 2015
Average Payment Size
Carrier billing ARPPUQ1 ‘15:
Q2 ‘15:
Carrier billing ARPPU change QoQ:
Transaction Volume Change
Carrier billing transaction volume change QoQ:
Carrier billing average payment sizeQ1 ‘15:
Q2 ‘15:
Carrier billing payment size change QoQ: GDP per capita: $5,855
Credit card penetration: 2%
$3.66
$2.86
-21.9%
$0.62
$0.54
-12.9%
+39.4%

PakistanPopulation: 182 million
Median age: 21.2
Phone penetration: 71.56%
Quarterly ARPPU
Emerging Markets Payment Index: Q2 2015
Average Payment Size
Carrier billing ARPPUQ1 ‘15:
Q2 ‘15:
Carrier billing ARPPU change QoQ:
Transaction Volume Change
Carrier billing transaction volume change QoQ:
Carrier billing average payment sizeQ1 ‘15:
Q2 ‘15:
Carrier billing payment size change QoQ: GDP per capita: $4,736
Credit card penetration: 1%
$3.87
$2.73
-29.5%
$0.35
$0.31
-11.4%
+81.35%
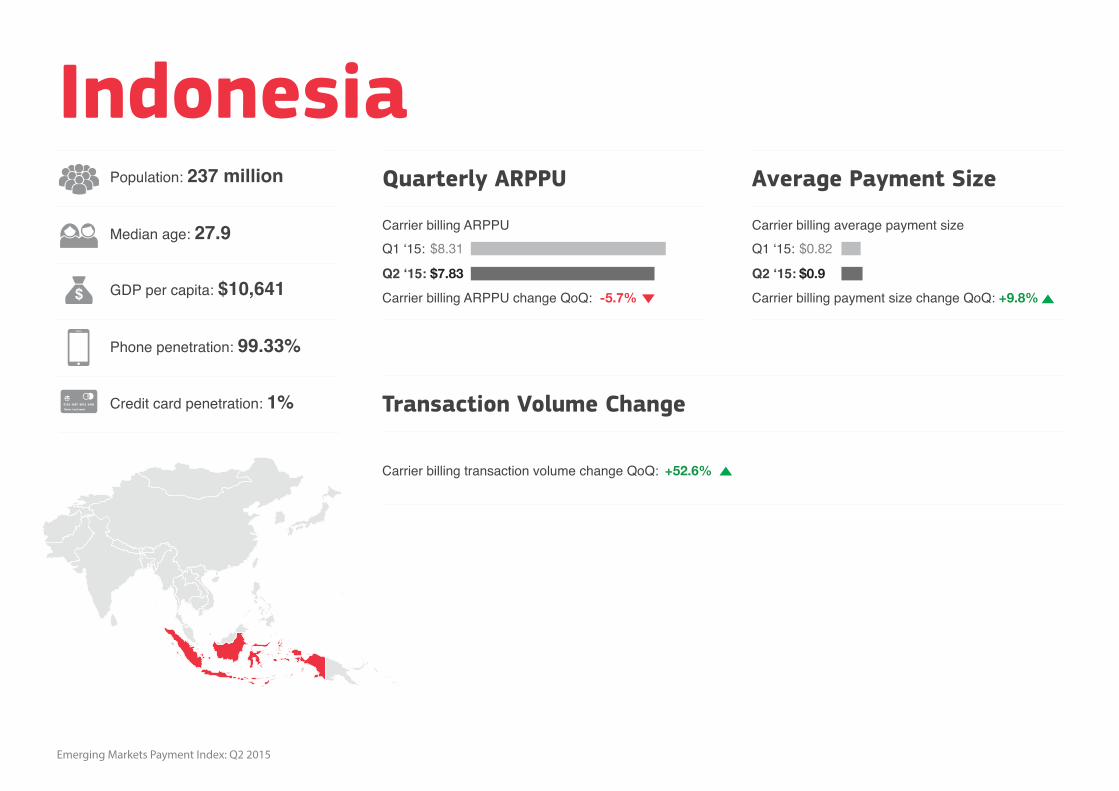
IndonesiaPopulation: 237 million
Median age: 27.9
Phone penetration: 99.33%
Quarterly ARPPU
Emerging Markets Payment Index: Q2 2015
Average Payment Size
Carrier billing ARPPUQ1 ‘15:
Q2 ‘15:
Carrier billing ARPPU change QoQ:
Transaction Volume Change
Carrier billing transaction volume change QoQ:
Carrier billing average payment sizeQ1 ‘15:
Q2 ‘15:
Carrier billing payment size change QoQ: GDP per capita: $10,641
Credit card penetration: 1%
$8.31
$7.83
-5.7%
$0.82
$0.9
+9.8%
+52.6%
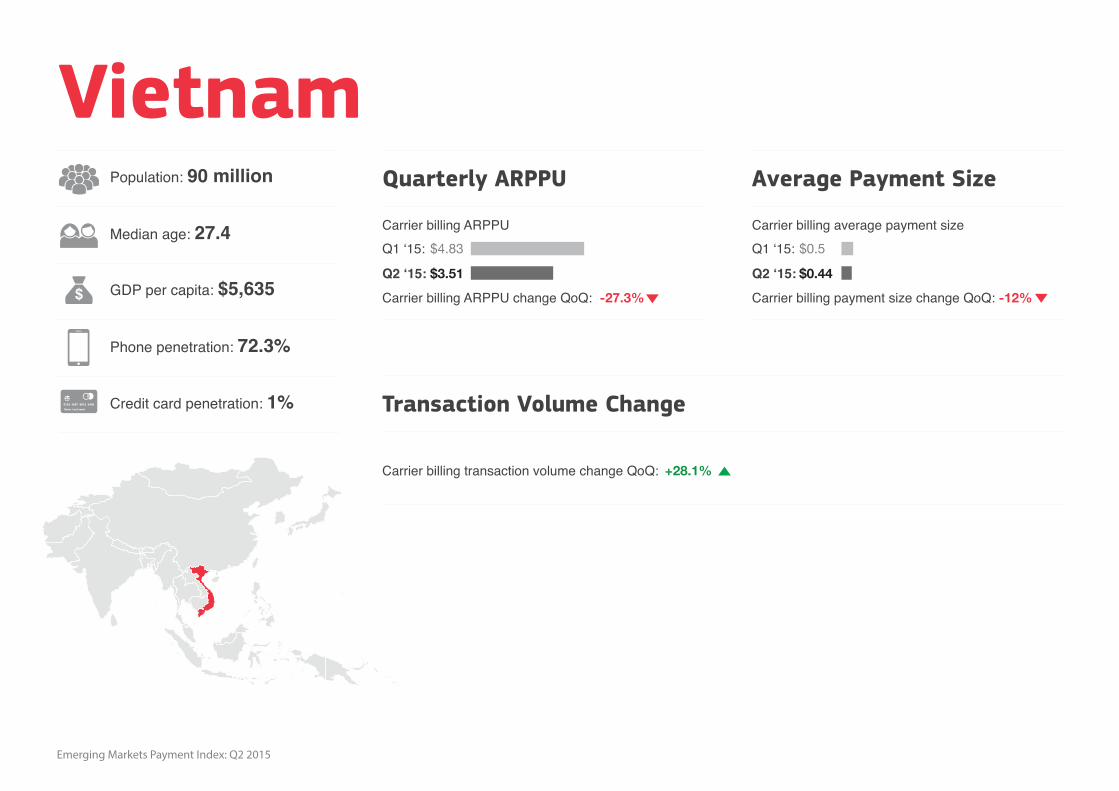
VietnamPopulation: 90 million
Median age: 27.4
Phone penetration: 72.3%
Quarterly ARPPU
Emerging Markets Payment Index: Q2 2015
Average Payment Size
Carrier billing ARPPUQ1 ‘15:
Q2 ‘15:
Carrier billing ARPPU change QoQ:
Transaction Volume Change
Carrier billing transaction volume change QoQ:
Carrier billing average payment sizeQ1 ‘15:
Q2 ‘15:
Carrier billing payment size change QoQ: GDP per capita: $5,635
Credit card penetration: 1%
$4.83
$3.51
-27.3%
$0.5
$0.44
-12%
+28.1%

BrazilPopulation: 201 million
Median age: 30.5
Phone penetration: 130.85%
Quarterly ARPPU
Emerging Markets Payment Index: Q2 2015
Average Payment Size
Carrier billing ARPPUQ1 ‘15:
Q2 ‘15:
Carrier billing ARPPU change QoQ:
Transaction Volume Change
Carrier billing transaction volume change QoQ:
Carrier billing average payment sizeQ1 ‘15:
Q2 ‘15:
Carrier billing payment size change QoQ: GDP per capita: $16,096
Credit card penetration: 29%
$17.04
$17.02
-0.1%
$2.07
$1.85
-10.6%
+4%

NigeriaPopulation: 173 million
Median age: 19.1
Phone penetration: 65.67%
Quarterly ARPPU Average Payment Size
Carrier billing ARPPUQ1 ‘15:
Q2 ‘15:
Carrier billing ARPPU change QoQ:
Transaction Volume Change
Carrier billing transaction volume change QoQ:
Carrier billing average payment sizeQ1 ‘15:
Q2 ‘15:
Carrier billing payment size change QoQ: GDP per capita: $6,031
Credit card penetration: <1%
$2.73
$2.81
+2.9%
$0.41
$0.38
-7.3%
-1.9%
Emerging Markets Payment Index: Q2 2015

EgyptPopulation: 83 million
Median age: 24.0
Phone penetration: 91.39%
Quarterly ARPPU
Emerging Markets Payment Index: Q2 2015
Average Payment Size
Carrier billing ARPPUQ1 ‘15:
Q2 ‘15:
Carrier billing ARPPU change QoQ:
Transaction Volume Change
Carrier billing transaction volume change QoQ:
Carrier billing average payment sizeQ1 ‘15:
Q2 ‘15:
Carrier billing payment size change QoQ: GDP per capita: $10,877
Credit card penetration: N/A
$4.86
$4.63
-4.7%
$0.54
$0.51
-5.5%
+15.2%

South AfricaPopulation: 52 million
Median age: 24.7
Phone penetration: 112.48%
Quarterly ARPPU
Emerging Markets Payment Index: Q2 2015
Average Payment Size
Carrier billing ARPPUQ1 ‘15:
Q2 ‘15:
Carrier billing ARPPU change QoQ:
Transaction Volume Change
Carrier billing transaction volume change QoQ:
Carrier billing average payment sizeQ1 ‘15:
Q2 ‘15:
Carrier billing payment size change QoQ: GDP per capita: $13,046
Credit card penetration: 15%
$12.66
$13.72
+8.3%
$2.46
$2.38
+4.8%
-3.3%

[email protected]://twitter.com/fortumohttps://facebook.com/fortumo
Fortumo allows any merchant to set up payment processing for web and mobile services, games or apps. Users with a mobile phone are then able to make one-click payments using Fortumo without the need for a credit card: payments are charged to their mobile operator bill instead. Fortumo supports payments in 90+ countries through 350 mobile operators. Founded in 2007, Fortumo has offices in Estonia, US, India, China and Singapore and is backed by Intel Capital and Greycroft Partners. Get started with mobile payments at https://fortumo.com.