emerging themes in epidemiology
TRANSCRIPT

BioMed Central
Emerging Themes in Epidemiology
ss
Open AcceMethodologyRevised estimates of influenza-associated excess mortality, United States, 1995 through 2005Ivo M Foppa*1 and Md Monir Hossain2Address: 1Department of Epidemiology, Tulane University School of Public Health and Tropical Medicine, New Orleans, LA 70112, USA and 2Center for Clinical and Translational Sciences, University of Texas Health Science Center at Houston, Houston, TX 77030, USA
Email: Ivo M Foppa* - [email protected]; Md Monir Hossain - [email protected]
* Corresponding author
AbstractBackground: Excess mortality due to seasonal influenza is thought to be substantial. However,influenza may often not be recognized as cause of death. Imputation methods are thereforerequired to assess the public health impact of influenza. The purpose of this study was to obtainestimates of monthly excess mortality due to influenza that are based on an epidemiologicallymeaningful model.
Methods and Results: U.S. monthly all-cause mortality, 1995 through 2005, was hierarchicallymodeled as Poisson variable with a mean that linearly depends both on seasonal covariates and oninfluenza-certified mortality. It also allowed for overdispersion to account for extra variation thatis not captured by the Poisson error. The coefficient associated with influenza-certified mortalitywas interpreted as ratio of total influenza mortality to influenza-certified mortality. Separatemodels were fitted for four age categories (<18, 18–49, 50–64, 65+). Bayesian parameterestimation was performed using Markov Chain Monte Carlo methods. For the eleven year studyperiod, a total of 260,814 (95% CI: 201,011–290,556) deaths was attributed to influenza,corresponding to an annual average of 23,710, or 0.91% of all deaths.
Conclusion: Annual estimates for influenza mortality were highly variable from year to year, butthey were systematically lower than previously published estimates. The excellent fit of our modelwith the data suggest validity of our estimates.
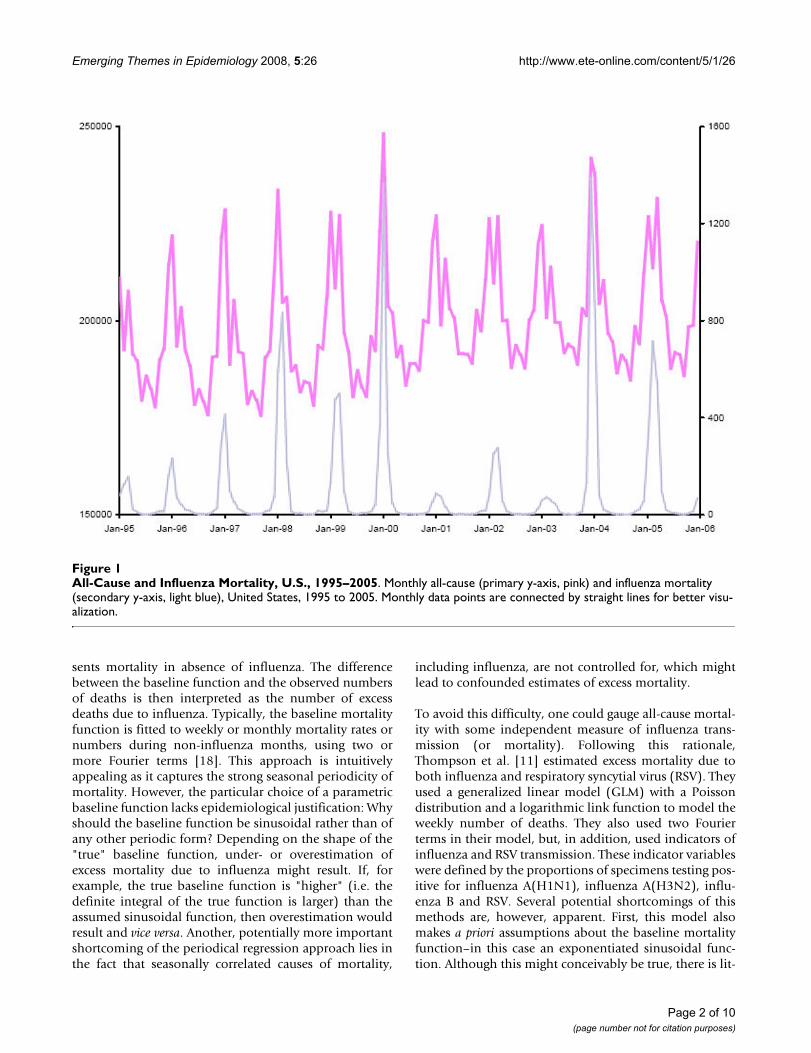
BackgroundInfluenza viruses, due to their genotypic plasticity [1],cause yearly epidemics that generally coincide with peaksin all-cause mortality (Figure 1). Incidence of these infec-tions is difficult to quantify because of their clinical simi-larity with other upper respiratory infections and becauselaboratory confirmation is rarely done. Mortality due toseasonal influenza, which may result from exacerbation ofunderlying pulmonary, cardiac or other systemic condi-tions is, nevertheless, thought to be substantial [2-17].
Recent U.S. estimates of average annual excess mortalitydue to seasonal influenza exceed 30,000 [11,14].
To estimate excess mortality due to influenza, two funda-mental approaches have previously been used. The mostpopular one is based on Serfling's seasonal regressionmethod [18] and has resulted in numerous estimates ofexcess mortality due influenza [3-8,12,14,15,19]. Thisperiodical regression approach is based on parametricestimation of a sinusoidal "baseline" function that repre-
Published: 30 December 2008
Emerging Themes in Epidemiology 2008, 5:26 doi:10.1186/1742-7622-5-26
Received: 5 March 2008Accepted: 30 December 2008
This article is available from: http://www.ete-online.com/content/5/1/26
© 2008 Foppa and Hossain; licensee BioMed Central Ltd. This is an Open Access article distributed under the terms of the Creative Commons Attribution License (http://creativecommons.org/licenses/by/2.0), which permits unrestricted use, distribution, and reproduction in any medium, provided the original work is properly cited.
Page 1 of 10(page number not for citation purposes)
Emerging Themes in Epidemiology 2008, 5:26 http://www.ete-online.com/content/5/1/26
sents mortality in absence of influenza. The differencebetween the baseline function and the observed numbersof deaths is then interpreted as the number of excessdeaths due to influenza. Typically, the baseline mortalityfunction is fitted to weekly or monthly mortality rates ornumbers during non-influenza months, using two ormore Fourier terms [18]. This approach is intuitivelyappealing as it captures the strong seasonal periodicity ofmortality. However, the particular choice of a parametricbaseline function lacks epidemiological justification: Whyshould the baseline function be sinusoidal rather than ofany other periodic form? Depending on the shape of the"true" baseline function, under- or overestimation ofexcess mortality due to influenza might result. If, forexample, the true baseline function is "higher" (i.e. thedefinite integral of the true function is larger) than theassumed sinusoidal function, then overestimation wouldresult and vice versa. Another, potentially more importantshortcoming of the periodical regression approach lies inthe fact that seasonally correlated causes of mortality,
including influenza, are not controlled for, which mightlead to confounded estimates of excess mortality.
To avoid this difficulty, one could gauge all-cause mortal-ity with some independent measure of influenza trans-mission (or mortality). Following this rationale,Thompson et al. [11] estimated excess mortality due toboth influenza and respiratory syncytial virus (RSV). Theyused a generalized linear model (GLM) with a Poissondistribution and a logarithmic link function to model theweekly number of deaths. They also used two Fourierterms in their model, but, in addition, used indicators ofinfluenza and RSV transmission. These indicator variableswere defined by the proportions of specimens testing pos-itive for influenza A(H1N1), influenza A(H3N2), influ-enza B and RSV. Several potential shortcomings of thismethods are, however, apparent. First, this model alsomakes a priori assumptions about the baseline mortalityfunction–in this case an exponentiated sinusoidal func-tion. Although this might conceivably be true, there is lit-
All-Cause and Influenza Mortality, U.S., 1995–2005Figure 1All-Cause and Influenza Mortality, U.S., 1995–2005. Monthly all-cause (primary y-axis, pink) and influenza mortality (secondary y-axis, light blue), United States, 1995 to 2005. Monthly data points are connected by straight lines for better visu-alization.
Page 2 of 10(page number not for citation purposes)
Emerging Themes in Epidemiology 2008, 5:26 http://www.ete-online.com/content/5/1/26
tle empirical evidence to support this assumption.Second, the multiplicative form of the model implies thatexcess mortality, given a certain amount of influenzaactivity, depends on the current level of all-cause mortal-ity. Again, this does not appear to be a well-foundedassumption. Finally, the proportion of test positive speci-mens is likely to be a poor measure of excess mortality.While a high proportion of test positive specimens is com-patible with high levels of influenza transmission (andexcess mortality), this is not necessarily true. The model,however, implies that five hundred influenza positives,obtained from a thousand tests, are associated with lessexcess mortality than two influenza positives, obtainedfrom three tests. This appears to be an unrealistic assump-tion. The seasonally changing frequency of influenza test-ing [20] is, at least partly, due to the seasonally changingincidence of other agents causing influenza-like illness(ILL).
Alternatively, one could postulate that mortality directlyattributed to influenza (influenza-certified mortality) rep-resents a certain proportion of all mortality attributable toinfluenza. This assumption implies that the coefficientassociated with influenza-certified mortality representsthe ratio of total influenza mortality to influenza certifiedmortality [17,21]. Here we use a method for the estima-tion of influenza excess mortality which is similar to theone recently presented by Schanzer and colleagues [17]:we adopt the proportionality assumption and avoid spe-cific parametric assumptions about the baseline function.In addition, and deviating from the Schanzer model, weallow for random variability of influenza-certified mortal-ity by adopting a hierarchical modeling approach. Wepresent the resulting estimates of U.S. excess mortality dueto influenza for the years 1995 to 2005. We compare theseto estimates obtained from a Thompson-like model [11],as well as to previously published estimates of influenza-associated excess mortality.
MethodsDataWe used Multiple Cause-of-Death Data for the years 1995to 2005 (Multiple Cause-of-Death Microdata, 1995–2005, National Center for Health Statistics, Hyattsville,Maryland). This dataset is in the public domain and canbe electronically downloaded from the web site of theNational Bureau of Economic Researchhttp:www.nber.org/data/vital-statistics-mortalitdatmultiple-cause-of-death.html. We defined deaths as influenza-certified if influenza was given as underlying cause ofdeath. The corresponding diagnostic code for ICD-9(1995 to 1998) was 487 and and for ICD-10 (1999onwards) the code range was J10–J12. Influenza yearswere defined as lasting from July 1 of one year to June 30of the following year. We defined four age categories: < 18,
18–49, 50–64 and 65+. Observations with missing age (N= 4,490) were not included in this analysis.
Statistical modelThe epidemiological model on which our analyses arebased implies that monthly all-cause mortality is the sumof "baseline mortality", i.e. mortality that is independentof influenza, and mortality that is a direct or indirect resultof influenza. Based on the pronounced seasonal periodic-ity of all-cause mortality we assume that baseline mortal-ity is a function of calender month. In addition, we allowfor a linear and/or non-linear trend in all-cause mortalitythat takes into account demographic or other populationlevel changes resulting in linear/non-linear changes inbaseline mortality over time. Finally, we accommodateextra variability of baseline mortality that is not accountedfor by calender month and trend. This epidemiologicalmodel corresponds to the following statistical model,hence referred to as "current model":
Yi|θi ~ Poisson(θi) (1)
θi ~ Normal(μi, τ) (2)
Xi|γi ~ Poisson(γi), (4)
where Yi is the observed all-cause mortality count during
index months i = 1, ..., 132. The variable Yi which repre-
sents a number and not a rate, is assumed to follow a Pois-
son distribution with a mean parameter θi. The Poisson
mean parameter θi has an identity link and is distributed
as Normal with mean μi and variance τ. This parametriza-
tion for the Poisson mean θi allows for overdispersion. In
the implementation, θi is restricted to positive values to
ensure the positivity of the generated samples. The model
for μi has two parts. The first part concerns mortality due
to non-influenza related causes (baseline mortality)
which includes a random intercept for calendar
month mi(mi = 1, ..., 12) that models the seasonal back-
ground mortality, and also includes linear, quadratic andcubic effects for temporal changes due to health, demo-graphic or socioeconomic factors. The variable ti (ti = 0, ...,
10) indicates the calendar year; ti = 0 corresponds to the
year 1995. The regression coefficients β1, β2 and β3 meas-
ure these changes. The second part of the model for μi con-
cerns mortality due to influenza. The symbol γi is the
μ λ β β β γ φi m i i i iit t t= + + + +1
22
33 (3)
λmi
Page 3 of 10(page number not for citation purposes)
Emerging Themes in Epidemiology 2008, 5:26 http://www.ete-online.com/content/5/1/26
Poisson parameter from the second level of hierarchy forthe observed influenza-certified mortality, Xi. The param-
eter ϕ measures the effect of influenza-certified mortalityon all cause mortality assuming that all other effects arefixed. This is the parameter of interest. It can also be inter-preted as the ratio of total influenza mortality to influ-enza-certified mortality. Thus, the total excess influenza
mortality for index month i, , is given by
To estimate excess mortality due to influenza, is calcu-
lated using expression 5, with posterior estimates of γi and
ϕ. As total influenza mortality cannot be lower than influ-enza-certified mortality, the minimum value for the range
in the prior distribution for ϕ was set to one (see addi-tional file 1).
To assess the performance of the current model, we alsoanalyzed the data with a modified form of the model pro-posed by Thompson et al. [11]. The modified model hasthe following form:
Yi|μi ~ Poisson(μi) (6)
where β0 is an intercept, β1 and β2 are defined as above, α1
and α2 represent the parameters associated with the Fou-
rier terms and λ is the natural logarithm of the rate ratioassociated with influenza-certified mortality. In contrastto Thompson et al. we used monthly, rather than weeklydata and used observed influenza-certified mortality,rather than proportion of positive influenza tests, as indi-cator for total influenza mortality. For this Thompson-like(TL) model, because of its multiplicative nature, total
excess mortality due to influenza, , given by the expres-
sion
where
To calculate estimated excess mortality due to influenza,all parameters in 8 are replaced by their posterior esti-mates
Statistical analysisThe parameters for this hierarchical model were estimatedusing a Markov chain Monte Carlo (MCMC) algorithmimplemented in WinBUGS, version 1.4.1 (Imperial Col-lege and Medical Research Council, UK) [22]. Uninforma-tive prior distributions were used (additional file 1). Toensure positivity of all θi, the normal priors of this param-eter were truncated at non-positive values (additional file1). The empirical posterior distributions of the parameterswere obtained from MCMC samples of 30,000, resultingfrom three chains with 200,000 burn-in iterations and10,000 samples each. Posterior means and 95% credibleintervals (CIs) were calculated for all parameters of inter-est after ensuring convergence of all model parameters.
The parameters of the TL model could easily be estimatedusing a GLM procedure in any standard statistical softwarepackage. However, to allow for direct comparison of themodel fit we used the same estimation procedure as forthe current model. The fit of the two age-specific modelswas compared using the deviance information criterion(DIC) [23]. DIC penalizes the model goodness-of-fit foradditional complexity. The complexity is measured by theeffective number of parameters.
In order to quantify the variance explained by the fittedmodels, we used a Bayesian version of the classical R-squared [24]. i.e.
where E(·) and V(·) are the operators for the posteriormean and empirical variance, respectively and ei = Yi - μi.The empirical variance of e is computed for each iteration.
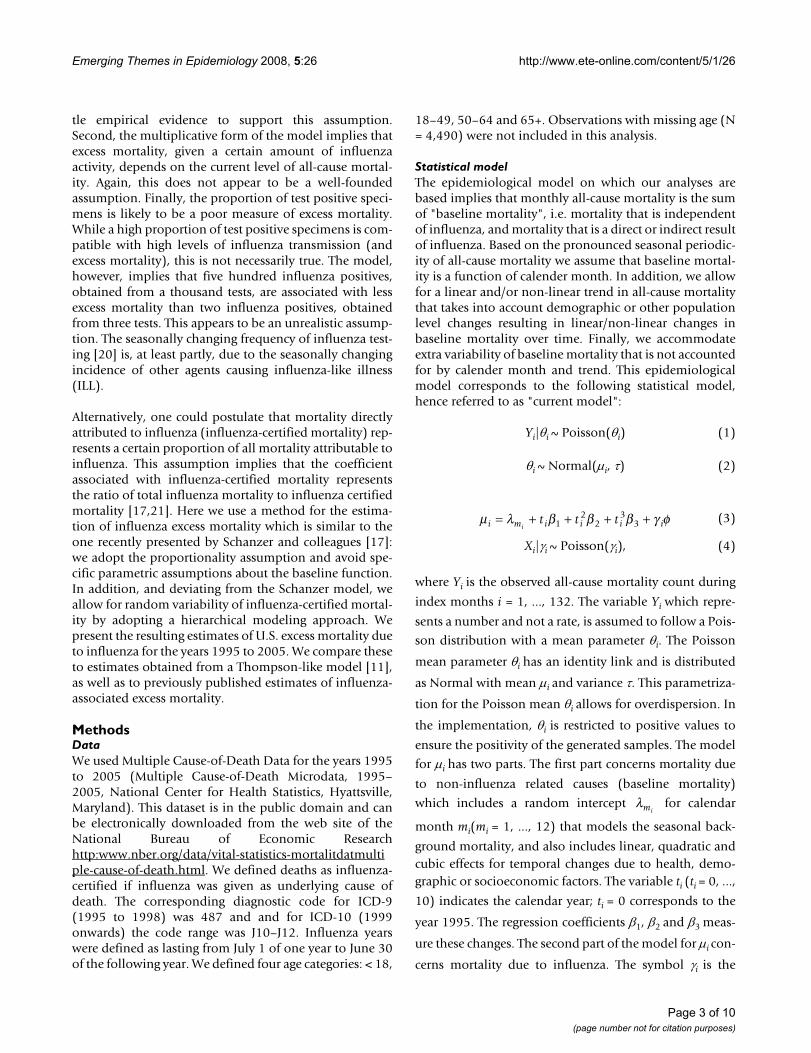
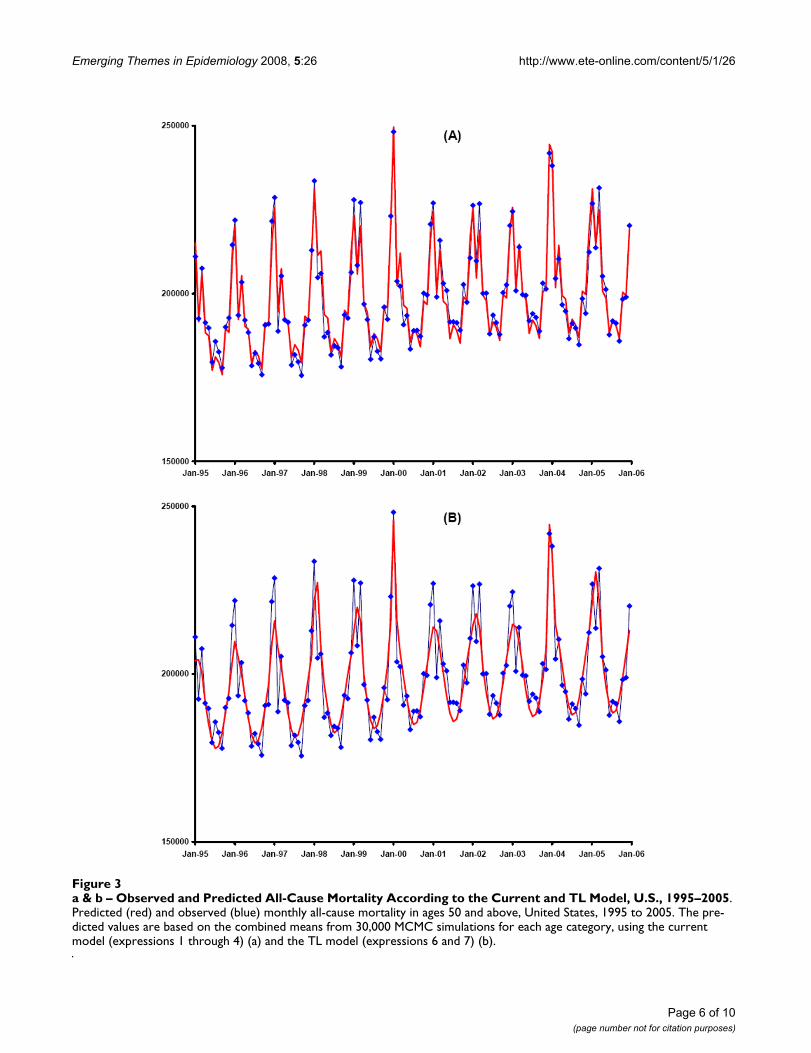
Separate analyses were performed for the four age catego-ries, because of substantial differences in seasonality ofall-cause mortality: While seasonal periodicity is quiteobvious in the oldest category, it distinctly decreases withage and becomes inapparent in the youngest category(Figure 2).
ResultsA total of 26,262,147 deaths over the period of elevenyears were included in this analysis. Of these deaths,12,922 (0.05%) were influenza-certified. The currentmodel (1–4) fit the data very well (Figure 3a) andexplained most of the variance of all-cause mortality
Xi*
Xi i* .= γ φ (5)
ˆ *Xi
ln( ) sin( ) cos( ) ,μ β β β π α π α λi i i it t m m x= + + + + +0 12
2 1 2212
212
(7)
Xi*
Xi i i* ,= −μ μ (8)
ln( ) sin( ) cos( ) .μ β β β π α π αi i it t m m= + + + +0 12
2 1 2212
212
BRSQE Vi
N ei
ViN Yi
= −=( )
=1
1
1
( )
( ), (9)
Page 4 of 10(page number not for citation purposes)

Emerging Themes in Epidemiology 2008, 5:26 http://www.ete-online.com/content/5/1/26
(BRSQ for age categories < 18, 18–49, 50–64 and 65+:0.90, 0.93, 0.97 and 0.96, respectively).
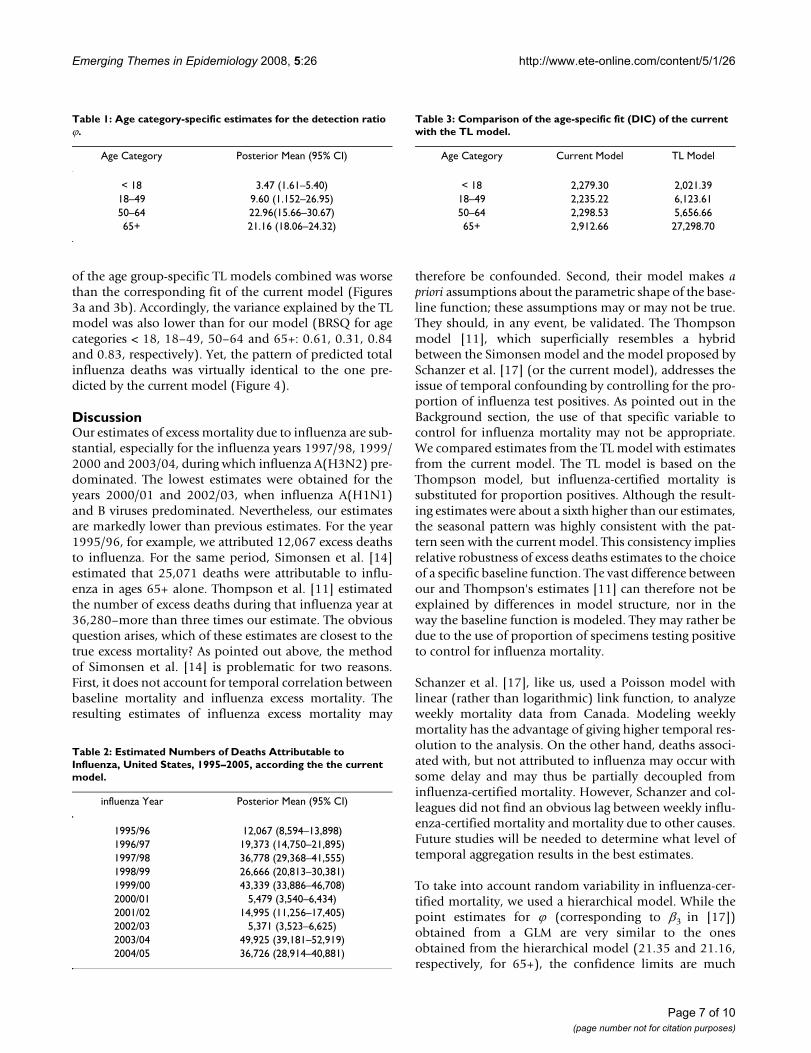
The estimated ratio of influenza-certified deaths to alldeaths attributable to influenza was less than three and ahalf in those younger than 18, over twenty for 50+ andintermediate in the age category 18–49 (Table 1). Overall,we estimated that 260,814 (95% CI: 201,011–290,556)deaths were attributable to influenza over the whole studyperiod. This corresponds to an annual average of 23,710excess deaths. Most of these deaths (90.93%; 95% CI:87.13%–93.67%) occurred in people 65 or older. Far lessrepresented were those between 50 and 64 at time ofdeath (6.61%; 95% CI: 4.56%–8.90%). The two lowestage categories contributed together less than three percent(< 18: 0.83%; 95% CI: 0.40%, 1.31% and 18–49: 1.45%;95% CI: 0.21%–4.85%) to estimated influenza mortality.
Table 2 shows the estimated number of deaths due toinfluenza for full influenza years, according to the currentmodel. The numbers varied widely from year to year. Byfar the largest number of seasonal deaths due to influenzawas observed for 2003/04, with close to 47,000 deaths.The lowest numbers, which only little exceeded one tenthof that, were seen for the years 2000/01 and 2002/03.
The TL model resulted in 302,665 (95% CI: 294,192–311,200) estimated excess deaths due to influenza, whichis 16% higher than our overall estimate (additional file 1).The fit of this model, according to the DIC, was slightlybetter than the current model for the youngest age cate-gory (Table 3), that exhibited little seasonal variation inall-cause mortality. For all other age categories, particu-larly the oldest one, the fit of the TL model, compared tothe current model, was distinctly inferior (Table 3). The fit
All-Cause Mortality, Age Categories <18, 18–49, 50–64 and 65+, U.S., 1995–2005Figure 2All-Cause Mortality, Age Categories <18, 18–49, 50–64 and 65+, U.S., 1995–2005. Monthly all-cause mortality, United States, 1995 to 2005, in the four age categories <18 (red), 18–49 (pink), 50–64 (green) and 65+ (blue).
Page 5 of 10(page number not for citation purposes)
Emerging Themes in Epidemiology 2008, 5:26 http://www.ete-online.com/content/5/1/26
Page 6 of 10(page number not for citation purposes)
a & b – Observed and Predicted All-Cause Mortality According to the Current and TL Model, U.S., 1995–2005Figure 3a & b – Observed and Predicted All-Cause Mortality According to the Current and TL Model, U.S., 1995–2005. Predicted (red) and observed (blue) monthly all-cause mortality in ages 50 and above, United States, 1995 to 2005. The pre-dicted values are based on the combined means from 30,000 MCMC simulations for each age category, using the current model (expressions 1 through 4) (a) and the TL model (expressions 6 and 7) (b).
Emerging Themes in Epidemiology 2008, 5:26 http://www.ete-online.com/content/5/1/26
of the age group-specific TL models combined was worsethan the corresponding fit of the current model (Figures3a and 3b). Accordingly, the variance explained by the TLmodel was also lower than for our model (BRSQ for agecategories < 18, 18–49, 50–64 and 65+: 0.61, 0.31, 0.84and 0.83, respectively). Yet, the pattern of predicted totalinfluenza deaths was virtually identical to the one pre-dicted by the current model (Figure 4).
DiscussionOur estimates of excess mortality due to influenza are sub-stantial, especially for the influenza years 1997/98, 1999/2000 and 2003/04, during which influenza A(H3N2) pre-dominated. The lowest estimates were obtained for theyears 2000/01 and 2002/03, when influenza A(H1N1)and B viruses predominated. Nevertheless, our estimatesare markedly lower than previous estimates. For the year1995/96, for example, we attributed 12,067 excess deathsto influenza. For the same period, Simonsen et al. [14]estimated that 25,071 deaths were attributable to influ-enza in ages 65+ alone. Thompson et al. [11] estimatedthe number of excess deaths during that influenza year at36,280–more than three times our estimate. The obviousquestion arises, which of these estimates are closest to thetrue excess mortality? As pointed out above, the methodof Simonsen et al. [14] is problematic for two reasons.First, it does not account for temporal correlation betweenbaseline mortality and influenza excess mortality. Theresulting estimates of influenza excess mortality may
therefore be confounded. Second, their model makes apriori assumptions about the parametric shape of the base-line function; these assumptions may or may not be true.They should, in any event, be validated. The Thompsonmodel [11], which superficially resembles a hybridbetween the Simonsen model and the model proposed bySchanzer et al. [17] (or the current model), addresses theissue of temporal confounding by controlling for the pro-portion of influenza test positives. As pointed out in theBackground section, the use of that specific variable tocontrol for influenza mortality may not be appropriate.We compared estimates from the TL model with estimatesfrom the current model. The TL model is based on theThompson model, but influenza-certified mortality issubstituted for proportion positives. Although the result-ing estimates were about a sixth higher than our estimates,the seasonal pattern was highly consistent with the pat-tern seen with the current model. This consistency impliesrelative robustness of excess deaths estimates to the choiceof a specific baseline function. The vast difference betweenour and Thompson's estimates [11] can therefore not beexplained by differences in model structure, nor in theway the baseline function is modeled. They may rather bedue to the use of proportion of specimens testing positiveto control for influenza mortality.
Schanzer et al. [17], like us, used a Poisson model withlinear (rather than logarithmic) link function, to analyzeweekly mortality data from Canada. Modeling weeklymortality has the advantage of giving higher temporal res-olution to the analysis. On the other hand, deaths associ-ated with, but not attributed to influenza may occur withsome delay and may thus be partially decoupled frominfluenza-certified mortality. However, Schanzer and col-leagues did not find an obvious lag between weekly influ-enza-certified mortality and mortality due to other causes.Future studies will be needed to determine what level oftemporal aggregation results in the best estimates.
To take into account random variability in influenza-cer-tified mortality, we used a hierarchical model. While thepoint estimates for ϕ (corresponding to β3 in [17])obtained from a GLM are very similar to the onesobtained from the hierarchical model (21.35 and 21.16,respectively, for 65+), the confidence limits are much
Table 1: Age category-specific estimates for the detection ratio ϕ.
Age Category Posterior Mean (95% CI)
< 18 3.47 (1.61–5.40)18–49 9.60 (1.152–26.95)50–64 22.96(15.66–30.67)65+ 21.16 (18.06–24.32)
Table 2: Estimated Numbers of Deaths Attributable to Influenza, United States, 1995–2005, according the the current model.
influenza Year Posterior Mean (95% CI)
1995/96 12,067 (8,594–13,898)1996/97 19,373 (14,750–21,895)1997/98 36,778 (29,368–41,555)1998/99 26,666 (20,813–30,381)1999/00 43,339 (33,886–46,708)2000/01 5,479 (3,540–6,434)2001/02 14,995 (11,256–17,405)2002/03 5,371 (3,523–6,625)2003/04 49,925 (39,181–52,919)2004/05 36,726 (28,914–40,881)
Table 3: Comparison of the age-specific fit (DIC) of the current with the TL model.
Age Category Current Model TL Model
< 18 2,279.30 2,021.3918–49 2,235.22 6,123.6150–64 2,298.53 5,656.6665+ 2,912.66 27,298.70
Page 7 of 10(page number not for citation purposes)

Emerging Themes in Epidemiology 2008, 5:26 http://www.ete-online.com/content/5/1/26
wider for the latter (95% credible interval 18.06, 24.32 vs.Wald 95% confidence interval 20.91, 21.80). This mayeven be more pronounced for weekly data, where num-bers of influenza-certified deaths are often quite small. Tothe extent that our hierarchical model takes into accountrandom variability of influenza-certified deaths and thusleads to wider confidence limits around the resultingexcess mortality estimates, it is more conservative thannon-hierarchical GLM models.
The potentially most serious shortcoming of ourapproach to influenza excess mortality estimation relatesto the possibility that influenza-certified mortality is apoor indicator of total influenza mortality. Although adeath certificate diagnosis of influenza will likely only begiven under strong suspicion of that cause, the diagnosiswill rarely have been laboratory-confirmed and thereforeis likely of low specificity. As this indicator explains mor-
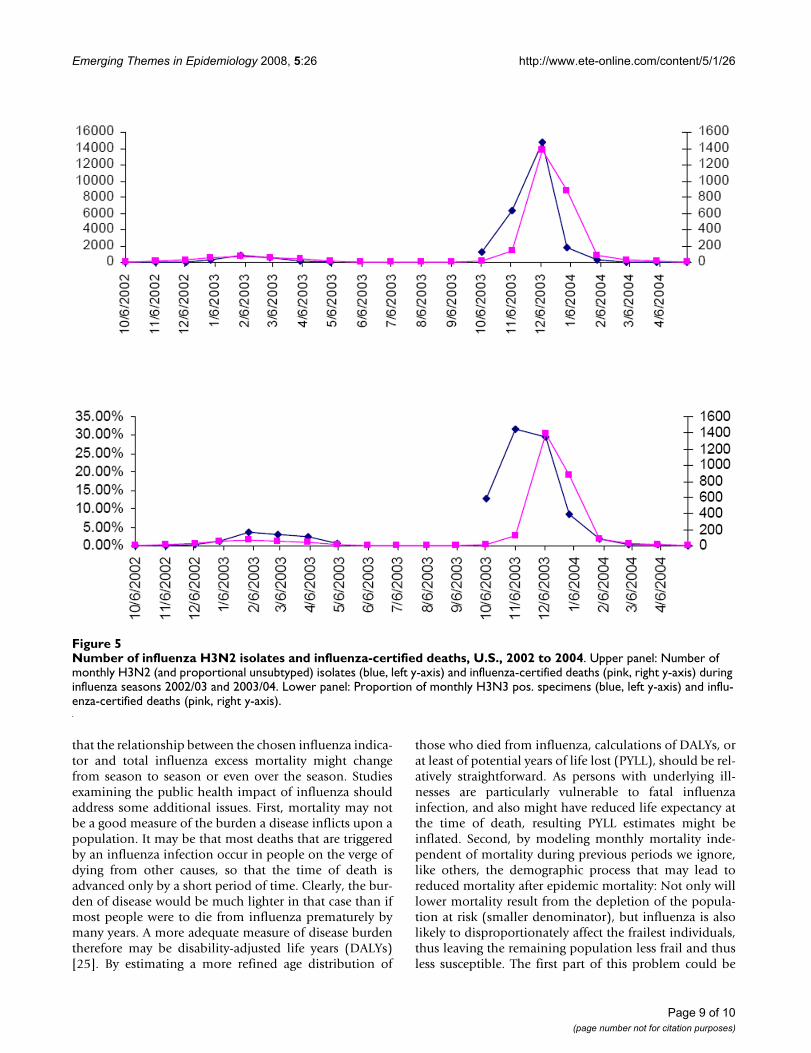
tality in excess of the seasonal baseline very well one couldspeculate that a better indicator of influenza mortalitywould lead to even lower estimates of influenza excessmortality. A preliminary comparison of the number ofinfluenza A(H3N2) isolates with influenza-certified deathfor two influenza seasons (2002/03 and 2003/04)revealed a remarkably close correspondence of the twoindicators (Figure 5). Could it be that the number of influ-enza isolates informs the death certificate diagnosis? Thecross-validation of various indicators for influenza mor-tality will be an important target of future research. Thevery high proportion of all-cause mortality explained byour model makes it appear quite unlikely that a substan-tially better model of all-cause mortality can be con-structed. We therefore believe that our estimates of excessmortality are better than previous estimates, which areinvariably larger than ours. Future studies of excess mor-tality due to influenza should also consider the possibility
Predicted Influenza Mortality according to the Current and the TL Model, U.S., 1995–2005Figure 4Predicted Influenza Mortality according to the Current and the TL Model, U.S., 1995–2005. Predicted total influ-enza mortality, United States, 1995 to 2005 according to the current (blue) and the TL model (red). The predicted values are based on the combined means from 30,000 MCMC simulations for each age category.
Page 8 of 10(page number not for citation purposes)
Emerging Themes in Epidemiology 2008, 5:26 http://www.ete-online.com/content/5/1/26
that the relationship between the chosen influenza indica-tor and total influenza excess mortality might changefrom season to season or even over the season. Studiesexamining the public health impact of influenza shouldaddress some additional issues. First, mortality may notbe a good measure of the burden a disease inflicts upon apopulation. It may be that most deaths that are triggeredby an influenza infection occur in people on the verge ofdying from other causes, so that the time of death isadvanced only by a short period of time. Clearly, the bur-den of disease would be much lighter in that case than ifmost people were to die from influenza prematurely bymany years. A more adequate measure of disease burdentherefore may be disability-adjusted life years (DALYs)[25]. By estimating a more refined age distribution of
those who died from influenza, calculations of DALYs, orat least of potential years of life lost (PYLL), should be rel-atively straightforward. As persons with underlying ill-nesses are particularly vulnerable to fatal influenzainfection, and also might have reduced life expectancy atthe time of death, resulting PYLL estimates might beinflated. Second, by modeling monthly mortality inde-pendent of mortality during previous periods we ignore,like others, the demographic process that may lead toreduced mortality after epidemic mortality: Not only willlower mortality result from the depletion of the popula-tion at risk (smaller denominator), but influenza is alsolikely to disproportionately affect the frailest individuals,thus leaving the remaining population less frail and thusless susceptible. The first part of this problem could be
Number of influenza H3N2 isolates and influenza-certified deaths, U.S., 2002 to 2004Figure 5Number of influenza H3N2 isolates and influenza-certified deaths, U.S., 2002 to 2004. Upper panel: Number of monthly H3N2 (and proportional unsubtyped) isolates (blue, left y-axis) and influenza-certified deaths (pink, right y-axis) during influenza seasons 2002/03 and 2003/04. Lower panel: Proportion of monthly H3N3 pos. specimens (blue, left y-axis) and influ-enza-certified deaths (pink, right y-axis).
Page 9 of 10(page number not for citation purposes)

Emerging Themes in Epidemiology 2008, 5:26 http://www.ete-online.com/content/5/1/26
remedied by modeling the mortality rates rather thannumbers of deaths. The second one could be addressed bymaking specific assumptions on the frailty distribution inthe population and on the association between that frailtycharacteristic and relative mortality risk.
ConclusionPrevious estimates of excess mortality due to influenzamay be biased and inflated. We propose a two-level hier-archical Poisson model where the baseline mortality var-ies with time. The goodness-of-fit statistic indicates thatthis model fits the data very well, explaining well above90% of the observed variation of all-cause mortality dur-ing the eleven years study period. The resulting estimatesare therefore likely of high validity. Future attempts toquantify the public health burden of influenza shouldalso explore demographic approaches that take intoaccount life expectancy.
Competing interestsThe authors declare that they have no competing interests.
Authors' contributionsIMF conceived the paper, conducted analyses and wrotethe manuscript. MMH provided statistical expertise andcontributed to the manuscript.
Additional material
AcknowledgementsMMH was partly supported by the National Institutes of Health (NIH grant # 1 R03 CA125828-01). We thank anonymous reviewers whose criticism helped to substantially improve this paper. We would also like to thank Drs. Eric Brenner, MD, and Robert T. Ball, MD, MPH for their insight into the accuracy of the death certificate diagnosis "influenza".
References1. Zambon MC: Epidemiology and pathogenesis of influenza. J
Antimicrob Chemother 1999, 44(Suppl B):3-9.2. Collins SD: Excess Mortality from Causes other than Influenza
and Pneumonia during Influenza Epidemics. Public HealthReports 1932, 47(46):2159-79.
3. Eickhoff TC, Sherman IL, Serfling RE: Observations on excessmortality associated with epidemic influenza. Jama 1961,176:776-82.
4. Housworth J, Langmuir AD: Excess mortality from epidemicinfluenza, 1957–1966. Am J Epidemiol 1974, 100:40-8.
5. Choi K, Thacker SB: An evaluation of influenza mortality sur-veillance, 1962–1979. II. Percentage of pneumonia and influ-enza deaths as an indicator of influenza activity. Am J Epidemiol1981, 113(3):227-35.
6. Choi K, Thacker SB: Mortality during influenza epidemics inthe United States, 1967–1978. Am J Public Health 1982,72(11):1280-3.
7. Lui KJ, Kendal AP: Impact of influenza epidemics on mortalityin the United States from October 1972 to May 1985. Am JPublic Health 1987, 77(6):712-6.
8. Simonsen L, Clarke MJ, Williamson GD, Stroup DF, Arden NH,Schonberger LB: The impact of influenza epidemics on mortal-ity: introducing a severity index. Am J Public Health 1997,87(12):1944-50.
9. Fleming DM: The contribution of influenza to combined acuterespiratory infections, hospital admissions, and deaths inwinter. Commun Dis Public Health 2000, 3:32-8.
10. Donaldson GC, Keatinge WR: Excess winter mortality: influ-enza or cold stress? Observational study. Bmj 2002,324(7329):89-90.
11. Thompson WW, Shay DK, Weintraub E, Brammer L, Cox N, Ander-son LJ, Fukuda K: Mortality associated with influenza and res-piratory syncytial virus in the United States. Jama 2003,289(2):179-86.
12. Reichert TA, Simonsen L, Sharma A, Pardo SA, Fedson DS, Miller MA:Influenza and the winter increase in mortality in the UnitedStates, 1959–1999. Am J Epidemiol 2004, 160(5):492-502.
13. Uphoff H, Stilianakis NI: Influenza-associated excess mortalityfrom monthly total mortality data for Germany from 1947to 2000. Methods Inf Med 2004, 43(5):486-92.
14. Simonsen L, Reichert TA, Viboud C, Blackwelder WC, Taylor RJ,Miller MA: Impact of influenza vaccination on seasonal mor-tality in the US elderly population. Arch Intern Med 2005,165(3):265-72.
15. Zucs P, Buchholz U, Haas W, Uphoff H: Influenza associatedexcess mortality in Germany, 1985–2001. Emerg Themes Epide-miol 2005, 2:6.
16. Dushoff J, Plotkin JB, Viboud C, Earn DJ, Simonsen L: Mortality dueto influenza in the United States-an annualized regressionapproach using multiple-cause mortality data. Am J Epidemiol2006, 163(2):181-7.
17. Schanzer DL, Tam TW, Langley JM, Winchester BT: Influenza-attributable deaths, Canada 1990–1999. Epidemiol Infect 2007,135(7):1109-16.
18. Serfling RE: Methods For Current Statistical-Analysis ofExcess Pneumonia-Influenza Deaths. Public Health Reports 1963,78(6):494-506.
19. Stroup DF, Thacker SB, Herndon JL: Application of multiple timeseries analysis to the estimation of pneumonia and influenzamortality by age 1962–1983. Stat Med 1988, 7(10):1045-59.
20. Anonymous: Seasonal Flu – Flu Activity & Surveillance. 2008.21. Gay NJ, Andrews NJ, Trotter CL, Edmunds WJ: Estimating deaths
due to influenza and respiratory syncytial virus. Jama 2003,289(19):2499. author reply 2500-2
22. Spiegelhalter D, Thomas A, Best N, Lunn D: WinBUGS User Man-ual. 2003.
23. Spiegelhalter D, Best N, Carlin B, Linde A: Bayesian measures ofmodel complexity and fit. Journal of the Royal Statistical Society,Series B 2002, 64:583-639.
24. Gelman A, Pardoe L: Bayesian measures of explained varianceand pooling in multilevel (hierarchical) models. Technometrics2006, 48(2):241-251. [044CW Times Cited:1 Cited ReferencesCount:34]
25. Michaud CM, McKenna MT, Begg S, Tomijima N, Majmudar M, Bulza-cchelli MT, Ebrahim S, Ezzati M, Salomon JA, Kreiser JG, Hogan M,Murray CJ: The burden of disease and injury in the UnitedStates 1996. Popul Health Metr 2006, 4:11.
Additional file 1Bayesian analysis of influenza mortality, U.S., 1995–2005 using WinBUGS.Click here for file[http://www.biomedcentral.com/content/supplementary/1742-7622-5-26-S1.zip]
Page 10 of 10(page number not for citation purposes)