emission control technology for light-duty vehicles … · emission control technology for...
TRANSCRIPT

EMISSION CONTROL TECHNOLOGYFOR LIGHT-DUTY VEHICLES
John J. MooneyEngelhard Corporation
AVECC 2001Asian Vehicle Emission Control Conference
Jan. 30 – Feb 1, 2001Bangkok, Thailand
2/21/01 1ENG2.ppt 1
2/21/01 1ENG2.ppt 2
OUTLINE
v U.S. Emission Control Plan• A Success Story – With More to Be Done
v Light-Duty Vehicle Emission Control System
v Catalyst Performance Mechanisms
v Heat Transfer and Mass Transfer Regimes
v Catalyst Deactivation Mechanisms
v Unleaded Gasoline With Low Sulfur Content
v New Catalyst Substrates
v U.S. and Euro Emission Standards, Test Cycleand Test Set-Ups
v Closing Remarks

2/21/01 1ENG2.ppt 3
EMISSION CONTROL PLANS HAVE CAUSED U.S. AIR POLLUTION TO DECLINE
0
20
40
60
80
100
120
140
CO (-29%)
NOx(+17%)
VOC(-43%)
SO2(-40%)
PM10(-77%)
Mill
ion
To
ns
1970 1999
0
50
100
150
200
250
Th
ou
san
d T
on
s
v Carbon Monoxide (CO)
v Lead (Pb)
v Nitrogen Dioxide (NO2)
v Ozone (O3) - Formed by Volatile Organic Compounds (VOCs) and Nitrogen Oxides (NOx)
v Particular Matter (PM)
v Sulfur Dioxide (SO2)
Six Principal Air Pollutants Tracked Nationally
Pb(-98%)
2/21/01 1ENG2.ppt 4
WITHOUT AN EMISSION CONTROL PLAN U.S. AIR POLLUTION WOULD HAVE GROWN INSTEAD OF DECLINE
U.S. Gross Domestic Product Increased 147%. Vehicle Miles Traveled Increased 140%
U.S. Population Increased 33%
Aggregate Emissions Decreased 31% (Six Principal Pollutants)
1970 19991980 1990
Comparison of Growth Areas and Emission Trends

2/21/01 1ENG2.ppt 5
UNDERSTANDING EMISSION CONTROL TECHNOLOGY PROVIDES THE BASIS FOR ASIAN COUNTRIES
FUTURE EMISSION CONTROL PLAN
v Exhaust Emission Controls for Passenger Car and Light-Duty Vehicles
v How Control Systems Work
v What Can Be Accomplished by the Control System
2/21/01 1ENG2.ppt 6
NEAR ZERO EMISSIONS REQUIRE SYSTEMS ENGINEERING

2/21/01 1ENG2.ppt 7
THE AIR/FUEL MIXTURE HAS A PRIMARYEFFECT ON BASE ENGINE EMISSIONS
16
14
12
10
8
6
4
2
0
Em
issi
on
s, m
ol %
3200
2800
2400
2000
1600
1200
800
400
0
Em
ission
s, pp
m
CO2
NO
CO O2
StoichiometricA/F
HCH2
10 12 14 16 18 20A/F Mass Ratio
1.4
Fuel Equivalence Ratio1.31.2 1.1 1.0 0.9 0.8
2/21/01 1ENG2.ppt 8
BASIC COMPONENTS OF THETWC CLOSED-LOOP FUEL METERING SYSTEM
EngineEngine
Fuel Tank
Electronic Control Unit Electric Fuel Pump Bosch LH Jetronic
TWC Catalyst
TemperatureSensor
Throttle-PositionSwitch
Fuel MeteringInjection Valve
Oxygen(Lambda)Sensor
Fuel-PressureRegulator
Air
Idle Actuator
Hot-Wire MassAir-Flow Meter

2/21/01 1ENG2.ppt 9
SCHEMATIC FOR THELAMBDA
CLOSED-LOOP CONTROL
The Closed-Loop Fuel Metering System Maintains the Air/Fuelto the Stoichiometric Mixture
Air Ratio λλ
Vo
ltag
e U
λλ
0,6 0
200
400
600
800
mV
0,8 1,0 1,2 1,4 1,6
Air Meter
Gasoline
Fuel Metering
EngineEngine
ElectronicElectronicControlControlUnit (ECU) Unit (ECU)
CatalyticConverter
LambdaOxygenSensor
ExhaustGas
THE AIR-FUELINFLUENCES THE
LAMBDA SENSORSVOLTAGE SIGNAL
2/21/01 1ENG2.ppt 10
THE OXYGEN SENSOR CONTROLS THEAIR/FUEL MIXTURE TO AN AVERAGE MIXTURE
Sensor Voltage, 500 mv Set Point, 1600 RPMGood Cylinder to Cylinder Fuel Distribution
1 Sec.1000
0
500
Sen
sor
Po
ten
tial
(mv)

2/21/01 1ENG2.ppt 11
THE TWC CATALYST AFFECTS AVERAGEEMISSION REDUCTIONS
Conversion of ( ) NOx, ( ) CO, and ( ) Hydrocarbons for a TWC as aFunction of the Air/Fuel A/F) Ratio. The Shaded Area Shows the A/F RatioWindow Where the TWC Catalyst Functions at 80% Efficiency at 400°C.
StoichiometricA/F/Ratio
14.4 14.5 14.6 14.7 14.8 14.90
20
40
60
80
100
A/F Ratio
Cat
alys
t E
ffic
ien
cy, %
LeanRich
2/21/01 1ENG2.ppt 12

2/21/01 1ENG2.ppt 13
SINGLE-POINT FUEL INJECTION (TBI)
1 Fuel, 2 Air, 3 Throttle Valve, 4 Intake Manifold, 5 Injector, 6 Engine.
2
3
4
1 5
6
2/21/01 1ENG2.ppt 14
MULTIPOINT FUEL INJECTION
1 Fuel, 2 Air, 3 Throttle Valve, 4 Intake Manifold, 5 Injectors, 6 Engine.
2
3
4
1
5
6
2/21/01 1ENG2.ppt 15
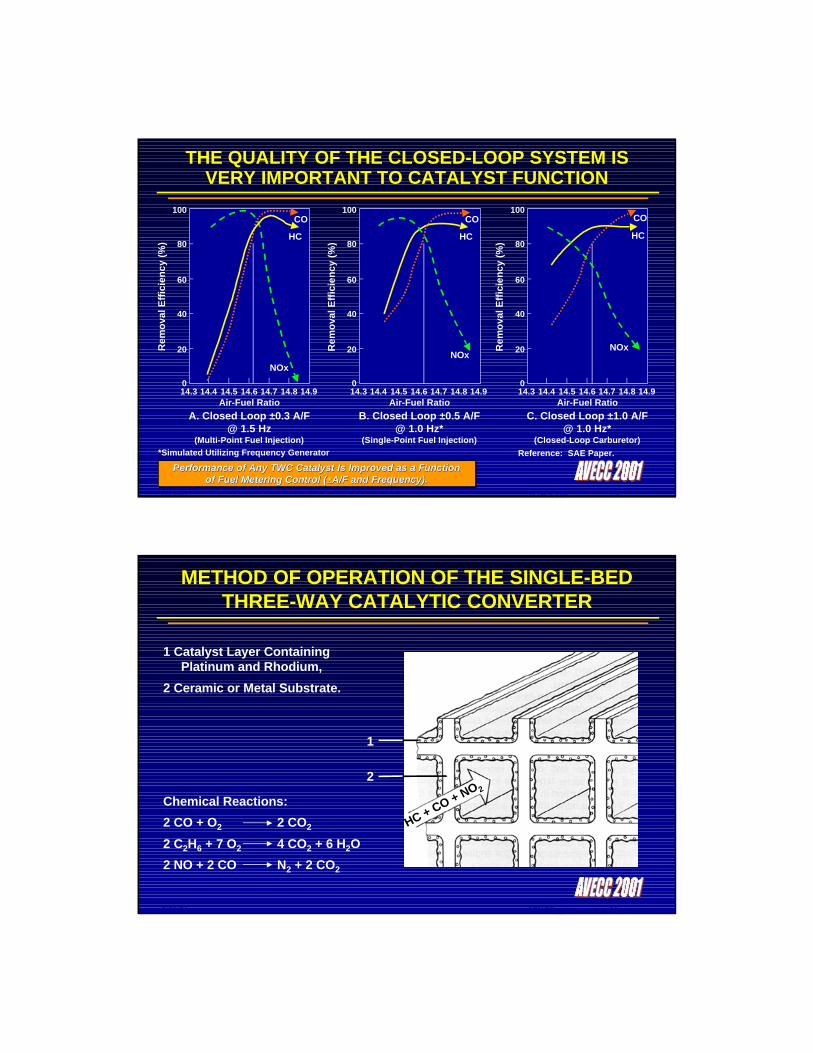
THE QUALITY OF THE CLOSED-LOOP SYSTEM IS VERY IMPORTANT TO CATALYST FUNCTION
A. Closed Loop ±0.3 A/F@ 1.5 Hz
(Multi-Point Fuel Injection)
Performance of Any TWC Catalyst Is Improved as a FunctionPerformance of Any TWC Catalyst Is Improved as a Functionof Fuel Metering Control (of Fuel Metering Control (±±A/F and Frequency).A/F and Frequency).
*Simulated Utilizing Frequency Generator
C. Closed Loop ±1.0 A/F@ 1.0 Hz*
(Closed-Loop Carburetor)
Rem
ova
l Eff
icie
ncy
(%
)
NOx
0
20
40
60
80
100
Air-Fuel Ratio14.3 14.4 14.5 14.6 14.7 14.8 14.9
HC
CO
14.3 14.4 14.5 14.6 14.7 14.8 14.9
B. Closed Loop ±0.5 A/F@ 1.0 Hz*
(Single-Point Fuel Injection)
Rem
ova
l Eff
icie
ncy
(%
)
NOx
0
20
40
60
80
100
Air-Fuel Ratio
HC
CO
Rem
ova
l Eff
icie
ncy
(%
)
NOx
0
20
40
60
80
100
Air-Fuel Ratio14.3 14.4 14.5 14.6 14.7 14.8 14.9
HC
CO
Reference: SAE Paper.
2/21/01 1ENG2.ppt 16
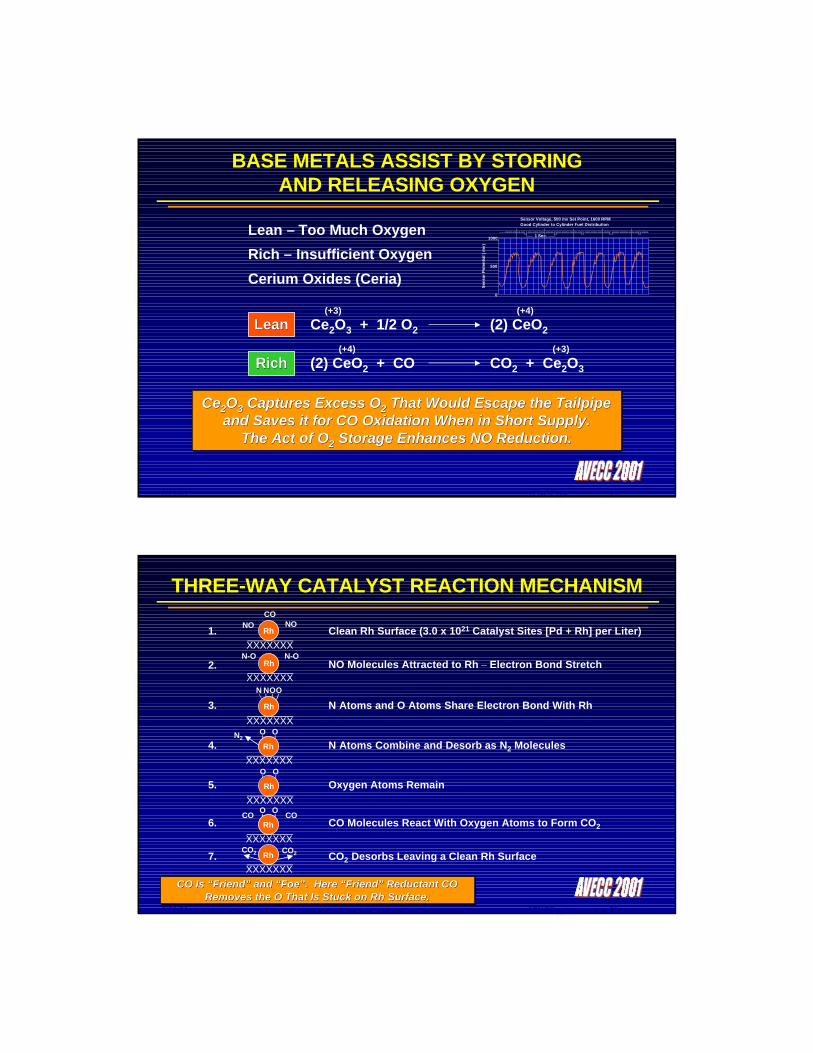
METHOD OF OPERATION OF THE SINGLE-BEDTHREE-WAY CATALYTIC CONVERTER
1 Catalyst Layer Containing Platinum and Rhodium,
2 Ceramic or Metal Substrate.
1
2
Chemical Reactions:
2 CO + O2 2 CO2
2 C2H6 + 7 O2 4 CO2 + 6 H2O
2 NO + 2 CO N2 + 2 CO2
HC + CO + NO 2

2/21/01 1ENG2.ppt 17
ActivatedCatalyst
Layer
Substrate
Reductants
HCCOH2
Oxidants
NOx
O2
Pd SitesRh Sites
Competitive Reactions:
HC, CO, H2 + O2 CO2 + H2O
NO + Reductant N2 + CO2, H2O
Diffusion
Reaction Rates Are Dissimilar. If Oxygen Consumes the Reaction Rates Are Dissimilar. If Oxygen Consumes the ReductantReductant, There Is Less Available for NO Reduction., There Is Less Available for NO Reduction.
Sensor Voltage, 500 mv Set Point, 1600 RPMGood Cylinder to Cylinder Fuel Distribution
1 Sec.1000
0
500
Sen
sor
Po
ten
tial
(mv
)PALLADIUM AND RHODIUM FUNCTIONS INTERACT
IN SINGLE LAYERED TWC CATALYSTS
2/21/01 1ENG2.ppt 18
PALLADIUM AND RHODIUM FUNCTIONS SEPARATED IN DOUBLE LAYERED TWC CATALYSTS
ActivatedRh Layer
ActivatedPd Layer
Substrate
Reductants
HCCOH2
Oxidants
NOx
O2
Pd SitesRh Sites
Competitive Reactions:
HC, CO, H2 + O2 CO2 + H2O
NO + Reductant N2 + CO2, H2O
Diffusion
A Separate A Separate Rh Rh Layer Promotes the InteractionLayer Promotes the Interactionof NO With the of NO With the ReductantReductant..
Sensor Voltage, 500 mv Set Point, 1600 RPMGood Cylinder to Cylinder Fuel Distribution
1 Sec.1000
0
500
Sen
sor
Po
ten
tial
(mv)
2/21/01 1ENG2.ppt 19
BASE METALS ASSIST BY STORINGAND RELEASING OXYGEN
Lean – Too Much Oxygen
Rich – Insufficient Oxygen
Cerium Oxides (Ceria)
CeCe22OO33 Captures Excess OCaptures Excess O22 That Would Escape the Tailpipe That Would Escape the Tailpipe and Saves it for CO Oxidation When in Short Supply.and Saves it for CO Oxidation When in Short Supply.
The Act of OThe Act of O22 Storage Enhances NO Reduction.Storage Enhances NO Reduction.
LeanLean Ce2O3 + 1/2 O2 (2) CeO2
(+3) (+4)
RichRich (2) CeO2 + CO CO2 + Ce2O3
(+4) (+3)
Sensor Voltage, 500 mv Set Point, 1600 RPMGood Cylinder to Cylinder Fuel Distribution
1 Sec.1000
0
500
Sen
sor
Po
ten
tial
(m
v)
2/21/01 1ENG2.ppt 20
N2
XXXXXXX
XXXXXXX
XXXXXXX
XXXXXXXClean Rh Surface (3.0 x 10²¹ Catalyst Sites [Pd + Rh] per Liter)
NO Molecules Attracted to Rh – Electron Bond Stretch
N Atoms and O Atoms Share Electron Bond With Rh
N Atoms Combine and Desorb as N2 Molecules
Oxygen Atoms Remain
CO Molecules React With Oxygen Atoms to Form CO2
CO2 Desorbs Leaving a Clean Rh Surface
1.
2.
3.
4.
5.
6.
7.
THREE-WAY CATALYST REACTION MECHANISM
CO Is “Friend” and “Foe”. Here “Friend” CO Is “Friend” and “Foe”. Here “Friend” Reductant Reductant CO CO Removes the O That Is Stuck on Removes the O That Is Stuck on Rh Rh Surface.Surface.
NO NORh
CO
N-ORh
O
Rh
ON N
Rh
O O
CO CO
CO2 CO2
N-O
XXXXXXX
Rh
O O
XXXXXXX
Rh
O O
XXXXXXX
Rh

2/21/01 1ENG2.ppt 21
Pt SURFACE PROVIDES THE MEETING PLACE FOR OXIDATION REACTANTS
Excess “Foe” CO Is Oxidized to COExcess “Foe” CO Is Oxidized to CO22..
Clean Pt Surface1.O2 O2
CO
O2 Molecule Attracted – Electron Bond Stretch2.O-O
O Atoms Share Electron With Pt3.
O O
CO2 Desorbs, Leaving a Clean Pt SurfaceCO2 CO2
5.
CO Reacts With O Atoms to Form CO24.
O OCO CO
XXXXXXX
Pt
XXXXXXX
Pt
XXXXXXX
Pt
XXXXXXX
Pt
XXXXXXX
Pt
2/21/01 1ENG2.ppt 22
THE THREE-WAY CATALYTIC CONVERTER:HIGH PERFORMANCE IN CLOSE-COUPLED AND
UNDERFLOOR APPLICATIONS
v Catalyst Layer Open Porous Structure With Support Materials of High Thermal Stability
v Integrated HC AdsorptionFunctions
v Mounting Materials WithImproved Durability
v High Cell Density Ceramicor Metallic Substrates
v Insulation for Heat Management
Source: MECA

2/21/01 1ENG2.ppt 23
HEAT TRANSFER, CATALYST ACTIVITY ANDMASS TRANSFER MECHANISMS DOMINATE
DURING DIFFERENT CONDITIONS
v Regime 1 – Heat-Up of Catalyst/Substrate –Mechanism: Heat Transfer
v Regime 2 – Ignition and Light-Off of Catalyst Layer –Mechanism: Specific Catalyst Activity
v Regime 3 – Catalyst Intermediate Hot Performance –Mechanism: Feeder Pore Restriction
v Regime 4 – Catalyst Hot Performance –Mechanism: Mass Transfer Limited
2/21/01 1ENG2.ppt 24
CONVERSION vs TEMPERATURE
Mass Transfer
Pore Diffusion
Chemical Reactionor Kinetic Control
Conversion
Temperature
Heat Transfer

2/21/01 1ENG2.ppt 25
REGIME 1 – HEAT TRANSFER FACTORS
v Exhaust Gas:
• Mass Flow and Temperature
v Catalyst/Substrate:
• Thermal Mass/Volume
• Surface Area/Volume
2/21/01 1ENG2.ppt 26
REGIME 2 – CATALYST IGNITION ANDLIGHT-OFF FACTORS
v Catalyst Activity
• Reaction Rate Is Controlling Mechanism
v Exhaust Gas Temperature
v Chemical Energy: Exothermic Reaction

2/21/01 1ENG2.ppt 27
REGIME 3 – INTERMEDIATEHOT PERFORMANCE FACTORS
v Not Seen in New Catalysts
v Important for Aged Catalyst Performance, Due to:
• Accumulation of Debris, or Oil Ash
• High Temperature Exposure
– Sintering Causing Smaller Pore Diameter
2/21/01 1ENG2.ppt 28
REGIME 4 – HOT PERFORMANCE FACTORS
v Reaction Rate Is Very Fast on Catalyst Surface
v Limiting Factor Is the Mass Transfer to the Surface
v Mass Transfer Unit – 90% Conversion
v Developing Laminar Flow
v High Substrate Cell Density – ImprovesDiffusion Path
Mass Transfer Limited Catalyst Performance

2/21/01 1ENG2.ppt 29
ENGINE DESIGN FACTORS ASSISTCATALYST PERFORMANCE
v Less Chokev Lean Cold Startv More Efficient Combustionv Higher Exhaust Temperature – Quicker Catalyst/Substrate Heat-Up
Variable Valve Timing
v Manifoldv Thin-Wall Insulated Exhaust Pipe to Catalyst
Low Exhaust System Thermal Mass
v Honda Observer System – Trims Each Cylinder Air/Fuelv Multi-Point Sequentialv Multi-Pointv Single-Point
Advanced Fuel Metering Systems in Order of Declining Catalyst Performance
2/21/01 1ENG2.ppt 30
CATALYST DEACTIVATION MECHANISMS
v Catalyst Layer Particle Sinteringv Precious Metal Catalyst Sintering
Thermal: Above 850°C to 1050°C
v Leadv Manganesev Phosphorous
Poisons:
v Engine Debrisv Oil Ash: Zn, P, Ca
Masking Agents:
v Sulfur Compounds
Inhibitors:

2/21/01 1ENG2.ppt 31
SINTERING OF THE CATALYTIC SPECIES
High SurfaceArea Support
Sintered PreciousMetal Site
Dispersed Precious Metal Site
Ceramic Wall of Monolith
2/21/01 1ENG2.ppt 32
SINTERING OF THE SUPPORT MATERIAL
Sintering of Alumina Support
Sintering of Precious Metal
Ceramic Wall of Monolith

2/21/01 1ENG2.ppt 33
SELECTIVE AND NON-SELECTIVE POISONING
Coating of Catalyst Surface
Selective Poisoning of Catalyst Site
Plugging of Catalyst Pores
Ceramic Wall of Monolith
2/21/01 1ENG2.ppt 34
EFFECT OF DEACTIVATION ON CATALYST LIGHT-OFF
Loss of Active Sites = Sintering of Sites and SupportPore Diffusion = Smaller Effective PoresMasking = Some Surface Sites Covered and Pores Blocked
Fresh Catalyst
Loss ofActive
Sites
Pore Diffusion
Masking
60050040030020010000
20
40
60
80
100
Pore Diffusion
Co
nve
rsio
n (
%)
Temperature (°C)

2/21/01 1ENG2.ppt 35
UNLEADED GASOLINE ISAN ABSOLUTE NECESSITY
v Thailand Did it – Carefully, Actually Over-Carefully
v China Did it – Started Beijing 6/1/96 – Then City by City - Now the Whole Country Has Unleaded and No Leaded Gasoline
v India Is Doing it – Started in Delhi 7/1/99 – Now Converting City by City Until the Whole Country Is Unleaded
v Do Not Fall for the ‘Red Herring’ Argument Called ‘Valve Wear Recession’. Or the ‘Benzene’ Wooly Argument. There Is a Whole Better Story.
See – MECA White Paper – ‘Ban Leaded Gasoline’. Why Have TwoDistribution Systems? Just Switch. Big $ Savings.
Airborne Lead Inhibits Children’s Mental Development. Airborne Lead Inhibits Children’s Mental Development. Asian Countries Cannot Afford This Detriment.Asian Countries Cannot Afford This Detriment.
The Cost/Effective Policy Is to Switch the Entire Country to 100% Unleaded
2/21/01 1ENG2.ppt 36
FUEL SULFUR LEVEL AFFECTS CATALYST NOx PERFORMANCE
0.35
0
0.3
0.25
0.2
0.15
0.1
0.05
0 600100 200 300 400 500
All 21 Vehicles by Mass Average
All 21 Vehicles by Ln-Ln Average
NOx (Similar Effect for HC,CO)
Fuel Sulfur Level, ppm S
Gra
ms
Per
Mile
2/21/01 1ENG2.ppt 37
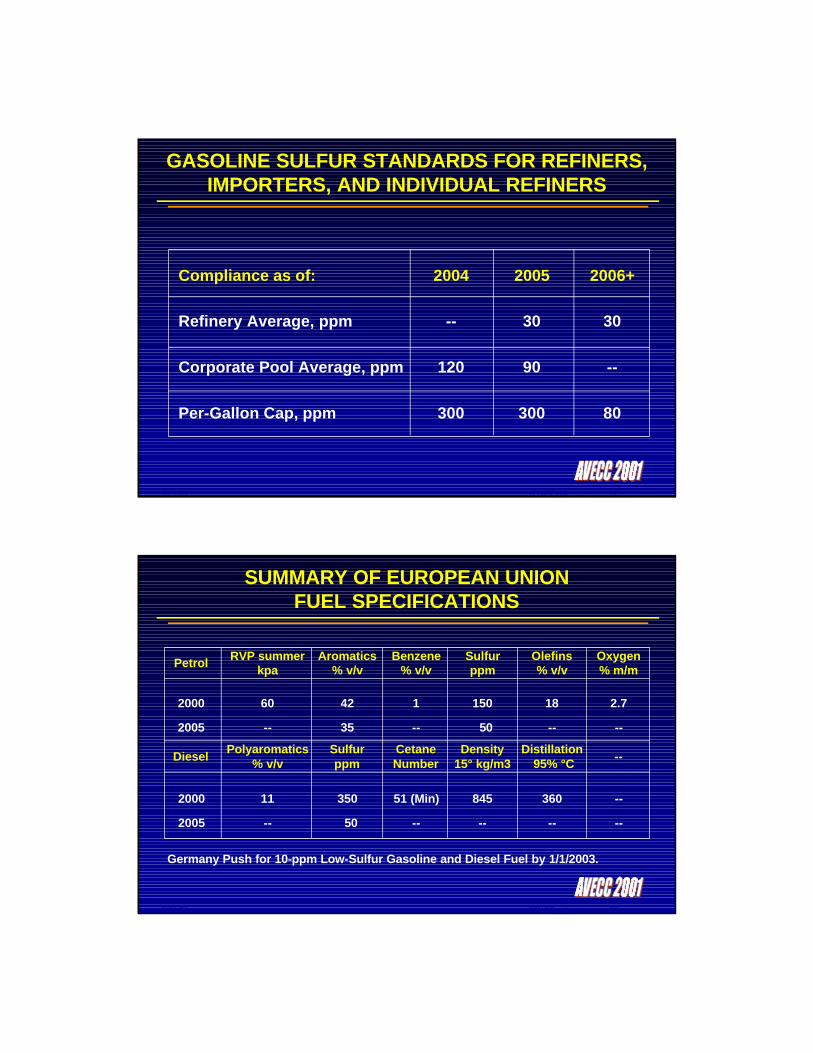
GASOLINE SULFUR STANDARDS FOR REFINERS, IMPORTERS, AND INDIVIDUAL REFINERS
Compliance as of: 2004 2005 2006+
Refinery Average, ppm -- 30 30
Corporate Pool Average, ppm 120 90 --
Per-Gallon Cap, ppm 300 300 80
2/21/01 1ENG2.ppt 38
SUMMARY OF EUROPEAN UNIONFUEL SPECIFICATIONS
Petrol
2000
2005
RVP summer kpa
Aromatics% v/v
Benzene% v/v
Sulfurppm
Oxygen% m/m
Olefins% v/v
DieselPolyaromatics
% v/vSulfurppm
CetaneNumber
Density15° kg/m3
--Distillation
95% °C
60
--
42
35
1
--
150
50
18
--
2.7
--
2000
2005
11
--
350
50
51 (Min)
--
845
--
360
--
--
--
Germany Push for 10-ppm Low-Sulfur Gasoline and Diesel Fuel by 1/1/2003.

2/21/01 1ENG2.ppt 39
NEW CERAMIC AND METALLICSUBSTRATE DESIGNS
v Ceramic Systems• Ultra-High Cell Densities (600-1200 cpsi) With Thinner Walls• Contoured Shapes for Endcone Utilization• Hexagonal Cell Structures• Improved High Temperature Mounting
v Metallic Systems• Ultra-High Cell Densities (600-1000 cpsi) With Thinner Walls• Turbulent Flow Paths for Improved Gas Contact• Conical Shapes for Endcone Utilization
Enhanced Emission Control PerformanceEnhanced Emission Control Performance
2/21/01 1ENG2.ppt 40
ADVANCED CERAMIC SUBSTRATE
3 mil/600 cpsi, 2 mil/900 cpsiCatalytic Performance Improvement by High Geometric Surface Area (GSA) and Low Heat Capacity
6 mil/400 cpsi 4 mil/400 cpsi
3 mil/600 cpsi 2 mil/900 cpsi
Source: NGK

2/21/01 1ENG2.ppt 41
Relative Geometric Surface Area (GSA) or Bulk Density
Source: MECA
HIGHER GEOMETRIC AREA COUPLED WITHLOWER WEIGHT PROVIDES EMISSION
PERFORMANCE BENEFITS
0.4
0.6
0.8
1.0
1.2
1.4
1.6
1.8
2.0
400/6.5 400/4.3 600/3.5 900/2.4 1200/2.0Cell Density in cpsi, Wall Thickness in mils
Bulk Density
GSA
2/21/01 1ENG2.ppt 42
TWC CATALYSTS ARE DURABLE EVEN UNDER EXTREME USE CONDITIONS
100
95
90
85
80
75Co
nve
rsio
n E
ffic
ien
cy (
%)
0 20.000 40.000 60.000 80.000 100.000 120.000 140.000 160.000
Distance (km)
CO Pt/Rh
HC Pt/Rh
NOx Pt/Rh
Displacement: 4.2 L (290 hp)Catalyst Specifications: Volume = 3.8 LPM-Loading = 105 g/ft3; PM Ratio = Pt/Pd/Rh 1/14/1
50 g/ft3; PM-Ratio = Pt/Rh 5/1European Testcycle Evaluation (MVEG-Cycle)
NOx
CO
HC
2/21/01 1ENG2.ppt 43
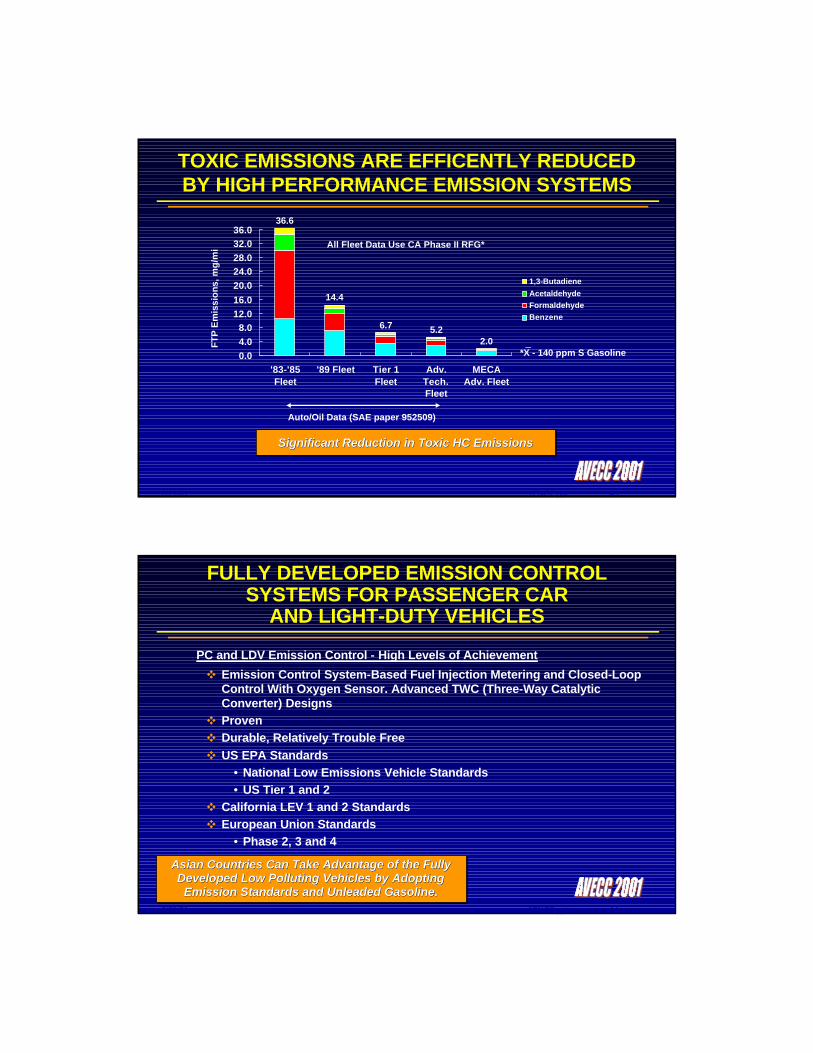
Significant Reduction in Toxic HC EmissionsSignificant Reduction in Toxic HC Emissions
0.0
4.0
8.012.0
16.0
20.0
24.028.0
32.036.0
'83-'85Fleet
'89 Fleet Tier 1Fleet
Adv.Tech.Fleet
MECAAdv. Fleet
1,3-Butadiene
Acetaldehyde
Formaldehyde
Benzene
FT
P E
mis
sio
ns,
mg
/mi
36.6
14.4
6.7 5.22.0
Auto/Oil Data (SAE paper 952509)
All Fleet Data Use CA Phase II RFG*
*X - 140 ppm S Gasoline
TOXIC EMISSIONS ARE EFFICENTLY REDUCED BY HIGH PERFORMANCE EMISSION SYSTEMS
2/21/01 1ENG2.ppt 44
v Emission Control System-Based Fuel Injection Metering and Closed-Loop Control With Oxygen Sensor. Advanced TWC (Three-Way Catalytic Converter) Designs
v Provenv Durable, Relatively Trouble Freev US EPA Standards
• National Low Emissions Vehicle Standards• US Tier 1 and 2
v California LEV 1 and 2 Standardsv European Union Standards
• Phase 2, 3 and 4
FULLY DEVELOPED EMISSION CONTROL SYSTEMS FOR PASSENGER CAR
AND LIGHT-DUTY VEHICLES
PC and LDV Emission Control - High Levels of Achievement
Asian Countries Can Take Advantage of the Fully Asian Countries Can Take Advantage of the Fully Developed Low Polluting Vehicles by Adopting Developed Low Polluting Vehicles by Adopting Emission Standards and Unleaded Gasoline.Emission Standards and Unleaded Gasoline.
2/21/01 1ENG2.ppt 45
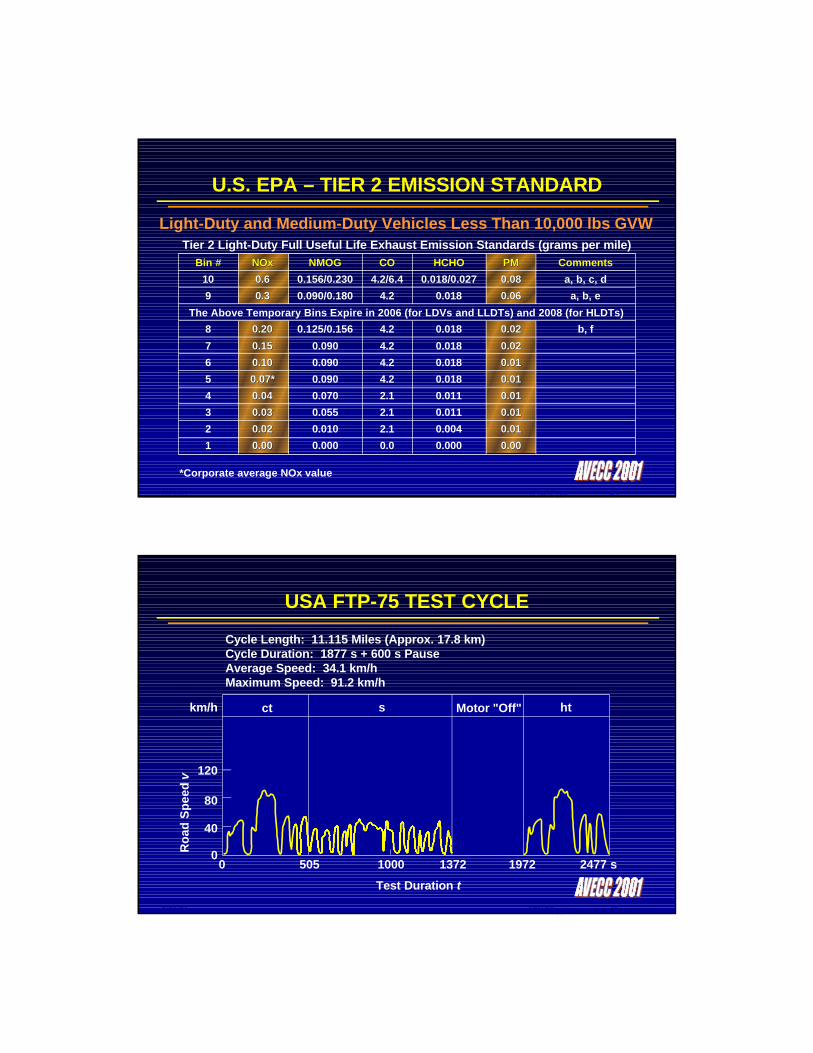
U.S. EPA – TIER 2 EMISSION STANDARD
Tier 2 Light-Duty Full Useful Life Exhaust Emission Standards (grams per mile)
Light-Duty and Medium-Duty Vehicles Less Than 10,000 lbs GVW
Bin #
10
9
8
7
6
5
4
3
2
1
NOxNOx
0.60.6
0.30.3
0.200.20
0.150.15
0.100.10
0.07*0.07*
0.040.04
0.030.03
0.020.02
0.000.00
NMOG
0.156/0.230
0.090/0.180
0.125/0.156
0.090
0.090
0.090
0.070
0.055
0.010
0.000
CO
4.2/6.4
4.2
4.2
4.2
4.2
4.2
2.1
2.1
2.1
0.0
HCHO
0.018/0.027
0.018
0.018
0.018
0.018
0.018
0.011
0.011
0.004
0.000
PMPM
0.080.08
0.060.06
0.020.02
0.020.02
0.010.01
0.010.01
0.010.01
0.010.01
0.010.01
0.000.00
Comments
a, b, c, d
a, b, e
b, f
The Above Temporary Bins Expire in 2006 (for LDVs and LLDTs) and 2008 (for HLDTs)
*Corporate average NOx value
2/21/01 1ENG2.ppt 46
USA FTP-75 TEST CYCLE
Ro
ad S
pee
d v
Cycle Length: 11.115 Miles (Approx. 17.8 km)Cycle Duration: 1877 s + 600 s PauseAverage Speed: 34.1 km/hMaximum Speed: 91.2 km/h
ct s Motor "Off" htkm/h
120
80
40
00 505 1000 1372 1972 2477 s
Test Duration t

2/21/01 1ENG2.ppt 47
SUPPLEMENTAL FEDERAL TEST PROCEDURES
SC03 Air Conditioning CycleM
PH
Seconds
60
50
40
30
20
10
0
Total Duration: 594 sMax. Speed: 54.8 mph
0 50 100 150 200 250 300 350 400 450 500 550 600
2/21/01 1ENG2.ppt 48
SUPPLEMENTAL FEDERAL TEST PROCEDURES
US06 High Speed/High Load Cycle
MP
H
SecondsTotal Duration: 600 sMax. Speed: 80.3 mphMax. Acceleration: 8 mph/second
0 50 100 150 200 250 300 350 400 450 500 550 600
60
50
40
30
20
10
0
90
80
70

2/21/01 1ENG2.ppt 49
EUROPEAN UNIONTAILPIPE EMISSION LIMITS
1 Modified ECE+EUDC Driving Cycle Deletes First 40 Seconds of Idle Period/Startof Bag Sampling at Engine Crank.
2000
2005
2000
2005
Petrol PassengerCar
Petrol PassengerCar
Diesel PassengerCar
Diesel PassengerCar
2.3
1.0
0.64
0.50
0.20
0.10
--
--
0.15
0.08
0.50
0.25
--
--
0.56
0.30
--
--
0.05
0.025
RevisedECE+EUDC1
RevisedECE+EUDC1
RevisedECE+EUDC1
RevisedECE+EUDC1
Eff.Date
Fuel/Vehicle Type
COg/km
HCg/km
NOxg/km
PMg/km
HC + Nox g/km
Test Cycle
(Austria, Belgium, Denmark, Finland, France, Germany, Greece, Ireland, Italy, Luxembourg, Netherlands, Northern Ireland, Portugal, Spain, Sweden, UK)
Euro III (2000) and Euro IV (2005) Emissions Standards
2/21/01 1ENG2.ppt 50
ECE/EC TEST CYCLE WITHEXPRESSWAY PHASE
Cycle Length: 11 kmAverage Speed: 32.5 km/hMaximum Speed: 120.0 km/h
Ro
ad S
pee
d v
Test Duration t
km/h
120
100
80
60
40
20
00 200 400 600 800 1000 1220s

2/21/01 1ENG2.ppt 51
TEST SETUPS
a) For US Federal Test (Here with Venturi System)b) For Europe-Test (Here with Rotary-Piston Compressor)1 Brake, 2 Flywheel, 3 Exhaust, 4 Air Filter, 5 Dilution Air, 6 Cooler, 7 Sample Venturi Tube, 8 Gas Temperature,9 Pressure, 10 Venturi Tube, 11 Fan, 12 Sample Bag, 13 Rotary-Piston Blower, 14 To Outlet.
14HCHC
COCO
COCO22
NOxNOx
12
ctctss
htht
141111
1098
7
5
4
3
21
a
HCHC
COCO
COCO22
NOxNOx
12
14
6
9
85
4
3
21
b14
13