emission estimation technique manual for sewage and...
TRANSCRIPT

First published in March 1999 Version 2.1 published June 2011
NATIONAL POLLUTANT INVENTORY
EMISSION ESTIMATION TECHNIQUE MANUAL
FOR
SEWAGE AND WASTEWATER TREATMENT VERSION 2.1
JUNE 2011

© Commonwealth of Australia 2011 This manual may be reproduced in whole or part for study or training purposes subject to the inclusion of an acknowledgment of the source. It may be reproduced in whole or part by those involved in estimating the emissions of substances for the purpose of National Pollutant Inventory (NPI) reporting. The manual may be updated at any time. Reproduction for other purposes requires the written permission of the Department of Sustainability, Environment, Water, Population and Communities. GPO Box 787, Canberra, ACT 2601, e-mail: [email protected] web: www.npi.gov.au phone: 1800 657 945. Disclaimer The manual was prepared in conjunction with Australian states and territories according to the National Environment Protection (National Pollutant Inventory) Measure. While reasonable efforts have been made to ensure the contents of this guidance material are factually correct, the Australian Government does not accept responsibility for the accuracy or completeness of the contents and shall not be liable for any loss or damage that may be occasioned directly or indirectly through the use of, or reliance on, the contents of this manual.
i SEWAGE AND WASTEWATER TREATMENT Version 2.1 published June 2011

EMISSION ESTIMATION TECHNIQUES FOR
SEWAGE AND WASTEWATER TREATMENT TABLE OF CONTENTS
1 INTRODUCTION......................................................................................................................................... 1 1.1 THE PROCESS FOR NPI REPORTING........................................................................................................... 2 1.2 STRUCTURED APPROACH TO NPI REPORTING.......................................................................................... 2
1.2.1 Information required to produce an annual NPI report.................................................................. 2 1.3 ADDITIONAL REPORTING MATERIALS....................................................................................................... 4
2 PROCESS DESCRIPTION.......................................................................................................................... 5 2.1 PRIMARY (PHYSICAL) TREATMENT........................................................................................................... 5 2.2 SECONDARY (BIOLOGICAL) TREATMENT.................................................................................................. 6
2.2.1 Trickling filters................................................................................................................................ 6 2.2.2 Rotating biological contactors ........................................................................................................ 6 2.2.3 Biological aerated filters................................................................................................................. 6 2.2.4 Membrane bioreactors .................................................................................................................... 6 2.2.5 Fluidized bed reactors..................................................................................................................... 6 2.2.6 Diffused aeration............................................................................................................................. 7 2.2.7 Surface aeration .............................................................................................................................. 7 2.2.8 Oxidation ditch................................................................................................................................ 7 2.2.9 Deep shaft ....................................................................................................................................... 7
2.3 SLUDGE TREATMENT................................................................................................................................ 8 2.3.1 Anaerobic digestion ........................................................................................................................ 8 2.3.2 Aerobic digestion ............................................................................................................................ 8 2.3.3 Composting ..................................................................................................................................... 8
2.4 TERTIARY (CHEMICAL OR ADVANCED) TREATMENT ................................................................................ 9 2.4.1 Membrane filtration ........................................................................................................................ 9 2.4.2 High-pressure membrane processes ............................................................................................. 10 2.4.3 Lower-pressure membrane processes ........................................................................................... 10 2.4.4 Disinfection ................................................................................................................................... 10
2.5 FACILITY PROCESS DIAGRAM ................................................................................................................. 11 3 EMISSION SOURCES............................................................................................................................... 12
3.1 EMISSIONS TO AIR .................................................................................................................................. 12 3.1.1 Point source emissions .................................................................................................................. 12 3.1.2 Fugitive emissions......................................................................................................................... 12
3.2 EMISSIONS TO WATER ............................................................................................................................ 12 3.3 EMISSIONS TO LAND............................................................................................................................... 13 3.4 LEAKS, OVERFLOWS AND SPILLS............................................................................................................ 13
4 THRESHOLD CALCULATIONS ............................................................................................................ 14 4.1 DESKTOP SCREENING ............................................................................................................................. 14 4.2 USAGE BASED THRESHOLDS – CATEGORY 1 AND 1B SUBSTANCES......................................................... 17 4.3 CATEGORY 2A AND 2B SUBSTANCES ...................................................................................................... 19 4.4 CATEGORY 3 SUBSTANCES – TOTAL NITROGEN AND PHOSPHORUS ....................................................... 20
5 EMISSION ESTIMATION TECHNIQUES ............................................................................................ 21 5.1 DIRECT MEASUREMENT ......................................................................................................................... 21
5.1.1 Emissions of chlorine .................................................................................................................... 23 5.2 MASS BALANCE ..................................................................................................................................... 23 5.3 EMISSION FACTORS................................................................................................................................ 24 5.4 SOFTWARE PACKAGES ........................................................................................................................... 24
6 TRANSFERS OF NPI SUBSTANCES IN WASTE................................................................................. 25 7 NEXT STEPS FOR REPORTING............................................................................................................ 26 8 REFERENCES............................................................................................................................................ 28 APPENDIX A: DEFINITIONS AND ABBREVIATIONS.............................................................................. 31
ii APPENDIX B: EMISSION FACTORS ............................................................................................................ 32
SEWAGE AND WASTEWATER TREATMENT Version 2.1 published June 2011

APPENDIX C: MODIFICATIONS TO THE INDUSTRY MANUAL MANUFACTURING EMISSION ESTIMATION TECHNIQUE (EET) MANUAL (VERSION 1 MARCH 1999)........................................... 38 VERSION 2.1 JUNE 2011 .................................................................................................................................. 38 APPENDIX D: VOC EMISSIONS FROM WASTEWATER COLLECTION TREATMENT AND STORAGE. .......................................................................................................................................................... 39
LIST OF FIGURES, TABLES, EQUATIONS AND EXAMPLES Figure 1: NPI reporting flowchart........................................................................................................................... 2 Figure 2: Primary mechanical treatment ................................................................................................................. 6 Figure 3: Secondary treatment (fixed film or suspended growth)........................................................................... 7 Figure 4: Sludge treatment options ......................................................................................................................... 9 Figure 5: Wastewater treatment facility process diagram ..................................................................................... 11 Table 1: 1 Relationship between treatment plant capacity and thresholds............................................................ 14 Table 2: Indicative concentrations (mg/L) of NPI listed substances in different types of wastewater.................. 15 Table 3: Typical concentrations and annual usage of Category 1 and Category 1b substances in domestic
wastewater at selected influent flow rates. ................................................................................................... 18 Table 4: Typical concentrations and annual usage of Category 1 and Category 1b substances in typical mixed
domestic/industrial wastewater at selected influent flow rates..................................................................... 18 Table 5: Literature concentration values for NPI substances reported in air ........................................................ 32 Table 6: Plant wide air emission factors .............................................................................................................. 32 Table 7: Emission factors for air emission from headworks screening (wet scrubbers) ....................................... 33 Table 8: Uncontrolled air emission factors for air emissions from aerated grit chamber...................................... 33 Table 9: Uncontrolled emission factors for air emissions from primary settling .................................................. 33 Table 10: Uncontrolled emission factors for air emissions from diffused air activated sludge ............................ 33 Table 11: Uncontrolled emission factors for air emissions from mechanical mixed air activated sludge ............ 34 Table 12: Uncontrolled emission factors for air emissions from pure oxygen activated ...................................... 34 Table 13: Uncontrolled emission factors for air emissions from trickling filter ................................................... 34 Table 14: Uncontrolled emission factors for air emissions from secondary clarifier............................................ 34 Table 15: Uncontrolled emission factors for air emissions from tertiary filters.................................................... 35 Table 16: Uncontrolled emission factors for air emissions from chlorine contact tank ........................................ 35 Table 17: Uncontrolled emission factors for air emissions from dechlorination .................................................. 35 Table 18: Uncontrolled emission factors for air emissions from gravity sludge thickener ................................... 36 Table 19: Uncontrolled emission factors for air emissions from dissolved air flotation sludge thickener............ 36 Table 20: Uncontrolled emission factors for air emissions from anaerobic digester ............................................ 36 Table 21: Uncontrolled emission factors for air emissions from belt filter press.................................................. 36 Table 22: Uncontrolled emission factors for air emissions from sludge centrifuge.............................................. 37 Table 23: Uncontrolled emission factors for air emissions from sludge drying bed............................................. 37 Table 24: Air emission factors for volatile organic compounds emitted during the entire course of wastewater
collection and treatment ............................................................................................................................... 37 Equation 1 ............................................................................................................................................................. 18 Equation 2 ............................................................................................................................................................. 21 Equation 3 ............................................................................................................................................................. 22 Equation 4 ............................................................................................................................................................. 22 Equation 5 ............................................................................................................................................................. 22 Equation 6 ............................................................................................................................................................. 22 Equation 7 ............................................................................................................................................................. 24 Equation 8 ............................................................................................................................................................. 24 Example 1: Suggested approach for NPI reporting................................................................................................. 3 Example 2: NPI reporting for a small wastewater facility ...................................................................................... 4 Example 3: Identifying the relevant substances in wastewater ............................................................................. 16 Example 4: Estimation of usage of chlorine and compounds by mass balance .................................................... 19 Example 5: Threshold calculation for Fluoride (domestic system)....................................................................... 19 Example 6: Threshold calculation for Chlorophenols (industrial system) ............................................................ 19 Example 7: Estimation of Total Phosphorus emission to surface water by regular sampling............................... 23 Example 8: Estimation of residual chlorine emissions to water............................................................................ 23
iii SEWAGE AND WASTEWATER TREATMENT Version 2.1 published June 2011

1 Introduction The purpose of all emission estimation technique (EET) manuals is to assist Australian manufacturing, industrial and service facilities to report emissions of listed substances to the National Pollutant Inventory (NPI). This manual describes the procedures and recommended approaches for estimating emissions engaged in industry sewage and wastewater treatment group activities. EET MANUAL sewage and wastewater treatment ANZSIC CODE 2006 2812 Sewerage and drainage services Note that the ANZSIC code is part of NPI reporting requirements. The NPI Guide contains an explanation of the ANZSIC code. This manual has been developed through a process of national consultation involving state and territory environmental authorities and key industry stakeholders. NPI substances are those that when emitted at certain levels have potential to be harmful. Australian, state and territory governments have agreed, in response to international requirements, that industries will report these emissions on an annual basis. NPI substances are set out in the NPI Guide and are listed in categories which have a threshold; i.e. once annual ‘use’ of substances is above the threshold their emissions and transfers must be reported. A sewage and wastewater treatment system includes the collection infrastructure together with the plant or process location that accepts flows from a community for the purposes of reducing the wastewater’s environmental and health impacts.
1 SEWAGE AND WASTEWATER TREATMENT Version 2.1 published June 2011

1.1 The process for NPI reporting Sewage and wastewater treatment facilities that meet specific criteria are required to report emissions and transfers of designated substances to the NPI. Figure 1 outlines the steps used to determine whether these criteria have been meet, and an NPI report is required.
Step 1: Prepare a process flow chart for your facility.(Identify inflow of substances in raw water, chemical storage & handling,
treatment processes, outflows, and waste handling)
Step 2: Determine the emission and transfer sources. (e.g. Disinfection; outflow to water, waste generation)
Step 3: Determine whether any thresholds have been exceeded. (e.g. Delivery and use of 10 tonnes or more of chlorine)
Step 4: Estimate the emissions and transfers for your facility. (Generally use direct measurement to determine emissions)
Step 5: Report emissions to the NPI. (Compile emissions and transfers from all sources for your
report)
Refer to Section 2Process description
Refer to Section 3Emission sources
Refer to Section 4Threshold calculations
Refer to Section 5 & 6Emissions estimation & transfers
Refer to Section 7Next steps for reporting
Figure 1: NPI reporting flowchart
1.2 Structured Approach to NPI Reporting The first step in approaching NPI reporting is to download the NPI guide, it is available from the NPI website www.npi.gov.au/publications/guidetoreporting.html . The guide contains important information that you will need to complete your NPI report and a complete list of the 93 NPI substances. It also includesguidance on how to:
• determine if any thresholds have been tripped • estimate emissions and transfers in waste of NPI substances • report NPI emissions and transfers as well as • A complete list of the 93 NPI substances.
1.2.1 Information required to produce an annual NPI report Information that will assist in producing an annual NPI report includes:
• wastewater collection system customer base (e.g. the number and types of industrial dischargers to the system)
• wastewater collection system characteristics (i.e. combined system or sanitary system)
2 SEWAGE AND WASTEWATER TREATMENT Version 2.1 published June 2011

• wastewater treatment system configuration and process (e.g. passive or active treatment systems, final destination of products from the process)
• substances used or produced (e.g.use of chemicals, transformation of substances in some treatment trains).
If any fuel burning equipment has been used by the facility, including on-site vehicles, additional data will need to be collated including:
• type and amount of fuel burned • pollution control devices employed • volume and throughput of fuels or organic liquids stored on site.
Emissions to water, air, land, and transfers to mandatory reporting transfer destinations (including sludge and biosolids) all require consideration for NPI reporting purposes.
Example 1: Suggested approach for NPI reporting
Facility process diagram 1) Construct a facility process diagram for your facility identifying:
a) wastewater treatment system boundary b) inflows (e.g. raw water and chemical additives) c) substance storage d) wastewater treatment processes e) outflows (e.g., overflows & discharges) f) waste treatment and handling activities.
Data recording 2) Perform a desktop screening calculation (refer to Section 4.1) to identify relevant substances,
thresholds transfers. 3) Record the quantities of materials containing NPI reportable substances:
a) purchased and brought on-site b) brought on-site in raw water c) discharged or transferred in wastewater d) discharged or transferred in waste sludge e) released as gases.
4) Record the quantity, and type of fuel burned. 5) Record the quantity of electrical energy used. 6) Document emission reduction activities (pollution control devices employed). Reporting 7) Determine which substances need to be included in the report. 8) Estimate emissions for the relevant substances to:
a) air b) water c) land.
9) Estimate transfers for the relevant substances and record the destination. 10) Record the Emission Estimation Techniques (EET) used and explain any ‘significant differences to
previous report’. 11) Prepare and submit reports to NPI. Quality assurance 12) Keep the above records, calculations and copies of reports. In addition to the above tasks, regularly check the NPI website for the latest reporting information, access to other EETs, and other sources of advice. For site-specific issues, contact your state or territory’s NPI team for advice. A brief overview of the NPI reporting process is provided in Example 2 below.
3 SEWAGE AND WASTEWATER TREATMENT Version 2.1 published June 2011

Example 2: NPI reporting for a small wastewater facility To comply with NPI requirements, the operator of a sewage/wastewater treatment facility follows the approach outlined in Example 1. A facility process diagram is developed which identifies the NPI substances used at the facility, namely ammonia (total), chlorine and compounds, total nitrogen, total phosphorus and other NPI substances contained in the influent. The facility records indicate 13 tonnes/year of chlorine was used, thus the facility tripped the Category 1 threshold (refer to Section 4). The daily volume of wastewater treated is 7 ML, of which 50 per cent is discharged to water and 50 per cent is transferred off-site for irrigation. Ammonia is the only influent parameter likely to exceed the reporting threshold. The facility has been monitoring ammonia concentrations in the influent and direct measurement indicates that the annual ammonia used is less that 10 tonnes per year, therefore usage of ammonia is considered sub-threshold. The treated wastewater is monitored for total nitrogen and total phosphorus. Direct measurements indicate that the annual loads discharged to water are below the threshold of 15 tonnes/year for total nitrogen and 3 tonnes per year total phosphorus. No reporting is required for these two substances. The facility compiles relevant data to estimate emissions of chlorine (refer to Section 5). A review of the facility diagram (refer to Section 2) indicates that the only reportable emission is chlorine residual of the treated effluent that is discharged to a waterway. Analysis indicates that the annual average chlorine residual is 0.5 mg/L. The total annual discharge to water was 1,280 ML and the total chlorine emission is reported as 640 kg.
1.3 Additional reporting materials This manual is written to reflect the common processes employed in the sewage and wastewater industry. In many cases it will be necessary to refer to other EET manuals to ensure a complete report of the emissions for the facility can be made. Other applicable EET manuals may include, but are not limited to:
• Combustion in boilers; • Combustion in engines; • Fuel and organic liquid storage; • Fugitive emissions; and • Other industry-specific emission estimation technique manuals.
4 SEWAGE AND WASTEWATER TREATMENT Version 2.1 published June 2011

2 Process description Sewage and wastewater collection and treatment plays a critical role in the public health and environment of all Australian towns and cities. On average, each Australian generates 60,000 litres of wastewater each year, with the majority of effluents from Australia’s large coastal cities and towns discharged to coastal waters under environmental licence conditions. Approximately 85 per cent of Australia’s population currently have access to community sewage treatment plants. Nearly half of the 700 wastewater treatment plants are based on biological filters, about 170 are lagoons, and 45 are based on primary treatment (Kanawati, 2007). Most new plants are implementing activated sludge processes. Drought conditions experienced in Australia have lead to the exploration of desalination and wastewater recycling to supplement threatened water supplies. Advanced treatment processes incorporating membrane or chemical oxidation technologies to recycle wastewater are increasingly being used. Sewage treatment plants are typically designed to remove the following pollutants:
• suspended solids • dissolved biodegradable organic material • total nitrogen and total phosphorus • microbial pathogens.
The quantity of NPI substances removed in a wastewater treatment plant is dependent on the specific treatment processes used. Wastewater treatment plants may utilise physical, biological and/or chemical processes to remove harmful components. These processes are referred to as primary, secondary and tertiary treatment (refer to Sections 2.1, 2.2 and 2.4 respectively). These are the most common treatments used in municipal wastewater treatment and, to a lesser extent, in industrial and agricultural wastewater treatment. Inflows determine the scale of a facility’s chemical use and potential health or environmental impact and therefore can be used to determine the requirement to report. Outflows from a facility include emissions and transfers. An understanding of the general process is important to:
• ensure that estimates are representative of your facility • communicate the context of your emissions/transfers to those accessing the NPI database.
2.1 Primary (physical) treatment Physical treatment is an first stage of most wastewater treatment processes, particularly those with large volumes of solid or organic material. Physical treatment is the first stage of wastewater processing. In this stage grit (e.g., sand, gravels, rocks) and large matter (e.g., floating materials, solid waste) are removed and are typically sent to landfill. Primary treatment, as shown in Figure 2, typically consists of: 1) Screening - raw wastewater is strained, using a raked screen or similar equipment, to remove large
objects (e.g. rags, sticks). 2) Settling - grit is removed in a chamber where sand, gravel and rocks are allowed to settle. Air may
or may not be used to assist in grit removal. If not, the rate of off-gassing may be lower. 3) Primary clarification – wastewater is passed through a large tank or clarifier where faecal solids
can settle and floating material (i.e. oil, grease and fats) can be skimmed off the surface. The potential sources of reportable NPI substance emissions arising from primary treatment are:
• air emissions • screening solids • grit solids • primary sludge • scum.
5 SEWAGE AND WASTEWATER TREATMENT Version 2.1 published June 2011

Collection system Screening Grit
removalPrimary
clarification
Overflows
Screenings Grit PrimarySludge
SecondaryTreatmet
ScumOff-gas
Figure 2: Primary mechanical treatment
2.2 Secondary (biological) treatment The process of biological degradation of organic wastes is typically used as secondary treatment. Secondary treatment is designed to biodegrade substances such as human waste, food wastes and detergents. For this purpose microbes are used to consume biodegradable soluble organic contaminants and bind the less soluble fractions into floc which can later be removed. Secondary treatment systems are categorised as either fixed film or suspended growth. In fixed-film treatment, microorganisms are grown on media and the wastewater passes over the surface of the film. There are several processes in use. The most common fixed film configurations are trickling filters and rotating biological contactors. Other fixed film configurations include biological aerated filters, fluidized bed reactors and membrane bioreactors.
2.2.1 Trickling filters Trickling filters may be configured as a shallow, naturally ventilated circular filter bed or as a packed tower with forced air circulation. Typically used media are activated carbon, limestone chips or specialised plastic media. Wastewater is distributed through perforated rotating arms radiating from a central pivot. This is an aerobic system where films of bacteria, protozoa and fungi reduce the organic component of the wastewater.
2.2.2 Rotating biological contactors Rotating biological contactors (RBCs) incorporate an aerobic zone with rotating discs which are used to bring micro-organisms into contact with wastewater. Coagulants for the removal of Total Phosphorus may also be used in rotating biological contactors.
2.2.3 Biological aerated filters Biological aerated (or anoxic) filters (BAF) usually consist of a reactor filled with filter media which supports micro-organisms. Wastewater is passed through this filter which can be operated in either an up flow or down flow configurations. Biological carbon reduction, nitrification or de-nitrification (anoxic) is combined with filtration in this unit to remove organics from wastewater.
2.2.4 Membrane bioreactors Membrane bioreactors (MBR) combine a membrane liquid-solid separation process with activated sludge treatment. In this unit, low pressure microfiltration or ultra filtration membranes are typically immersed in an aeration tank. MBR eliminate the need for clarification and tertiary filtration.
2.2.5 Fluidized bed reactors In a fluidised bed reactor, wastewater flows upward through an immobilized enzyme bed filled with suspended filter particles. In suspended growth treatment, biota intermixes with the wastewater. Suspended growth treatment takes place in aerated vessels where primary treated sewage is combined with a biological floc to
6 SEWAGE AND WASTEWATER TREATMENT Version 2.1 published June 2011

consume the organic component of wastewater in a process known as the activated sludge process (as shown in Figure 3). Activated sludge processes may also include a stage where the mixed liquor is treated under anoxic conditions (meaning that there is no residual dissolved oxygen) to remove nitrogenous matter or phosphate. There are a number of unit configurations for suspended growth treatment however, all utilise dissolved oxygen to promote the growth of micro-organisms. This commonly occurs using either diffused or surface aeration.
2.2.6 Diffused aeration Wastewater is run into deep tanks with diffuser blocks attached to the floor. Air is pumped through the blocks and a curtain of bubbles is formed which both oxygenates and mixes the wastewater.
2.2.7 Surface aeration The general arrangement for surface aeration involves vertically mounted tubes which extend from just above the base of a deep concrete tank to just below the surface of the wastewater. When the tube is rotated, the vanes spin wastewater up and out of the cones drawing new wastewater from the base of the tank. The two most common unit configurations for the activated sludge process are oxidation ditches and deep shafts.
2.2.8 Oxidation ditch In an oxidation ditch wastewater is treated in large ditches where flow is driven around the ditch by horizontal aerators. Oxidation ditches have a larger footprint than deep shaft configurations.
2.2.9 Deep shaft In a deep shaft configuration, wastewater is injected into a deep column buried in the ground. Oxygen, injected along with the wastewater, is forced into solution by the pressure at the base of the column resulting in an excellent supply of oxygen for the activated sludge biota. Wastewater is decanted at the surface of the column. The final stage in secondary treatment is usually the settling out of biological floc and/or filter material in a clarifier (also known as a secondary settling tank). This step produces water with very low levels of organic matter and suspended material. As shown in Figure 3, the potential sources of NPI substances for secondary treatment include:
• air emissions/off-gases • scum • waste-activated sludge • effluent.
PrimaryTreatment
Grit removal
Secondaryclarification
SecondarySludge
SecondarySludge
TertiaryTreatmet
ScumOff-gas
Figure 3: Secondary treatment (fixed film or suspended growth)
7 SEWAGE AND WASTEWATER TREATMENT Version 2.1 published June 2011

2.3 Sludge treatment
Wastewater derived sludges are commonly treated using anaerobic digestion, aerobic digestion or composting. The purpose of this treatment is to reduce the amount of organic matter and the number of disease-causing micro-organisms present in the sludge. Composting is most commonly applied in smaller scale wastewater treatment applications: aerobic digestion and then anaerobic digestion are applied in large scale wastewater treatment plants.
2.3.1 Anaerobic digestion Anaerobic digestion is a widely used process for the reduction of solids volume. In this process microorganisms break down organic matter in the absence of oxygen. The main air emissions from this process are methane (60 per cent), carbon dioxide (approximately 40 per cent) and small quantities of the substances ammonia and hydrogen sulfide. In this system, the ammonia gas exists in equilibrium with the ammonium ion (aqueous phase). At higher pH levels, the equilibrium shifts towards ammonia gas and significant emissions are possible if the gas is not combusted.
2.3.2 Aerobic digestion In this process bacteria consume organic matter in an aerated vessel. Solids reduction occurs when the organic matter is reduced to a level where the bacteria die and are consumed by other bacteria (endogenous respiration). Aerobic digestion is faster than anaerobic digestion.
2.3.3 Composting Composting is an aerobic process that uses bacteria to digest wastewater solids mixed with water and a carbon source (e.g. sawdust, woodchips). This process produces heat and the remnants of decomposed organic matter. The final stage in sludge treatment is thickening (dewatering) prior to disposal. Typical dewatering technologies include lagooning in drying beds to produce solids that can be disposed to landfill. Sludge may also be pressed, centrifugally separated or incinerated. The typical emissions/transfers from sludge treatment and disposal are shown in Figure 4.
8 SEWAGE AND WASTEWATER TREATMENT Version 2.1 published June 2011

Raw Sludge
Further treatment, use or disposal
GravityThickening
Decant
OR
MechanicalThickening
Off gas
Subnatant
AerobicDigestion
Off gas
Decant
AnaerobicDigestion
Off gas
Decant
Dewatering
Subnatant
OR
Composting
Drying
Incineration Ash disposal
Use
Figure 4: Sludge treatment options
2.4 Tertiary (chemical or advanced) treatment Tertiary treatment is the final stage of wastewater processing before it is released to the receiving environment. At this stage of treatment, additional combinations of unit operations and processes are used to remove constituents such as total nitrogen and total phosphorus, which are not reduced significantly by conventional secondary treatment. These processes include:
• coagulation/air flotation or sedimentation • very high level of nutrient removal (chemical or biological) • membrane filtration • disinfection (e.g. UV, chlorine, ozone, detention lagoons).
2.4.1 Membrane filtration Advanced treatment plants may use membrane filtration including microfiltration, nanofiltration and reverse osmosis systems. The membrane processes of most significance in water treatment are reverse
9 SEWAGE AND WASTEWATER TREATMENT Version 2.1 published June 2011

osmosis, ultrafiltration, microfiltration and nanofiltration. In addition, advanced chemical oxidation may be employed for close personal contact recycling, including using recycled water for drinking.
2.4.2 High-pressure membrane processes Reverse osmosis uses membranes with pore sizes less than 0.002µm. High pressure (1,500–5,000 kPa) forces water through the membrane against a concentration gradient. The process results in the production of a treated water stream and a relatively concentrated waste stream. Reverse osmosis rejects monovalent ions and organics of molecular weight greater than about 50 Daltons (atomic mass units). Some ions are not removed with such great efficiency, for example boron and arsenic. Pre-treatment of source water is necessary before reverse osmosis. Pre-treatment typically involves:
• suspended solids removal by filtration • pH adjustment (to protect the membranes and to control precipitation of salts) • addition of anti-scaling inhibitors (to control, for example, calcium carbonates and sulfates) • disinfection (to prevent biofouling of the membranes), and • dechlorination.
Post-treatment may involve:
• pH adjustment • addition of corrosion inhibitors (polyphosphates) • remineralisation, and • disinfection.
2.4.3 Lower-pressure membrane processes Ultrafiltration is similar in principle to reverse osmosis, but the membranes have much larger pore sizes (typically 0.002–0.03 µm) and operate at lower pressures. Ultrafiltration membranes reject organic molecules of molecular weight above about 800 Daltons and usually operate at pressures less than 500 kPa.
2.4.4 Disinfection In virtually all instances, it is necessary to disinfect wastewater before it is discharged. The most common method of disinfection in Australia is chlorination with detention to allow contact time and to reduce the emission of the chlorine residual. Currently, chlorination is achieved by using liquefied chlorine gas, sodium hypochlorite solution or calcium hypochlorite granules and onsite chlorine generators.
• Liquefied chlorine gas is supplied in pressurized containers. Dosing is by a chlorinator, which both controls and measures the gas flow rate.
• Sodium hypochlorite solution is dosed using a positive-displacement electric dosing pump
or gravity feed system.
• Calcium hypochlorite generally supplied in tablet form. Chlorine dissolves in water to form hypochlorous acid (HOCl) and hypochlorite ion (OCl⎯): their sum is the ‘total available chlorine’ concentration. Hypochlorous acid is the more effective disinfectant of the two species. Chlorination of wastewater will give rise to the emission of chlorine (in the form of combined residual chlorine), an NPI substance. Other disinfection methods do not typically give rise to emissions of NPI substances. Advanced chemical oxidation may be employed for close personal contact recycling, including using recycled water for drinking. Other disinfection techniques include the use of detention lagoons or treatment of wastewater using ozone. Detention lagoons store large volumes of secondary treated wastewater to allow natural disinfection via sunlight or microbial die-off, while ozone is a highly reactive gas capable of destroying bacteria and viruses.
10 SEWAGE AND WASTEWATER TREATMENT Version 2.1 published June 2011

2.5 Facility process diagram When reporting to the NPI, a facility process diagram should be developed to ensure that all processes are included and to provide a mechanism to identify potential emissions. Figure 5 presents a typical facility process diagram with the key elements including:
• system boundary • inflows • processes that may use materials or generate waste / losses, and • outflows (including emissions and transfers).
Figure 5: Wastewater treatment facility process diagram
Note that a system boundary need not be a physical structure or based on a property boundary. Chemicals and raw wastewater are the main inflows for most facilities, but may also include electricity and fuel. Facilities employing reverse osmosis or other energy intensive processes need to monitor electricity (or fuel for generating electricity). The key outflows to consider for a wastewater treatment plant are total nitrogen, total phosphorus, ammonia, residual chlorine, hydrogen sulfide and metals.
11 SEWAGE AND WASTEWATER TREATMENT Version 2.1 published June 2011

3 Emission sources General information regarding emission sources can be located in The NPI Guide . Emission sources specific to wastewater treatment are outlined below.
3.1 Emissions to air Volatile Organic Compounds (VOCs) and ammonia are emitted from wastewater treatment, collection and storage systems, through the volatilisation of compounds at the liquid surface. Key sources of air emissions include:
• aeration during primary treatment • aerobic digestion • mechanical thickening of sludge • anaerobic digestion • sludge drying, and • flaring.
3.1.1 Point source emissions Point source emissions are directed into a vent or stack and emitted through a single point source into the atmosphere. Air emission control technologies are commonly installed to reduce the concentration of particulates in processing off-gases before emission through a stack. The collection efficiency of the abatement equipment needs to be considered where such equipment has been installed, and where emission factors from uncontrolled sources have been used in emission estimations. Control devices include devices such as:
• electrostatic precipitators • fabric filters • baghouses • wet scrubbers.
In the wastewater treatment industry, methane from anaerobic digesters may be combusted for power generation. To estimate emissions from burning fuel, refer to the Combustion in Boilers manual and the Combustion Engines manual.
3.1.2 Fugitive emissions These are emissions not released through a vent or stack. Examples of fugitive emissions include emissions from vehicles, dust from stockpiles, volatilisation of vapour from vats and open vessels, or spills and materials handling. Emissions emanating from ridgeline roof-vents, louvers, and open doors of a building as well as equipment leaks, such as from valves and flanges are also examples of fugitive emissions. Estimating emissions using emission factors is the usual method for determining losses from fugitive emission sources. Emissions can occur through diffusive and/or convective mechanisms. Diffusion occurs when organic concentrations at the water surface are much higher than ambient concentrations. The organics volatilise or diffuse into the air in an attempt to reach equilibrium between aqueous and vapour phases. Convection occurs when air flows over the water surface, thereby sweeping organic vapours from the surface into the air. The rate of volatilisation is directly related to the speed of the air flow over the water’s surface.
3.2 Emissions to water Potential emissions to water include:
• treated effluent • backwash and filter discharges or tank drainage released to surface waters (i.e. not including
process waste recycled back into the wastewater treatment system) • bypass flows released to surface waters (untreated or partially treated) for repair and
maintenance activities, or from hydraulic overloads
12 SEWAGE AND WASTEWATER TREATMENT Version 2.1 published June 2011

• pumping station overflows, and • sludge treatment discharges (biosolids / sludges).
Most facilities emitting NPI listed substances are required by their state or territory environment agency to closely monitor and measure these emissions. Existing sampling data can be used to calculate annual emissions to the NPI. If no wastewater monitoring data exists, emissions to process water can be calculated based on mass balance or emission factors (refer to Section 5).
3.3 Emissions to land Emissions to land could include:
• solid wastes • slurries • sediments • spills and leaks, and • storage and distribution of liquids.
Discharge of effluent to land is significantly influenced by land availability, climate, topography, and soil conditions. Many small, mainly inland communities discharge effluent to land. Land discharge in arid or inland regions is often associated with reuse of the effluent for other purposes, such as irrigation. When discharging effluent to land, the goal is to return water and nutrients with the least adverse effect on the soil, on the pasture or crop, and on the ecosystems near the discharge site. When total nitrogen and total phosphorus are discharged to land and beneficially used as plant nutrients by pasture or other crops, the discharge is considered to a voluntary transfer destination and reporting is optional. Total nitrogen and total phosphorus emissions only require reporting where the emissions are above threshold levels and the discharge is to a surface water body or a mandatory transfer destination. However, other NPI listed substances, contained in wastewater effluent and discharged to land may need to be characterised and reported where thresholds for these substances have been tripped. Discharge of NPI substances to a landfill or tailings dam is considered a transfer to a mandatory transfer destination, not an emission to land.
3.4 Leaks, overflows and spills Most large sewerage systems comprise main sewers, pumping stations, and emergency relief structures. During times of rainfall, infiltration occurs into the sewerage system. Sewerage systems are designed to contain a certain volume of wastewater flow under defined rainfall levels. When these levels are exceeded, wastewater spills may occur because of insufficient capacity in the system. Sewage spills are usually controlled by the location of emergency relief structures within the system. These are designed to control wastewater flow, and to minimise the impact on the environment and public health. Measurement of spills (or an estimation in the event that there are no emergency relief structures) will need to be undertaken where thresholds are triggered. Emissions to surface waters and land from spill events must be included in the threshold calculations. However, reporting of these emissions is required only when thresholds are exceeded.
13 SEWAGE AND WASTEWATER TREATMENT Version 2.1 published June 2011

4 Threshold calculations Estimates of emissions of NPI substances to air, water and land must be reported for each substance that triggers a threshold. Wastewater from domestic, commercial and industrial sources will contain a range of NPI listed substances, such as Total Nitrogen and Total Phosphorus, metals (e.g., lead), inorganics (e.g. hydrogen sulphide) and organics. Wastewater from commercial and industrial sources may contain higher levels of some substances. Commercial and industrial wastewater is typically discharged into the sewerage system on the basis of Trade Waste Agreements between an individual business and the facility operator. The knowledge gained by characterising this wastewater is useful in determining whether NPI reporting thresholds have been tripped, and in calculating emissions. The first step for the operator of a wastewater treatment facility when preparing an NPI report, is to consider which methods of effluent discharge are used by the facility, and which NPI substances may require reporting. Some pollutants, such as total nitrogen and total phosphorus, only require reporting where the emissions are directly to water.
4.1 Desktop screening Desktop screening should be used to determine which substances in raw wastewater are most likely to trip the Category 1 threshold and should therefore be included in the data gathering. The following tasks provide a method for screening: 1) Obtain the plant’s inflow (ML/day). 2) Lookup the corresponding ‘threshold concentration’ in Table 1 below. 3) Obtain the concentration for each substance in the following order of preference:
a) from your own monitoring records, b) from records for similar wastewater, and c) from average values for wastewater (refer Table 2)
4) Compare the ‘expected’ concentration with the ‘threshold’ concentration. 5) If the expected concentration is:
a) close to, equal to, or greater than the threshold - then either analyse for this substance or obtain data from existing monitoring;
b) moderately lower than the threshold - then you should conduct at least one analysis (to check the prediction) for this substance;
c) greatly lower than the threshold - then this substance could be omitted from NPI reporting consideration.
The following table shows the relationship between treatment capacity, threshold use quantities and corresponding threshold concentrations of NPI listed substances in wastewater for Category 1 substances and for total nitrogen (TN) and total phosphorus (TP) in the effluent.
Table 1: Relationship between treatment plant capacity and thresholds Threshold concentration to trip requirement to report to NPI
Category 1* Total Phosphorus** Total Nitrogen*** Treatment plant
capacity (ML/day) (mg/L) (mg/L) (mg/L)
5 5.48 1.64 8.22
10 2.74 0.82 4.11 15 1.83 0.55 2.74 20 1.37 0.41 2.05 25 1.1 0.33 1.64 30 0.91 0.27 1.37 35 0.78 0.23 1.17 40 0.68 0.21 1.03 45 0.61 0.18 0.91 50 0.55 0.16 0.82 55 0.5 0.15 0.75
14 SEWAGE AND WASTEWATER TREATMENT Version 2.1 published June 2011

Threshold concentration to trip requirement to report to NPI Treatment plant Category 1* Total Phosphorus** Total Nitrogen*** capacity
(ML/day) (mg/L) (mg/L) (mg/L) 60 0.46 0.14 0.68 65 0.42 0.13 0.63 70 0.39 0.12 0.59 75 0.37 0.11 0.55 80 0.34 0.1 0.51 85 0.32 0.1 0.48 90 0.3 0.09 0.46 95 0.29 0.09 0.43
100 0.27 0.08 0.41 110 0.25 0.07 0.37 120 0.23 0.07 0.34 130 0.21 0.06 0.32 140 0.2 0.06 0.29 150 0.18 0.05 0.27 160 0.17 0.05 0.26 170 0.16 0.05 0.24 180 0.15 0.05 0.23 190 0.14 0.04 0.22 200 0.14 0.04 0.21 300 0.09 0.03 0.14 400 0.07 0.02 0.1 500 0.05 0.02 0.08 600 0.05 0.01 0.07 700 0.04 0.01 0.06 800 0.03 0.01 0.05 900 0.03 0.01 0.05
1,000 0.03 0.01 0.04 2,000 0.01 0.004 0.02 3,000 0.01 0.003 0.01
* Threshold of 10 tonnes per year ** Threshold of 3 tonnes per year *** Threshold of 15 tonnes per year
Table 2: Indicative concentrations (mg/L) of NPI listed substances in different types of wastewater
Substance
Typical domestic sewage concentration
(SE Water, City West Water)
Typical mixed domestic and industrial sewage
concentration (Sydney Water, Brisbane Water)
(mg/L) (mg/L) Ammonia (total) 42.3 34.6 Arsenic & compounds 0.006 0.002 Boron & compounds 0.156 0.221 Cadmium & compounds 0.00025 0.0005 Chromium (total)* 0.012 0.011 Cobalt & compounds 0.001 0.0013 Copper & compounds 0.071 0.098 Fluoride compounds 1.1 0.93 Lead & compounds 0.0065 0.0002 Manganese & compounds 0.038 0.177 Mercury & compounds 0.00026 0.0002 Nickel & compounds 0.0038 0.011 Phenol 0.012 0.051 Selenium & compounds 0.0024 0.0043
15 SEWAGE AND WASTEWATER TREATMENT Version 2.1 published June 2011

Typical domestic Typical mixed domestic and
Substance sewage concentration industrial sewage (SE Water, City concentration (Sydney
West Water) Water, Brisbane Water) (mg/L) (mg/L) Total Nitrogen 57.1 60.96 Total Phosphorus 8.22 10.66 Zinc and compounds 0.12 0.0175 Total volatile organic compounds (VOC)**
<0.0135 ND
* This value is indicative only and will need to be split into Chromium III and Chromium VI, in general, Chromium (total) in sewage can be considered Chromium III ** VOC emissions are only reportable to air.
Example 3: Identifying the relevant substances in wastewater 1) A wastewater treatment plant processes 500ML/day of predominantly domestic/commercial
wastewater. 2) All treated wastewater is discharged to a nearby river. 3) The relevant threshold concentrations, from Table 1 are:
a) for Category 1 substances: 0.05 mg/L b) for total phosphorus (TP): 0.02 mg/L c) for total nitrogen (TN): 0.08 mg/L.
4) Based on the default values from Table 2, the ‘expected concentrations’ of ammonia (42.3 mg/L)
in the raw wastewater and Total Phosphorus (8.22 mg/L) and Total Nitrogen (57.1mg/L) in the effluent are greater than the threshold concentrations. Raw water should be analysed for ammonia as it is possible that it will trip the inflow use threshold. Effluent should be tested for total nitrogen and for total phosphorus. According to Table 2, other Category 1 substances including boron, copper, fluoride and zinc also need to be considered.
Table 2 contains indicative concentrations for desktop screening only. These should not be used directly in calculations for reporting to the NPI.
NPI reporting is likely to be more straightforward for facilities with lower average daily flows. For these facilities, the most likely substances that will have to be reported are ammonia (i.e., NH3 and NH4
+), chlorine, total nitrogen and total phosphorus. Metals with low reporting thresholds, such as mercury, can often be present at reportable levels, especially in communities with combined sewer systems. For small facilities, the steps to follow to determine what substances to report include: 1) For the facility’s average daily flow rate, calculate what concentration is needed in the influent to
accumulate to the mass threshold for the various substance groups. For example, a concentration of 2.8 mg/L will accumulate to 10 tonnes with an average flow rate of about 10 ML/day. If the facility’s average flow is 20 ML/day, Category 1a substances must be present in the raw wastewater at concentrations of 1.4 mg/L to be reportable.
2) Review the facilitiy’s monitoring data to determine which substances may meet these
concentrations. 3) Review information on non-residential dischargers to the system (i.e. industrial wastewater) to
determine what non-residential types of substances may be present in sufficient quantities.
16 SEWAGE AND WASTEWATER TREATMENT Version 2.1 published June 2011

4) It may be useful to look up the facility on the NPI database to identify which substances reported in previous years.
5) choose an appropriate Emission Estimate Technique (EET), as described in Section 5 to estimate
the emissions from the facility.
4.2 Usage based thresholds – Category 1 and 1b substances For those substances with a Category 1 threshold (metals, inorganic and organic substances), the threshold test is 10 tonnes of usage during the reporting year. For those substances with a Category 1b threshold (mercury), the threshold test is 5 kg of usage during the reporting year. For the purpose of the NPI, ‘usage’ includes:
• those substances present in the influent • those substances added as part of the wastewater treatment process, such as chlorine, and • those substances that may be generated as a by-product of the wastewater treatment process,
such as ammonia and hydrogen sulfide. Monitoring of the raw wastewater influent stream for NPI listed substances is the most appropriate way to determine whether a Category 1 or 1b threshold has been tripped. Equation (1) (located at the end of this section) allows such concentration data to be converted into annual influent loads, which can be compared against the Category 1 and 1b threshold quantities. For most facilities monitoring of the influent stream will not routinely cover many of the NPI listed substances. As a guide, Tables 3 and 4 can be used to estimate a facility’s likelihood of tripping a Category 1 or Category 1b threshold. These tables set out typical composition data for substances likely to trigger Category 1 and Category 1b in raw wastewater influent, and what this translates to as a daily usage figure at selected daily influent flows. This data is derived from a cross section of Australian wastewater treatment plants that represent domestic and mixed domestic/industrial systems.
For most sewage and wastewater treatment plants in Australia based on typical influent characteristics, very few of these compounds would trigger NPI threshold levels. However, unusual influent discharges or very large plants (eg >500ML/day) may require more detailed assessment against the NPI substance list.
Wastewater treatment plants servicing purely industrial catchments will need site specific influent monitoring pursuant to the needs at the particular location. Knowledge of a facility’s influent flow rate and substance concentrations allow extrapolation to estimate which substances may trip the Category 1 threshold. If a particular facility’s influent is non-typical (such as those predominantly served by industrial inputs), then these indicative values may not be applicable, and direct monitoring is recommended. If a Category 1 substance threshold is exceeded, all emissions and transfers of that substances must be reported, even if the actual emissions of the substances are very low or zero.
17 SEWAGE AND WASTEWATER TREATMENT Version 2.1 published June 2011
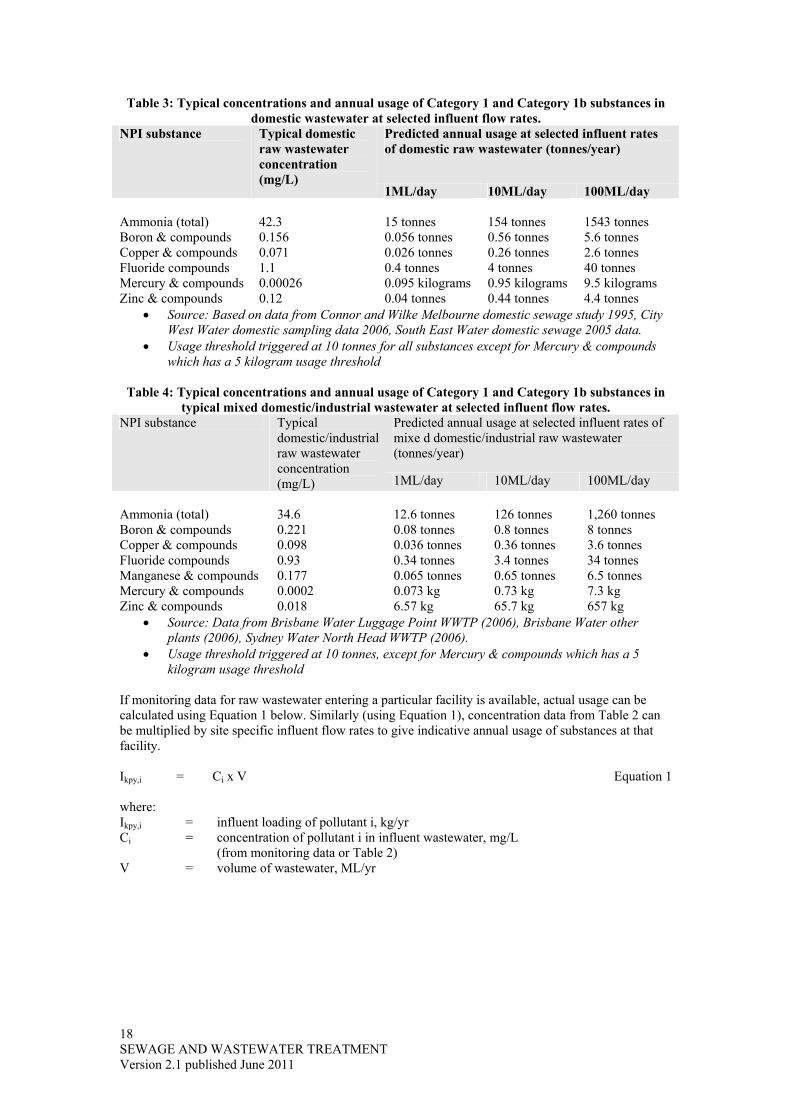
Table 3: Typical concentrations and annual usage of Category 1 and Category 1b substances in domestic wastewater at selected influent flow rates.
Predicted annual usage at selected influent rates of domestic raw wastewater (tonnes/year)
NPI substance Typical domestic raw wastewater concentration (mg/L)
1ML/day 10ML/day 100ML/day Ammonia (total) 42.3 15 tonnes 154 tonnes 1543 tonnes Boron & compounds 0.156 0.056 tonnes 0.56 tonnes 5.6 tonnes Copper & compounds 0.071 0.026 tonnes 0.26 tonnes 2.6 tonnes Fluoride compounds 1.1 0.4 tonnes 4 tonnes 40 tonnes Mercury & compounds 0.00026 0.095 kilograms 0.95 kilograms 9.5 kilograms Zinc & compounds 0.12 0.04 tonnes 0.44 tonnes 4.4 tonnes
• Source: Based on data from Connor and Wilke Melbourne domestic sewage study 1995, City West Water domestic sampling data 2006, South East Water domestic sewage 2005 data.
• Usage threshold triggered at 10 tonnes for all substances except for Mercury & compounds which has a 5 kilogram usage threshold
Table 4: Typical concentrations and annual usage of Category 1 and Category 1b substances in
typical mixed domestic/industrial wastewater at selected influent flow rates. Predicted annual usage at selected influent rates of mixe d domestic/industrial raw wastewater (tonnes/year)
NPI substance Typical domestic/industrial raw wastewater concentration (mg/L) 1ML/day 10ML/day 100ML/day
Ammonia (total) 34.6 12.6 tonnes 126 tonnes 1,260 tonnes Boron & compounds 0.221 0.08 tonnes 0.8 tonnes 8 tonnes Copper & compounds 0.098 0.036 tonnes 0.36 tonnes 3.6 tonnes Fluoride compounds 0.93 0.34 tonnes 3.4 tonnes 34 tonnes Manganese & compounds 0.177 0.065 tonnes 0.65 tonnes 6.5 tonnes Mercury & compounds 0.0002 0.073 kg 0.73 kg 7.3 kg Zinc & compounds 0.018 6.57 kg 65.7 kg 657 kg
• Source: Data from Brisbane Water Luggage Point WWTP (2006), Brisbane Water other plants (2006), Sydney Water North Head WWTP (2006).
• Usage threshold triggered at 10 tonnes, except for Mercury & compounds which has a 5 kilogram usage threshold
If monitoring data for raw wastewater entering a particular facility is available, actual usage can be calculated using Equation 1 below. Similarly (using Equation 1), concentration data from Table 2 can be multiplied by site specific influent flow rates to give indicative annual usage of substances at that facility.
Ikpy,i = Ci x V Equation 1 where: Ikpy,i = influent loading of pollutant i, kg/yr Ci = concentration of pollutant i in influent wastewater, mg/L
(from monitoring data or Table 2) V = volume of wastewater, ML/yr
18 SEWAGE AND WASTEWATER TREATMENT Version 2.1 published June 2011

Example 4: Estimation of usage of chlorine and compounds by mass balance
Chlorine dioxide cannot be compressed or stored commercially as a gas because it is explosive under pressure and therefore is generally produced on-site. Generation of chlorine dioxide commonly involves reacting sodium chlorite with chlorine gas, hypochlorous acid or hydrochloric acid. Other methods include generation from sodium chlorite electrochemically, and from sodium chlorate using hydrogen peroxide and sulfuric acid. If the quantity of chlorine dioxide produced on-site trips the Category 1 threshold then the quantity of pre-cursor reactant brought on-site will also trip this threshold. Generators of chlorine dioxide produce dilute solutions which are stored before use. Production is either batch or continuous. The annual production of chlorine dioxide can be calculated as follows: For chlorine dioxide produced in batch production
• Batch mass = concentration of chlorine dioxide (mg/L) x volume of the batch (L) • Annual production (t/yr) = sum of production for all batches / 109 • (1 tonne = 109 mg)
For continuous production
• Annual production (t/yr) = ave. conc. (mg/L) x total volume (L)/109
Example 5: Threshold calculation for fluoride (domestic system)
Influent wastewater fluoride concentration = 1 mg/L Total volumes received = 100ML/day or 36,500 ML/yr
Threshold load received = 1 mg/L x 36,500 ML/yr = 36,500 kg/yr
Threshold level of 10 tonnes has been tripped and therefore fluoride loads in effluent must be reported.
Example 6: Threshold calculation for Chlorophenols (industrial system)
Influent chlorophenol concentration = 0.3 mg/L Total volumes received = 100ML/day or 36,500 ML/yr Threshold load received = 0.3 mg/L x 36,500 ML/yr = 10,950 kg/yr or 10.95 tonnes
Threshold level of 10 tonnes has been tripped and therefore chlorophenol loads must be reported. However effluent monitoring shows;
Effluent chlorophenol concentration = < 0.001 mg/L Although no chlorophenol has been detected in the effluent, a concentration of zero is unlikely so a value of half the detection limit (i.e., 0.5 μg/L) is used for the emission estimations.
4.3 Category 2a and 2b substances If your facility burns more than a certain amount of fuel (or waste gases) or uses more than a certain amount of electricity per year, you are required to report emissions from those substances listed as Category 2a or 2b. For more information about these thresholds consult the NPI Guide.
19 SEWAGE AND WASTEWATER TREATMENT Version 2.1 published June 2011

4.4 Category 3 substances – Total nitrogen and phosphorus The next step in the reporting process is to determine total annual emissions of total nitrogen and total phosphorus to waterways and/or transfer to mandatory reporting transfer destinations. If emissions/transfers of total nitrogen exceeds 15 tonnes and/or total phosphorus exceeds 3 tonnes, the Category 3 threshold has been tripped. Total nitrogen and total phosphorus are the only substances in threshold Category 3, and as such are the only substances at typical wastewater treatment plants that require threshold evaluation on an emission and transfer basis.
Note: Emissions of both total nitrogen and total phosphorus must be reported if either of the Category 3 nitrogen or phosphorus thresholds are exceeded.
Since threshold determination and emission estimation are analogous in this case, see Section 5 for Emission Estimation Techniques (EET).
20 SEWAGE AND WASTEWATER TREATMENT Version 2.1 published June 2011

5 Emission estimation techniques The five types of Emission Estimation Techniques (EETs) described in The NPI Guide are: 1) sampling or direct measurement – is suitable for all emission mechanisms with the exception of
diffuse air emissions 2) mass balance method – is applicable to emissions to air, land and water 3) engineering estimation method - is suitable for all emissions and may be based on either
a) mass transfer principles (suitable for air emissions of volatile organic and inorganic compounds), or
b) removal efficiency (applicable for emissions of substances to water and land, especially of metals and VOCs).
4) emission factor method – can be used for emissions to air, land and water however the available information for wastewater treatment plants may limit the use of this method to air (i.e., for volatile organic and inorganic compounds), and
5) an approved alternative. Select the EET (or mix of EETs) that is most appropriate for your purposes. For example, you might choose a mass balance to estimate fugitive losses from pumps and vents, direct measurement for stack and pipe emissions, and emission factors when estimating losses from storage tanks and stockpiles. You are able to use EETs that are not outlined in this document. You may, however, be required to seek the consent of your relevant environmental authority. For example, if your facility has developed site-specific emission factors, you may use these if approved by your relevant environmental authority. This manual seeks to provide the most effective EETs for the NPI substances relevant to this industry. However, the absence of an EET for a substance in this manual does not necessarily imply that an emission should not be reported to the NPI. The obligation to report on all relevant emissions remains if reporting thresholds have been exceeded. EETs presented in this manual relate principally to average process emissions. Emissions resulting from non-routine events are rarely discussed in the literature, and there is a general lack of EETs for such events. However, it is important to recognise that emissions resulting from significant operating excursions and/or accidental situations (e.g., spills) will also need to be estimated. Emissions to land, air and water from spills must be estimated and added to process emissions when calculating total emissions for reporting purposes. The emission resulting from a spill is the net emission; it is the quantity of the NPI reportable substance spilled, less the quantity recovered or consumed immediately (within 24 hours) during clean up operations.
5.1 Direct measurement Direct measurement relies on measured emission or transfer data to calculate emissions or transfer of a substance from a wastewater process. The direct measurement method should be used for NPI reporting whenever data are available.
1000opRt
E =
Equation 2
where: E = annual emission or transfer tonne/yr R = average emission or transfer rate kg/day top = operation days during a reporting year d/yr The average emission or transfer rate (R) is the mean value from all measurement events over a reporting year. The average emission or transfer rate is calculated by multiplying the measured substance concentration by measured flowrate as shown in the following equations. For aqueous emissions or transfers:
21 SEWAGE AND WASTEWATER TREATMENT Version 2.1 published June 2011

1000effeff
liq
QCR =
Equation 3
where: Rliq = aqueous emission or transfer rate, kg/day Ceff = substance concentration in effluent, g/m3 (monitoring or measurement data) Qeff = daily volume of effluent discharged, m3/day (monitoring or measurement data) For gaseous emissions or transfers:
1000AVCR airair
air =
Equation 4
where: Rair = air emission rate kg/day A = wastewater surface area m2 Cair = substance concentration in gas (monitoring or measurement data) g/m3 Vair = gas flux, i.e., volume flow per unit wastewater surface area (monitoring or
measurement data) m3/dm2
For emission or transfer by sludge:
610sludgesludge
sol
QCR =
Equation 5
where: Rsol = emission or transfer rate by sludge, kg/day Csludge = substance concentration in sludge, mg/kg of dry sludge (monitoring or
measurement data) Qsludge = daily sludge production, kg/day (dry weight) (monitoring or
measurement data) For emission or transfer by water in sludge (where the substance is not adsorbed in solids, but is present in the water fraction of the sludge):
1000100
/
⎟⎟⎠
⎞⎜⎜⎝
⎛×
= water
watersludgeeff
watersludge
rS
QCR
Equation 6
where: Rsludge(water) = emission or transfer rate by water
fraction of sludge, kg/day
Ceff = substance concentration in effluent, g/m3 (monitoring or measurement data) Qsludge = daily sludge production kg/day (total weight) (monitoring or
measurement data) Swater = water content of sludge (%) rwater = density of water kg/m3 There may be many instances where an NPI listed substance in either influent or effluent wastewater will not be analytically detectable. If analyses have been carried out and the specific NPI substance is not detected, do not report a load for this substance. The use of direct measurement is particularly useful for emissions to land and water, especially if regular monitoring is already undertaken to meet other regulatory requirements. If this is the case, the NPI does not require you to undertake additional sampling and measurement, rather simply reporting the emissions will be adequate. Example 7 provides an example of using direct measurement to determine the total annual Phosphorus emission.
22 SEWAGE AND WASTEWATER TREATMENT Version 2.1 published June 2011

Example 7: Estimation of Total Phosphorus emission to surface water by regular sampling
A treatment plant processes domestic wastewater that contains phosphorus. The emission of total phosphorus to water is determined by regular effluent monitoring. The average daily flowrate of water through the treatment plant is determined from records.
Month Average (Cout)
Average flowrate (f)
Days (d) Quantity= Cout x f x d
mg/L ML/day days kg/month
1 0.07 50 31 108.50
2 0.11 50 31 170.50
3 0.08 42 30 100.80
4 0.15 44 31 204.60
5 0.08 50 30 120.00
6 0.13 48 31 193.44
7 0.12 46 31 171.12
8 0.09 49 28 123.48
9 0.12 43 31 159.96
10 0.08 50 30 120.00
11 0.09 45 31 125.55
12 0.11 48 30 158.40
Total 1756.35
Emission to water of phosphorus was 1,760 kg (after rounding) for the reporting year. This is less than the 3 tonne reporting threshold for total phosphorus.
5.1.1 Emissions of chlorine Wastewater treatment plants exceeding the 10 tonne threshold by using a chlorine disinfection process must report emissions of chlorine in effluent discharged to receiving waters.
Example 8: Estimation of residual chlorine emissions to water The daily volume of wastewater treated is 60 ML and 100% is discharged to a nearby waterway. The residual chlorine loads from this facility are determined by the following.
Operating days per year = 365 days Flow rate = 60 ML/day Residual chlorine = 0.5 mg/L Annual emissions of chlorine = (0.5 x 10⁻⁶)(60 x 106 x 365) = 11 tonnes/yr
5.2 Mass balance Mass balance identifies the quantity of substance going in and out of an entire facility, process, or piece of equipment. Emissions can be calculated as the difference between input and output of each NPI substance. The simplest estimation method, material balance, relies on wastewater flowrate, and influent and effluent liquid-phase pollutant concentrations. The general form of equation used for the mass balance method is: 23 SEWAGE AND WASTEWATER TREATMENT Version 2.1 published June 2011

E = Input + Generation – Transformation - Accumulation
Equation 7 where:
E = annual emission or transfer of a substance from a wastewater process or from a configuration, tonne/yr
Input = total input quantities of a substance into a wastewater process or configuration, tonne/yr
Generation = total quantities of a substance formed within a wastewater process or configuration, tonne/yr
Transformation = total quantities of a substance removed by chemical transformation within a wastewater process or configuration, tonne/yr
Accumulation = total quantities of a substance retained within a wastewater process or configuration, tonne/yr. In almost all cases this term will be negligible.
5.3 Emission factors Emission factors for wastewater treatment are provided in Appendix B. The standard equation for air emission estimation using emissions factors is given by Equation 8 (Canadian Environmental Protection Act, 1999):
)1( fQEFE −= Equation 8
where: E = air emission quantity of a substance per time EF = uncontrolled emission factor f = emission control equipment efficiency Q = activity level (i.e. volume of wastewater treated per time)
5.4 Software packages Computer models may also be useful for calculating emissions from wastewater treatment facilities. Emissions estimated using models are a function of the wastewater treatment system configuration, the properties of the specific compounds present in the wastewater streams, and the emission estimation approaches used in the model algorithms. Two emission estimation software programs, TOXCHEM+ and WATER9, are discussed here. TOXCHEM+ This is an USEPA approved, emission-estimating program. TOXCHEM+ can be used to calculate emissions from wastewater treatment and collection systems. TOXCHEM+ was developed by the Wastewater Technology Centre of Environment Canada and Enviromega (Shine, 1996) and is commercially available from:
http://www.enviromega.com WATER9 This is a publicly available computer model developed by the USEPA that models the fate of organic compounds in various wastewater treatment units. WATER9 contains such features as the ability to link treatment units to form a treatment system, the ability to recycle among units, and the ability to generate and save site-specific data for a very large number of chemicals. WATER9 is a significant upgrade of features offered by three previous computer programs, WATER8, CHEM9, and CHEMDAT8. The WATER9 model is publicly available on the Clearinghouse for Inventories and Emission Factors (CHIEF) bulletin board system at the USEPA. The web address is: www.epa.gov/ttn/chief/software.html
24 SEWAGE AND WASTEWATER TREATMENT Version 2.1 published June 2011

6 Transfers of NPI substances in waste The NPI requires the mandatory reporting of NPI substances that are transferred as ‘waste’ to a final destination. Transfers are required to be reported if a Category 1, Category 1b or Category 3 reporting threshold is exceeded. For example, if the threshold has been exceeded for the Category 1 substance lead and compounds as a result of on-site use, transfers to a mandatory reporting transfer destination as well as emissions of lead and compounds are reportable. Both emissions and transfers are reportable in kilograms. There is no requirement to report transfers of substances that are exclusively Category 2a or 2b in the event that they have been tripped only by the fuel and energy use threshold. That is, there is no requirement to report transfers of oxides of Nitrogen, Particulate Matter ≤10 μm, Particulate Matter ≤ 2.5 μm, polychlorinated dioxins and furans, or polycyclic aromatic hydrocarbons. Transfers are also not reportable if they are contained in overburden, waste rock, uncontaminated soil or rock removed in construction or road building, or soil used in capping of landfills. Transfers are, however, required if they are transported to a destination for containment or destruction which includes:
• a destination for containment including landfill, tailings storage facility, underground injection or other long term purpose-built waste storage facility;
• an off-site destination for destruction; • an off-site sewerage system; and • an off-site treatment facility which leads solely to one or more of the above.
A containment destination may be on-site, for example a tailing storage facility on a mine site, or off-site, for example waste going to landfill. The transfer of NPI substances to a destination for reuse, recycling, reprocessing, purification, partial purification, immobilisation, remediation or energy recovery can be reported voluntarily. This is an opportune way for facilities to promote good news stories to their local community. Further information regarding transfers of waste, including how to estimate and report, can be found in The NPI Guide and Transfers Information Booklet.
25 SEWAGE AND WASTEWATER TREATMENT Version 2.1 published June 2011

7 Next steps for reporting This manual has been written to reflect the common processes employed in sewage and wastewater treatment industry. To ensure a complete report of the emissions for your facility, it may be necessary to refer to other EET manuals. These include:
• Combustion in boilers • Combustion in engines • Fuel and organic liquid storage • Fugitive emissions.
When you have a complete report of substance emissions from your facility, report these emissions according to the instructions in The NPI Guide. The following advice is compiled from relevant references and is presented below to aid in reporting.
The amount of a Category 1 acid emitted refers to the amount of the actual acid compound emitted or transferred (for example, in the case of ‘hydrochloric acid’, the amount emitted or transferred refers to the amount of hydrogen chloride emitted). It does not include any amounts of the acid that have been neutralised before release as the acid no longer exists.
The amount of ‘chlorine and compounds’ emitted or transferred refers to the total amount of chlorine gas (Cl2), free residual chlorine, hypochlorite ion (OCl-), hypochlorous acid (HOCl) and chloramines emitted or transferred, expressed as the equivalent weight of chlorine (Cl).
The amount emitted or transferred in relation to a substance listed as “(a metal) and compounds” refers only to the amount of the metal emitted or transferred (for example, the amount of “lead and compounds” emitted refers only to the amount of lead emitted).
Total nitrogen and total phosphorus in wastewater discharges consist of dissolved inorganic and organic, and particulate forms. The thresholds for total nitrogen and total phosphorus relate to the following terms:
• emissions refer only to the amounts of those total nitrogen and total phosphorus compounds that give rise to nitrate/nitrite and phosphate ions respectively, and
• transfers refer only to the amounts of soluble compounds of total nitrogen and total phosphorus that are in materials that readily permit the dissolution of these substances.
Total nitrogen is considered to be the sum of nitrate, nitrite, ammonia, and organic nitrogen all expressed as nitrogen. Total phosphorus is the sum of all inorganic and organic forms in water, expressed as phosphorus.
Quantities should be reported to two significant figures. The rounding method used should be in accordance with Australian Standard AS 2706. Rounding should be made in ‘one step’. Examples are:
Original Value Rounds to 8.2501 8.3 8.3499 8.3
If figures to be discarded fall midway between two numbers (i.e., end in a 5) then the value should be rounded to the nearest even number. Examples are:
Original value Rounds to nearest even value 8.45 8.4 8.5500 8.6
26 SEWAGE AND WASTEWATER TREATMENT Version 2.1 published June 2011

Caution should be taken when reporting an emission of a tripped substance as zero. Emissions should only be reported as zero in circumstances where there is certainty that the NPI substance is not emitted or emissions are negligible.
If a result is below the detection limit:
• and you are sure that the substance was not present, then report a zero value,
• otherwise, report a value that is half the detection limit.
27 SEWAGE AND WASTEWATER TREATMENT Version 2.1 published June 2011

8 References Araujo, K.; M. Colina; R. Mazurek; J. Delgado; H. Ledo; E. Gutierrez; and L. Her era, "Mercury determination by CV-AAS in wastewater and sewage sludge from a stabilization pond system", Presenius Journal of Analytical Chemistry 355, 1996, 319-320. Basu, S.; Z. C. Gu; and K. A. Shilinsky, "Application of packed scrubbers for air emissions control in municipal wastewater treatment plants", Environmental Progress 17 (1), 1998, 9-18. Battye, R.; W. Battye; C. Overcash; and S. Fudge (EC/R Inc., Durham, North Carolina, USA), "Development and selection of ammonia emission factors", prepared for U.S. Environmental Protection Agency, Office of Research and Development, Washing, D.C., August 1994. Beck, W. B.; M. K. Henry; and V. H. Edwards, "Controlling VOC emissions during wastewater treatment", Chemical Engineering 107 (8), August 2000, 113-116. Canadian Water and Wastewater Association (CWWA), "National survey of wastewater treatment plants", Ottawa, Ontario, June 14, 2001. Crites, R.; and G. Tchobanoglous, "Small and Decentralized Wastewater Management Systems", WCB/McGraw-Hill, New York, 1998. Czepiel, P. M.; P. M. Crill; and R. C. Harriss, "Methane emissions from municipal wastewater treatment processes", Environmental Science and Technology 27 (12), 1993, 2472-2477. D'Amato, R. M, II; and G. R. DeHollander, "Gaseous emissions from wastewater facilities", Water Environment Research 71 (5), 1999, 715-720. Dawson, D. S.; and W. L. Beyerlein, "Gaseous emissions from wastewater facilities", Water Environment Research 69 (4), 1997, 550-554. Droste, R. L., "Theory and Practice of Water and Wastewater Treatment", John Wiley & Sons, New York, 1997. Dyke, P. H.; C. Foan; M. Wenborn; P. J. Coleman, "A review of dioxin releases to land and water in the UK", The Science of the Total Environment 207, 1997, 119-131. Eastern Research Group. March 1998. Preferred and Alternative Methods for Estimating Air Emissions from Wastewater Collection and Treatment, Volume II: Chapter 5. Morrisville, NC, USA. Environment Canada, "Guide for Reporting to the National Pollutant Release Inventory 2001", 2002. Environmental Expert, information obtained from http://www.environmentalexpert.com , 2002. Frechen, F.-B.; and W. Koster, "Odour emission capacity of wastewaters standardization of measurement method and application", Water Science and Technology 38 (3), 1998, 61-69. Guo, T.; and J. Baasner, "Technical note: using FIMS to determine mercury content in sewage sludge, sediment and soil samples", Journal of Automatic Chemistry 18 (6), 1996, 221-223. Kanawati, J. (2007). Australia: Water and Wastewater Treatment. United States of America, Commercial Service, Department of Commerce, ID 140935. Kimochi, Y.; Y. Inamori; M. Mizuochi; K.-Q. Xu; and M. Matsumura, "Nitrogen removal and N2O emission in a full-scale domestic wastewater treatment plant with intermittent aeration", Journal of Fermentation and Bioengineering 86 (2), 1998, 202-206. Kirk-Othmer, Encyclopaedia of Chemical Technology, 3rd ed., vol.17, John Wiley & Sons, New York, 1982.
28 SEWAGE AND WASTEWATER TREATMENT Version 2.1 published June 2011
Lepri, L; P. Desideri; and M. Del Bubba, "Analysis of organic pollutants in a wastewater treatment plant", Annali di Chimica 87 (5), 1997, 317-335. Mayer, G. J.; I. S. Cheng; P. Pau; and F. Mohamed, "Emissions of air toxics from wastewater treatment plants", Water Environment Research 66 (2), 1994, 140-144. Melbourne Water. 1996, and subsequent written communications between VIC EPA and Melbourne Water in March 1999. Ministry of Health and Environmental Protection of the Netherlands, "Handbook of Emission Factors: Part 1 Non-industrial Sources", 1980. NWQMS. 1994. Agricultural and Resource Management Council of Australia and New Zealand (ARMCANZ) & Australian and New Zealand Environment and Conservation Council (ANZECC) National Water Quality Management Strategy: Australian Guidelines for Sewerage Systems: Acceptance of Trade Waste (Industrial Wastes). Canberra, ACT. NWQMS. 1997. Agricultural and Resource Management Council of Australia and New Zealand (ARMCANZ) & Australian and New Zealand Environment and Conservation Council (ANZECC) National Water Quality Management Strategy: Australian Guidelines For Sewerage Systems: Effluent Management. Canberra, ACT. Patterson, J. W., "Wastewater Treatment Technology", Ann Arbor Science Publishers, Michigan, 1995. Paxeus, N., "Organic pollutants in the effluents of large wastewater treatment plants in Sweden", Water Research 30 (5), 1996a, 1115-1122. Queensland Department of Environment and Heritage. 1995. Water Quality Sampling Manual. Queensland Government, Brisbane, QLD. Spellman, F. R., Ph.D. (1997) Microbiology for Water/Wastewater Operators. Lancaster, PA: Technomic Publishing Co. Inc. Stephenson, R. L.; and J. B. Blackburn, Jr., "The Industrial Wastewater Systems Handbook", Lewis Publishers, New York, 1998. Supply and Services Canada, "Priority substances list assessment report chlorinated wastewater effluents", Government of Canada, Environment Canada and Health Canada, 1993. Taskforce on Air Toxics of the Water Environment Federation. 1995. Toxic Air Emissions from Wastewater Treatment Facilities. Alexandria, VA, USA. The following EET manuals referred in this manual can be obtained from your local Environment Protection Agency (see the front of the NPI Guide for details). U.K. Environment Agency, "Endocrine-disrupting substances in the environment: what should be done?", Consultative Report, Rio House, Waterside Drive, Azter West, Almondsbury, Bristol BS32 4UD, U.K., January 1998 (www.environment-agency.gov.uk). U.S. EPA, "Preferred and alternative methods for estimating air emissions from wastewater collection and treatment", prepared for Emission Inventory Improvement Program of the U.S. Environmental Protection Agency (U.S. EPA), by Eastern Research Group, North Carolina, March 1997, obtained from the U.S. EPA Web site at http://www.epa.gov/ttn/chief/eiip/techreport/volume02/ii05.pdf USEPA. September 1991. Compilation of Air Pollutant Emission Factors, Volume 1: Stationary Point and Area Sources, fifth edition, AP-42. Section 4.3 Wastewater Collection, Treatment and Storage. United States Environmental Protection Agency, Office of Air Quality Planning and Standards. Research Triangle Park, NC, USA. Water Environment Association. (1987) Activated Sludge, Manual of Practice #9.
29 SEWAGE AND WASTEWATER TREATMENT Version 2.1 published June 2011
Water Environment Federation, "Design of Municipal Wastewater Treatment Plants, Volume III Solids Processing and Disposal", Water Environment Federation and American Society of Civil Engineering, Virginia, U.S.A., 1998c. WSAA. 2007. Based on collation of wastewater data from Sydney Water, Brisbane Water, South East Water, City West Water and Melbourne Water
30 SEWAGE AND WASTEWATER TREATMENT Version 2.1 published June 2011
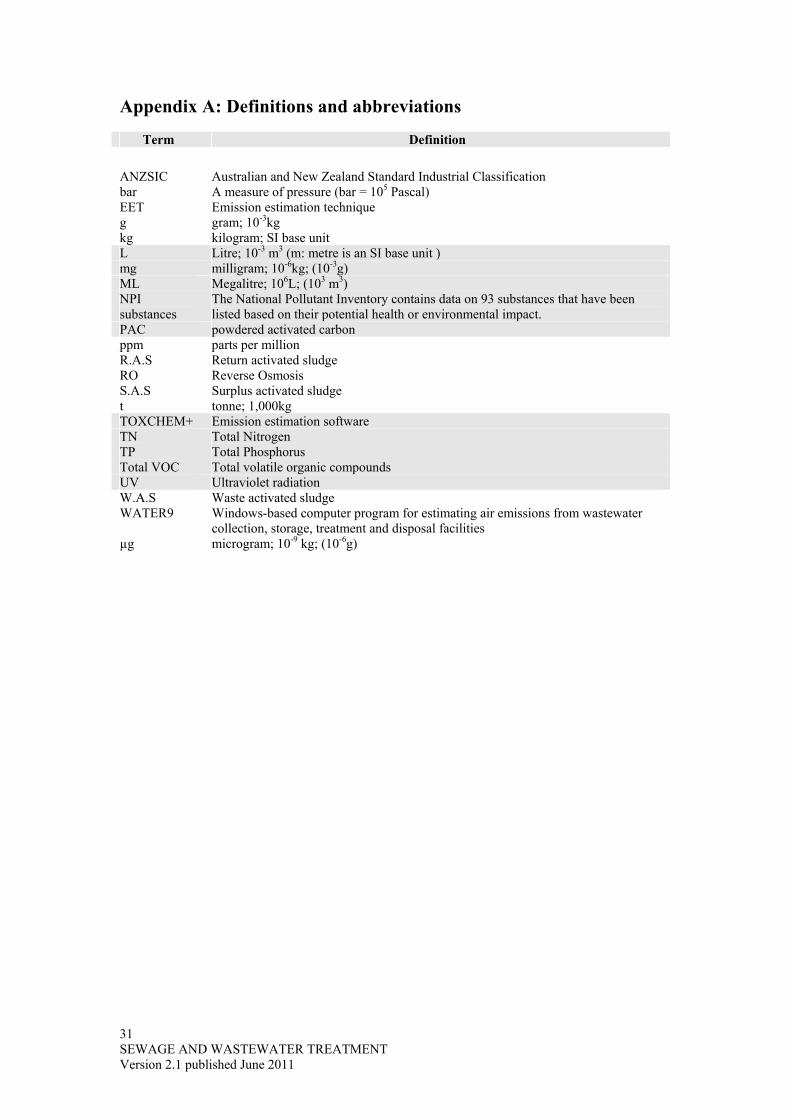
Appendix A: Definitions and abbreviations
Term Definition
ANZSIC Australian and New Zealand Standard Industrial Classification bar A measure of pressure (bar = 105 Pascal) EET Emission estimation technique g gram; 10-3kg kg kilogram; SI base unit L Litre; 10-3 m3 (m: metre is an SI base unit ) mg milligram; 10-6kg; (10-3g) ML Megalitre; 106L; (103 m3) NPI substances
The National Pollutant Inventory contains data on 93 substances that have been listed based on their potential health or environmental impact.
PAC powdered activated carbon ppm parts per million R.A.S Return activated sludge RO Reverse Osmosis S.A.S Surplus activated sludge t tonne; 1,000kg TOXCHEM+ Emission estimation software TN Total Nitrogen TP Total Phosphorus Total VOC Total volatile organic compounds UV Ultraviolet radiation W.A.S Waste activated sludge WATER9 Windows-based computer program for estimating air emissions from wastewater
collection, storage, treatment and disposal facilities µg microgram; 10-9 kg; (10-6g)
31 SEWAGE AND WASTEWATER TREATMENT Version 2.1 published June 2011

Appendix B: Emission factors An emission factor is a tool that is used to estimate emissions to the environment. It relates the quantity of substances emitted from a source, to some common activity associated with those emissions. Emission factors are obtained from US, European, and Australian sources, and are usually expressed as the weight of a substance emitted, divided by the unit weight or volume of wastewater discharged from the whole process, or from an individual unit operation. Emission rates are estimated for individual steps in a treatment process by the application of Equation 9. Ei,unit = EFi,unit x Qin x Ci Equation 9 where: Ei,unit = mass emission rate for volatile organic compound species i, g/day EFi,unit = emission factor of species i for the unit, g/g Qin = liquid volumetric flow rate into the unit, m3/day Ci = influent liquid concentration of species i, g/m3 The following tables’ present information based on air emission factors published in the National Pollutant Release Inventory Guidance Manual for the Wastewater Sector (Canadian Environmental Protection Act, 1999). The most relevant emission factors for Australian emission estimation are presented in Table 5. Other tables are presented for process-based information and for the few facilities that may trigger the need to report these other substances.
Table 5: Literature concentration values for NPI substances reported in air NPI SUBSTANCE AIR EMISSION FACTOR Notes
g/m3 Ammonia 2.2 ( Battye et al., 1994) Total volatile organic compounds 1.07 (USEPA FIRE, FIRE6.23)
Table 6: Plant wide air emission factors
NPI SUBSTANCE AIR EMISSION FACTOR kg/kg in influent
Acrolein 0.18 Acrylonitrile 0.24 Aniline 1.2 Benzene 1.14 Benzene hexachloro (HCB) 0.52 1,3- Butadiene 1.7 Chloroform 1.04 Chlorophenols 0.03 Dichloromethane 1.04 Ethylbenzene 1.12 Phenol 0.0018 Styrene 0.5 Toluene 1.16 Trichloroethylene 1.24 Vinyl chloride monomer 1.62
Volatile organic compounds 1.07 kg / 1,000 m3 influent Xylene 1.1
32 SEWAGE AND WASTEWATER TREATMENT Version 2.1 published June 2011

Table 7: Emission factors for air emission from headworks screening (wet scrubbers) NPI substance AIR EMISSION FACTOR
kg/MILLION m3
Benzene 0.78 Chlorine 559 Chloroform 0.22 Dichloromethane 0.049 Ethylbenzene 0.086 Toluene 0.08 Trichloroethylene 0.046 Xylene 0.086
Table 8: Uncontrolled air emission factors for air emissions from aerated grit chamber
NPI substance AIR EMISSION FACTOR kg/MILLION m3
Benzene 0.43 Chloroform 0.073 Dichloromethane 0.15 Formaldehyde 2.16.10-4 Styrene 6.60.10-4 Toluene 0.32 Trichloroethylene 0.034 Xylene 0.1
Table 9: Uncontrolled emission factors for air emissions from primary settling
NPI substance AIR EMISSION FACTOR kg/MILLION m3
Benzene 0.065 Chloroform 1.8 Dichloromethane 1.5 Formaldehyde 0.026 Styrene 0.13 Toluene 0.19 Trichloroethylene 0.35 Xylenes 0.23
Table 10: Uncontrolled emission factors for air emissions from diffused air activated sludge
NPI substance AIR EMISSION FACTOR kg/MILLION m3
Benzene 0.08 Chloroform 2.1 Dichloromethane 2.4 Formaldehyde 0.013 Toluene 0.26 Trichloroethylene 0.5 Xylene 0.42
33 SEWAGE AND WASTEWATER TREATMENT Version 2.1 published June 2011

Table 11: Uncontrolled emission factors for air emissions from mechanical mixed air activated sludge
NPI substance AIR EMISSION FACTOR kg/MILLION m3
Chloroform 3 Dichloromethane 0.11 Toluene 0.079 Xylene 0.014
Table 12: Uncontrolled emission factors for air emissions from pure oxygen activated
NPI substance AIR EMISSION
FACTOR kg/MILLION m3 Benzene 4.56×10⁻⁴
Chloroform 9.98×10⁻³
Dichloromethane 8.64×10⁻³
Formaldehyde 3.48×10⁻⁵
Styrene 5.88×10⁻⁴
Toluene 1.04×10⁻³
Trichloroethylene 1.63×10⁻³
Xylenes 1.40×10⁻³
Table 13: Uncontrolled emission factors for air emissions from trickling filter
NPI substance AIR EMISSION
FACTOR kg/MILLION m3 Benzene 0.19 Chloroform 2.2 Dichloromethane 1.1 Formaldehyde 0.065 Styrene 0.72 Toluene 6.1 Trichloroethylene 0.33 Xylenes 6.7
Table 14: Uncontrolled emission factors for air emissions from secondary clarifier
NPI substance AIR EMISSION
FACTOR kg/MILLION m3
Benzene 0.017 Chloroform 9.48×10⁻³ Dichloromethane 0.011 Formaldehyde 1.80×10⁻⁴
Toluene 2.92×10⁻³
Xylene 2,21 x 10⁻³
34 SEWAGE AND WASTEWATER TREATMENT Version 2.1 published June 2011

Table 15: Uncontrolled emission factors for air emissions from tertiary filters
NPI substance AIR EMISSION FACTOR kg/MILLION m3
Benzene 4.80×10⁻⁴ Chloroform 0.013 Dichloromethane 3.31×10⁻³
Formaldehyde 2.70×10⁻⁷ kg/ kg
Toluene 1.25×10⁻³
Trichloroethylene 1.01×10⁻³
Xylene 6.96×10⁻⁴
Table 16: Uncontrolled emission factors for air emissions from chlorine contact tank NPI substance AIR EMISSION FACTOR kg/MILLION m3
Benzene 0.017 Chlorine 3.28×10⁻³ kg/ kg Chloroform 0.057 Dichloromethane 5.16×10⁻³ Ethylbenzene 0.025 Formaldehyde 2.40×10⁻⁴ Toluene 0.02 Trichloroethylene 1.67×10⁻⁶ kg/ kg Vinyl chloride monomer
2.21×10⁻⁶ kg/ kg
Xylene 0.46
Table 17: Uncontrolled emission factors for air emissions from dechlorination NPI substance AIR EMISSION FACTOR
kg/MILLION m3
Benzene 7.50 x 10⁻¹ kg/ kg
Chloroform 2.075 x10⁻¹ kg/ kg
Dichloromethane 3.96 ×10⁻⁴
Formaldehyde 2.967 x10⁻¹ kg/ kg
Styrene 6.40 x10⁻¹ kg/ kg
Toluene 8.64 ×10⁻⁵
Trichloroethylene 8.04 ×10⁻⁵
Xylenes 2,88 x 10⁻⁵
35 SEWAGE AND WASTEWATER TREATMENT Version 2.1 published June 2011

Table 18: Uncontrolled emission factors for air emissions from gravity sludge thickener
NPI substance AIR EMISSION FACTOR kg/MILLION m3
Chloroform 1.64 Dichloromethane 1.57 Formaldehyde 6.00×10⁻³ Styrene 1.44×10⁻³ Toluene 0.33 Trichloroethylene 0.42 Xylenes 0.15
Table 19: Uncontrolled emission factors for air emissions from dissolved air flotation sludge
thickener NPI substance AIR EMISSION FACTOR
kg/MILLION m3
Benzene 0.36 Chloroform 1.28 Dichloromethane 17.4 Formaldehyde 0.068 Toluene 1.88 Trichloroethylene 0.26 Xylenes 0.42
Table 20: Uncontrolled emission factors for air emissions from anaerobic digester
NPI substance AIR EMISSION FACTOR kg/MILLION m3
Benzene 36.9 Chloroform 0.17 Dichloromethane 1.02 Formaldehyde 0.034 Styrene 1.06 Toluene 96.4 Trichloroethylene 2.95 Vinyl chloride monomer
20.3
Xylenes 99.5
Table 21: Uncontrolled emission factors for air emissions from belt filter press NPI substance AIR EMISSION FACTOR
kg/MILLION m3
Benzene 6 Chloroform 1.32 Dichloromethane 1.64 Formaldehyde 7.96 Toluene 6.45 Trichloroethylene 11.8 Xylene 3,40
36 SEWAGE AND WASTEWATER TREATMENT Version 2.1 published June 2011

Table 22: Uncontrolled emission factors for air emissions from sludge centrifuge NPI substance AIR EMISSION FACTOR
kg/MILLION m3
Benzene 0.22 Chloroform 0.67 Dichloromethane 0.64 Formaldehyde 1.36 Styrene 0.37 Toluene 213.3 Trichloroethylene 0.2 Vinyl chloride monomer
0.56
Xylenes 1.58
Table 23: Uncontrolled emission factors for air emissions from sludge drying bed NPI substance AIR EMISSION FACTOR
kg/MILLION m3
Benzene 0.34 Dichloromethane 0.68 Formaldehyde 0.14 Toluene 0.16 Xylene 1.32
Table 24: Air emission factors for volatile organic compounds emitted during the entire course of
wastewater collection and treatment VOLATILE ORGANIC
COMPOUND AIR-EMISSION FACTOR
(MASS EMITTED/MASS INPUT) Low volatility 0.03 Medium volatility 0.19 Medium- high volatility 0.25 High volatility 0.68
37 SEWAGE AND WASTEWATER TREATMENT Version 2.1 published June 2011
Appendix C: Modifications to the industry manual manufacturing emission estimation technique (EET) manual (Version 1 March 1999)
Page Outline of alteration Throughout Rearranged material to suit the new format 33 Added the flow chart for NPI reporting: modified to suit wastewater operations 15 Modified the list of information required to suit the new estimation methods 6,8,10,14 Added a system diagram 5,6,7,8,9,10,11,12,13,14
Added background description of waste flows and process description
15 Added a section of types of emissions and sources 18 Added a section on thresholds and their determination 30 Added reference to WATER9 and other relevant emission estimation software for
wastewater 31 Added a section of transfers Version 2.1 June 2011
Page Outline of alteration Throughout updated format
changed references to releases to emissions iii updated equation and example lists 4 Added section regarding additional NPI resources 9 Updated Figure 4 17 Added note about mercury threshold of 5 kg 18 Added note about mercury threshold of 5 kg 24 Removal of descriptions of eet discussed in the NPI guide 27 Changed Additional reporting information to Next steps for reporting 35 Corrected xylene emission factor 43 Correction to equation 9
38 SEWAGE AND WASTEWATER TREATMENT Version 2.1 published June 2011

39 SEWAGE AND WASTEWATER TREATMENT Version 2.1 published June 2011
Appendix D: VOC emissions from wastewater collection treatment and storage. The rate of volatilisation of substances in wastewater can be determined using mass transfer theory. Individual gas-phase, and liquid phase mass transfer coefficients (Kg and Kl respectively) are used to estimate overall mass transfer coefficients (K, Koil, and KD) for each VOC emission of interest. These overall mass transfer coefficients are then used to calculate emission rates in grams per second, which can then be used to determine emissions per year for NPI reporting purposes. VOCs vary in their volatility. The emission equations presented in this appendix can be used for organic compounds of high, medium, and low volatility. The Henry’s Law constant (HLC) is often used as a measure of a compound’s volatility, or the diffusion of organics into the air relative to diffusion through liquids. The volatility of VOCs is categorised below: High volatility HLC > 10-3 atm-m3/gmol Medium volatility 10-3 > HLC > 10-5 atm-m3/gmol Low volatility HLC < 10-5 atm-m3/gmol The design and arrangement of collection, treatment, and storage systems are facility-specific, therefore the most accurate emissions from wastewater treatment operations will come from actual tests at a facility (eg. direct measurement of emissions from openings). In the event that actual data is unavailable, the emission equations provided can be used. Emission equations should be given site-specific information whenever it is available, as the most extensive characterisation of an actual system will produce the most accurate estimates from an emissions model.

40 SEWAGE AND WASTEWATER TREATMENT Version 2.1 published June 2011
Flowthrough
Disposal
Flowthrough
Disposal
Flowthrough
Disposal
Flowthrough
Disposal
Flowthrough
Disposal
Flowthrough
Disposal
Flowthrough
Disposal
Flowthrough
Disposal
Junction Box
Lift Station
Sump
Weir
Clarifier Weir
BiologicallyActive
BiologicallyActive
BiologicallyActive
Oil FilmThickness
greater than1 cm?
Weir?
Diffused Air?
Oil FilmLayer?
Is SystemAerated?
Yes
No
Yes
Yes
Yes
Yes
No
No
No
No
No
Yes
No
Yes
Yes
No
Wastewater
Collection
Wastewater
Treatment &Storage
1 2 7 20
1 2 7 19
1 2 7 14
1 2 7 13
1,3 2 ,4 7 16
1 2 7 15
1 2 7 16
1,3 2 ,4 7 15
1,3 2 ,4 7 12
1,3 2 ,4 7 11
1 2 7 12
1 2 7 11
2 9 18
2 9 17
2 9 22
2 9 23
3 2 7 12
3 2 7 12
1 2 7 12
5 6 8 24
10 21
Kl Kg Koil KD K N
Equations Used to Obtain:a
Figure 5 Flow diagram for estimating VOC Emissions from wastewater collection, treatment and storage
a Numbered equations are present in Table 4 Kl = Individual liquid phase mass transfer coefficient, m/s Kg = Individual gas-phase mass transfer coefficient, m/s Koil = Overall mass transfer coefficient in the oil phase, m/s KD = Volatilisation - reaeration theory mass transfer coefficient K = Overall mass transfer coefficient, m/s N = Emissions, g/s

Using the flow diagram and equations for estimating VOC emissions Step 1 - Using Figure 1 and Tables 4 and 5. Trace through Figure 1 to determine the correct equations to use for your process. Figure 1 is divided into two sections:
• wastewater treatment and storage systems; and • wastewater collection systems.
Wastewater treatment and storage systems are further segmented into:
• aerated/non-aerated systems; • biologically active systems; • oil film layer systems; and • surface impoundment flowthrough, or disposal (or fate management).
In flowthrough systems, wastewater is treated and subsequently discharged to a subsequent wastewater treatment facility, or a receiving body of water such as a river or stream. In general, municipal wastewater treatment facilities and industrial wastewater treatment facilities are both classified as flowthrough systems. Disposal systems, also referred to as fate management systems, on the other hand, do not discharge any wastewater. Step 2 - Using the Equations The numbers in Figure 1 under the columns for Kl, Kg, Koil, KD, K and N refer to the appropriate equations in Table 4. Definitions for all parameters in these equations are given in Table 5. This table also supplies the units that must be used for each parameter, with codes to help locate input values. If the parameter is coded with: A - a site-specific value is required; B - requires a site-specific parameter, but defaults are available; C - the parameter can be obtained from literature data. Table 10 contains a list of approximately 150 chemicals and their physical properties that are needed to calculate emissions from wastewater using the correlations in Table 4; and D - these are calculated values.
Assumption
All emission systems presented in Figure 1 imply a completely mixed, or uniform wastewater concentration system.
To estimate an emission rate (N), the first step is to calculate individual gas-phase, and liquid-phase mass transfer coefficients (Kg and Kl respectively), using the appropriate equations. The individual coefficients are then used to calculate the overall mass transfer coefficient, K. Exceptions to this procedure are the calculation of the overall mass transfer coefficients in the oil phase, Koil, and the overall mass transfer coefficient for a weir, KD. Koil requires only Kg, and KD does not require any individual mass transfer coefficients. The overall mass transfer coefficient is then used to calculate the emission rates (N). This process must be repeated for each different constituent in the wastewater for which you are determining emissions. Step 3 - Calculating annual emissions
41 SEWAGE AND WASTEWATER TREATMENT Version 2.1 published June 2011

Once the emission rates (N) have been calculated, the next step is to determine emissions on an annual basis. This is achieved using the following equation.
E = N x OpHrs x 10-6 x 3,600 where : E = annual emissions, tonne/yr N = emissions rate, g/sec OpHrs = operating time per year, hr/yr 10-6 = conversion factor, tonne/g 3,600 = conversion factor, sec/hr The annual emission that is obtained can then be used as an emission estimate for NPI reporting purposes.
Table 25 Mass transfer correlations and emission equations Equation number
Equation
Individual liquid (Kl) and gas (Kg) phase mass transfer coefficients 1.
Kl (m/s) = (2.78 * 10-6) (Dw/Dether)2/3 For: 0<U10<3.25 m/s and all F/D ratios Kl (m/s) = [(2.605 * 10-9)(F/D) + (1.277 * 10-7)] (U10)2 (Dw/Dether)2/3 For: U10 >3.25 m/s and 14 < F/D <51.2 Kl (m/s) = (2.61 * 10-7) (U10)2 (Dw/Dether)2/3 For: U10 >3.25 m/s and F/D >51.2 Kl (m/s) = 1.0 * 10-6 + 144 * 10-4 (U*)2.2 (ScL)-0.5 ; U* <0.3 Kl (m/s) = 1.0 * 10-6 + 34.1 * 10-4 U* (ScL)-0.5 ; U* >0.3 For: U10 >3.25 m/s and F/D <14 where: U* (m/s) = (0.01)(U10)(6.1 + 0.63(U10))0.5 SCL = μL/(ρLDw) F/D = 2 (A/π)0.5
2. Kg (m/s) = (4.82 * 10-3)(U10)0.78(ScG)-0.67 (de)-0.11 where: ScG = μa/(ρaDa) de(m) = 2 (A/π)0.5
3. Kl (m/s) = [(8.22 * 10-9)(J)(POWR)(1.024)(T-20) * (Ot)(106)(MWL)/(VavρL)](Dw/DO2,w)0.5 where: (POWR) (hp) = (total power to aerators)(V) Vav(ft2) = (fraction of area agitated)(A)
4. Kg (m/s) = (1.35 * 10-7)(Re)1.42(P)0.4(ScG)0.5 (Fr)-0.21(DaMWa/d) where: Re = d2wρa/μa P = [(0.85)(POWR)(550(ft-lbf/s- hp)/NI)]gc/(ρL(d*)5w3) ScG = μa/(ρaDa) Fr = (d*)w2/gc
42 SEWAGE AND WASTEWATER TREATMENT Version 2.1 published June 2011

Equation Equation number
5. Kl (m/s) = (fair,l)(Q)/[3,600 s/min (hc)(πdc)] where: fair,l = 1 -1/r r = exp[0.77(hc)0.623 (Q/πdc)0.66(Dw/DO2,w)0.66]
6. Kg (m/s) = 0.001 + (0.0462(U**)(ScG)-0.67) where: U** (m/s) = [6.1 + (0.63)(U10)]0.5(U10/100) ScG = μa/(ρaDa)
Overall mass transfer coefficients for water (K) and oil (Koil) phases and for weirs (KD)
7. K = (Kl Keq Kg)/(Keq Kg + Kl) where: Keq = H/(RT)
8. K (m/s) = [[MWL/(KlρL*(100cm/m)] + [MWa/KgρaH* 55 555 * (100cm/m))]]-1 MWL/[(100cm/m)ρL]
9. Koil = KgKeqoil where: Keqoil = P*ρaMWoil/(ρoilMWaPo)
10. KD = 0.16h (Dw/DO2,w)0.75
Air emissions (N)
11. N(g/s) = (1-Ct/Co) V Co/t where: Ct/Co = exp[-KA t/V]
12. N(g/s) = KCLA where: CL(g/m3) = Q Co/(KA + Q)
13. N(g/s) = (1-Ct/Co) V Co/t where: Ct/Co = exp[-(KA + KeqQa)t/V]
14. N(g/s) = (KA + QaKeq)CL where: CL(g/m3) = QCo/(KA + Q + QaKeq)
15. N(g/s) = (1-Ct/Co) KA/(KA + Kmax bi V/Ks) V Co/t where: Ct/Co = exp[-Kmax bi t/Ks - KA t/V]
16. N(g/s) = K CL A where: CL(g/m3) = [-b + (b2 - 4ac)0.5]/(2a) and: a = KA/Q + 1 b = Ks(KA/Q + 1) + Kmax bi V/Q - Co c = -KsCo
43 SEWAGE AND WASTEWATER TREATMENT Version 2.1 published June 2011

Equation Equation number
17. N(g/s) = (1-Ctoil/Cooil)VoilCooil/t where: Ctoil/Cooil = exp[-Koil t/Doil] and: Cooil = Kow Co/[1 - FO + FO(Kow)] Voil = (FO)(V) Doil = (FO)(V)/A
18. N(g/s) = KoilCL,oilA where: CL,oil(g/m3) = QoilCoil/(KoilA + Qoil) and: Cooil = Kow Co/[1 - FO + FO(Kow)] Qoil = (FO)(Q)
19. N(g/s) = (1-Ct/Co)(KA + QaKeq)/(KA + QaKeq + Kmax bi V/Ks) V * Co/t where: Ct/Co = exp[-(KA + KeqQa)t/V - Kmax bi t/Ks]
20.
N(g/s) = (KA + QaKeq)CL where: CL(g/m3) = [-b + (b2 - 4ac)0.5]/(2a) and: a = (KA + QaKeq)/Q + 1 b = Ks[(KA + QaKeq)/Q + 1] + Kmax bi V/Q - Co c = -KsCo
21. N(g/s) = (1 - exp[-KD])Q Co
22. N(g/s) = KoilCL,oilA where: CL,oil(g/m3) = Qoil(Cooil
*)/(KoilA + Qoil) and: Cooil
* = Co/FO Qoil = (FO)(Q)
23. N(g/s) = (1 - Ctoil/Cooil
*)(Voil)(Cooil*)/t
where: Ctoil/Cooil* = exp[-Koil t/Doil]
and: Cooil
* = Co/FO Voil = (FO)(V) Doil = (FO)(V)/A
24. N(g/s) = (1 - exp[-K π dchc/Q])Q Co
44 SEWAGE AND WASTEWATER TREATMENT Version 2.1 published June 2011

Table 26 Parameter definitions for mass transfer correlations and emission equations Parameter Definition Units Code a
A Waste water surface area m2 A bi Biomass concentration (total biological
solids) g/m3 B
CL Concentration of constituent in the liquid phase
g/m3 D
CL, oil Concentration of constituent in the oil-phase g/m3 D Co Initial concentration of constituent in the
liquid phase g/m3 A
Co,oil Initial concentration of constituent in the oil phase, considering mass transfer resistance between water and oil phases
g/m3 D
Cooil* Initial concentration of constituent in the oil
phase, considering no mass transfer resistance between water and oil phases
g/m3 D
Ct Concentration of constituent in the liquid phase at time = t
g/m3 D
Ctoil Concentration of constituent in the oil phase at time = t
g/m3 D
d Impeller diameter cm B D Wastewater depth m A,B d* Impeller diameter ft B Da Diffusivity of constituent in air cm2/s B dc Clarifier diameter m B de Effective diameter m D
Dether Diffusivity of ether in water cm2/s (8.5 x 10⁻⁶)b DO2,w Diffusivity of oxygen in water cm2/s (2.4 x 10⁻⁵)b Doil Oil film thickness m B Dw Diffusivity of constituent in water cm2/s C fair,l Fraction of constituent emitted to the air,
considering zero gas resistance dimensionless D
F/D Fetch to depth ratio, de/D dimensionless D FO Fraction of volume which is oil dimensionless B Fr Froude number dimensionless D gc Gravitational constant (a conversion factor) lbm-ft/s2-lbf 32.17 h Weir height (distance from the wastewater
overflow to the receiving body of water) ft B
hc Clarifier weir height m B H Henry’s law constant of the constituent atm-m3/gmol C J Oxygen transfer rating of the surface aerator lb O2/(hr-hp) B K Overall mass transfer coefficient for transfer
of constituent from liquid phase to gas-phase m/s D
KD Volatilisation-reaeration theory mass transfer coefficient
dimensionless D
Keq Equilibrium constant or partition coefficient (concentration in gas phase/concentration in liquid phase)
dimensionless D
Keqoil Equilibrium constant or partition coefficient (concentration in gas phase/concentration in oil phase)
dimensionless D
Kg Gas phase mass transfer coefficient M/sec D Kl Liquid phase mass transfer coefficient m/s D
Kmax Maximum biorate constant g/s-g biomass A,C Koil Overall mass transfer coefficient for transfer
of constituent from oil phase to gas-phase m/s D
Kow Octanol-water partition coefficient dimensionless C
45 SEWAGE AND WASTEWATER TREATMENT Version 2.1 published June 2011

Parameter Definition Units Code a Ks Half saturation biorate constant g/m3 A,C
MWa Molecular weight of air g/gmol 29 MWoil Molecular weight of oil g/gmol B MWL Molecular weight of water g/gmol 18
N Emissions g/s D NI Number of aerators dimensionless A,B Ot Oxygen transfer correction factor dimensionless B P Power number dimensionless D P* Vapour pressure of the constituent atm C Po Total pressure atm A
POWR Total power to aerators hp B Q Volumetric flowrate m3/s A Qa Diffused air flowrate m3/s B Qoil Volumetric flowrate of oil m3/s B
r Deficit ratio (ratio of the difference between the constituent concentration at solubility, and actual constituent concentration in the upstream and the downstream)
dimensionless D
R Universal gas constant atm-m3/gmol-K 8.21 x 10⁻⁵ Re Reynolds number dimensionless D ScG Schmidt number on gas side dimensionless D ScL Schmidt number on liquid side dimensionless D T Temperature of water oC or Kelvin
(K) A
t Residence time of disposal s A U* Friction velocity m/s D U** Friction velocity m/s D U10 Wind speed at 10 m above the liquid surface m/s B V Wastewater volume m3 A
Vav Turbulent surface area ft2 B Voil Volume of oil m3 B w Rotational speed of impeller rad/s B ρa Density of air g/cm3 1.2 x 10⁻³ ρL Density of water g/cm3 1b ρoil Density of oil g/m3 B μa Viscosity of air g/cm-s (1.8 x 10⁻⁴)b μL Viscosity of water g/cm-s (8.93 x 10⁻³)b
a Code: A = Site-specific parameter B = Site-specific parameter. For default values, see Table 6. C = Parameter can be obtained from Tables 10 & 11. These represent chemical properties at 25oC. D = Calculated value. b Reported values at 25oC.
46 SEWAGE AND WASTEWATER TREATMENT Version 2.1 published June 2011

Table 27 Site-specific default parameters Default
parameter
Definition Default value
General T Temperature of water 298 K
U10 Wind speed 4.47 m/s
Biotreatment systems
bi Biomass concentration (for biologically active systems) Quiescent treatment systems Aerated treatment systems Activated sludge units
50 g/m3 300 g/m3
4,000 g/m3 POWR Total power to aerators
(for aerated treatment systems) (for activated sludge)
0.75 hp/1,000 ft3 (V)
2 hp/1,000 ft3(V)
W Rotational speed of impeller (for aerated treatment systems)
126 rad/s (1200 rpm)
d(d*) Impeller diameter (for aerated treatment systems)
61 cm
Vav Turbulent surface area (for aerated treatment system) (for activated sludge)
0.24 (A) 0.52 (A)
J Oxygen transfer rating to surface aerator (for aerated treatment systems)
3 lb O2/hp- hr
Ot Oxygen transfer correction factor (for aerated treatment systems)
0.83
NI Number of aerators POWR/75
Diffused air systems
Qa Diffused air volumetric flowrate 0.0004(V) m3/s
Oil film layers MWoil Molecular weight of oil 282 g/gmol
Doil Depth of oil layer 0.001 (V/A) m Voil Volume of oil 0.001 (V) m3 Qoil Volumetric flowrate of oil 0.001 (Q) m3/s ρoil Density of oil 0.92 g/cm3 FO Fraction of volume which is oil 0.001
Junction boxes
D Depth of junction box 0.9 m NI Number of aerators 1
Lift station
D Depth of lift station 1.5 m NI Number of aerators 1
Sump
D Depth of sump 5.9 m Weirs
dc Clarifier weir diameter 28.5 m h Weir height 1.8 m hc Clarifier weir height 0.1 m
47 SEWAGE AND WASTEWATER TREATMENT Version 2.1 published June 2011