emotional descriptors for map-based access to music … · emotional descriptors for map-based...
TRANSCRIPT
Emotional Descriptors for Map-based Access toMusic Libraries
Doris Baum, Andreas Rauber
Department of Software Technology and Interactive SystemsVienna University of Technology
Vienna, Austriahttp://www.ifs.tuwien.ac.at/mir
Abstract. Apart from genre- and artist-based organization, emotionsare one of the most frequently used characteristics to describe and thuspotentially organize music. Emotional descriptors may serve as addi-tional labels to access and interact with music libraries. This paper re-ports on a user study evaluating a range of emotional descriptors fromthe PANAS-X schedule for their usefulness to describe pieces of music.It further investigates their potential as labels for SOM-based maps formusic collections, analyzing the differences for labels agreed upon by alarger group of people versus strictly personalized labellings of maps dueto different interpretations by individual users.
1 Introduction
The most prominent and dominant ways of organizing and describing musiccollections usually follow genre- or artist-based structures. Yet, music is alsocommonly described as carrying special emotions, evoking specific feelings. Quitefrequently people listen to a wide range of musical styles, picking the specifictype of music at a given situation according to their mood. Thus, automaticallydescribing music according to emotional characteristics constitutes an interestingchallenge to assist in interfacing with large electronic music repositories in diversemanners.
Yet, emotions are neither easily agreed upon, nor consistently assigned tomusic by different people. Research in emotions has a long and diverse history,and in spite of considerable efforts, no unanimous set of emotions to describemusic has been agreed upon (a situation that emotions share with genres as classlabels for music or even text documents). Worse, and again similar to the moreconventional genre setting, emotions are not consistently assigned by differentpeople to the same piece of music. Even more strongly than with musical genres,the attribution of certain emotional characteristics to a piece of music dependstrongly on personal aspects, preferences, and - quite likely - on the emotionalsituation when the actual assignment task is being performed.
In spite of this highly volatile characteristic of emotions, they still seem tomerit closer inspection to identify, in how far they may be used to supportother, more conventional concepts in order to characterize music. We thus report
on a user study which addresses three different aspects of emotions for musiccharacterization, namely (1) in how far do people agree when assigning emotionsto a given set of pieces of music; (2) in how far are the similarities between piecesof music assigned to the same emotional categories reflected in the respectivefeature representation, i.e. do the features we use to describe music for taskslike genre-based organization also support an emotional organization; and (3)while different people may assign different emotional attributes to a given setof music, may these personal labels still be used to describe an organizationof music automatically using these emotional labels. Ten subjects took partin the study, labeling music from the benchmark collection created by GeorgeTzanetakis according to emotions from the PANAS-X schedule [17]. These werethen analyzed with respect to inter-indexer consistency, as well as interpreted aslabels mapped onto a self-organizing map (SOM) [6] trained on these pieces ofmusic using the SOMeJB music digital library system [10,12,2].
The remainder of this paper is structured as follows. Section 2 describes somerelated work in the fields of emotion analysis for music, and particularly its use inmusic information retrieval. The details of the user study performed are outlinedin Section 3, followed by an analysis of the results in Section 4. The main resultsas well as an outlook on ongoing work resulting from this study conclude thepaper in Section 5
2 Related Work
Conventionally, music collections are structured according to artist- and genre-style organizations, be it manually assigned such as in most current web shopsor on-line portals, or automatically created via classification systems. The latterare mostly oriented towards western-style music, but there is increasing interestin similar organizations specifically targeted to traditional native music styles,such as e.g. for a Korean music digital library [7].
The relation between music and emotions has been addressed psychologicallyas early as 1936 by Hevner [5], who also created an “adjective circle” with 8 emo-tion categories. Since then, a lot of studies have been devoted to the emotionalaspects of music, a substantial number of them summed up by Gabrielsson andJuslin [4]. However, as Gabrielsson and Juslin conclude, there still is no univer-sally accepted set of adjectives or other characterizations for classifying musicaccording to emotion. Thayer proposed one of the psychological models for emo-tion: Thayer’s Model of Mood [15]. Therein, emotion is not defined as groupsof adjectives but rather as a two-dimensional scale of Energy (calm - energetic)and Stress (happy - anxious).
The work of Tellegen, Watson, and Clark [14] led to the development of thePANAS-X schedule [17], which combines a dimensional scale of Positive andNegative Affect with adjective groups for a number of emotions.
Based on the vast pool of studies on emotional aspects of music, numer-ous groups have turned to different emotional models in the context of auto-mated analysis of music. A set of emotional interpretations of certain parts of

the Rhythm Pattern feature set is presented in [9]. The resulting Weather Chartswere used to describe, i.e. label areas of the Islands of Music maps, clusteringpieces of music according to perceived sound similarity. Apart from pure fre-quency spectra characteristics, such as low frequencies dominant, emotional as-pects such as non-aggressiveness, based on the ratio of low-frequency amplitudemodulations in the lower bark bands, were used to characterize certain areas onthe map.
Li and Ogihara [8] use thirteen adjective groups – Farnsworth’s [3] ten groups,which were in turn derived from Hevner’s, plus three their test user created – toclassify emotion in music with Support Vector Machines.
Yang and Lee [18] use the Positive and Negative Affect dimensions andthe emotion categories of the PANAS-X schedule [17] and the Russel [13] andTellegen-Watson-Clark [14] models. They extract 12 standard low-level featuresfrom the audio sources, generate 12 more features by genetic algorithms, andapply Support Vector Machine regression to them. Also, the lyrics of the songsare taken into account to disambiguate the emotion of the song.
Cunningham, Downie, and Bainbridge in [1] analyze the rather neglectedarea of dislike, even disgust, for music pieces. From 395 responses to a surveyon “the worst song ever”, they extracted, with a grounded theory approach,the most commonly named reasons why songs are “bad”. Among these are thequality of the lyrics or voice, the “earworm effect”, a dislike of the correspondingmusic video, perceived pretentiousness of the song, over-exposure to the music,and unpleasant personal experience associated with the piece.
3 User Study
3.1 Music Collection
The music used in this study was based on George Tzanetakis’ benchmark collec-tion [16]. It consists of mp3s with 30 second extracts of songs from ten differentgenres: Blues, Classical Music, Country, Disco, Hiphop, Jazz, Metal, Pop, Reg-gae and Rock. From the full benchmark collection of 1000 songs, 20 from everygenre were selected randomly to make up a collection of 200 songs. They were allnamed uniformly so as to not give any hints concerning the genre. The orderingof the songs was randomized when presenting them to the test subjects duringa form-based evaluation session to further prevent any bias.
3.2 Emotions
As previously discussed, there have been a number of studies on music and emo-tions, but no standard set of emotions seems to have been established. Thus, aset of emotions had to be selected, which should be founded in psychology andwould prove useful in the study. The emotional categories were taken from ThePANAS-X Manual for the Positive and Negative Affect Schedule - ExpandedForm by Clark and Watson [17]. This may later allow us to bring together ad-jective groups and two-dimensional scales, as a Positive/Negative Affect axis

Category Adjectives Category AdjectivesFear: scared / nervous Attentiveness: determined / alertHostility: angry / disgusted Shyness: timid / shyGuilt: guilty / ashamed Fatigue: tired / sleepySadness: sad / lonely Serenity: calm / relaxedJoviality: happy / cheerful Surprise: surprised / astonishedSelf-Assurance: proud / strong don’t know other /unassignable
Table 1. Adjectives assigned to emotional categories, based on [17]
together with an Arousal / Activation level can form a two-dimensional modelsimilar to Thayer’s. The categories in the the PANAS-X Manual are: fear, hostil-ity, guilt, sadness, joviality, self-assurance, attentiveness, shyness, fatigue, seren-ity and surprise. Each category was represented in the test questionnaires by twoadjectives listed in Table 1 which the subjects could associate with the music.
3.3 Study Set-up
Ten subjects took part in the study, all between 20 and 40 years old, 6 male and 4female, 9 of them with academic background (university students or graduates).Their musical expertise varies from amateurs to experts with theoretical back-ground knowledge, playing instruments, singing, or even writing their own music.The subjects also showed a rather diverse range of preferred musical styles. Ob-viously, the small number of participants does not allow a purely quantitativeevaluation, but requires a qualitative evaluation.
The study was conducted via a form-based on-line questionnaire. While datacollection via the Internet form was basically open to the general public, mostparticipants, and specifically the ones that the results in this paper are basedupon, were selected to participate in the study. The home-page contained anexplanation of the study for the subjects and provided a possibility to listen in-teractively to the individual pieces of music while ticking the check-boxes of theappropriate emotional characteristics. PHP scripts were used to automaticallygenerate an individual music rating questionnaire for each test subject. A dif-ferent randomized ordering of the songs was produced to prevent any potentialbias introduced by the sequence of the pieces of music as well as the duration ofthe evaluation session.
The results of the study were analyzed in several different manners. Firstof all, the variation of emotions assigned to the various titles was analyzed toobtain a feeling for inter-indexer consistency, i.e. in how far the test subjectsagreed with each other when assigning emotions to music.
Secondly, the pieces of music were clustered on a self-organizing map (SOM) [6]using Rhythm Pattern features [11]. It groups the music according to sound sim-ilarity as expressed by the feature space on a two-dimensional map display insuch a way that similar pieces of music are located next to each other. The re-sulting map was then labeled both with the respective genre labels as well as theemotional labels in order to see in how far consistent regions could be identified
EMOTION 50% 70%fear 4 0hostility 22 7guilt 0 0sadness 25 3joviality 41 18self-assurance 36 19attentiveness 9 3shyness 2 0fatigue 9 3serenity 45 19surprise 0 0
Table 2. Number of songs in the emotion categories, regarding all users, with50% and 70% agreement required
in both visualizations, which do not necessarily have to coincide. The PlaySOMsoftware [2] was used for the subsequent evaluations and visualizations.
4 Results
4.1 Variations in emotional labeling
Overall, users were surprisingly consistent in assigning emotional labels to piecesof music, with half of the users agreeing on at least one emotional category in76% of the rated songs. A list of how many songs were placed in each categoryis presented in Table 2. The first column lists the number of songs assigned toeach emotional category, where at least 50% of the study participants agreed onit as its most dominant emotional category. If one requires that at least 70%of the test users agree on an emotion, 35% (70) of the songs can be labeled, aslisted in column 2. It seems that in such a (relatively small) group, there alwayswill be some disagreement on the emotions connected with a song but that themajority of users can agree on at least one emotion for a high number of songs.
If one were to look at the emotion categories that received more than 50%of the votes (but did not require the emotion to be the highest rated of allemotions), 153 songs would be labeled, 63% (97 songs) of which in one category,33% (50 songs) in two categories and 4% (6 songs) in three categories.
In this case, the most highly correlated classes are: sadness/serenity, whichappear in 29% (16 times); hostility/self-assurance, which appear in 23% (13times); and joviality/self-assurance, which appear in 16% (9 times) of 56 songsin two or more classes together.
4.2 SOM for all users
To visualize the results of the study, a SOM [6] was trained on the RhythmPattern features [11] of the whole music collection (1000 songs). As only 200of the songs were rated in this study, the rest were tagged as “unknown”. Forthe “All Users” evaluation, the music pieces were put into one or more of the
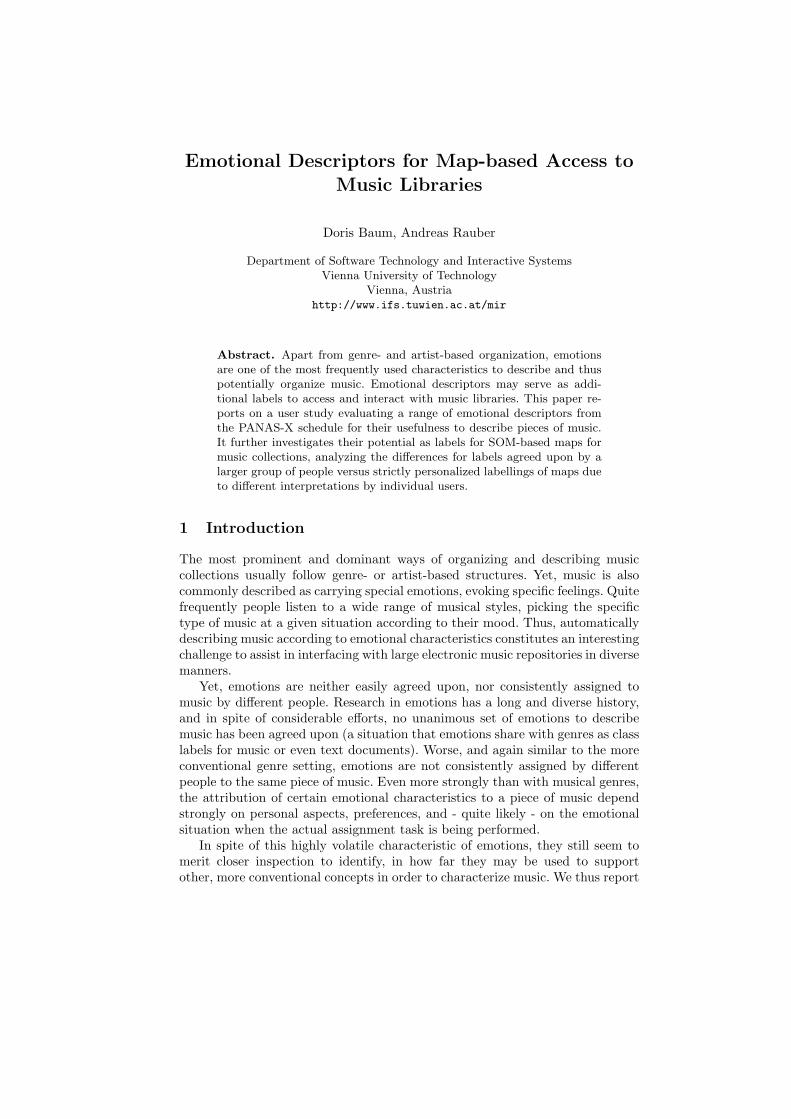
Fig. 1. Screen-shot of the SOM Viewer Software displaying serenity for all users.
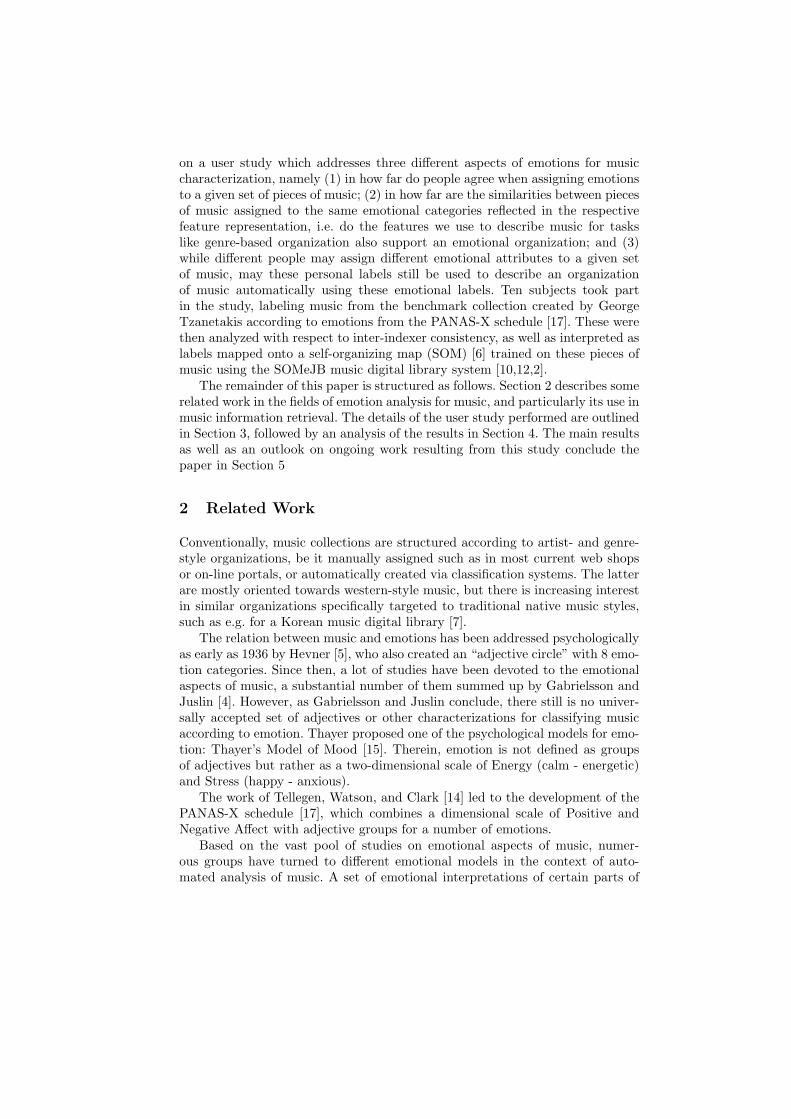
Fig. 2. Screen-shot of the SOM Viewer Software displaying joviality for all users.
emotion categories: A song was assigned the emotions most voted for if theemotions had at least 50% of the votes (that is 5 or more users agreed on therespective emotion). That is, if Song X was rated as “sad / lonely” by 5 users, as“scared / nervous” by 7 users, and as “timid / shy” by 7 users, it was assignedthe categories “fear” and “shyness”. Of the labeled songs, 92% (140 songs) wereassigned one category, and 8% (12 songs) were assigned two categories.
Of the 200 rated songs, those that were not put into at least one and at mosttwo classes were also tagged as “unknown” to keep the visualizations conciseand readable. In total, 152 songs were labeled with one or two emotions and 848as “unknown”. This shows that at least 50% of the users agreed on at least oneemotion category for more than 76% of the rated songs.
The SOM was then visualized with the SOMLib Viewer software, displayingfor each emotion class which SOM units had a song of that class mapped ontoit. Figure 1 provides an example visualization for the emotion class “serenity”for all users. It displays the SDH Visualization [9], revealing the sound similar-ity cluster structure as Islands of Music. On top of these the black pie chartsshow the fraction of songs on the respective unit with the class label serenity,

plus, obviously, the fraction of remaining unlabeled songs in the complete datacollection on those units. Quite a large number of songs (45) were assigned tothis emotional category. They end up sub-divided into a big cluster on the lowerborder and a smaller cluster on the upper central border of the visualization.
Figure 2 provides the same visualization for the “joviality” class. These songsconcentrate in two distinct areas, namely the upper left quarter and the right-hand border, indicating two loose clusters. For the remaining emotions, the lo-cations can be briefly summarized as follows:
Fear: There are very few (4) songs marked with this label. This does not warrantany conclusion on the distribution of “fear”.
Hostility: Songs that are put in the category “hostility” seem to concentratein the upper right region of the visualization and form small clusters.
Guilt: No songs were put into the “guilt” category by five or more users, sothere are no songs for “guilt” on the visualization.
Sadness: Songs in this category seem to concentrate in the lower right area,and a tight cluster stands out in the middle of the lower right quarter.
Self-Assurance: Songs in the category “self-assurance” are rather scattered,but their concentration is much higher in the upper half of the visualization.One can imagine loose clusters there.
Attentiveness: Songs in the category “attentiveness” almost exclusively ap-pear on the right-hand border.
Shyness: There were only two songs marked with this label. This does notwarrant any conclusion on the distribution of “shyness”.
Fatigue: Songs in this category are few, there seems to be a cluster in the lowerleft quarter and a few scattered ones in the right half.
Surprise: No songs were put into the “surprise” category by five or more users,so there are no songs for “surprise” on the visualization.
Figure 3 contains a (manually produced) overview on where one can detectclusters of emotions. It is just a rough sketch, rather than a density estimation,but it nonetheless permits some conclusions: The emotions cannot be separatedcompletely, but they overlap – as is to be expected if one takes into accountthat feelings mix and music carries a lot of emotional information. However, itseems that the calmer and quieter emotions come to lie in the lower half of thevisualization and the more aroused feelings can be found in the upper half – withthe exception of the “serenity” cluster in the upper half. On the right-hand edgethere seems to be an area of strong and cheerful music – the overlapping clustersof the right “joviality” cluster and the attentiveness area. The lower “serenity”cluster encompasses “fatigue” and “sadness”, and “self-assurance” overlaps withor encloses “joviality”, “serenity”, “hostility”, and “attentiveness”.
Thus it may indeed be possible to generally derive the emotion connotedwith a piece of music, though the classes, the classification procedure, and thedata collection probably could be improved.

Fig. 3. Rough map of the distribution of the emotions on the SOM SDH visu-alization.
(a) (b)
Fig. 4. Screen-shot of the SOM Viewer Software displaying serenity for (a)User A and (b) User B.
4.3 SOM for individual users
This section describes an interesting point found by comparing visualizationsof individual user ratings. It shows how much the appraisal of music can differbetween different people. Again, only songs in one or two emotion categorieswere used, thus, for the ten user results, between 195 and 78 songs have beenassigned an emotion class in the visualizations.
Emotional appraisal can differ through individual mood or character. Com-paring two users, called “User A” and “User B” here, User B has classified a lotmore songs as “sad / lonely” than User A: See Figure 4(b) for User B’s distribu-tion of 36 sad songs. User A on the other hand has only rated 3 songs as “sad /lonely”, which come to lie on the bottom border of the respective visualization.

In User B’s visualization, there seem to be one or two very tight “sadness”clusters in the lower half. These clusters cannot be found in User A’s “sadness”visualization, however, very similar clusters can be found in the bottom half ofthe “serenity” visualization, marked on Figure 4(a). It further shows, that thetwo users disagree on the labels they assign to music from the same cluster, withUser B calling that music “sad/lonely”, whereas User A attributes virtually thesame music to the serenity cluster (“calm/relaxed”). From this, one may get theimpression that User A is a “happier” person or was in a more positive moodwhen taking the test. This is supported by the fact that User A rated more thantwice as many songs (86) as “happy / cheerful” as User B (with 33 songs).
The emotional categories “sadness” and “serenity” are also the most highlycorrelated ones, hinting at them being related to each other. In the globaloverview map of all emotions for all users, the sadness cluster in the bottomright area constitutes a sub-cluster of the larger serenity cluster on the bottomhalf of the map.
5 Conclusions
We analyzed the potential of using emotional labels as descriptors for map-based access to music libraries. Emotional categories from the PANAS-X Manualwere used to label pieces of music, yielding a high consistency in labels assignedby different users. Furthermore, in a parallel process, the music was clusteredaccording to psycho-acoustic features extracted from the audio files using a SOM.It showed a high consistency with respect to the labels assigned, i.e. clusters ofdifferent emotions appear on the SOM visualization, showing sensible correlationbetween emotions for music in the various regions. Emotions perceived as relatedare also located in neighboring map regions. Thus, emotions may be derivable inan automatic way by training classifiers. We are currently investigating in howfar this automatic classification can achieve acceptable performance using a setof state of the art machine learning algorithms.
Still, the emotion categories from the PANAS-X Manual need to be re-thought and adapted according to the needs of the music listeners. For example,it might not be necessary to include categories such as “guilt” or “surprise” ifthe listeners do not use them or if different users do not agree on what is to beplaced in those classes.
Different users associate different feelings with a given piece of music, but forquite a lot of songs the majority of users agree on the connoted emotions. Also,not all emotions can automatically and reliably be derived from the featuresused, but for some emotions the features give a good idea of which emotionalcategories the song could be placed in.
Finally, with something so subjective as emotion, it might be more promisingto build individual emotion classifiers for each listener than to try and derive ageneral notion of what song belongs to which emotional class.
References
1. Sally Jo Cunningham, J. Stephen Downie, and David Bainbridge. ”the pain, thepain”: Modelling music information behavior and the songs we hate. In Proc. 6thIntl. Conf. on Music Information Retrieval (ISMIR 2005), pages 474–477, London,UK, September 11-15 2005.
2. M. Dittenbach, R. Neumayer, and A. Rauber. Playsom: An alternative approachto track selection and playlist generation in large music collections. In Proc. 1stIntl. Workshop on Audio-Visual Content and Information Visualization in DigitalLibraries (AVIVDiLib 2005), pages 226–235, Cortona, Italy, May 4-6 2005.
3. Paul R. Farnsworth. The social psychology of music. Dryden Press, 1958.4. Alf Gabrielsson and Patrik N. Juslin. Emotional expression in music. In Richard J.
Davidson, Klaus R. Scherer, and H. Hill Goldsmith, editors, Handbook of AffectiveSciences, pages 503–534. Oxford University Press, 2002.
5. Kate Hevner. Experimental studies of the elements of expression in music. InAmerican Journal of Psychology, volume 48, pages 246–268, 1936.
6. T. Kohonen. Self-Organizing Maps, volume 30 of Springer Series in InformationSciences. Springer, Berlin, 3rd edition, 2001.
7. Kang-Kue Lee and Kyu-Sik Park. Robust feature extraction for automatic clas-sification of Korean traditional music in digital library. In Proc. 8th Intl Conf.on Asian Digital Libraries (ICADL 2005), pages 167 – 170, Bangkok, Thailand,December 12-15 2005. Springer.
8. Tao Li and Mitsunori Ogihara. Detecting emotion in music. In Proceedings of the4th Intl. Conf. on Music Information Retrieval (ISMIR 2003), Baltimore, Mary-land (USA), October 26-30 2003.
9. E. Pampalk, A. Rauber, and D. Merkl. Content-based organization and visu-alization of music archives. In Proc. of ACM Multimedia 2002, pages 570–579,Juan-les-Pins, France, December 1-6 2002. ACM.
10. A. Rauber and M. Fruhwirth. Automatically analyzing and organizing musicarchives. In Proc. 5th Europ. Conf. on Research and Advanced Technology forDigital Libraries (ECDL 2001), Darmstadt, Germany, Sept. 4-8 2001. Springer.
11. A. Rauber, E. Pampalk, and D. Merkl. The SOM-enhanced JukeBox: Organizationand visualization of music collections based on perceptual models. Journal of NewMusic Research, 32(2):193–210, June 2003.
12. Andreas Rauber. Creation and exploration of musical information spaces. In Proc.Intl Conf on Digital Libraries (ICDL2004),pages 741–748. TERI, 2004.
13. James A. Russell. Core affect and the psychological construction of emotion. Psy-chological Review, 110(1):145–172, January 2003.
14. Auke Tellegen, David Watson, and Lee Anna Clark. On the dimensional andhierarchical structure of affect. Psychological Science, 10(4):297–303, July 1999.
15. Robert E. Thayer. The Biopsychology of Mood and Arousal. Oxford UniversityPress, 1989.
16. G. Tzanetakis, G. Essl, and P.R. Cook. Automatic musical genre classification ofaudio signals. In Proc. Intl Symp. on Music Information Retrieval (ISMIR), pages205–210, Bloomington, Indiana, October 15-17 2001.
17. David Watson and Lee Anna Clark. The PANAS-X Manual for the Positive andNegative Affect Schedule - Expanded Form. The University of Iowa, 1994. http:
//www.psychology.uiowa.edu/faculty/Clark/PANAS-X.pdf18. Dan Yang and WonSook Lee. Disambiguating music emotion using software agents.
In Proc. 5th Intl Conf. on Music Information Retrieval (ISMIR 2004), Barcelona,Spain, October 10-14 2004.