empirical evidence regarding regulatory burdens and …
TRANSCRIPT

Economic Studies of International Development Vol. 10-2
EMPIRICAL EVIDENCE REGARDING REGULATORY BURDENS AND GLOBAL INCOME PERFORMANCE
LICERIO, Enedina* FULLERTON, Thomas M. Jr.
CLARK, Don P. Abstract This paper analyzes the effects of regulatory burdens on per capita national income (GNIPC) and the potential increases in GNIPC that can result from deregulation. Previous research indicates that a rigid regulatory environment hampers income performance. The availability of more recent data and the addition of several new regulatory metrics by the World Bank now permit a broader analysis of regulatory burdens and income performance to be undertaken. Parameter estimates confirm the negative correlations earlier documented between GNIPC and red tape burdens. Model simulations are conducted to quantify potential impacts of deregulation and greater transparency on income performance. Results show that sizeable income gains, approximately $27.8 trillion, globally, can result from deregulation. Keywords Red Tape, International Income Performance JEL Category: F43, International Growth _______________________________________________________
* Enedina Licerio, Thomas M. Fullerton, Jr., Department of Economics and Finance, University of Texas at El Paso, El Paso, TX 79968-0543. Email [email protected]. Don P. Clark, Department of Economics, University of Tennessee Acknowledgements: Financial support for this research was provided by El Paso Electric Company, Hunt Companies of El Paso, Hunt Communities, JPMorgan Chase Bank of El Paso, a UTEP College of Business Administration Faculty Research Grant, and the James Foundation Scholarship Fund. Helpful comments were provided by Doyle Smith, Dennis Bixler-Marquez, Angel Molina, and session participants at the 2010 Oxford Business & Economics Conference. Econometric research assistance was provided by Emmanuel Villalobos and Teodulo Soto.

Economic Studies of International Development Vol. 10-2
6
1. Introduction Excessive regulatory burdens generally impede efficient business practices. Conversely, a moderate and stable regulatory environment tends to foster a more transparent and reliable business climate. In many countries, excessive regulations make the process of business formation lengthy and cumbersome. Under those conditions, employing workers, registering property, and trading goods with neighboring countries can be difficult and inefficient. However, not all regulations are road blocks to economic prosperity. For example, regulations are often put in place to protect investor relationships by providing accessibility to available credit information. Although regulations are frequently designed to foster growth, excessive levels of regulations can stall economic performance (World Bank, 2008). This research examines the effects of regulatory burdens on per capita national income (GNIPC) and the potential increases in that can result from deregulation.
The number of regulations required for a business to operate legally varies from country to country. The World Bank assembles data for 181 economies according the ease of doing business. At one extreme lies Singapore with low regulatory burdens and a GNIPC of $32,470 (measured in U.S. dollars). At the other end of the spectrum, the Democratic Republic of the Congo is ranked last with a much higher level of regulatory burdens and a GNIPC of only $140 (World Bank, 2008). These figures seemingly point toward a negative correlation between the amount of regulatory burdens and GNIPC.
Excessive levels of regulation are also associated with higher levels of corruption (Djankov, La Porta, Lopez-De-Silanes, and Shleifer, 2002). Corruption tends to hamper growth, independent of any potential impacts on investment, particularly for countries that exhibit bad governance and poor institutional quality (Méon and Sekkat, 2003). A reduction in the number of cumbersome regulatory procedures should spur economic growth. Previous research indicates that lower regulatory burdens translate into better income performance (Fullerton, De Leon, and Kelley, 2007).
Licerio, E., Fullerton,T.M.,Clark,D.P. Empirical Evidence of Regulatory Burdens
7
The World Bank measures regulatory practices in ten different areas affecting business practices. Quantitative indices in the areas of starting a business, issuing construction permits, employing workers, registering property, obtaining credit, protecting investors, paying taxes, trading across borders, enforcing contracts, and closing a business are reported, with data available for 181 countries. Previous research by Fullerton, De Leon, and Kelley (2007) examines the linkages between a subset of those regulatory categories and GNIPC in a smaller number of countries. The broader coverage provided for both countries and administrative areas will potentially help shed new light on this topic.
The following section provides a brief overview of related literature. The third section describes the data and methodology employed. The fourth section summarizes empirical results. Concluding remarks and suggestions for future research follow in the fifth section. 2. Literature Review
Previous research has examined numerous factors influencing economic growth. This section reviews several prior studies that look at the impacts that corruption, institutional environment, and productivity have on international economic performance. Relatively few studies analyze the effects that excess regulatory burdens have on international income performance.
Leff (1964) analyzes the potential impacts that corruption can have on economic development. Although corruption is often viewed as a deterrent to economic growth, arguments are presented that corruption can sometimes stimulate economic performance. In situations where governments have other priorities such as an increase in military power, policies toward economic growth are often neglected. Corruption, under those circumstances, can provide a direct incentive to encourage government officials to act on behalf of entrepreneurs seeking policies that promote development. By enabling entrepreneurs to influence the political environment, bribery can potentially increase the rate of investment. Since favors are

Economic Studies of International Development Vol. 10-2
8
provided to those able to offer the highest bribes, corruption may help promote competition and efficiency.
In contrast, Mauro (1995) finds that corruption restrains economic growth. By utilizing subjective indices on corruption, red tape, the efficiency of the judicial system, and political instability, the channels through which corruption and other institutional factors affect growth are identified. The use of subjective indices, as opposed to objective measures, helps capture the perception of political instability, which ultimately influences investment. An index of ethnolinguistic fractionalization is used to address the issue of endogeneity between institutions and economic performance. Bad institutions and corruption are found to affect economic growth by lowering the investment rate. The results run contrary to the idea that corruption may accelerate growth in economies where bureaucratic regulations are cumbersome.
In a similar study, Mo (2001) finds that corruption reduces economic growth through channels of investment, human capital, and political instability. Results indicate that political instability is the main channel through which corruption influences economic growth. A 1-percent increase in the corruption level is found to reduce growth by 0.72 percent, with political instability accounting for about half of the overall effect. The study highlights that corruption tends to be more widespread in countries where institutional inefficiencies are prevalent.
Djankov, La Porta, Lopez-De-Silanes, and Shleifer (2002) look at the implications that entry regulations have on a country. Data consist of the numbers of procedures, official time, and official costs to start-up businesses in 85 countries. Evidence obtained supports the public choice view that entry regulations benefit politicians and bureaucrats. The theory of public choice states that regulation of entry limits competition and raises incumbents’ profits. Countries that have high levels of entry regulations tend to have higher levels of corruption and larger unofficial, underground, off the books, and informal economies. Holding per capita income constant, a higher number of procedures leads to inferior social outcomes.
Licerio, E., Fullerton,T.M.,Clark,D.P. Empirical Evidence of Regulatory Burdens
9
Although neoclassical analysis predicts that poor countries grow more rapidly than wealthy countries, Keefer and Knack (1998) report that an inadequate institutional environment may cause these countries to grow more slowly. A deficient institutional environment may lead to a reduction in investment and reduce a country’s ability to absorb new technology from abroad. A country’s ability to catch up to wealthier nations is found to heavily depend on the institutional environment in which economic activity in poor countries operate (Fabro and Aixala, 2009).
Rodrick, Subramanian and Trebbi (2002) estimate the contributions of institutions, geography, and trade in determining income levels throughout the world. Geography is important in determining income levels because it is a determinant of climate, natural resource endowments, disease burden, and transportation costs. International trade is a major driver of productivity change and fosters economic convergence between rich and poor countries. The results further indicate that the quality of institutions is the major factor contributing to economic growth. Institutions play a key role in the protection of property rights and the rule of law. Countries with strong institutions, more open economies, and at a greater distance from the equator are found to have higher income levels. Similarly, Bhattacharyya (2004) finds that the role institutions play in explaining variations in per capita income trumps the role of both trade and geography. A better institutional structure reduces transaction costs and indirectly favors growth.
Regulatory policies have also been found to affect a country’s growth performance. Nicolleti, Scarpetta, and Lane (2003) investigate the links between growth performance and regulatory reform. Specifically, the study looks at how product market regulations affect multi-factor productivity (MFP) performance, which is growth’s main long-run determinant. MFP growth is found to be positively correlated with regulatory reform, where the strongest correlation is associated with reductions in administrative burdens that represent barriers to entry for businesses. Entry barriers are found to hinder the adoption of existing technology by reducing competitive pressures. Diverse regulatory policies among OECD nations explain dissimilar growth patterns exhibited by these nations.

Economic Studies of International Development Vol. 10-2
10
Overly strict product market regulations underlie the weak productivity performances of some European countries.
Dawson (2006) examines the relationship between regulation, investment, and long-run economic growth for a sample of 64 countries. Dawson utilizes regulatory data from Fraser Institute’s Economic Freedom of the World annual report, which includes indices on the credit market, labor market, and business regulations. The results suggest there is a negative relationship between regulation and economic growth. Regulation is found to be negatively related to private investment, but positively related to government investment. Countries with lower levels of business regulations tend to have higher levels of total factor productivity. Overall, reductions in the levels of regulations lead to a positive impact on economic growth, while uncertainty in the regulatory environment has negative impacts on growth.
Fullerton, De Leon, and Kelley (2007) use regulatory data from the World Bank to examine the effects that excess regulatory burdens have on per capita gross national income (GNIPC). The study finds that an increase in the number of regulatory procedures in registering a business leads to reductions in per capita income, while greater market transparency leads to increases in per capita income. Results indicate that lower regulatory requirements are associated with higher incomes. Model simulations reveal that deregulation can result in substantial income improvements.
The availability of more recent data and the addition of several new indices by the World Bank now permit a broader analysis of regulatory burdens and income performance to be undertaken. Among the new measures are indices for construction permits, paying taxes, and trade across international borders. More countries are also included in the new data sample (World Bank, 2008). Incorporation of these new variables and countries into the Fullerton, De Leon and Kelley (2007) framework may provide new insights to global income behavior. The current study also includes geographic dummy variables to allow for potential cultural and institutional factors associated with different regions of the world (Cole, Ohanian, Riascos, and Schmitz, 2005). Tests for endogeneity

Licerio, E., Fullerton,T.M.,Clark,D.P. Empirical Evidence of Regulatory Burdens
11
between regulatory practices and income levels are also included as part of the empirical analysis (Aixala and Fabro, 2007). 3. Data and Methodology Data are obtained from the World Bank (2008) report, Doing Business 2009. Data are reported for 181 economies in 2008 with complete information available for 149 countries. Regulatory data are divided into ten different categories: starting a business, hiring and firing workers, registering property, getting credit, protecting investors, enforcing contracts, closing a business, construction permits, paying taxes, and trading across borders. These categories contain a total of 35 different variables. Definitions for all of the variables are listed in Table 1. Dummy variables are used to classify the countries into six different regions and/or categories: Africa, Asia, Latin America and the Caribbean, Pacific Basin, Eastern Europe, and the OECD (Cole, Ohanian, Riascos, and Schmitz, 2005). Variables in the category of starting a business include the number of procedures required to start up a business; time recorded in days; cost as a percentage of the economy’s income per capita; and paid-in minimum capital. A procedure is defined by the World Bank (2008) as any interaction between the company’s founders and external parties. The time measure assumes each procedure takes at least 1 day, the business has had no prior contact with officials, and time spent gathering information is ignored. Procedures are considered to be complete only after the final documentation is received. Cost includes official fees and fees for legal services if those services are required by law. The minimum paid-in capital is the amount of capital that needs to be deposited in a bank prior to registration and 3 months following the incorporation. This measure is reported as a percentage of the country’s per capita income. Because they will reduce the rate of business formation, increases in any of these measures will likely result in reduction to GNIPC.
Data for hiring and firing employees are composed of five separate measures: rigidity of employment; difficulty of hiring index; rigidity of hours index; difficulty of firing index; and firing costs. The rigidity of employment index is a composite measure calculated

Economic Studies of International Development Vol. 10-2
12
by taking the simple average of the difficulty of hiring index, the rigidity of hours index, and the difficulty of firing index. Values of these indices range between 0 and 100, where higher values represent a more severe regulatory environment. Firing costs are expressed in weeks of salary. Included are measures notice requirements along with severance and penalty payments for terminating a redundant worker. Higher levels of regulation in this category are also expected to decrease GNIPC. The World Bank (2008) also reports the number of procedures, time, and cost for registering property in each country. The number of procedures includes all interactions necessary to transfer the property title to the buyer’s name. This includes all procedures required by law regardless of whether it is the responsibility of the buyer, seller, or a third party. Time is reported in days and measures the median time required to complete each procedure. The transaction is complete only after the buyer is able to use the property as collateral for a bank loan. Cost is recorded as a percentage of the property value and includes official costs only. Excess regulatory burdens for registering property are expected to negatively affect per capita income. Four variables make up the getting credit category: the strength of legal rights index, depth of credit information index, public registry coverage, and private bureau coverage. The strength of legal rights index evaluates the degree to which collateral and bankruptcy laws facilitate lending by protecting the rights of borrowers and lenders. The index ranges from 0 to 10, higher scores represent more effective collateral and bankruptcy laws. The depth of credit information index measures the scope, accessibility, and quality of credit information distributed by public and private credit registries. The public and private registry coverage variables report the number of individuals and firms listed in a public or private registry as a percentage of the adult population. These variables increase transparency and are likely to be positively correlated with income performance. The World Bank (2008) also provides data on investor protection. The extent of disclosure index ranges between 0 and 10, where higher values represent greater disclosure. The index

Licerio, E., Fullerton,T.M.,Clark,D.P. Empirical Evidence of Regulatory Burdens
13
measures the transparency of related-party transactions. Greater disclosure is likely to result in an increase in per capita income. Regulatory data on enforcing contracts are also collected by the World Bank (2008). This category includes three variables: the number of procedures, time, and cost. The number of procedures includes steps to file a case, steps for trial and judgment, and steps to execute the judgment. The time it takes to complete each procedure is measured in calendar days. Costs are composed of attorney fees, court costs, and enforcement costs. These are reported as a percentage of the claim; bribes are excluded. An increase in procedures, time, or costs is expected to create downward pressure on income performance. Closing a business can be costly in many economies. The World Bank (2008) collects data on time, costs, and the recovery rate of bankruptcy. The time for lenders to recover their money is reported in years. Cost data include court fees, lawyer’s fees, independent assessors’ fees, and accountant’s fees. Costs are measured as a percentage of the estate value. Prolonged time and high bankruptcy costs can depress per capita income. The recovery rate represents the present value of the debt recovered; it is recorded as cents on the dollar. A positive relationship between the recovery rate and GNIPC is hypothesized. Data on construction permits encompass three different measures: number of procedures, time, and cost. The assumptions for these variables are analogous to data for the variables in the enforcing contracts category. Similarly, an increase for any of these variables is expected to result in a decrease in per capita income. Tax data are also available from the World Bank (2008). The World Banks collects data on the number of payments per year, total time, and average tax rate. The time variable is expressed as hours per year and measures the time it takes to prepare, file, and pay corporate income taxes, sales taxes, and labor taxes. The average tax rate is reported as a percentage of gross profit. Countries with rigid tax systems are likely to have a lower per capita GNI. Trading across borders includes six components. Data are available for regulations restraining both exports and imports. This

Economic Studies of International Development Vol. 10-2
14
information covers the number of documents necessary to export/import, the time it take to export/import, as well as the cost to export/import a 20-foot container. The cost is reported is US dollars. Restraints to trade are expected to suppress income performance.
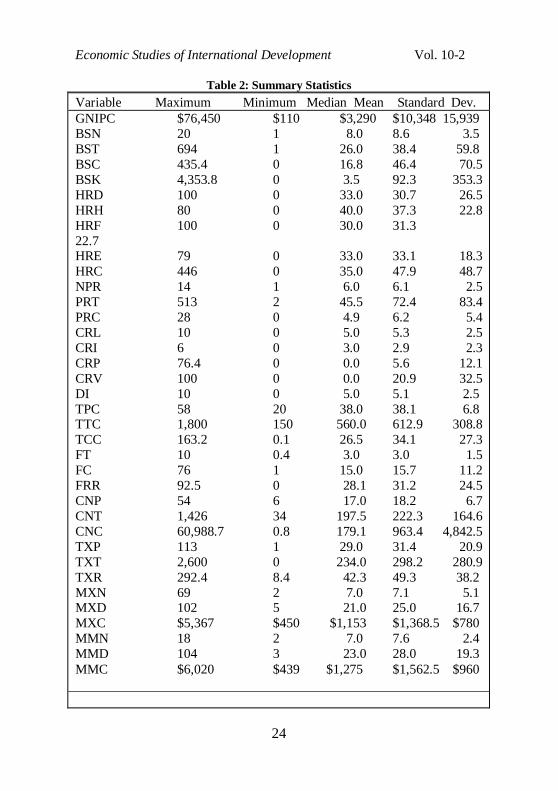
Summary statistics for the data series are reported in Table 2. Pronounced variability is observed for many variables in the sample. For example, GNIPC ranges from $110 per year in Burundi to $76,450 in Norway. Although the mean GNIPC for the sample is $10,348, fully 50 percent of the economies have GNIPC levels of $3,290 or less. For BSN, the number of procedures required to start a new business, the minimum is 1 in both Canada and New Zealand, while the maximum is 20 in the coastal African country of Equatorial Guinea. Globally, the median number of procedures needed to start a business is 8 and the mean is 8.6.
For firing costs measured in weeks of salary, HRC, the minimum is 0 weeks in ten different economies. The maximum for HRC is a whopping 446 weeks in Zimbabwe. The international median for that variable is 35 weeks, or roughly two-thirds of a year. NPR, the number of procedures required to register property, has a minimum of 1 in Norway and a maximum of 14 in Algeria, Brazil, and Nigeria. The mean and median values for this variable are almost identical at 6 and 6.1, respectively. In the case of CRI, the depth of credit information index, the range is from 0 to 6 and the median is 3. TPC, the number of procedures necessary to enforce contracts, ranges from a minimum of 20 in Ireland to a maximum of 58 in Brunei near Malaysia. The median value for that variable is 38 procedures. In the case of FT, the number of years required to close a business, the minimum is 0.4 years in Ireland. That is in contrast to India, where a full decade is needed to officially complete the closure of a firm. The median and average values for FT are both 3. The number of procedures necessary to obtain a construction permit, CNP, is only 6 in Denmark. In its regional Baltic Sea neighbor Russia, the number is 54, while the global median is 17 and the mean is 18.2. For TXP, the number of tax payments per year, the smallest number is 1 in both Qatar and the Maldives. The highest

Licerio, E., Fullerton,T.M.,Clark,D.P. Empirical Evidence of Regulatory Burdens
15
TXP number is 113 in Romania, while the number in nearby Belarus is 112. The international median is 29 and the average is 31.4. The number of documents required for exports, MXN, ranges from only 2 in France to 69 in Timor-Leste. The sample median and mean are 7 and 7.1, respectively. The range for the number of documents needed for imports, MMN, is smaller. The lowest MMN number is 2, again, in France. The maximum, 18, occurs in the Central African Republic. The median value for this variable is 7, while the mean is 7.6. To test the various hypotheses noted above, per capita gross national income is modeled as a function of regulatory burdens. The specification for GNIPC is: (1) GNIPCi = b0 + ∑kbkxki + ∑kbkDVi + ei , where i = 1, 2, 3,…,149 for each of the countries with complete information in the sample; x is the vector of explanatory variables; k = 1, 2, 3,…,K for the independent variables included in the specification; DV represents the region dummy variable; and ei represents the error term. Due to the range of country sizes, heteroscedasticity may be present. That possibility will be tested using the White (1980) procedure. Empirical results are summarized in the next section. 4. Empirical Results and Policy Implications
Results obtained largely corroborate those reported by Fullerton, De Leon, and Kelley (2007). As in that study, many of the variables listed in Tables 1 and 2 are highly correlated with each other. Not all of them can be included in the same equation specification without encountering high degrees of multicollinearity. To circumvent this problem, combinations of different variables from the various categories shown in Table 1 were included in the equations that were estimated. Table 3 shows the results of the White (1980) heteroscedasticity test. The null hypothesis of homoscedasticity is rejected and the error covariance matrix is corrected using the White (1980) procedure. Empirical results for the selected, representative, version of Equation 1 are reported in Table 4. Additional versions and estimation outcomes of Equation 1

Economic Studies of International Development Vol. 10-2
16
are available from the authors. Data utilized in the study are also available from the authors.
The equation summarized in Table 4 is tested for endogeneity using the Davidson and MacKinnon (1989) artificial regression procedure. The results indicate that the least squares parameter estimates are consistent and simultaneity is not present in the equation (Table 5). The Greensburg diversity index is used as the instrumental variable to test for endogeniety (Lewis, 2009). It measures the probability that any two people selected at random belong to the same ethnolinguistic group. This index is similar to the instrumental variable used by Mauro (1995). That study employs an ethnolinguistic fractionalization index from the Atlas Narodov Mira (1964). Linguistic diversity is an exogenous variable that is not directly related to economic variables, but it can, however, affect a country’s institutional efficiency. For the purpose of this study, the Greensburg index is selected because it utilizes more recent data and covers a larger range of countries than does the ethnolinguistic fractionalization index used by Mauro (1995). For the specification shown in Table 4, all of the parameter estimates exhibit the hypothesized signs. As with Fullerton, De Leon, and Kelley (2007), multicollinearity is present and several parameter estimates do not satisfy the 5-percent criterion. The F-statistic is consistently significant across all specifications estimated. The adjusted coefficient of determination, 0.66, is relatively high for cross-sectional data. Experimentation with different model specifications can occasionally result in some coefficient estimates that exhibit arithmetic signs contrary to those hypothesized. The outcomes shown in Table 4 are, however, representative of those obtained using different subsets of the variables available in the sample as a whole. The results largely confirm the hypothesis that excessive regulatory burdens are negatively correlated with GNIPC. As indicated in Table 4, increasing the number of procedures required to start-up a business, BSN, by one additional requirement leads to a decrease in per capita income of $295. Likewise, increasing the cost of firing a worker, HRC, by one week of salary reduces per capita GNIPC by $29. Increasing the number of procedures required to

Licerio, E., Fullerton,T.M.,Clark,D.P. Empirical Evidence of Regulatory Burdens
17
register property, NPR, by one results in a decrease in per capita income of $167. A one unit increase in the depth of credit information index, CRI, increases GNIPC by $95. Increasing the number of procedures to enforce contracts, TPC, or obtain a construction permit, CNP, by one leads to reductions in per capita income of $253, and $33, respectively. For each additional year required to close a business, FT, GNIPC decreases by $998. Tax burdens also have a negative impact on per capita income. Table 4 shows that increasing the number of tax payments, TXP, required per year reduces per capita income by $114. Rigid international trade regulations also hamper a country’s income performance. Increasing the number of documents required to export, MXN, by one lowers per capita income by $795. Similarly, the addition of one document to the requirements for merchandise imports, MMN, leads to an income reduction of $716. The regional qualitative variables listed in Table 1 are also included in the analysis. The OECD dummy variable is excluded to avoid matrix singularity. As expected, the coefficients for all of the variables are negative and statistically significant (Cole, Ohanian, Riascos, and Schmitz, 2005). Model simulations are conducted to quantitatively measure the potential income gains associated with deregulation and greater market transparency. The GNIPC impacts that result from countries deregulating each of the variables included in Table 4 to the corresponding world averages. The per capita results are also multiplied by the country’s population in order to calculate aggregate potential income gains. Model simulations show that substantial income gains can result if the countries whose 2008 regulatory profiles lag behind the prevailing world regulatory practices move to the global averages. As shown in Table 6, the global per capita income gain that results from deregulation is about $4,281, while aggregate gains are approximately $27,832 billion. This represents an approximate 53 percent increase relative to the aggregate 2008 world gross national income of almost $52,245 billion. Several countries in the sample exhibit no gains by moving to the world average. For these countries

Economic Studies of International Development Vol. 10-2
18
moving to the world average signifies increasing the level of regulatory burdens and this would result in per capita income losses. These countries include the United States, United Kingdom, Netherlands, and Singapore, among others. A large percentage of these countries are members of the OECD. These countries impose generally lower regulatory burdens as measured by the various independent variables used in the specification shown in Table 4. Given that, any implied income losses that would result by increasing regulatory burdens are not calculated. With the exception of 11 countries listed in Table 6.A, African economies benefit substantially from lower regulatory burdens. The results indicate that Zimbabwe would experience a per capita income gain of nearly $15,591 if it were to deregulate to the global average. The estimated aggregate income gain for all African countries is $3,435 billion, or about $3,641 in per capita income. Similarly, Asian countries experience significant income gains as a result of deregulation (Table 6.B). Aggregate income gains for all Asian countries are approximately $19,926 billion. Among the Asian countries, India’s per capita gains supersede the gains of other Asian economies. India’s implied per capita income gains from eliminating red tape are $15,287. While the gains in other regions are not as sizeable as those for African and Asian countries, Latin American, Caribbean, Pacific Basin, and European countries can also benefit from deregulation. The implied aggregate gains are $1,411 billion for Latin American and Caribbean countries, $1,845 billion for Pacific Basin countries, and $729 billion for European countries. The approximate per capita income gains are $2,516, $4,948, and $2,480, respectively. Timor-Leste, located in the Pacific Basin, is the country that exhibits the greatest per capita income gain. GNIPC for this country is estimated to increase by $46,152 if the various levels of regulatory requirements are reduced to their respective global means. The parameter estimates and model simulations in this study largely confirm those reported by Fullerton, De Leon, and Kelley, (2007). This effort benefits from a larger international sample, more recent data measurements, and international trade regulatory data not previously available. Outcomes obtained emphasize that

Licerio, E., Fullerton,T.M.,Clark,D.P. Empirical Evidence of Regulatory Burdens
19
considerable income gains are likely to result from less rigid regulatory systems and more flexible trading regimes. 5. Conclusion Excessive red tape has been reported to have a negative impact on a national income performance (Nicoletti, Scarpetta, and Lane, 2003; Fullerton, De Leon, and Kelley, 2007). The availability of more recent data, the addition of new indices by the World Bank, and a larger sample size now permits a broader analysis of regulatory burdens and income performance. After including construction permit, tax, and international trade data into the analysis, the results reaffirm that reducing regulatory burdens leads to increases in per capita incomes. In addition, regional dummy variables are included to account for cultural and institutional factors that influence economic performance (Assane and Abbas, 2003; Cole, Ohanian, Riascos, and Schmitz, 2005). Data utilized in the analysis are from the World Bank (2008) report, Doing Business 2009. Complete data are available for 149 of the 181 countries in the sample. Equation estimates are corrected for heteroscedasticity using the White (1980) procedure. The specification reported in Table 4 is tested for endogeneity using the Davidson and MacKinnon (1989) test. The null hypothesis of consistent least squares estimates is not rejected when the Greensburg diversity index is used as the instrumental variable. The combination of a statistically significant F-statistic and relatively low computed t-statistics suggest that multicollinearity is present in the sample.
Simulations are conducted to quantify the potential income gains associated with deregulation and greater market transparency. Model simulations are calculated by raising values of the explanatory variables of interest to the corresponding world average. Simulation results imply that global aggregate gains are approximately $27,832 billion. Gains in per capita incomes ranged from $94 for Bhutan to $46,152 for Timor-Leste. With more than 6.5 billion people, the region with the greatest potential gains in aggregate income is Asia. Aggregate gains for all Asian countries included in the sample are

Economic Studies of International Development Vol. 10-2
20
approximately $19,926 billion. These results coincide with previous studies that have indicated that improvements in the institutional environment increase a country’s economic performance.
Overall, the results indicate that substantial income gains can result by reducing the level of regulatory burdens in place and improving market transparency. Excessive regulatory burdens hinder efficient business practices resulting in poor income performances. Lower income countries should consider implementing policies that reduce regulatory burdens and foster economic growth. Higher income countries should be careful to maintain regulatory frameworks that permit their economies to operate efficiently. References Aixala, Jose and Gema Fabro, 2007, “A Model of Growth
Augmented with Institutions,” Economic Affairs 27 (3), 71-74.
Assane, Djeto, and Abbas Grammy, 2003, “Institutional Framework and Economic Development: International Evidence,” Applied Economics 35, 1811-1817.
Bhattacharyya, Sambit, 2004, “Deep Determinants of Economic Growth,” Applied Economics Letters 11, 587-590.
Cole, Harold L., Lee E. Ohanian, Alvaro Riascos, and James A. Schmitz Jr., 2005, “Latin America in the Rearview Mirror,” Journal of Monetary Economics 52, 69-107
Davidson, Russell and James G. MacKinnon, 1989, “Testing for Consistency using Artificial Regressions,” Econometric Theory 5, 363-384
Dawson, John W., “Regulation, Investment, and Growth across Countries,” Cato Journal 26, 489-509.
Department of Geodesy and Cartography of the State Geolofiscal Committee of the USSR, 1964, Atlas Narodov Mira, Moscow, USSR.
Djankov, Simeon, Rafael La Porta, Florencio Lopez-de-Silanes, and Andrei Shleifer, 2002, “Regulation of Entry,” Quarterly Journal of Economics 117, 1-37.

Licerio, E., Fullerton,T.M.,Clark,D.P. Empirical Evidence of Regulatory Burdens
21
Fabro, Gema, and Jose Aixala, 2009, “Economic Growth and Institutional Quality: Global and Income-Level Analyses,” Journal of Economic Issues 43, 997-1023.
Fullerton, Thomas M., Marycruz De Leon, and Brian W. Kelley, 2007, “Regulatory Burdens and International Income Pe rformance,” Applied Econometrics & International Development 7, 5-14.
Keefer, Philip, and Stephen Knack, 1997, “Why Don’t Poor Countries Catch Up? A Cross National Test of the Institutional Explanation,” Economic Inquiry 35, 590-602
Leff, Nathaniel, 1964, “Economic Development through Bureaucratic Corruption,” American Behavioral Scientist (November), 8-14.
Lewis, M. Paul (ed.), 2009, Ethonologue: Languages of the Worlds, Sixteenth edition, Dallas, TX: SIL International. Online version: http://www.ethnologue.com.
Mauro, Paolo, 1995, “Corruption and Growth,” Quarterly Journal of Economics 110, 681-712.
Méon, Pierre-Guillaume, and Khalid Sekkat, 2005, “Does Corruption Grease or Sand the Wheels of Growth?” Public Choice 122, 69-97.
Mo, P. Hung, 2001, “Corruption and Economic Growth,” Journal of Comparative Economics 29, 66-79.
Nicoletti, Giuseppe, Stefano Scarpetta, and Philip R. Lane, 2003, “Regulation, Productivity, and Growth – OECD Evidence,” Economic Policy 18, 9-72.
Rodrik, Dani, Arvind Subramanian, and Francesco Trebbi, 2004, “Institutions Rule: The Primacy of Institutions Over Geography and Integration in Economic Development,” Journal of Economic Growth 9, 131-165
White, Halbert, 1980, “A Heteroskedasticity-Consistent Covariance Matrix Estimator and a Direct Test for Heteroskedasticity,” Econometrica 48, 817-838.
World Bank, 2008, Doing Business in 2009, International Finance Corporation: Washington, DC.

Economic Studies of International Development Vol. 10-2
22
Table 1: Mnemonics and Definitions Category Variable Name Definition Income GNI Gross National Income GNIPC Gross National Income Per Capita Starting a Business BSN Number of procedures BST Time, number of days BSC Cost, percent of income per capita BSK Minimum capital, percent of income per capita Hiring and HRD Difficulty of hiring index Firing Workers HRH Rigidity of hours index HRF Difficulty of firing index HRC Firing costs, weeks of salary Registering Property NPR Number of procedures PRT Time, number of days PRC Cost, percent of property value Getting Credit CRL Strength of legal rights index CRI Depth of credit information index CRP Public registry coverage, percent of adults CRV Private Bureau coverage, percentage of adults Protecting investors DI Extent of disclosure index Enforcing Contracts TPC Number of procedures TTC Time, number of days TCC Costs, percentage of claim Closing a Business FT Time, number of years FC Cost, percentage of estate FRR Recovery rate, cents on the dollar Construction permits CNP Number of procedures (Licenses) CNT Time, number of days CNC Cost, percentage of income per capita Paying Taxes TXP Payment, number per year TXT Time, hours per year TXR Total tax payable, percentage of gross profit Trading across Borders MXN Number of documents to export MXD Time to export, number of days MXC Cost to export, per container MMN Number of documents to import MMD Time to import, number of days MMC Cost to import

Licerio, E., Fullerton,T.M.,Clark,D.P. Empirical Evidence of Regulatory Burdens
23
Table 1 (continued): Mnemonics and Definitions Dummy Variables
LATIN 1 if country is located in Latin America and the Caribbean, 0 otherwise PACBASIN 1 if country is located in the Pacific Basin, 0 otherwise AFRICA equal to 1 if country is located in Africa, 0 otherwise OECD equal to 1 if country belongs to the OECD, 0 otherwise EUROPE equal to 1 if country is located in Eastern Europe, 0 otherwise ASIA equal to 1 if country is located in Asia, 0 otherwise
Economic Studies of International Development Vol. 10-2
24
Table 2: Summary Statistics Variable Maximum Minimum Median Mean Standard Dev. GNIPC $76,450 $110 $3,290 $10,348 15,939 BSN 20 1 8.0 8.6 3.5 BST 694 1 26.0 38.4 59.8 BSC 435.4 0 16.8 46.4 70.5 BSK 4,353.8 0 3.5 92.3 353.3 HRD 100 0 33.0 30.7 26.5 HRH 80 0 40.0 37.3 22.8 HRF 100 0 30.0 31.3 22.7 HRE 79 0 33.0 33.1 18.3 HRC 446 0 35.0 47.9 48.7 NPR 14 1 6.0 6.1 2.5 PRT 513 2 45.5 72.4 83.4 PRC 28 0 4.9 6.2 5.4 CRL 10 0 5.0 5.3 2.5 CRI 6 0 3.0 2.9 2.3 CRP 76.4 0 0.0 5.6 12.1 CRV 100 0 0.0 20.9 32.5 DI 10 0 5.0 5.1 2.5 TPC 58 20 38.0 38.1 6.8 TTC 1,800 150 560.0 612.9 308.8 TCC 163.2 0.1 26.5 34.1 27.3 FT 10 0.4 3.0 3.0 1.5 FC 76 1 15.0 15.7 11.2 FRR 92.5 0 28.1 31.2 24.5 CNP 54 6 17.0 18.2 6.7 CNT 1,426 34 197.5 222.3 164.6 CNC 60,988.7 0.8 179.1 963.4 4,842.5 TXP 113 1 29.0 31.4 20.9 TXT 2,600 0 234.0 298.2 280.9 TXR 292.4 8.4 42.3 49.3 38.2 MXN 69 2 7.0 7.1 5.1 MXD 102 5 21.0 25.0 16.7 MXC $5,367 $450 $1,153 $1,368.5 $780 MMN 18 2 7.0 7.6 2.4 MMD 104 3 23.0 28.0 19.3 MMC $6,020 $439 $1,275 $1,562.5 $960

Licerio, E., Fullerton,T.M.,Clark,D.P. Empirical Evidence of Regulatory Burdens
25
Table 3: White Procedure Heteroscedasticity Test without Cross Terms
Computed Test Statistic 149*R2 Chi-Square 33.410 Probability 0.0041 Notes:Complete data are available for 149 of the 181 countries in the World Bank data sample. The homoscedasticity null hypothesis is rejected.
Table 4: Parameter Estimation Results Dependent Variable: GNIPC White Heteroscedasticity-Consistent Standard Errors & Covariance Variable Coefficient Std. Error t-Statistic Probability Constant 58,975.67 8157.409 7.230 0.000 BSN -294.76 253.681 -1.162 0.247 HRC -29.43 15.459 -1.904 0.059 NPR -167.00 427.754 -0.390 0.697 CRI 95.41 593.477 0.161 0.873 TPC -256.16 177.613 -1.442 0.152 FT -977.64 534.164 -1.830 0.070 CNP -32.77 87.592 -0.374 0.709 TXP -113.57 39.587 -2.869 0.005 MXN -794.94 492.291 -1.615 0.109 MMN -716.35 501.468 -1.429 0.156 LATIN -19,789.10 3452.211 -5.732 0.000 PACBASIN -22,027.92 4210.930 -5.231 0.000 AFRICA -19,693.91 4183.280 -4.708 0.000

Economic Studies of International Development Vol. 10-2
26
ASIA -19,654.35 3591.741 -5.472 0.000 EUROPE -18,403.31 3402.240 -5.409 0.000 R-squared 0.694 Dependent Variable Mean 11694.28 Adjusted R-Squared 0.660 Dep. Var. Std. Deviation 16989.07 Std. Error of Regression 9913.202 F-Statistic 20.112 Sum of Squared Residuals 1.31E+10 F-Statistic Probability 0.000 Log Likelihood -1574.001 Observations 149
Table 5: Artificial Regression Endogeneity Test Results Ho: Least Squares Parameter Estimates are Consistent. Ha: Endogeneity is present N t-value Critical t-value p-value Decision BSN 149 0.698 1.96 0.4864 Fail HRC 149 0.698 1.96 0.4864 Fail NPR 149 0.698 1.96 0.4864 Fail CRI 149 -0.698 1.96 0.4864 Fail TPC 149 0.698 1.96 0.4864 Fail FT 149 0.698 1.96 0.4864 Fail CNP 149 -0.698 1.96 0.4864 Fail TXP 149 0.698 1.96 0.4864 Fail MXN 149 0.698 1.96 0.4864 Fail MMN 149 -0.698 1.96 0.4864 Fail Note: Fail: Fail to reject null.

Licerio, E., Fullerton,T.M.,Clark,D.P. Empirical Evidence of Regulatory Burdens
27
Table 6.A: Simulated Income Gains for African Countries
Per Capita
Gain Population (millions)
Aggregate Income Gain
(billion $) Algeria $5,997.28 33.90 203.31 Angola $9,947.82 17.00 169.11
Bahrain NC 0.80 NC
Benin $3,032.08 9.00 27.29
Botswana NC 1.90 NC Burkina Faso $6,346.39 14.80 93.93
Burundi $1,976.26 8.50 16.80
Cameroon $4,974.24 18.50 92.02 Cape Verde NC 0.50 NC
Central African Rep. $13,372.08 4.30 57.50
Chad $3,064.07 10.80 33.09
Comoros $3,359.58 0.60 2.02 Congo, Dem. Rep. of $6,428.98 62.40 401.17
Congo, Republic of $11,178.53 3.80 42.48
Côte d'Ivoire $5,831.17 19.30 112.54 Djibouti $439.21 0.80 0.35
Egypt $1,838.98 75.50 138.84
Equatorial Guinea $4,610.18 0.50 2.31
Eritrea $3,718.44 4.80 17.85 Ethiopia $249.31 79.10 19.72 Gabon $1,808.77 1.30 2.35 Gambia NC 1.70 NC Ghana $1,277.33 23.50 30.02 Guinea $8,892.83 9.40 83.59 Guinea-Bissau $1,615.28 1.70 2.75 Kenya $6,764.89 37.50 253.68

Economic Studies of International Development Vol. 10-2
28
Table 6.A (continued): Simulated Income Gains for African Countries
Per Capita Gain
Population (millions)
Aggregate Income Gain (billion $)
Lesotho NC 2.00 NC Liberia $6,541.59 3.80 24.86 Madagascar NC 19.70 NC Malawi $6,621.33 13.90 92.04 Mali $7,834.70 12.30 96.37
Mauritania $12,851.7
8 3.10 39.84 Mauritius NC 1.30 NC Morocco $1,302.39 30.90 40.24 Mozambique $6,050.92 21.40 129.49 Namibia $1,737.03 2.10 3.65 Niger $5,923.97 14.20 84.12 Nigeria $4,424.91 148.00 654.89 Rwanda NC 9.70 NC Sao Tome and Principe $2,446.14 0.20 0.49 Senegal $334.75 12.40 4.15 Seychelles NC 0.10 NC Sierra Leone $3,510.93 5.80 20.36 South Africa NC 47.60 NC Sudan $2,809.22 38.60 108.44 Swaziland $5,511.87 1.10 6.06 Tanzania $716.11 40.40 28.93 Togo $3,428.12 6.60 22.63 Tunisia NC 10.20 NC Uganda $1,037.40 30.90 32.06 Zambia $2,940.22 11.90 34.99
Zimbabwe $15,590.5
0 13.40 208.91 Total $3,640.93 943.50 3,435.22 World Total $4,281.05 6,501.30 27,832.36

Licerio, E., Fullerton,T.M.,Clark,D.P. Empirical Evidence of Regulatory Burdens
29
Table 6.B: Simulated Income Gains for Asian Countries
Per Capita
Gain Population (millions)
Aggregate Income Gain
(billion $) Afghanistan $825.85 24.80 20.48 Armenia $3,132.14 3.00 9.40 Azerbaijan $3,398.69 8.60 29.23 Bangladesh $1,376.73 158.60 218.35 Bhutan $93.87 0.70 0.07 Cambodia $4,035.37 14.40 58.11 China,P.R.: Mainland NC 1320.00 NC Georgia NC 4.40 NC Hong Kong, China NC 6.90 NC India $15,286.73 1123.30 17,171.58 Iran, I.R. of $4,637.05 71.00 329.23 Kazakhstan $3,520.61 15.50 54.57 Kyrgyz Republic $12,213.26 5.20 63.51 Lao People's Dem.Rep $1,495.32 5.90 8.82 Maldives NC 0.30 NC Mongolia NC 2.60 NC Nepal $5,921.79 28.10 166.40 Pakistan $7,254.88 162.40 1178.19 Singapore NC 4.60 NC Sri Lanka $4,657.17 19.90 92.68 Tajikistan $6,768.57 6.70 45.35 Thailand NC 63.80 NC Turkey NC 73.90 NC Uzbekistan $12,783.30 26.90 343.87 Vietnam $1,597.76 85.10 135.97 Total $6,156.40 3,236.60 19,925.80 World Total $4,281.05 6,501.30 27,832.36

Economic Studies of International Development Vol. 10-2
30
Table 6.C: Simulated Income Gains for Latin American & Caribbean Countries
Per Capita Gain
Population (millions)
Aggregate Income Gain
(billion $) Antigua & Barbuda 1,759.70 0.10 0.18 Argentina 897.77 39.50 35.46 Bahamas 376.28 0.30 0.11 Belize 853.41 0.30 0.26 Bolivia 962.17 9.50 9.14 Brazil 4,256.86 191.60 815.61 Chile NC 16.60 NC Colombia NC 46.10 NC Costa Rica 3,043.35 4.50 13.70 Dominica NC 0.10 NC Dominican Republic NC 9.80 NC Ecuador 5,347.54 13.30 71.12 El Salvador 4,037.35 6.90 27.86 Grenada NC 0.10 NC Guatemala 5,059.96 13.30 67.30 Guyana 30.49 0.70 0.02 Haiti 5,518.53 9.60 52.98 Honduras 7,821.76 7.10 55.53 Jamaica NC 2.70 NC Mexico NC 105.30 NC Nicaragua NC 5.60 NC Panama NC 3.30 NC Paraguay 5,434.45 6.10 33.15 Peru NC 27.90 NC Puerto Rico NC 3.90 NC St. Kitts and Nevis NC 0.00 NC St. Lucia NC 0.20 NC St. Vincent and Grenadines NC 0.10 NC Suriname 2,538.21 0.50 1.27 Trinidad and Tobago NC 1.30 NC Uruguay 7,269.99 3.30 23.99 Venezuela, Rep. Bol. 5,859.11 27.50 161.13 Total $2,457.01 557.10 1,368.80 World Total $4,281.05 6,501.30 27,832.36

Licerio, E., Fullerton,T.M.,Clark,D.P. Empirical Evidence of Regulatory Burdens
31
Table 6.D: Simulated Income Gains for Pacific Basin Countries
Per Capita
Gain Population (millions)
Aggregate Income
Gain (billion $)
Brunei $1,895.15 0.40 0.76 Fiji $4,961.87 0.80 3.97 Indonesia $4,413.36 225.60 995.65 Kiribati NC 0.10 NC Malaysia NC 26.50 NC Marshall Island NC 0.10 NC Micronesia Fed States NC 0.10 NC Palau NC 0.00 NC Papua New Guinea $2,018.09 6.30 12.71 Philippines $8,764.63 87.90 770.41 Samoa $189.39 0.20 0.04 Solomon Islands NC 0.50 NC Taiwan $448.86 22.90 10.28 Timor-Leste $46,152.36 1.10 50.77 Tonga NC 0.10 NC Vanuatu NC 0.20 NC Total $4,947.94 372.80 1,844.59 World Total $4,281.05 6,501.30 27,832.36

Economic Studies of International Development Vol. 10-2
32
Table 6.E: Simulated Income Gains for European Countries
Per Capita
Gain Population (millions)
Aggregate Income
Gain (billion $)
Albania NC 3.20 NC Belarus $8,757.21 9.70 84.94 Bosnia & Herzegovina $1,552.71 3.90 6.06 Bulgaria NC 7.60 NC Croatia NC 4.40 NC Czech Republic NC 10.30 NC Estonia NC 1.30 NC Hungary NC 10.10 NC Latvia NC 2.30 NC Lithuania NC 3.40 NC Macedonia NC 2.00 NC Moldova NC 3.80 NC Montenegro $11,503.99 0.60 6.90 Poland NC 38.10 NC Romania $3,044.16 21.50 65.45 Russia $3,962.39 141.60 561.07 Slovakia NC 5.40 NC Slovenia NC 2.00 NC Total $2,479.84 293.80 728.58 World Total $4,281.05 6,501.30 27,832.36
Journal published by the EAAEDS: http://www.usc.es/economet/eaa.htm