employee training and development: how to measure effectiveness...
TRANSCRIPT

AN EBOOK Brought to you by:
EMPLOYEE TRAINING AND DEVELOPMENT: How To Measure
Effectiveness and Impact

BIZLIBRARY.COM
DELIVERING MEANINGFUL LEARNING RESOURCES TO YOUR EMPLOYEES
The ASTD 2013 State of the Industry report shows the average cost per learning hour
used is $89, and the cost per learning hour available is $1,772.
Both of these metrics increased over the previous year and have been on an
upward trend since 2004. The cost per learning hour used increased by 4% in 2012
compared with 2011, and the cost per learning hour available increased by 20% in
the same time period.
• How can we measure the effectiveness of our training initiatives?
• How can we make sure the investment of time and resources is making a positive
business impact?
In this eBook we'll review:
• Training metrics - where we've been and where we're going
• How to determine goals and key indicators
• How to create a measurement plan for your program
Overall spending on employee training in U.S. organizations is $164 billion.
$1,195
COST PER EMPLOYEE PER YEAR
COMPANY SIZE (# of Employees)
Smaller organizations
typically spend more
per employee than
larger organizations.
$700
$964
$1,800
BIZLIBRARY.COM
KEY PERFORMANCE INDICATORS AND BENCHMARKS
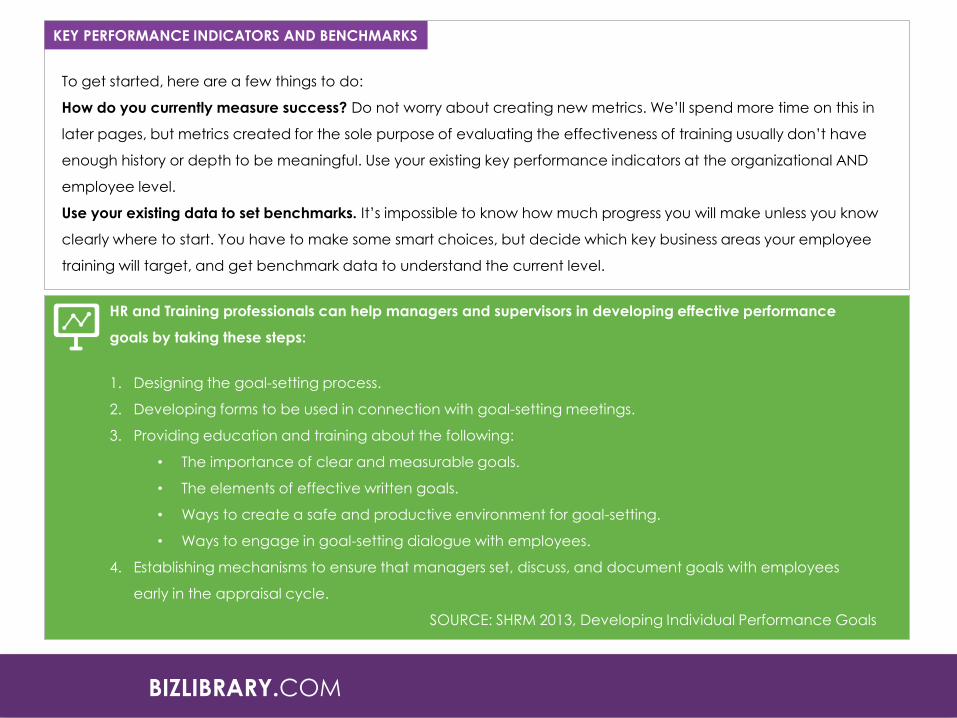
To get started, here are a few things to do:
How do you currently measure success? Do not worry about creating new metrics. We’ll spend more time on this in
later pages, but metrics created for the sole purpose of evaluating the effectiveness of training usually don’t have
enough history or depth to be meaningful. Use your existing key performance indicators at the organizational AND
employee level.
Use your existing data to set benchmarks. It’s impossible to know how much progress you will make unless you know
clearly where to start. You have to make some smart choices, but decide which key business areas your employee
training will target, and get benchmark data to understand the current level.
HR and Training professionals can help managers and supervisors in developing effective performance
goals by taking these steps:
1. Designing the goal-setting process.
2. Developing forms to be used in connection with goal-setting meetings.
3. Providing education and training about the following:
• The importance of clear and measurable goals.
• The elements of effective written goals.
• Ways to create a safe and productive environment for goal-setting.
• Ways to engage in goal-setting dialogue with employees.
4. Establishing mechanisms to ensure that managers set, discuss, and document goals with employees
early in the appraisal cycle.
SOURCE: SHRM 2013, Developing Individual Performance Goals
BIZLIBRARY.COM

In the 1950s, two great business thinkers and visionaries articulated some foundational business principles that remain influential today.
W. Edwards Deming began working on the post war reconstruction of the Japanese economy based upon persistent use of statistics to seek continuous improvement. His work was so valued by the Japanese government that The Deming Prize was inaugurated in 1951, and
remains the most prestigious business award in Japan. Deming was the foremost thought leader on the power of analytics to drive improvement, and his work influenced an entire generation of writers and academics all around the world.
Read more about Deming Peter Drucker is another great business thought leader whose work
remains relevant today. Drucker introduced the concept of modern business management to corporate America. In 1954, he wrote one of the greatest books on management ever written – The Business of Management. He first coined the term “knowledge worker” in 1959 and helped pioneer knowledge work productivity. Drucker was an advocate for rational management based upon motivating people and a commitment to continuous learning. Like Deming, he believed strongly in the power of data and information to inform management decisions, when the data was rational, gathered well and made sense.
Read more about Drucker
BIZLIBRARY.COM
MEASUREMENT AND BUSINESS
“It's not enough to do your best;
you must know what to do and
then do your best.”
W. Edwards Deming
“The leaders who work most
effectively, it seems to me, never
say ‘I’. And that’s not because
they have trained themselves not
to say ‘I’ . They don’t think ‘I’. They
think ‘we’.; they think ‘team’. They
understand their job to be to
make the team function. They
accept responsibility and don’t
sidestep it, but ‘we’ gets the
credit…This is what creates trusts,
what enables you to get the task
done.”
Peter Drucker

In 1959, Donald Kirkpatrick introduced the world to a rational methodology for measuring the impact and ROI of employee training. He published four articles called, “Techniques for Evaluating Training Programs.” The Kirkpatrick Institute continues Mr. Kirkpatrick’s work today, and this four-step method remains the “gold standard” for most organizational efforts to measure the impact of employee training programs 55 years since Kirkpatrick introduced it to the market.
Read more about Kirkpatrick In the 1970s, Dr. Jack Phillips built upon the foundation of work begun by Donald Kirkpatrick and added a 5th level to the methodology. Phillips added a rigorous data-driven 5th layer to the technique designed to illustrate business benefits derived from employee training efforts. Phillips remains at the head of his ROI Institute and is one of the
top thought leaders in this space.
Read more about Phillips And that pretty well sums up the state of leadership on measuring the effectiveness of employee training. Not a lot has changed other than refinements to the Kirkpatrick/Phillips method, in over 40 years. Which leads to an important question. Has the business environment changed in those 40 years? If so, have the changes been profound enough that maybe we should reexamine how we look at and measure the effectiveness of employee training efforts?
THE KIRKPATRICK – PHILLIPS
MODEL
LEVEL 5
RETURN ON INVESTMENT
LEVEL 4
RESULTS – business impact
LEVEL 3
BEHAVIOR - application
LEVEL 2
LEARNING – knowledge, skills and
attitudes
LEVEL 1
REACTION – participant
satisfaction
BIZLIBRARY.COM
MEASUREMENT AND BUSINESS

THE COST OF ONE GALLON OF GAS
2013: $3.61
1970: $0.36
1959: $0.25
2013: $271,600
THE AVERAGE COST OF A NEW HOUSE
1959: $12,400
1970: $23,500
2013
1970
1959
SPUTNIK – launch of first manmade satellite
FIRST FLOPPY DISK
3D PRINTING
THEN AND NOW

Obviously, the world has changed in the last 40 years. And that begs an important question. Why haven’t we changed the way we look at measuring the effectiveness of employee training? One of the best things about baseball is that we know how to measure success. Baseball has been measuring success since the introduction of the box score in the mid-19th century. Pitchers have earned run average. Hitters have batting average
and on-base percentage. There are a number of ways to measure success on a baseball field. And we can see the effect of training in these very measures, too. If a pitcher learns a new pitch and it’s a good pitch, we’ll see his ERA improve. If a hitter learns how to hit a curve ball better, we will see his batting average improve. If only corporate employee training were as easy! We train and train but can we really tell if improvements in performance are the result of the training? The challenge of isolating the impact of training on improved organizational performance remains one of the most imposing challenges facing the profession
today. What can we do? Walk away? Or – do we find new ways to approach the challenge? We already know that few organizations measure the impact of employee training at the business impact or more sophisticated levels of the prevailing methodology. But what if we could find a simpler way to get at the actual business impact of our employee training efforts?
THEN AND NOW
“It’s not the 95% that's right that
makes something work; it's the 5%
that's wrong that messes
everything up.”
Will Kaydos,
Measuring, Managing and
Maximizing Performance.
BIZLIBRARY.COM
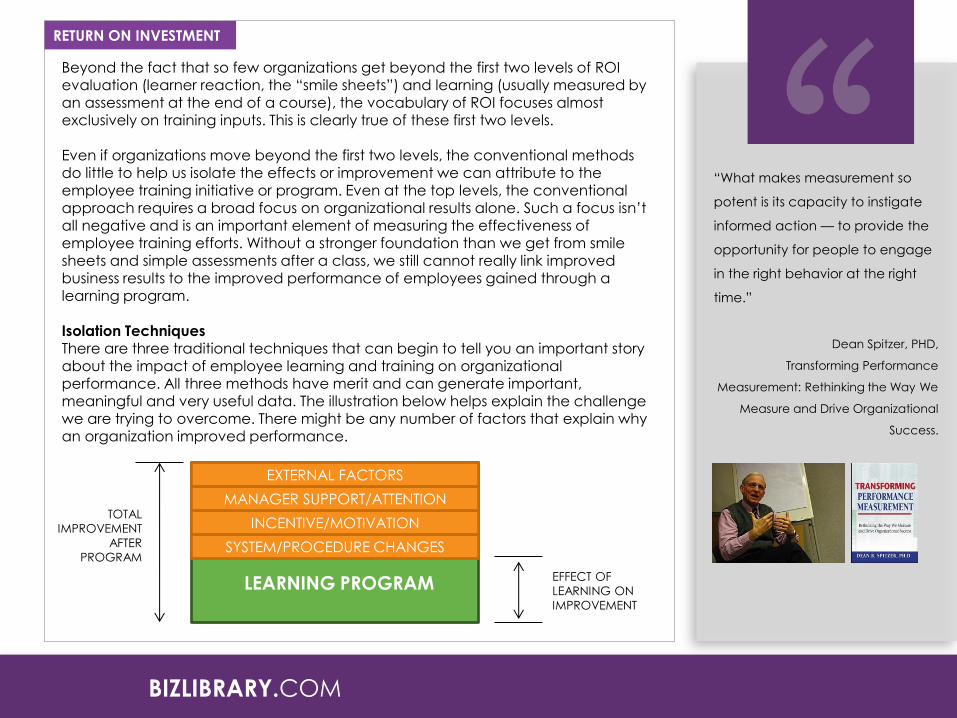
Beyond the fact that so few organizations get beyond the first two levels of ROI evaluation (learner reaction, the “smile sheets”) and learning (usually measured by an assessment at the end of a course), the vocabulary of ROI focuses almost exclusively on training inputs. This is clearly true of these first two levels. Even if organizations move beyond the first two levels, the conventional methods do little to help us isolate the effects or improvement we can attribute to the
employee training initiative or program. Even at the top levels, the conventional approach requires a broad focus on organizational results alone. Such a focus isn’t all negative and is an important element of measuring the effectiveness of employee training efforts. Without a stronger foundation than we get from smile sheets and simple assessments after a class, we still cannot really link improved business results to the improved performance of employees gained through a learning program. Isolation Techniques
There are three traditional techniques that can begin to tell you an important story about the impact of employee learning and training on organizational performance. All three methods have merit and can generate important, meaningful and very useful data. The illustration below helps explain the challenge we are trying to overcome. There might be any number of factors that explain why an organization improved performance.
BIZLIBRARY.COM
RETURN ON INVESTMENT
SYSTEM/PROCEDURE CHANGES
INCENTIVE/MOTIVATION
MANAGER SUPPORT/ATTENTION
EXTERNAL FACTORS
LEARNING PROGRAM EFFECT OF
LEARNING ON
IMPROVEMENT
TOTAL
IMPROVEMENT
AFTER
PROGRAM
“What makes measurement so
potent is its capacity to instigate
informed action — to provide the
opportunity for people to engage
in the right behavior at the right
time.”
Dean Spitzer, PHD,
Transforming Performance
Measurement: Rethinking the Way We
Measure and Drive Organizational
Success.

External factors such as market conditions or competition may have an impact, however neither of these factors have anything to do with your employee training. Both factors could influence organizational performance. Management might be paying more attention to the area you are trying to improve, and this focus might have a positive impact. You might have systems or process improvements that helped improve outcomes, as well. Any of these factors may have been as influential on your employee training. Conversely, your employee training may have been the single most critical factor in the improved performance, but you won’t know unless you can isolate its impact from the impact or influence of other factors.
Trend Line Analysis This is a great way to get a big picture perspective on how your organization is doing before, during and after training initiatives. The key to an effective trend line analysis is to examine performance along a long enough time frame to provide a complete picture of success and gaps both before and after training initiatives start. Start your trend line analysis at a meaningful time interval before you launch your training effort. In order to do this, you need to be committed to measuring the business impact of training using existing key performance indicators.
BIZLIBRARY.COM
RETURN ON INVESTMENT
Here is a specific example of how this might work.
Let’s assume that we are working to reduce the time it takes us to fill job
vacancies in the organization.
Training offered – An HR recruiting team improved skills on sourcing
candidates, screening candidates and basic interviewing. The
organization also offered basic interviewing skills training to all hiring
managers with openings to fill.
The training program launched in Q2 of 2012. The objective was to
reduce the average time to fill open positions from the 70 day range to
less than 55 (three full business weeks).
The trend line illustrates that the time to fill open positions showed a
steady improvement from the poor level of performance before the
organization initiated the training program with the organization hitting its
stated goal six quarters after launching the training program.
71 69 68 69 70 71 68
65 62
58 55
52
0
10
20
30
40
50
60
70
80
Q1
20
11
Q2
20
11
Q3
20
11
Q4
20
11
Q1
20
12
Q2
20
12
Q3
20
12
Q4
20
12
Q1
20
13
Q2
20
14
Q3
20
14
Q4
20
14
Average Days
Average
Days
Linear
(Average
Days)
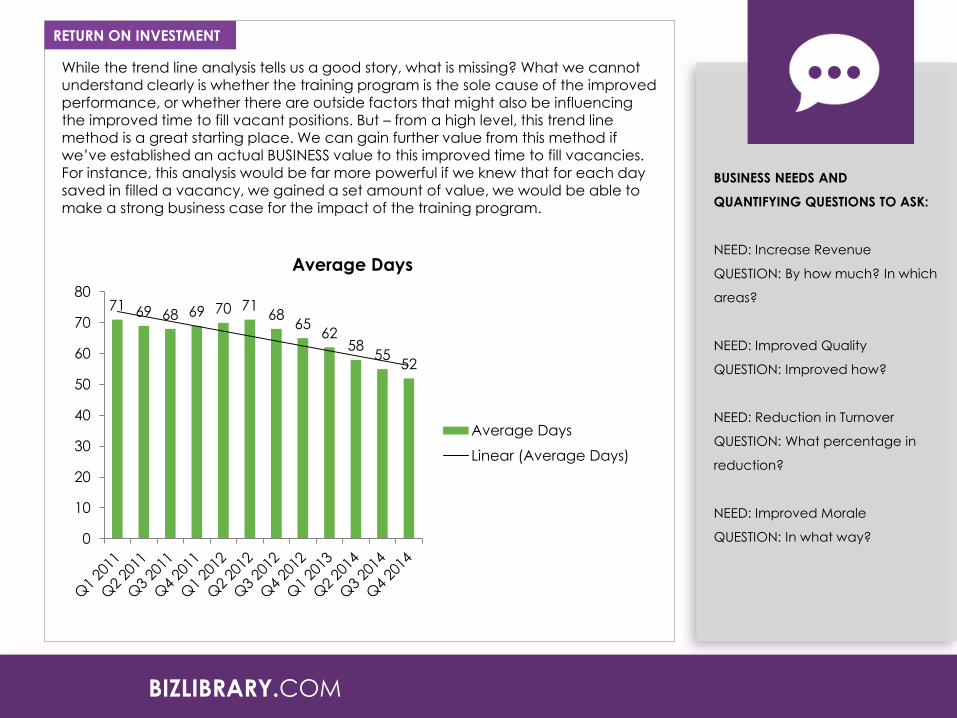
While the trend line analysis tells us a good story, what is missing? What we cannot understand clearly is whether the training program is the sole cause of the improved performance, or whether there are outside factors that might also be influencing the improved time to fill vacant positions. But – from a high level, this trend line method is a great starting place. We can gain further value from this method if we’ve established an actual BUSINESS value to this improved time to fill vacancies. For instance, this analysis would be far more powerful if we knew that for each day
saved in filled a vacancy, we gained a set amount of value, we would be able to make a strong business case for the impact of the training program.
BUSINESS NEEDS AND
QUANTIFYING QUESTIONS TO ASK:
NEED: Increase Revenue
QUESTION: By how much? In which
areas?
NEED: Improved Quality
QUESTION: Improved how?
NEED: Reduction in Turnover
QUESTION: What percentage in
reduction?
NEED: Improved Morale
QUESTION: In what way?
BIZLIBRARY.COM
RETURN ON INVESTMENT
71 69 68 69 70 71 68
65 62
58 55
52
0
10
20
30
40
50
60
70
80
Average Days
Average Days
Linear (Average Days)

Control Group Setting up a control group is an excellent way to truly isolate the effects and influence of your training program on improved performance. In our example where we are trying to reduce the amount of days required to fill vacant positions, a control group might include a team of recruiters and hiring managers who
do not participate in the training. Comparing the performance of this group to the performance of recruiters and hiring managers who participate would help illustrate exactly how the training influenced improved performance. This works well, because both groups would be influenced by the same external factors, so the difference in improvement should be tied pretty directly to the training.
The drawback to this method is that you will have some population of your workforce that you deliberately hold back from improvement to prove a point. While this may sound good in theory (and it really does), the reality of implementing control groups can be messy. You have to be prepared for some management and communication challenges if you choose this method.
BIZLIBRARY.COM
RETURN ON INVESTMENT Other methods: Participant And Manager Estimation Of Impact. This method can provide some useful information that is close to the point of performance. The issue is the reliability of the data generated. Without training and clear evaluation guidelines, the estimations will only be as good as the employees’ ability to provide the information.
Senior Management Estimation. This is another method that can be filled with data problems due to bias and simple human error. The more removed you are from the employees actually affected by the training, the less reliable these sort of estimates become. Success Case Method. This method comes from the
book, Telling Training’s Story by Robert O. Brinkerhoff. Assuming that one single person was the focus of our inquiry, we thought we would really only need to have answers to three pretty simple and fundamental questions to make the case for a training success: • What, if anything, did this person learn that was
new? • How, if at all, did this person use the new learning
in some sort of job-specific behavior? • Did the usage of the learning help to produce
any sort of worthwhile outcome?
Recruiters and Hiring Mangers Group 1
Recruiters and Hiring Mangers Group 2

One of the challenges training professionals have faced, and generally failed to overcome, in evaluating training effectiveness is isolating the influence of training on improved performance. The simple truth is that it may be virtually impossible to ever truly “isolate” the influence of training in improved performance. Human behavior may just be too complex for such simple “if a
then b” analysis. Let’s return to our baseball analogy… One long-held hitting statistic used to measure a hitter’s success is runs batted in (the number of base runners that score as the result of the batter’s action – a hit, sacrifice fly, etc.). RBI’s have long been the benchmark statistic for current star players like Albert Pujols or David
Ortiz. But RBI’s are NOT influenced solely by the contributions of the hitter. Before a run can be batted in, another player has to be on base. So even in the world of baseball where everything – really, everything – is measured and analyzed, it’s nearly impossible to truly isolate the performance in many areas of one player from his teammates.
BIZLIBRARY.COM
REALITY - NOT TO BE IGNORED In an organizational setting, it’s more complex. For instance, we know that training programs work best when managers provide a high level of direct support both before and after specific events. We also know that employees learn most of what they
need to perform successfully outside of formal learning. So – should we ignore those factors that great learning organizations understand and leverage to improve employee learning? The answer is a resounding, “NO!”
The best way to truly measure the effectiveness of training is to identify ALL of the factors that influence successful employees to reach higher levels of performance. Another consideration should the opposite end of the performance spectrum – those who have participated in your training program that didn’t succeed. Compared to the successful participants,
what factors or influences are missing? The objective then becomes finding ways to spread the factors that have the greatest positive influence on successful performance when combined with training to as many employees as possible.
Chicago Tribune Illustration by Rick Tuma
Training programs work best when managers provide a high level of direct support both before and after specific events.”
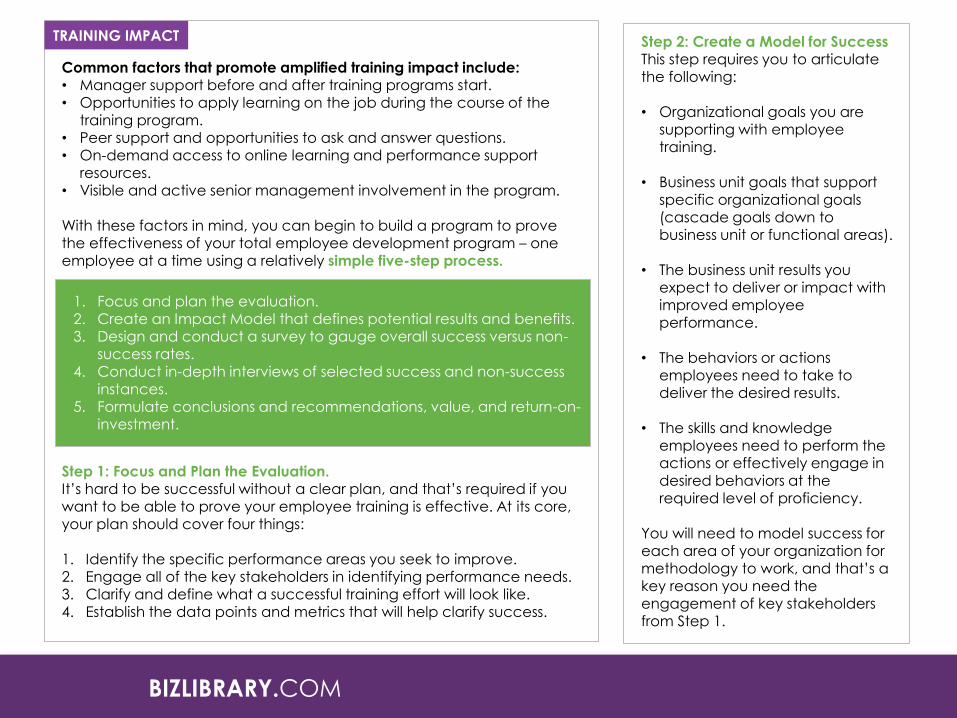
Common factors that promote amplified training impact include: • Manager support before and after training programs start. • Opportunities to apply learning on the job during the course of the
training program. • Peer support and opportunities to ask and answer questions. • On-demand access to online learning and performance support
resources.
• Visible and active senior management involvement in the program. With these factors in mind, you can begin to build a program to prove the effectiveness of your total employee development program – one employee at a time using a relatively simple five-step process.
Step 1: Focus and Plan the Evaluation. It’s hard to be successful without a clear plan, and that’s required if you want to be able to prove your employee training is effective. At its core, your plan should cover four things: 1. Identify the specific performance areas you seek to improve. 2. Engage all of the key stakeholders in identifying performance needs. 3. Clarify and define what a successful training effort will look like. 4. Establish the data points and metrics that will help clarify success.
BIZLIBRARY.COM
TRAINING IMPACT
1. Focus and plan the evaluation. 2. Create an Impact Model that defines potential results and benefits. 3. Design and conduct a survey to gauge overall success versus non-
success rates.
4. Conduct in-depth interviews of selected success and non-success instances.
5. Formulate conclusions and recommendations, value, and return-on-investment.
Step 2: Create a Model for Success This step requires you to articulate the following: • Organizational goals you are
supporting with employee training.
• Business unit goals that support
specific organizational goals (cascade goals down to business unit or functional areas).
• The business unit results you expect to deliver or impact with improved employee performance.
• The behaviors or actions employees need to take to deliver the desired results.
• The skills and knowledge employees need to perform the actions or effectively engage in desired behaviors at the required level of proficiency.
You will need to model success for each area of your organization for methodology to work, and that’s a key reason you need the engagement of key stakeholders from Step 1.

Step 3: Design and conduct a survey to gauge overall success versus non-success rates. There are two important aspects to building an effective survey to develop useful information. You need to ask good questions, and you need to time the survey well so you can gather information at an appropriate time interval after the initiation of the training effort. As for the questions, here is an example of a question that will get you started:
An important point to make here is you do NOT need more than two or three well-crafted questions to get at what employees learned and applied from the training content and program. The timing of the survey is likewise important, and you need to plan this carefully based upon the objectives of the training effort. For some specific skill or knowledge improvement goals, a 90-day interval might be perfect. For the improvement of more sophisticated management, communications or other soft skills, you might consider an interval more like six months. Soft skills improvements take longer to demonstrate, and are harder to master. So the way you will measure the effectiveness of those types of training efforts will – by necessity – be different.
BIZLIBRARY.COM
TRAINING IMPACT
• Which statement below best describes your experience since participating in the Performance
Management training?
• I learned something new, I have used it, and it has led to some very worthwhile results.
• I learned and tried some new things but can’t point to any very worthwhile results yet.
• While I may have learned something new, I have not been able to use it yet.
• I already knew about and was doing the things this training taught.
• I don’t think I can really use what I learned in the training.

Step 4: Conduct in-depth interviews with employees who’ve been BOTH successful and unsuccessful. You have to work at both ends of the spectrum so you can begin to understand all of the factors that influenced these outcomes. The goal of these interviews is to identify both positive and negative influences. Once you’ve identified these influences, you work hard to maximize and enhance the factors that exert a positive influence on training outcomes. Conversely, you work just as hard to reduce or
eliminate the influence of factors that negative ly influence training results. Step 5: Develop conclusions, write action plans and implement needed changes. As you’ve built your case for the effectiveness of your training through the information you’ve gathered and planning in the first four steps, you’re now ready to dive into the data. Here are the pieces of data you are looking to report: • Specific areas of increased performance • The actual VALUE of this increased performance
• The costs of the overall effort to deliver this value • Recommended improvements to deliver more value
The example on the following page shows of how this might work using our former example of a reduction in the time to fill vacant openings.
BIZLIBRARY.COM
TRAINING IMPACT
MANAGER SUPPORT:
Managers can give great insight
into what skills would make a
difference for the employee, while
also providing coaching and
feedback as the person develops
his or her capabilities. Be sure to
continue providing guidance and
coaching throughout the skill
development process.
RECOMMENDED RESOURCE Course Title: Developing Others - Connect every employee's individual goals to the organization's vision and strategy

BIZLIBRARY.COM
TRAINING IMPACT
REPORT: VALUE OF TRAINING ON INTERVIEWING SKILLS FOR SALES MANAGERS
Goal: Reduce time to fill open positions from over 70 days to less than 55.
Value: The expected value to be gained is measured by using the average revenue generated by new sales reps in their first 90 days of work on a per day basis, and the added value realized in the first 6 months of employment for each day we can get them onboard and trained more quickly.
$435/day $32,000
In six months The average rep closes two more deals at an average value of $16,000 each when
they started in 60 days after position opened.
First 90 days.
Training Costs: Human Resources: $45,000 Sales: $15,000 Total: $60,000
Impact: Seven reps were hired with an average reduction of 10 days saved per rep in the six month time frame of the study.
Value Added From Improved Performance: 7 reps X 10 days each = 70 days. 70 days saved were worth $30,450. 4 of 7 reps started in 60 days or less after open position. $128,000 added in new sales. TOTAL VALUE GAINED: $158,450 on a $60,000 program.
Other Factors: Better communication and cooperation between sales managers and HR recruiters meant the candidates being interviewed fit a success profile for sales reps more clearly than before the program started. We also learned that social media sourced candidates tended to be more successful in the first six months than blind applicants.
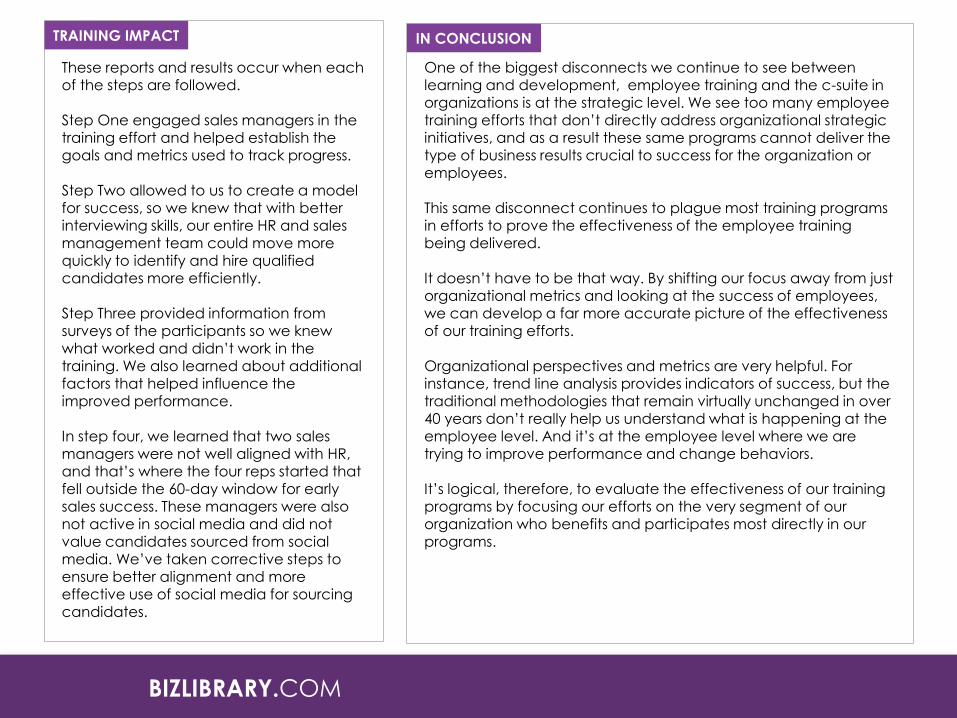
These reports and results occur when each of the steps are followed. Step One engaged sales managers in the training effort and helped establish the goals and metrics used to track progress.
Step Two allowed to us to create a model for success, so we knew that with better interviewing skills, our entire HR and sales management team could move more quickly to identify and hire qualified candidates more efficiently. Step Three provided information from surveys of the participants so we knew
what worked and didn’t work in the training. We also learned about additional factors that helped influence the improved performance. In step four, we learned that two sales managers were not well aligned with HR, and that’s where the four reps started that fell outside the 60-day window for early sales success. These managers were also not active in social media and did not value candidates sourced from social media. We’ve taken corrective steps to ensure better alignment and more effective use of social media for sourcing candidates.
BIZLIBRARY.COM
TRAINING IMPACT
One of the biggest disconnects we continue to see between learning and development, employee training and the c-suite in organizations is at the strategic level. We see too many employee training efforts that don’t directly address organizational strategic initiatives, and as a result these same programs cannot deliver the type of business results crucial to success for the organization or employees.
This same disconnect continues to plague most training programs in efforts to prove the effectiveness of the employee training being delivered. It doesn’t have to be that way. By shifting our focus away from just organizational metrics and looking at the success of employees, we can develop a far more accurate picture of the effectiveness of our training efforts.
Organizational perspectives and metrics are very helpful. For instance, trend line analysis provides indicators of success, but the traditional methodologies that remain virtually unchanged in over 40 years don’t really help us understand what is happening at the employee level. And it’s at the employee level where we are trying to improve performance and change behaviors. It’s logical, therefore, to evaluate the effectiveness of our training programs by focusing our efforts on the very segment of our organization who benefits and participates most directly in our programs.
IN CONCLUSION

BIZLIBRARY.COM
For a free 30-day trial of BizLibrary, click here.
http://www.bizlibrary.com/free-trial
5,000+ Courses. 25 Topic Areas.
Unlimited Access.
Improve your employees' performance with the
largest and fastest-growing library of on-demand
training videos and eLearning courses today!