employment, additional education, satisfaction, and ...€¦ · satisfaction, and internships...
TRANSCRIPT

• © 2018 Northern Illinois University
Accreditation, Assessment, and Evaluation
NIU Alumni Survey
of Baccalaureate Students
Employment, Additional Education, Satisfaction, and Internships
(Academic Year 2015-2016)
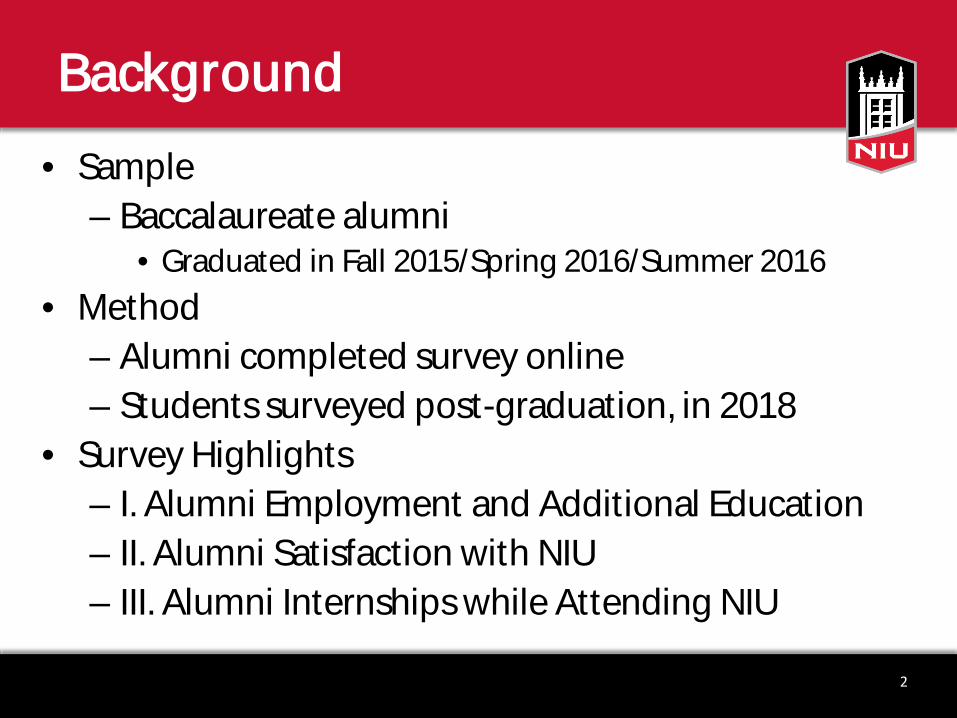
• Sample– Baccalaureate alumni
• Graduated in Fall 2015/Spring 2016/Summer 2016• Method
– Alumni completed survey online – Students surveyed post-graduation, in 2018
• Survey Highlights– I. Alumni Employment and Additional Education– II. Alumni Satisfaction with NIU– III. Alumni Internships while Attending NIU
Background
2

23
20
17
85
99
191
424
167
270
284
584
815
1388
3421
0 1000 2000 3000 4000
CVPA
COE
CEET
COB
CHHS
CLAS
Overall
Number of Students Surveyed Respondents
Response RatesResponse Rate
14%
12%
6%
15%
7%
14%
Overall
By College12%
3

I. Alumni Employment and
Addit ional Education
4

14%
4% 5% 6%
56%
6% 7%4%
0
50
100
150
200
250
Full-TimeEmployment
Part-TimeEmployment
SeekingEmployment
Not SeekingEmployment
Num
ber o
f Res
pond
ents
Pursuing/CompletedAdditional Degree
No Additional Degree
Employment and Addit ional Education
Employed Not Employed
5

6
Addit ional Education:Type of Degree(s) Pursued
*Participants identified their degree as “Other” if it did not match any of the categories above.
0 10 20 30 40 50 60 70 80
Unreported
Other
Grad Certificate
Health Professional
Law
Doctorate
Master's
Undergraduate Degree
Number of Respondents
… By Alumni Respondents Who Pursued Additional Degree(s)
4%
56%
14%
7%
2%
6%
8%
3%

7
Sector of Employment
0 20 40 60 80 100 120
Unreported
Other
Military
Self-Employed
Non-Profit
College/University
Government
Professional Firm
Elementary/Secondary School
Health Agency
Business
Number of Respondents
… Of Alumni Respondents Employed Full-Time or Part-Time34%
15%
9%
8%
8%
6%
4%
1%
1%
4%
12%
*Participants identified their job as “Other” if it did not match any of the categories above.

51%
11%
38%
0
20
40
60
80
100
120
140
160
180
Illinois Other State Unreported
Num
ber o
f Stu
dent
s
… Of Alumni Respondents Employed Full-Time or Part-Time
Location of Employment
8

65%
19% 16%
0
20
40
60
80
100
120
140
Less Than 6 Months > 6 Months; < 1 Year One Year or More
Num
ber o
f Stu
dent
s
… For Alumni Respondents Employed (Full-Time or Part-Time) After Graduation
Time to Employment
9

10
Relatedness of NIU Degree to Job
Note. Due to missing data, percentages do not sum to 100%.
36%39%
11%15%
0
20
40
60
80
100
120
Closely Related Related Unrelated(by Choice)
Unrelated(Not by Choice)
Num
ber o
f Res
pond
ents
… Of Alumni Respondents Employed Full-Time or Part-Time

Job Satisfaction andRelatedness of Job to NIU Degree
4.66
1 2 3 4 5 6
11
n = 289
3.504.94
4.794.92
1 2 3 4 5 6Strongly Disagree Strongly Agree

Job Preparedness andRelatedness of Job to NIU Degree
4.25
1 2 3 4 5 6
12
n = 287
3.053.28
4.374.89
1 2 3 4 5 6Strongly Disagree Strongly Agree
II. Alumni Satisfaction with NIU
13

4.62
4.72
1 2 3 4 5 6
I would recommendNIU to a prospective
student.
I am satisfied withmy overall experience
as a student at NIU.
Overall Satisfaction with NIU
Strongly Disagree Strongly Agree
14
n = 368
n = 367

3.85
4.41
4.67
4.19
1 2 3 4 5 6
I am satisfied with the careeradvising I received at NIU.
I am satisfied with the career servicesthat were available to me at NIU.
Overall, I am satisfied with the financialaid that was made available
to me during my time at NIU.
I felt safe whileon campus at NIU.
Satisfaction with NIU’s Services
Strongly Disagree Strongly Agree
15
n = 363
n = 366
n = 362
n = 363
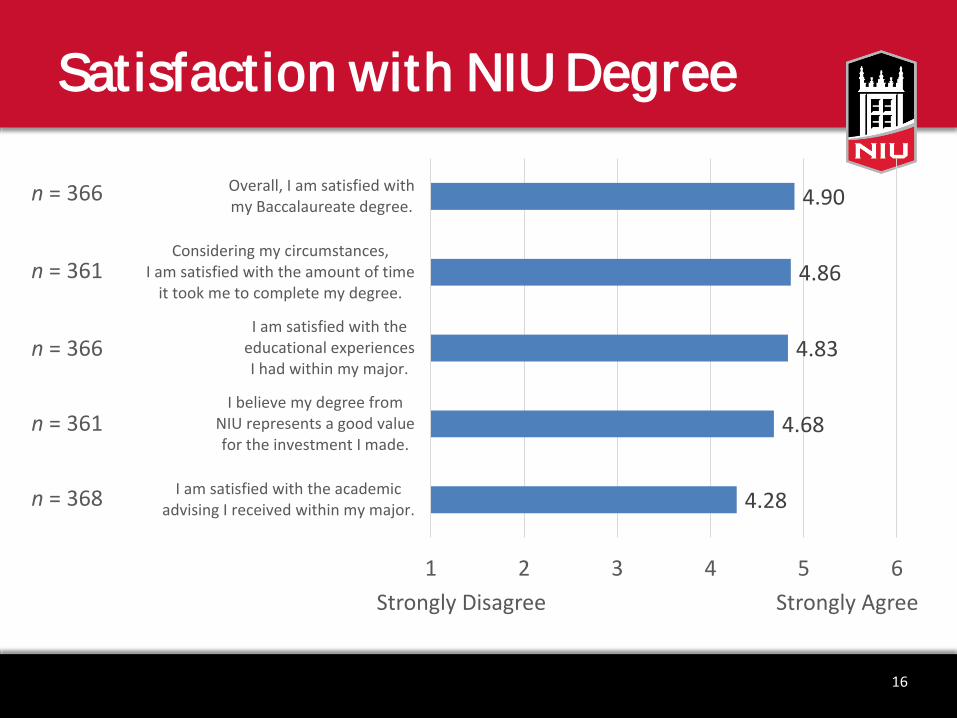
4.28
4.68
4.83
4.86
4.90
1 2 3 4 5 6
I am satisfied with the academicadvising I received within my major.
I believe my degree fromNIU represents a good valuefor the investment I made.
I am satisfied with theeducational experiencesI had within my major.
Considering my circumstances,I am satisfied with the amount of time
it took me to complete my degree.
Overall, I am satisfied withmy Baccalaureate degree.
Satisfaction with NIU Degree
Strongly Disagree Strongly Agree
16
n = 361
n = 366
n = 366
n = 361
n = 368

3.9
4.3
4.6
4.4
4.5
3.8
4.2
4.6
4.6
4.6
4.5
5.0
5.0
5.0
5.1
4.7
5.0
5.1
5.0
5.2
1 2 3 4 5 6
I am satisfied with the academicadvising I received within my major.
I believe my degree fromNIU represents a good valuefor the investment I made.
I am satisfied with theeducational experiencesI had within my major.
Considering my circumstances,I am satisfied with the amount of time
it took me to complete my degree.
Overall, I am satisfied withmy Baccalaureate degree.
Satisfaction with Degree andRelatedness of Job to NIU Degree
Strongly Disagree Strongly Agree
17
n = 276
n = 280
n = 280
n = 276
n = 281

III. Alumni Internships while Attending NIU
18

Number of Internships While Attending NIU
42%47%
11%
0
50
100
150
200
250
One or More None Unreported
Num
ber o
f Res
pond
ents
19

Types of Internships
61% 66%
86%
020406080
100120140160180200
Paid For Credit Within Discipline
Num
ber o
f Res
pond
ents
Of those alumni who had internships, at least one internship was…
20

21
For more information…
Please contact:Accreditation, Assessment and EvaluationNorthern Illinois UniversityAdams Hall [email protected], 815-753-3545, go.niu.edu/assessment