enabling data-driven real-time governance
TRANSCRIPT
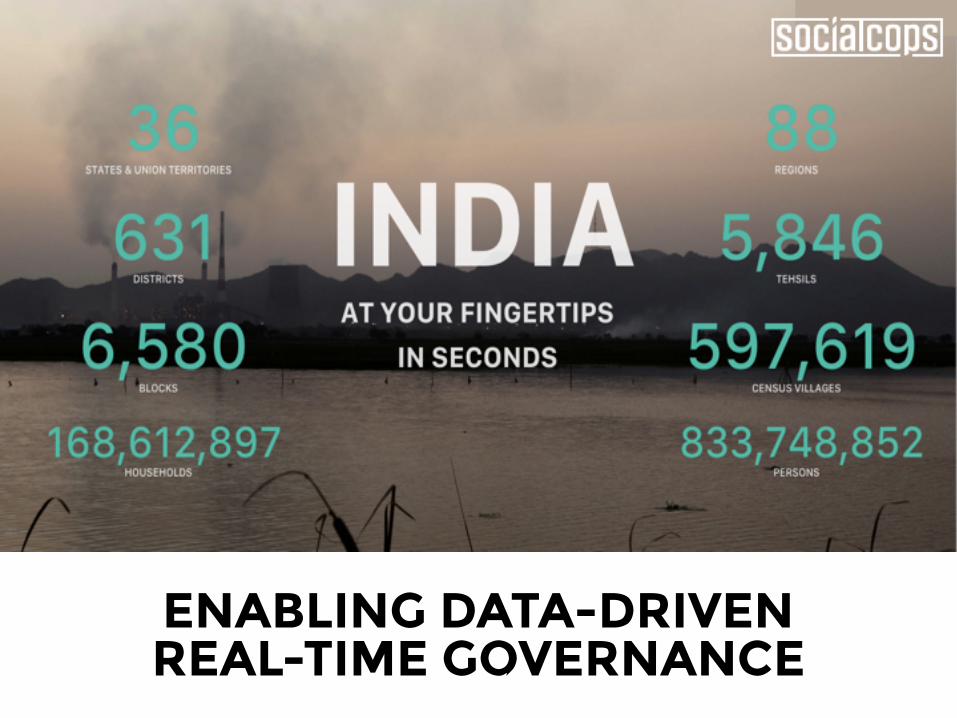
ENABLING DATA-DRIVEN REAL-TIME GOVERNANCE

Outline
1. The problem we are solving
2. Our platform
3. Data visualization capabilities
4. Data cleaning, preparation, and analytics capabilities
5. Data collection capabilities
6. Case studies

It’s difficult to find answers today…
How are villages changing over time?
Where is the money being spent?
What is the progress across sectors?
How are different outcomes affected?
DEPARTMENTS ARE NOT SYNCED
DATA STORED IN HARD COPIES
DATA STORED IN MULTIPLE FORMATS
TOO MANY DATABASES
DATA IS NOT SEARCHABLE
DATA IS DIFFICULT TO CONSUME
How is data changing over time?

MIS
Softwares
Department reports
Online Portals
NIC
Apps
Department Officers
Beneficiaries Organizations
One Centralized
Platform
Information is in silos. Can it be joined?
?
The only data platform that can do it all.
SocialCops’ platform puts all data in one central platform and lets you use this data in different ways.

An end-to-end decision-making platform
CENTRAL DATABASE
MIS, department databases, and other relevant
databases
Real-time cleaning and processing
engine
Machine learning algorithms
generating insights
Action tracking mechanisms
Multi-structured big data analysis
Field inspectors
Web data entry
MIS database
PDFs, Excel
SMS, IVRS, USSD
Real-time querying
In-depth searching
Web dashboard
Mobile dashboard
Regular reports
1. Raw data and data sources
2. Data transformation, analysis, and management
3. Data visualization

DATA VISUALIZATION CAPABILITIES
1


Categories of visualizations
Multi-parameter dynamic querying1
Village level multi-indicator mapping
2 Dynamic index generation 3
Hyper local geo-clustering 4 Natural language
enabled querying 5 Household level GPS mapping 6
Instant filter-enabled reports7 Real-time data
aggregation 8Progress monitoring and tracking
9

Village level multi-indicator mapping1
Select parameters1Colored geo-
clusters2
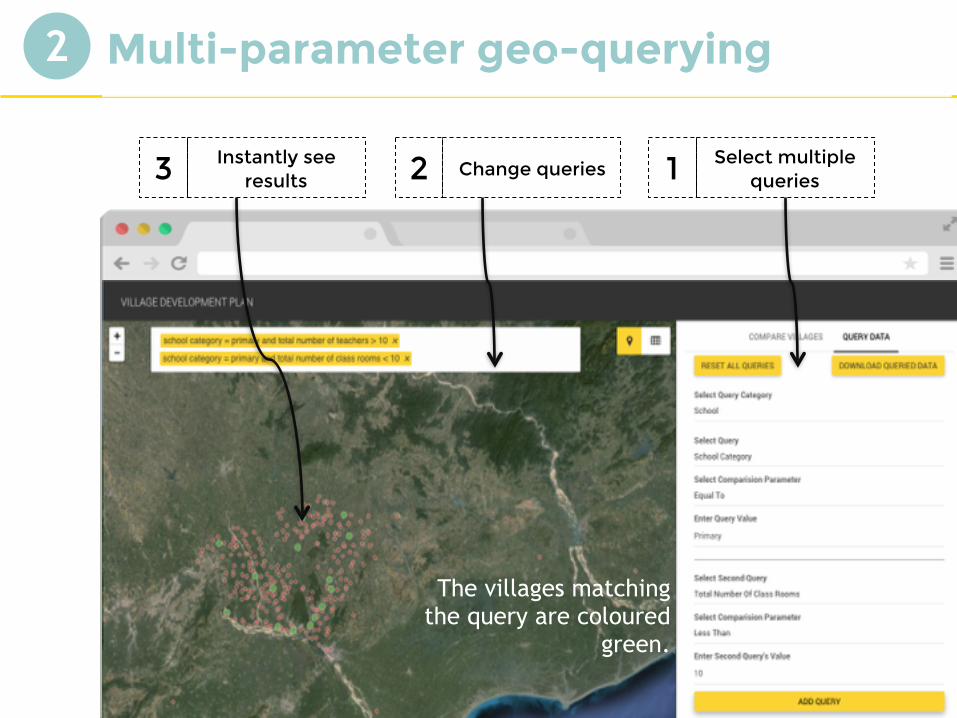
Multi-parameter geo-querying
The villages matching the query are coloured
green.
2
Select multiple queries1Change queries2Instantly see
results3

Real-time dashboard aggregation
Select GP, block, district, etc.1Change tabs to
see more details2Download data or graph3
3

Household-level GPS mapping
Select required indicator3Choose a
household2Zoom into the households1
4

Progress monitoring and tracking
Select a village name1Search for any
specific indicator2Download custom reports3
5
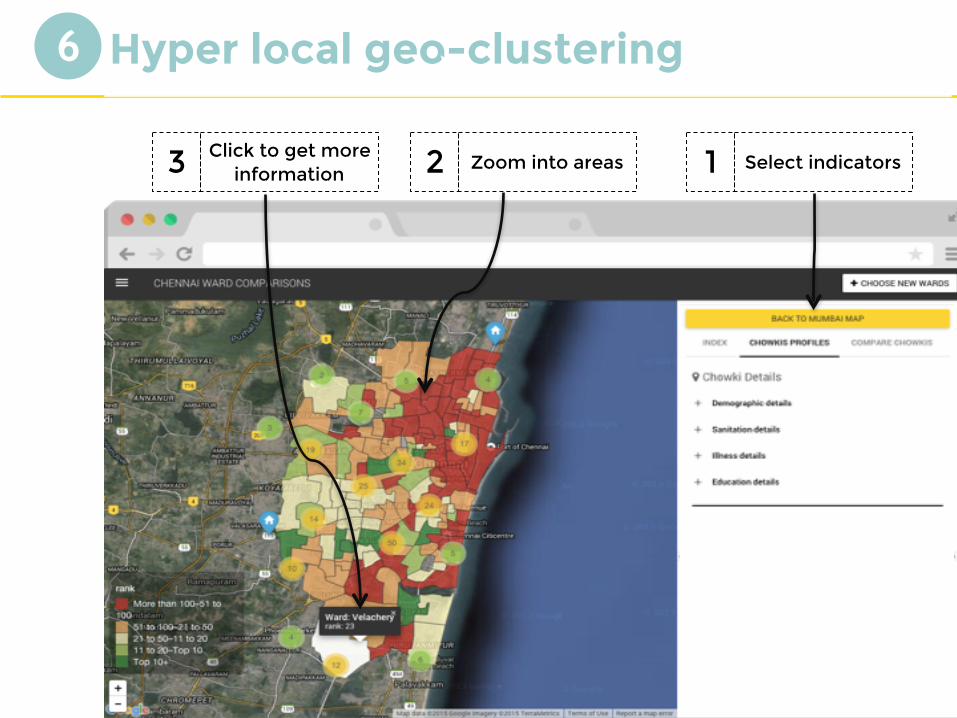
Hyper local geo-clustering
Select indicators1Zoom into areas2Click to get more information3
6
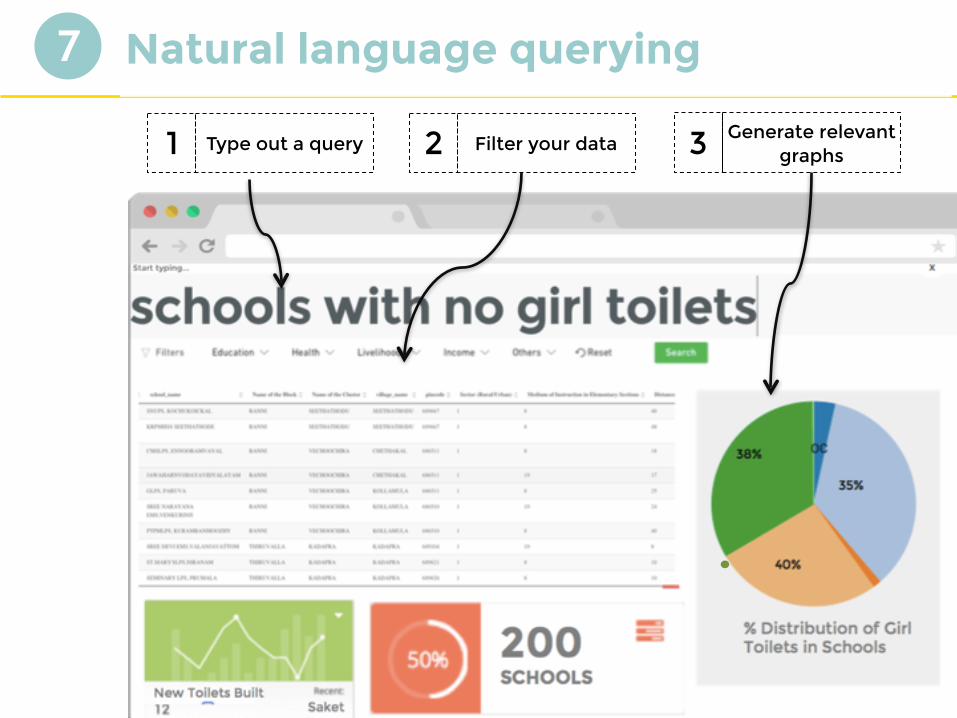
Natural language querying
Type out a query1 Filter your data 2 Generate relevant graphs3
7
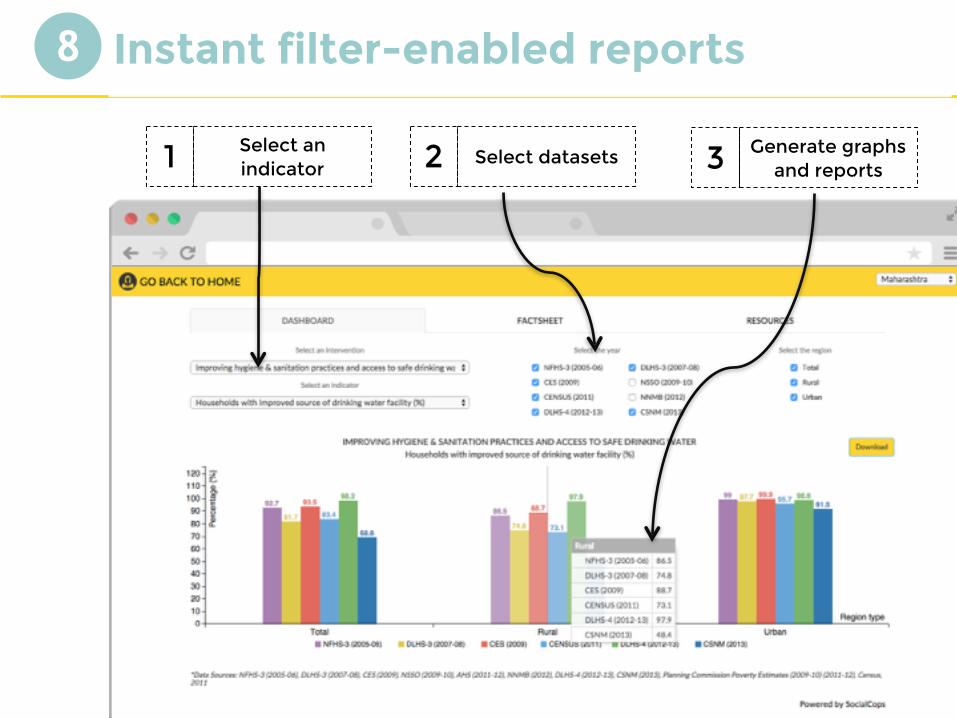
Instant filter-enabled reports
Select an indicator1 Select datasets2 Generate graphs
and reports3
8

Dynamic index generation
Select a district1Click to see in-depth indicators2Hover over to get
quick insights3
9

DATA CLEANING, PREPARATION, & ANALYTICS CAPABILITIES
2


Load datasets and highlight changes in
the columns1
Select operation from automatic
suggestions2
Record required operations and clean
similar datasets3

Categories of analytics
Multi-polar cloud-based analytics1 Machine learning
algorithms2
Trajectory data mining & pattern recognition
3 Predictive analytics 4
Cognitive computing5 Fluid
analytics6

DATA COLLECTION CAPABILITIES
▪ Mobile app ▪ Citizen crowdsourcing ▪ Web form ▪ SMS, USSD, IVRS
3


1. Create questionnaire on Web Dashboard
2. Apply skip logic, validations, and conditionality
3. Renders Android app in seconds
4. Enter accurate data offline

Citizen-based crowdsourcing app deployed for Swachh Bharat Mission

CASE STUDIES We are proud to have deployed our platform for over
150+ organizations in 7+ countries.

PROBLEM STATEMENT Developing budgets and aligning village development plans to create a model constituency for 264 villages
Government of AP (Krishna district) and Tata Trusts leveraged our platform to conduct census data collection and analyze the data in real time.
Spread 1 million people, 264 villages
Granularity Household level
Step 1 Data Collection Via our mobile-based data collection platform
Step 2 Data Quality Checks and Analysis Happening in real time
Step 3 Data Visualization Map-based dashboard (village level) Map-based querying Village profile dashboard Household level geo-dashboard
1
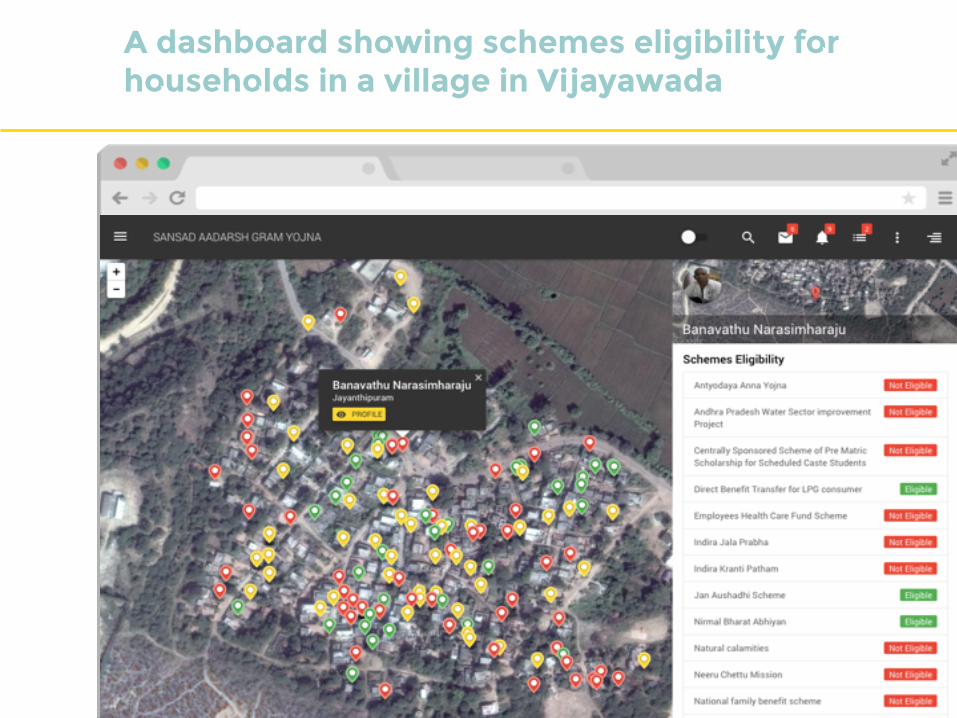
A dashboard showing schemes eligibility for households in a village in Vijayawada

PROBLEM STATEMENT Tracking progress of the Sansad Adarsh Gram Yojana in real time from 700 villages
Ministry of Rural Development is leveraging our platform to track the progress of and monitor impact for SAGY villages
Spread 700 villages
Granularity Village level
Step 1 Data Collection Via our mobile and web-based data collection platform
Step 2 Data Quality Checks & Analysis Happening in real time
Step 3 Data Visualization Real-time dashboard for tracking and progress indicators
2

A dashboard showing real-time village progress using data filled by nodal officers.

PROBLEM STATEMENT Comparing Right To Education parameters across India to understand which districts need more funds and attention
Oxfam India leveraged our platform to visualize secondary education data across 150+ indicators
Spread 14 lakh schools
Granularity District level
Step 1 Data Aggregation 150+ variables
Step 2 Data Indexing, Cleaning, and Preparation Happening in real time
Step 3 Data Visualization Map-based dashboard (district level) Map-based comparison
3
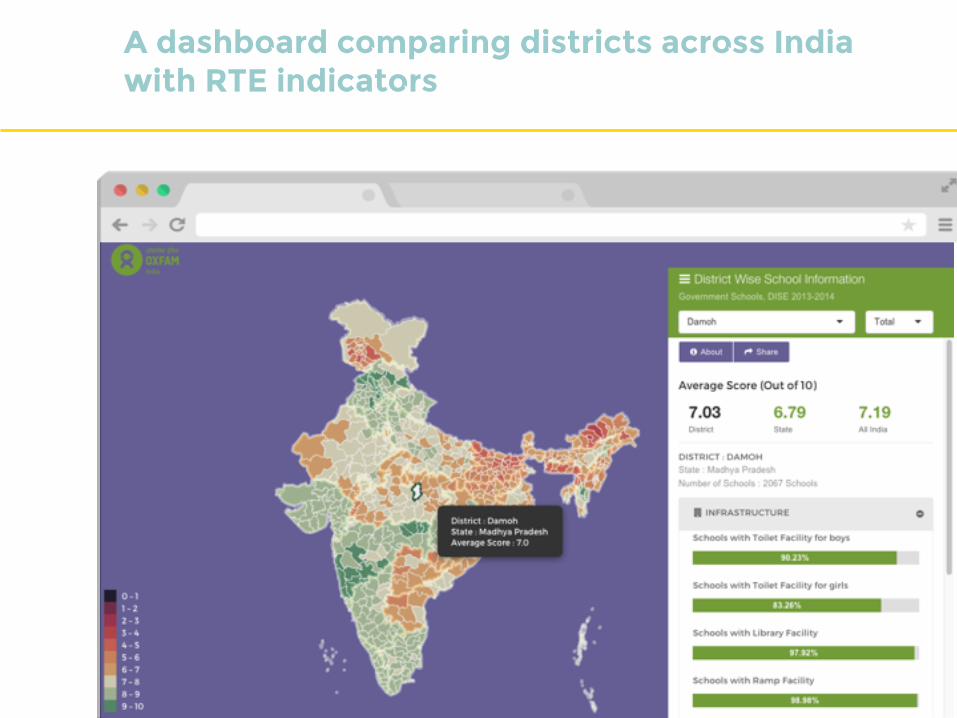
A dashboard comparing districts across India with RTE indicators

PROBLEM STATEMENT Knowing which districts to invest in to improve quality of life for small and marginal farmers in India
The Bill and Melinda Gates Foundation leveraged our platform to visualize secondary agriculture data across 233 indicators
States Bihar, Odisha, and Uttar Pradesh
Granularity District level
Step 1 Data Aggregation 2000+ variables
Step 2 Data Indexing, Cleaning & Preparation Happening in real time
Step 3 Data Visualization Map-based dashboard (district level) Map-based comparison
4

A dashboard comparing districts on agriculture parameters
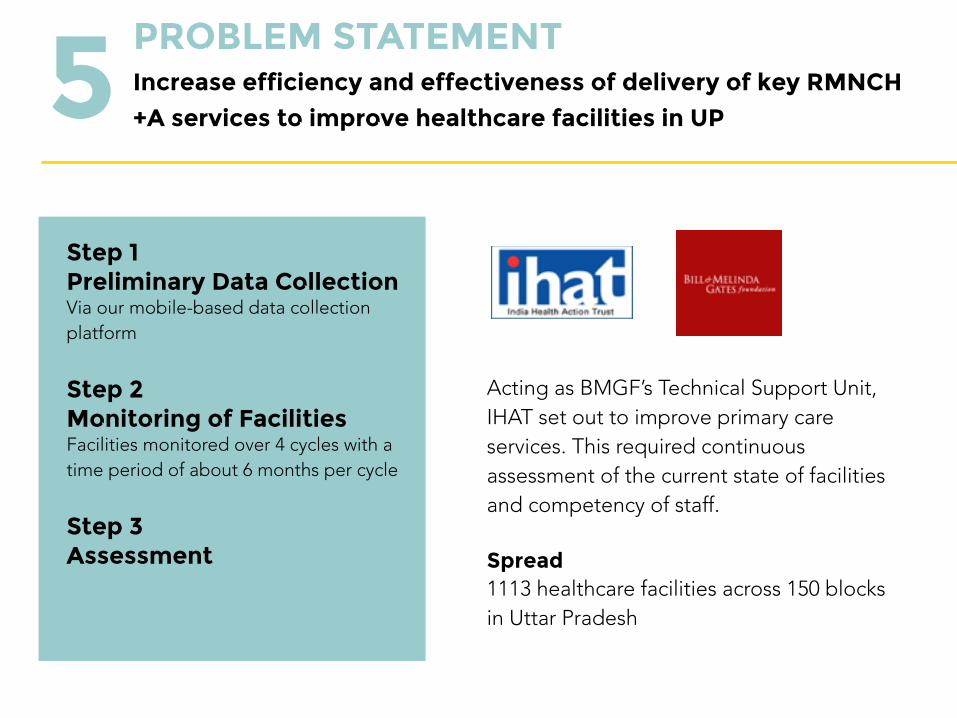
PROBLEM STATEMENT Increase efficiency and effectiveness of delivery of key RMNCH
+A services to improve healthcare facilities in UP
Acting as BMGF’s Technical Support Unit, IHAT set out to improve primary care services. This required continuous assessment of the current state of facilities and competency of staff.
Spread 1113 healthcare facilities across 150 blocks in Uttar Pradesh
Step 1 Preliminary Data Collection Via our mobile-based data collection platform
Step 2 Monitoring of Facilities Facilities monitored over 4 cycles with a time period of about 6 months per cycle
Step 3 Assessment
5
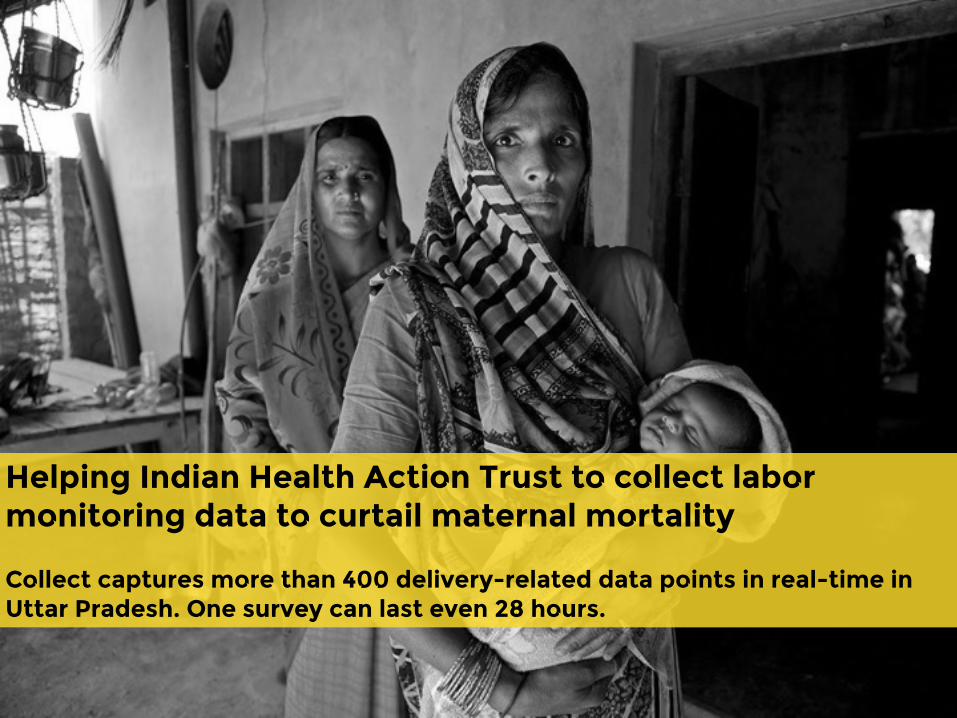
Helping Indian Health Action Trust to collect labor monitoring data to curtail maternal mortality
Collect captures more than 400 delivery-related data points in real-time in Uttar Pradesh. One survey can last even 28 hours.

PROBLEM STATEMENT Using mobile technology to optimize disaster relief efforts during the Nepal Earthquake6
Step 1 Registering donors Via our mobile-based data collection platform
Step 2 Generating e-receipts Based on the information entered, Goonj donors receive an e-receipt via SMS or email.
Step 3 Tracking of relief material
Goonj, an NGO, focuses on providing relief material to disaster-stricken areas by mobilizing inventory at large scale.
Spread Operations supported over 3 months

GOONJ uses Collect to manage internal logistics and disaster relief operations for the Nepal Earthquake.
GOONJ turns over 5,00,000 kg of throwaway waste into traditional mattresses/quilts across 21 Indian states.

Featured on Fortune’s 2015 and 2016 lists of 40 under 40.
RECOGNITION
Featured on Forbes India’s 2015 list of 30 under 30.
One of the top 10 emerging companies of 2015.

Including:
United Nations World Youth Summit Award
Microsoft Global Social Entrepreneurship Competition
IBM Smarter Planet Challenge & some more from IITs, IIMs & NUS.
The work we’ve done at the intersection of technology, data and people to have a positive influence on society have won us awards at the global level.

Rajan Anandan Managing Director, Google India Investor & Advisor
“In terms of scale, from his portfolio, Rajan Anandan (MD, Google India) is particularly bullish on SocialCops. SocialCops sees its five-year goal as being able to power products like Google Maps with social data” – Economic Times
Dr. Hema Divakar Former President, Federation of Gynecological Societies of India
Anurag Banerjee General Manager, Mobilewalla APAC (Previously MD, Jana)
Naman Pugalia Previously Policy Advisor, Google India
OUR ADVISORS

Bernise Ang Singapore Woman of the Year 2011, Founder, SYINC
Carol Sanford Innovation Advisor Google; Award Winning Author
Pankaj Jain Venture Partner, 500 Startups
OUR ADVISORS
Manoj Menon Managing Director, Frost and Sullivan APAC Investor & Advisor
“We are limited only by our imagination in terms of how technology can address the challenges facing humanity. SocialCops is well poised to play an important role in helping shape a better future”

“IT’S CREATING A VOICE FOR THE PEOPLE”
- Fast Company
“TRACKING DATA THAT SOLVES PROBLEMS IS THEIR MISSION”
- Economic Times
“DATA SOURCED FROM THE GRASSROOTS AND INSIGHTS FROM IT CAN YIELD FOCUSED AND SPEEDY PUBLIC INTEREST DECISION MAKING”
- LiveMint
PRESS & MEDIA
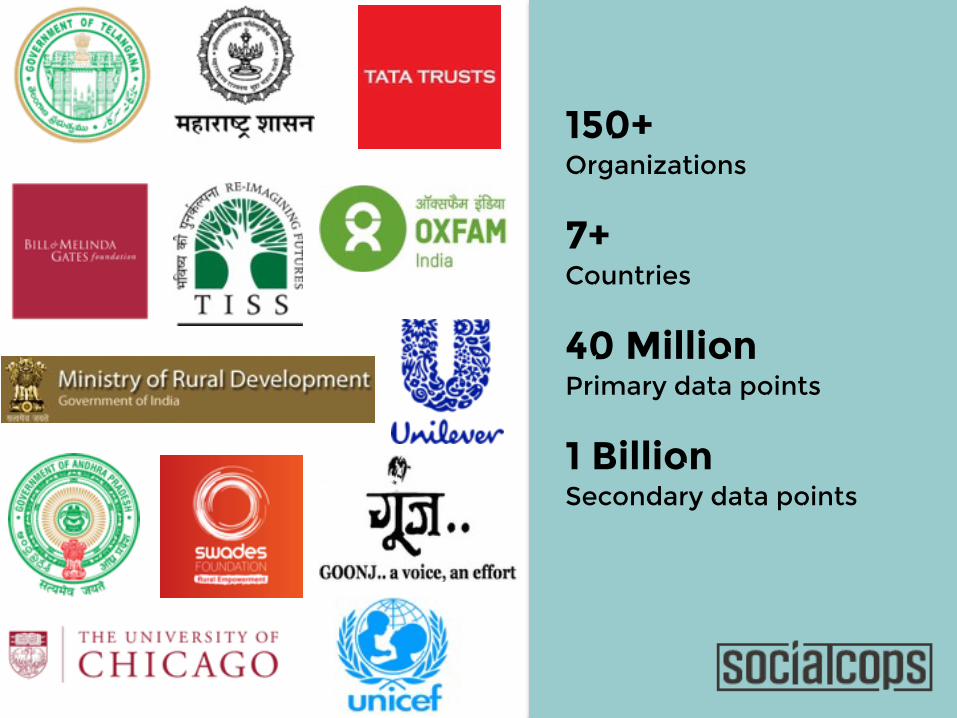
150+ Organizations7+ Countries40 Million Primary data points 1 Billion Secondary data points