enabling technology for more pervasive and responsive
TRANSCRIPT

Enabling Technology for more Pervasive and Responsive Market Risk Management
Systems
Book Chapter for The Risk of Investment Products
Authors
Matthew Dixon1, Jike Chong
2,3 and Kurt Keutzer
3
Abstract
This chapter is intended as a GPU primer for risk IT managers. It identifies some of the key
technical challenges facing managers in deploying risk engines on this technology and
demonstrates a collaborative solution approach between managers, systems design researchers
and quantitative developers. By following this approach, we show how to speedup a GPU
baseline implementation of a Monte Carlo based daily VaR estimate with 4000 risk factors by as
much as 169x. Our results suggest that with GPUs, ‘on-demand’ VaR estimation to supplement
overnight batch processes and more pervasive stress testing in large-scale risk infrastructure are
becoming a reality.
1 Introduction
While the microprocessor industry has recently introduced transformative computing capabilities
in the form of C++ programmable graphics processing units (GPUs), its potential for quantitative
1 Department of Mathematics, One Shield's Avenue, UC Davis, CA 95616
2 Parasians, LLC, Sunnyvale, CA 94086
3 Department of Electrical Engineering and Computer Science, Soda Hall, UC Berkeley, CA 94720

risk estimation is currently unrealized despite the flaws in risk infrastructure highlighted by the
latest financial crisis.
In January of 2009, the Bank for International Settlements released a consultative paper on the
principles for sound stress testing practices and supervision (BIS, 2009). The paper raises
fundamental issues including the weaknesses in risk infrastructure that limited the ability of
banks to identify and aggregate exposures across the bank and the effectiveness of risk
management tools, including stress testing. The paper also calls for further investments in IT
infrastructure to enhance the availability and granularity of risk information, needed for timely
analysis and assessment of the impact of new stress scenarios designed to address a rapidly
changing environment.
Most UK and Germany based firms who partook in a recent anonymous survey by a leading
database vendor (GARP 2010), indicate that they have responded to the crisis with plans to
invest more in risk systems, improve integration of information systems and, in many cases,
move to more frequent updating and valuation of global financial market risk in accordance with
the July 2009 revisions to the Basel II market risk framework (BIS, 2009a).
In stepping up to this revised framework, quantitative risk managers in financial institutions are
facing a number of technical challenges, both in the short and the longer term. A few key
challenges being currently tackled across the industry are:
The need for a more extensive set of market risk factors to capture the risks across all
markets in which the firm is exposed;

The estimation of the 99% VaR (the 1-in-100 maximum loss event) on a daily basis with
an assumed minimum holding period of ten days. A 'stressed' VaR should also be
calculated weekly. Historical datasets, used for VaR estimation, should be updated
whenever there is a 'material change' in market prices; and
The use of simulated stress scenarios to test the current portfolio against past periods of
'significant' disturbance and evaluate the sensitivity of the bank's market risk exposure to
changes in the assumptions about volatilities and correlations.
As the survey reveals, over a third of these firms indicated that the current risk infrastructure
isn’t fast enough for the needs of the business and only approximately 5% of the firms currently
perform complex risk analysis on portfolios and global positions in real time. Participants point
to the gap between IT and business domain expertise as being one of the major sources of
dislocation in the deployment of risk management systems. This calls for a more comprehensive
approach to the design and deployment of complex risk analytics with a stronger emphasis on
using financial domain knowledge and expertize to enhance the software optimization process.
1.1 Overview
This chapter is primarily intended for risk IT managers in financial institutions responsible for
maintaining and developing quantitative market risk infrastructure and are looking to new
hardware technology as a way to improve the performance of existing risk infrastructure and
pave the way for more comprehensive and responsive quantitative market risk infrastructure
across a financial institution.

For completeness, this chapter provides:
1) An introduction to computing with GPUs, identifying the recent breakthroughs that
eases its adoption, its current deployment status in the finance industry, and going
forward, the key challenges that the deployment of this technology faces;
2) An overview of the critical considerations in the optimization of Monte Carlo based
applications on GPUs. Focusing on market Value-at-Risk (VaR) engines, the core of
financial institutions' market risk analytics, we show that these considerations guide the
management of a team of programmers in realizing the potential of the GPU. The
description of this solution approach in Sections 3 and 4 is the primary contribution of
this chapter;
3) Sample performance benchmarks to illustrate the potential performance gains from
optimization of a VaR engine - a decisive factor in cost-benefit analysis of GPU
deployment; and
4) Example applications where GPUs may improve the responsiveness and pervasiveness
of market risk management systems.
2 Use of Multicore and Manycore Microprocessors in the Finance Industry
We review the current status of the microprocessor industry with the caveat that this chapter is
not about comparing the GPU against the CPU in order to identify a winning candidate. As we
shall explain, the two are quite separate and each has their own merits which the reader should
keep in mind.

Modern CPUs are multicore devices, largely designed to run serial code very efficiently. They
provide myriad hardware features to improve performance while remaining transparent from the
programmer. However the rate of performance improvements for a CPU core is slowing, instead,
multiple cores are being placed onto a single device. Multiple cores can provide better
performance when the application can take advantage of the parallel compute resources they
provide. A number of software technologies are being developed by CPU hardware manufactures
to facilitate this task, including packages such as OpenMP [ref] and Thread Building Block [ref].
But ultimately, there is no guarantee of scalable application performance on multicore
architectures without recompilation or recoding of the code base for existing applications.
GPUs are manycore microprocessors that are fundamentally different from CPUs: rather than
provide complex hardware and features to run through a few threads, or sequences of
instructions, as fast as possible, they instead allocate the vast majority of the silicon area to
relatively simple processing units to increase total instruction throughput with the assumption
that there is going to be hundreds to thousands of threads that can be executed at the same time.
As a result GPUs are particularly suited to computationally intensive applications with a high
degree of independence between the individual computations, which is referred to as
'parallelism'.
GPUs are ideal for simulation based risk estimates, such as VaR and economic capital (EC) on
the global positions of financial institutions. Here, estimation typically requires a small set of
parameters to setup the estimation process, involves a large amount of independent computation,
and outputs a concise set of risk profiles as the result. Consequently, software architects and

developers can expect to significantly reduce execution time and improve the performance for
VaR type estimations, provided that they can re-architect the code to 'expose' its parallelism and
avoid too much data movement between the units of execution.
GPUs are no panacea. While they can be programmed in CUDA (NVIDIA, 2010), a
programming environment based on C++ with minor keyword extension, high performance
implementations require detailed knowledge of the vector instruction limitations, memory
hierarchy characteristics, and cross-thread synchronization capabilities. GPU programming calls
for technical skills outside those held by a typical software architect or programmer working in
the finance industry and significant experience is required to architect highly parallel
implementations to avoid the many pitfalls in parallel programming.
Whilst the need to improve risk infrastructure remains firm, the prevailing response to GPU
technology by the risk IT managers that we have interviewed has been hesitance. This appears to
partially stem from both a reluctance to modify existing VaR engine implementations and
anticipation of rivaling technology breakthroughs to achieve this. This response is partially
justified because it is difficult to estimate the true cost of migrating risk engines to GPUs. The
wide range of developer expertise makes performance improvements hard to quantify. A further
legitimate concern amongst risk IT managers has been the dependence on a hardware vendor
through the apparent need to use CUDA, the proprietary programming language for GPUs.
On the other hand, few experts would concur that multicore computing technology is
undoubtedly here to stay and there is general consensus amongst software experts that legacy

serial code won't be compatible with parallel computation platforms without programmer
intervention. Moreover, GPU technology has been heavily adopted by many other industrial
sectors and there is widespread agreement amongst application developers that GPUs offer
transformative computing capability.
The concern over dependence on hardware vendor technology has been addressed through the
introduction of the OpenCL programming standard (Munshi, 2010) to enable code to be executed
on either GPUs or multicore CPUs. The software infrastructure available to support the
development of GPU applications is extensive and numerous technology consultancies have the
expertise to support migration projects.
A number of investment banks and financial data vendors have already adopted the GPU
technology. In some of these cases, the quantitative technology groups had already developed
legacy parallel systems and distributed computing clusters, long before the advent of GPUs and
the move to GPUs can therefore be perceived as a 'warm start'. The purpose of this chapter is to
explain and demonstrate how GPUs can be integrated into risk infrastructure when there has
been no prior use of parallel computing technology by an in-house team of developers.
We begin by revisiting a widely used model of market VaR on a group-wise portfolio and
introduce our GPU based solution approach in the context of this model.
3 Monte Carlo based Market VaR Estimation

Market VaR estimation uses the Monte Carlo method to simulate the price of a portfolio based on
the state of a number of random market risk factors. The Monte Carlo method is a general
approach where the solution to some problem is estimated by statistically sampling the problem's
parameter space with thousands to millions of experiments using different parameter settings
(Chong, Gonina and Keutzer, 2010). The ease and intuitiveness of setting up the experiments
makes the Monte Carlo method a popular approach (Glasserman, 2003).
The Monte Carlo method has several properties that make it desirable for implementation on a
high performance GPU accelerator:
Experiments are independent and parallelizable: the approach assumes that experiments
are independent and identically distributed (i.i.d.), such that the set of experiments
provides a statistically valid sampling of the parameter space. This independence between
experiments provides significant parallelization opportunities for GPU-based
implementations.
Execution is computationally expensive: by the law of large numbers, the statistical error
(standard error) in the solution is proportional to the inverse square-root of the
experimental size, i.e. to achieve 10x more precision in the result, one needs to run 100x
more experiments. The GPU-based implementation can provide the necessary speedup to
allow many problems to become computationally feasible.
Input specifications and results are concise: the Monte Carlo method takes a small set of
experiment parameter inputs, generates thousands to millions of experiments, executes
them, and assimilates the results as a single solution. There is a large amount of
computation consumed with little input/output data transferred. This is ideal for GPU-

based implementations, as input/output data has to be transferred between the CPU and
the GPUs and all computation is performed on the GPU.
3.1 Solution structure
A typical implementation of the Monte Carlo method involves the simple solution structure
illustrated in Figure 1, where experiments are generated, executed, and the experimental output is
assimilated to provide a concise estimate. The perspectives and considerations that guide the
implementation of the Monte Carlo method are described more fully in Section 3.
Figure 1: The solution structure of a VaR implementation.
Market VaR estimation is computationally expensive when the number of market risk factors
required to capture market movements grows large. Major banks model the joint probability
distribution of hundreds, or even thousands, of market risk factors (Youngman 2009) across
many financial markets in order to estimate their group level VaR. So although a comparatively
small set of parameters is required to setup the estimation process, experiment execution requires
a large, but independent amount of computation.
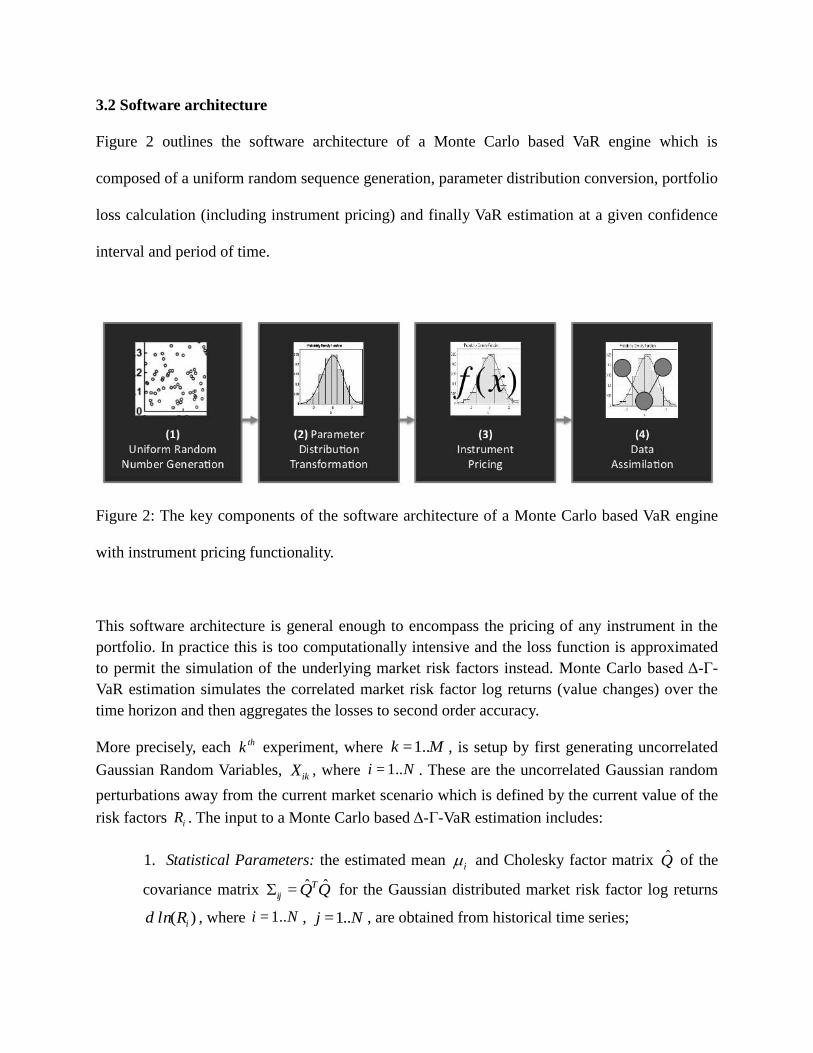
3.2 Software architecture
Figure 2 outlines the software architecture of a Monte Carlo based VaR engine which is
composed of a uniform random sequence generation, parameter distribution conversion, portfolio
loss calculation (including instrument pricing) and finally VaR estimation at a given confidence
interval and period of time.
Figure 2: The key components of the software architecture of a Monte Carlo based VaR engine
with instrument pricing functionality.
This software architecture is general enough to encompass the pricing of any instrument in the
portfolio. In practice this is too computationally intensive and the loss function is approximated
to permit the simulation of the underlying market risk factors instead. Monte Carlo based Δ-Γ-
VaR estimation simulates the correlated market risk factor log returns (value changes) over the
time horizon and then aggregates the losses to second order accuracy.
More precisely, each thk experiment, where Mk 1..= , is setup by first generating uncorrelated
Gaussian Random Variables, ikX , where Ni 1..= . These are the uncorrelated Gaussian random
perturbations away from the current market scenario which is defined by the current value of the
risk factors iR . The input to a Monte Carlo based Δ-Γ-VaR estimation includes:
1. Statistical Parameters: the estimated mean i and Cholesky factor matrix Q̂ of the
covariance matrix QQT
ijˆˆ= for the Gaussian distributed market risk factor log returns
)( iRlnd , where Ni 1..= , Nj 1..= , are obtained from historical time series;

2. Delta term: i , where Ni 1..= , is the sensitivity of the portfolio to a change in the log
of the th
iR market risk factor;
3. Gamma term: i and ijU , where NjNi 1..= ,1..= , are the eigenvalues and
orthogonal matrix of column eigenvectors of the s.p.d. matrix jnij
T
mi QQ ˆˆ , ij is the
sensitivity of i to a change in the log of
th
jR market risk factor. Since the s from
simple models of instrument prices typically only depend on one or a small number of
risk factors, is generally sparse and sometimes even diagonal;
4. Percentile for VaR evaluation: is typically either 1% or 5%; and
5. Time horizon: the duration of the simulation is typically at least a day and is measured
in units of years.
3.3 Experiment execution
The execution of each thk experiment outputs the change of value of the portfolio kdP using the
(rotated) ∆-Γ approximation
,2
1= 2
,
ga mma
iki
delta
iki
ji
k XYdP (1)
where jkijiik XQY = are the correlated Gaussian random variables obtained from multiplying
the (rotated) Cholesky matrix factor UQQ ˆ= with the i.i.d. standard Gaussian random variables
ikX . Expressing the approximation in rotated random variables simplifies the expression in the
gamma term4.
Hundreds of thousands of experiments are typically required to reduce statistical error in the
estimated distribution of dP to an acceptable precision. The results of these experiments are
sorted and a percentile is chosen according to user selection.
4 Readers more familiar with the approximation in original variables should refer to (Glasserman, 2003) for further
details of the coordinate transformation.
It is here that we arrive at the main contribution of this chapter, namely the description of the
optimization of a ∆-Γ-VaR implementation required to take advantage of GPUs. Recall from
Figure 2 that there are four major components of a VaR engine which translate to the steps of the
∆-Γ-VaR implementation shown in Figure 3a. Steps 1 and 2 implement the experimental
generation, step 3 aggregates the portfolio loss for each scenario, and step 4 assimilates the
results over all scenarios.
As shown in Figure 3, a ∆-Γ-VaR implementation executes one step at a time, with intermediate
results written out to memory. Figure 3(c) illustrates the structure of an optimized
implementation which involves both merging and blocking the steps to leverage the many levels
of memory hierarchy on the GPU platform.

Figure 3: (a) The four key steps of a Monte Carlo based ∆-Γ-VaR implementation. (b) A
depiction of the computation inherent in these four steps and (c) in a GPU optimized
implementation.
The illustration in Figure 3(c) is by no means representative of a comprehensive software
optimization, however. In order to access a wider set of software optimizations, it is necessary to
draw upon a more general approach for software optimization, which will be discussed in the
next Section. We will see that adopting this approach will lend itself to the project management
of software migration and ultimately lead to a more collaborative schedule of team activity.
4 Optimization of Risk Engines Deployed on GPUs
Optimized deployment of applications on GPUs is based on a set of general considerations or
perspectives for enabling the potential of the hardware and avoiding common pitfalls which may
hamper the migration process. We propose organizing these optimizations into three perspectives
that require multi-disciplinary technical expertise:
Task perspective: Refactor the VaR implementation to make use of matrix computations.
In doing so, the quantitative developer can use existing highly parallel numerical library
routines for GPUs such as cuBLAS. A more advanced but powerful step reformulates the
loss aggregation in order to drastically reduce the amount of computation;
Numerical perspective: Choose the random number generator which leads to the fastest
convergence rate of the VaR estimates as measured by the standard error of the simulated
multi-variate distribution of risk factor returns. This perspective is typically based on
expertise in statistical computing; and
Data perspective: Design performance critical computations to best leverage the
capabilities of the underlying platform and scope the data set to reduce memory access
delays. This perspective is typically based on expertise in computer science and systems
engineering.
Organizing a VaR engine migration project in this way reveals its complex multi-disciplinary
nature. The task perspective requires the most in depth understanding of the VaR model in order
for a GPU implementation to be flexible enough to support various modeling assumptions, but
only to the extent foreseeable by risk modeling experts. Moreover, modeling assumptions
imposed to improve risk engine performance on CPUs may no longer be necessary on GPUs and
it may be advantageous to factor this into the migration process.
In the interests of conveying the technicalities and performance implications of various VaR
implementation optimizations, these perspectives will be now be described in more detail.
4.1 Task perspective
Optimization should identify known high-performance building blocks in the software
architecture and focus on leveraging existing implementation support infrastructure. This is done
by re-factoring algorithms to take advantage of existing fast library matrix routines.
For market VaR estimation, this involves understanding the relative performance of various
linear algebra routines and taking advantage of more efficient types of cuBLAS library
components. It also involves looking for opportunities to reformulate the computation in order to
reduce the amount of computation.
Because statistical sampling of the parameter space with the Monte Carlo method involves
running thousands to millions of independent experiments, the experiment execution step often
has the most amount of parallelism. For this reason, the evaluation of the ∆ term in the loss
function (equation 1, Section 3.3) can be efficiently implemented as a dense matrix computation
using existing well-parallelized cuBLAS library routines.
This dense linear algebra formulation is illustrated in Figure 4 for the ∆ component of the loss
function evaluation (excluding the drift term) with N risk factors and NM >> experiments.
The Figure shows how the random MN matrix Y is formed by matrix-matrix multiplication of
the NN Cholesky factor matrix and the uncorrelated Gaussian random MN matrix.

Figure 4: The correlation of random vectors is re-factored as a dense matrix-matrix
multiplication in order to use existing well-parallelized matrix libraries for GPUs.
Problem reformulation
Refactoring loss estimates to use random matrices rather than random vectors can also expose
bottlenecks in the algorithm which, in special cases, may be removed altogether. We continue
with a proof of concept using the form of the loss estimate shown in equation 1. Under the dense
linear algebra formulation, the ∆ component of the portfolio loss function computes in two steps
- (i) correlation of random matrices using matrix-matrix multiplication and (ii) estimation of the
loss by multiplying the correlated random matrix with the vector of positions.
It is possible to reformulate the computation of the ∆ component of the portfolio loss function to
avoid the first step. Instead, the Cholesky matrix factor Q and the vector is stored in a vector
Qq T:= using a call to the BLAS level 2 matrix-vector multiply function Sgemv. The ∆-Γ
approximation of the portfolio loss can then be re-written as:

.2
1== 2
ikiiki
ij
kkk XXqdPdPdP (2)
Precomputation of q this way reduces the amount of computation by a factor of the number of
risk factors N and removes a computational bottleneck. So this simple refactorization has
illustrated the importance of understanding the various steps of the algorithm and avoiding naïve
implementations, which although conceptually similar to serial implementations of VaR,
significantly hinder the performance.
Table 1 shows the comparative effect of the reformulated Monte Carlo algorithm on the time
taken (seconds) to evaluate ∆-Γ-VaR on an Intel Core i7 CPU processor and an NVIDIA GeForce
GTX 480 GPU. The numbers in parentheses are the loss estimating portion of execution times,
excluding the time for random number generation.
Timing (s) Standard Reformulated Speedup
CPU 457 (384) 73.9 (1.17) 6.18 (328 )
GPU 58.9 (58.5) 0.951 (0.540) 61.9 (108 )
Speedup 7.76 (6.56 ) 77.7 (31.5 ) 481 (711 )
We've taken 4000 normally distributed risk factors and generated several blocks of random
matrices in order to fit within the memory of the GPU. With a maximum block size of 32768 for
the available memory, 23 blocks ensures that approximately 7.5x10⁵ (753664) scenarios are
Table 1: The comparative timings (s) of the standard and reformulated Monte Carlo algorithm for
evaluating ∆-Γ-VaR on the GPU and CPU using 4000 risk factors with 7.5x10⁵ simulations. The
parenthesized values represent the times and speedup factors in just the loss function evaluation
step (Dixon et al., 2011).

generated to achieve 0.1% accuracy in the standard error of the loss distribution.
With the loss estimated in the form given by equation (1), we observe only a 7.76x speedup
going from baseline CPU to baseline GPU implementation. With the reformulated loss estimate
given by equation (2), we observe a 108x speedup for the loss estimation from baseline GPU
implementation to reformulated GPU implementation. Overall, reformulation enabled a 61.9x
speedup for the ∆-Γ-VaR estimation problem.
Overall, the reformulated algorithm performs 77.7x faster on the GPU than the reformulated
algorithm on the CPU.
4.2 Numerical perspective
Optimization should focus on improving the convergence rate of Monte Carlo based approaches
through careful selection of well-known techniques that have desirable numerical properties and
existing reference implementations shown to perform well on the GPU platform (Howes and
Thomas, 2007). For market VaR estimation, this involves the selection of high dimensional
quasi-random number generators (QRNG) and distribution transformation algorithms, such as
the Box-Muller algorithm (Box and Muller, 1958), that preserve Sobol's measure of uniformity -
'property A' (Bratley and Fox, 1988). Efficient generators should also use a 'skip-ahead' method
to efficiently generate sequences on parallel architectures.
As VaR estimation typically requires Gaussian random numbers, a distribution conversion
function must also be used to transform the uniform random sequence to a Gaussian random

sequence. The best choice of distribution conversion function isn't always obvious, however, and
the decision should be approached on a case-by-case basis. We illustrate a method for choosing
the best function.
Two of the most widespread functions are the Box-Muller method and the Moro interpolation
method (Moro, 1995). The former takes a pair of uncorrelated uniform random numbers on the
closed interval (0,1) and uses the polar coordinate transformation to generate a pair of
uncorrelated standard Gaussian variables. The Moro interpolation method, takes a single uniform
random number on the open interval [0,1] and draws a standard Gaussian variables using a
polynomial interpolation of the inverse cumulative Gaussian distribution function.
The convergence rate in the standard error of the portfolio loss distribution can be used as a
metric for choosing the best distribution method. It is also advisable to compare the ∆-VaR
estimate with the analytic estimate. The ∆-Γ-VaR can not be estimated analytically, of course, but
having an understanding of how the standard error compares with the ∆-VaR estimate error can
provide some intuition into the level of tolerance to choose for the standard error given a target
VaR estimate error.

Figure 4: (left) A comparison of the standard error (%) in the portfolio loss distribution using
Moro's interpolation method and the Box-Muller method applied to Sobol' sequences. (right) The
corresponding error (%) in the simulated 1 day portfolio ∆-VaR (c=95%) converges to the
analytic ∆-VaR (9.87%). Approximately twice the number of scenarios is required to estimate the
∆-VaR to within 0.1% when using Moro's interpolation method compared to the Box-Muller
method (Dixon, Chong and Keutzer, 2009).
.
The results of the comparison are presented in Figure 5 above. For 4000 risk factors,
approximately 1.5x10⁶ or 7.5x10
5 scenarios is sufficient to estimate the standard error of the loss
distribution to within 0.1% when using Moro's interpolation method or the Box-Muller method
respectively. This tolerance corresponds to an error in the ∆-VaR of 0.1%.
The primary criteria for choosing the Box-Muller method is that the standard error converges
twice as fast in single precision as when using Moro's interpolation method applied to the same
sequence of uniform quasi-random numbers.

4.3 Data perspective
Optimization should focus on improving the memory access patterns between the different stages
of an algorithm. For market VaR estimation, this involves identification of key data alignment
needs between parameter generation and risk estimation, and the application of flexible data
blocking strategies that maximally leverage the shared memory resources (or local scratch-pad
memory).
There is a significant amount of intermediate results that must be managed between the four
steps of the VaR implementation shown in Figure 3a. In a basic implementation, as shown in
Figure 3b, the steps are executed one step at a time. The amount of intermediate data can be 10s
of MBytes. Storing them out to off-chip memory after one step and bringing them back in for the
next step can be costly, especially when steps such as Step 1 and Step 2 require very little
computation.
The need to maintain large intermediate result working sets is not required by the application. It
is usually put in place to achieve function modularity in large projects. To optimize the
implementation for execution on GPUs, one must re-evaluate the software architecture trade-offs
and work towards minimizing the number of data movements, which can dominate the execution
time of an implementation.
In the case of the VaR implementation, merging the uniform random sequence generation and
the distribution conversion steps provided significant performance boost. The distribution
conversion step can be executed in place as soon as the uniform random values are generated, as

illustrated in Figure 3c. This cuts out the execution time associated with writing out the results to
device memory and reading them back.
Table 2 illustrates the impact of kernel merging on two functionally similar methods - the Box-
Muller and Bailey's methods5. The comparative performance impact illustrates another important
issue with migrating software to GPUs, namely the sensitivity of the kernel merging
optimization. The Box-Muller method was sped up by 2.63x through merging the steps, whereas
the Bailey's method sustained only a 1.16x speedup.
On first inspection this appears quite counter-intuitive given that the implementation of the Box-
Muller method and the Bailey's method are almost identical. These extra parameters, however,
increase the footprint of the compiled kernels to the extent that they don't fit neatly into on-chip
memory and spill off into off-chip memory.
Timing (s) Standard Optimized Speedup
(Separate) (Merged)
Box-Muller
(step1)
0.128 0.156 2.63x
(step2) 0.282
Bailey
(step1)
0.128 0.441 1.16x
(step2) 0.384
Table 2: GPU Implementation cost in seconds for setting up 7.5x10⁵ experiments each with 4000
risk factors (Dixon et al., 2011).
5 Bailey's method (Bailey, 1994) also makes use of a polar coordinate transformation of uniform random variables.
Unlike the Box-Muller method, however, it produces student-t distributed random variables which give fatter tailed
loss distributions (Jorion, 2007).

4.4 Summary of software optimization
By assimilating these three perspectives, we built up a comprehensive set of considerations for
effectively utilizing the GPU implementation support infrastructure in developing financial
applications and achieved a 169x speedup in VaR, as shown in Table 3. The columns in the Table
represent the three steps of execution in the VaR estimation and the content specifies the absolute
and proportional timings of the steps.
Timing (s) QRNG Distribution
Conversion
Loss
Evaluation
Baseline
GPU
0.257 0.564 117
(0.22%) (0.48%) (99.3%)
Problem
Formulation
- - 1.08
(13.5%) (29.7%) (56.8%)
Module
Selection
0.129 0.282 0.540
(13.6%) (29.6%) (56.8%)
Kernel
Merging
0.156 -
(22.4%) (77.6%)
Speedup 5.27x 217x
Total
Speedup
169x
Table 3: The overall speedup on the GPU obtained by applying all three optimizations to a ∆-Γ-
VaR estimate on a portfolio with 4000 risk factors, simulated to achieve a standard error in the
normal loss distribution within 0.1% (Dixon et al., 2011).

Our baseline GPU (NVIDIA GeForce GTX 480) implementation of MC-VaR is a straight-
forward port from the CPU implementation and has a 7.76x speed advantage over an Intel i7
Q920 eight-core CPU based implementation. By reformulating the VaR estimate to reduce the
amount of computation, we achieved a 61.9x speedup. Use of a Box-Muller algorithm to convert
the distribution gives an additional 2x speedup over interpolating the inverse of the Gaussian
distribution function.
Finally we merged the data-parallel computational kernels to remove redundant memory transfer
operations leading to an additional 2.63x speedup. The overall speedup of 169x against the
baseline GPU implementation, reduces the time of a VaR estimation with a standard error of
0.1% from minutes to less than one second.
The optimization approach also provides clear interfaces for collaboration within a research and
development project and facilitates potentially faster and smoother integration across domains of
expertise. This is because quantitative risk developers will tend to have more expertise from the
numerical perspective, whereas systems engineers and IT specialists will typically have a
sounder understanding from the data perspective. The task perspective facilitates the integration
of expertise across both domains as it requires an understanding of the loss aggregation and
instrument pricing in addition to software performance analysis and design.
5 Risk Infrastructure Improvements
This chapter has so far considered the implementation of Monte Carlo based financial market
VaR estimation on GPUs from three perspectives - the task, the numerical and the data

perspectives. The reported level of performance increase achieved in following this approach
implies not only a significant reduction in time taken to run daily VaR estimates, but more
generally calls for revision of existing quantitative risk infrastructure which is currently unable to
operate in near real-time.
Going forward, risk managers should be able to access and re-evaluate compute intensive market
risk analysis without delay. This is a highly non-trivial task when the number of risk factors used
in the estimate is very large, instrument pricing is comprehensive and VaR estimates are
simultaneously required over a hierarchy of business units in a global financial institution.
EC estimation with a larger number of risk factors becomes more computationally intensive
because the number of stressed scenarios needed for convergence is typically much higher than
for daily VaR. Furthermore, stressed VaR requires the identification of different regimes in time
series data- a process which is highly sensitive to statistical assumptions and filtering techniques.
In order to reduce model risk, it may therefore be prudent to perform stress tests under various
modeling assumptions.
The qualitative impact of GPUs on these specific improvements to the risk infrastructure are
briefly outlined in Table 4 below. By following our approach to expose the parallelism of the
application and use high performance matrix computations, larger numbers of risk factors can be
used in existing daily VaR estimates and stress tests. The latest generation of GPUs based on the
Fermi architecture also allows for different types of computations to be performed in parallel,
thus potentially enabling full Monte Carlo based VaR rather than just a ∆-Γ approximation.

The ability to estimate ∆-Γ-VaR on large portfolios in near real-time opens up the possibility of
an interactive tool for reconfiguring risk aggregation at various levels of an institutional
hierarchy and refining VaR based trading limits on business units (Saita, 2007) in response to
their intra-day trading activities.
Challenges Solution approach GPU solution
Increase the
pervasiveness of stress
tests and risk estimation
Increase the number of market risk
factors used and compare a wider
set of modeling assumptions
GPUs are ideally suited to
large matrix computations
Extend pricing
functionality in daily VaR
estimates, aggregated at
the group level
Increase the accuracy of VaR by
accounting for complex features of
financial instruments
The new Fermi GPU
architecture enables
different financial
instruments to be fully
priced in parallel
On-demand hierarchical
VaR estimation
Customize risk aggregation in real-
time to sharpen VaR based risk
limits on trading units
GPUs provide near real-
time ∆-Γ-VaR estimates on
large portfolios
Table 4: Examples of specific improvements to market risk infrastructure obtainable through
using GPUs.

6 Summary and Outlook
This chapter explains how GPUs can be used to improve quantitative risk infrastructure and
identifies some of the key technical challenges and solutions to effective deployment of Monte
Carlo based risk engine on GPUs. The core of the chapter presents a general solution approach
for performance optimization which lends itself to the management of a multi-disciplinary team
of analysts, developers and systems engineers.
For a daily ∆-Γ-VaR estimate on a portfolio of 4000 risk factors and we have demonstrated a
169x increase in performance on a NVIDIA GeForce GTX480, reducing the absolute solution
time to under a second. We further show that this solution approach is not limited to simple
modeling assumptions such as normality of risk factors returns by presenting performance results
of a GPU implementation of Bailey’s algorithm for student-t distributions, known to produce
fatter-tailed loss distributions. Finally, we briefly explore the new capabilities that GPU
computing can potentially provide, such as on-demand hierarchical VaR estimation and ‘full’
Monte Carlo based VaR estimation on group-wise portfolios.
The finance industry does perceive the existence of a GPU adoption barrier, partly because it is
borne out of a different compute paradigm, namely parallel computing. The GPU industry has
matured to the extent that GPU computing has become more mainstream - quantitative
developers can quickly use software building blocks to optimize programs without specialist
expertise. GPUs are no panacea of course and shared research expertize in computational finance
and risk analysis is vital in targeting the technology to the most challenging applications,

quantifying expected performance improvements, and ultimately overcoming technology barriers
to ‘on-demand’ fully re-configurable market risk stress testing and analytics.
Bibliography
Bailey R. (1994) “Polar Generation of Random Variates with the t-Distribution.” Mathematics of
Computation, 62: 779-781.
BIS (2009) “Principles for Sound Stress Testing Practices and Supervision Consultative Paper.”
Bank for International Settlements Paper, January.
BIS (2009a) “Revisions to the Basel II Market Risk Framework.” Bank for International
Settlements Paper, July.
Box G. E. P. and Muller M. E. (1958) “A Note on the Generation of Random Normal Deviates.”
Ann. Math. Statist., 29 (2): 610-611.
Bratley P. and Fox B.L. (1988) “Implementing Sobol's Quasirandom Sequence Generator.” ACM
Trans. on Math. Software, 14(1): 88-100.
Chong, J., Gonina, E., Keutzer, K. (2010) “Monte Carlo Methods: A Computational Pattern for
Parallel Programming.” 2nd Annual Conference on Parallel Programming Patterns
(ParaPLoP'10), Carefree, AZ.
Dixon, M.F., Bradley T., Chong, J. and Keutzer, K. (2011) Monte Carlo Based Financial Market
Value-at-Risk Estimation on GPUs. In: Wen-mei Hwu (Ed.), GPU Computing Gems: Vol 2,
NVIDIA.

Dixon, M.F., Chong, J. and Keutzer, K. (2009) “Acceleration of Market Value-at-Risk
Estimation.” WHPCF '09: Proceedings of the 2nd Workshop on High Performance
Computational Finance: 1-8.
GARP (2010) “Risk Management Systems in the Aftermath of the Financial Crisis Flaws, Fixes
and Future Plans.” GARP report prepared in association with SYBASE.
Glasserman P. (2003) Monte Carlo Methods in Financial Engineering, Stochastic Modelling and
Applied Probability, 53, Springer.
Howes L. and Thomas D. (2007) Efficient Random Number Generation and Application using
CUDA. In: H. Nguyen (Ed.), GPU Gems 3: ch. 37, NVIDIA.
Jorion P. (2007) Value-at-Risk: the New Benchmark for Managing Financial Risk. McGraw-Hill:
New York, 3rd ed.
Moro B. (1995) The Full Monte, Risk Magazine 8(2): 57-58.
Munshi, A., (2010), “The OpenCL 1.1 Specification, rev 33”, Khronos OpenCL Working Group,
[Online], http://www.khronos.org/registry/cl/specs/opencl-1.1.pdf
NVIDIA, (2010), NVIDIA CUDA Programming Guide, Version 3.1, [Online], URL:
http://www.nvidia.com/CUDA
Saita, F. (2007) Value at Risk and Bank Capital Management. Elsevier.
Youngman, P. (2009) “Procyclicality and Value-at-Risk.” Bank of Canada Financial System
Review Report, June: 51-54.