end of life care data in yorkshire and humber scn · end of life care data in yorkshire and humber...
TRANSCRIPT
End of Life Care Data in
Yorkshire and Humber SCN
Julia Verne, Katie Lindsey, Luke Hounsome, Andy Pring, Robert Mulliss,
Columbus Ohaeri, Shivaun Fleming
National End of Life Care Intelligence Network, Public Health England

Source: ONS
Number of deaths (all ages) by gender, Yorkshire and Humber SCN 2004 - 2013

Percentage distribution of deaths by age band, Yorkshire and Humber SCN 2004 - 2013
Source ONS

Percentage of deaths by age group and CCG, Yorkshire and Humber 2004 - 2013
Source ONS
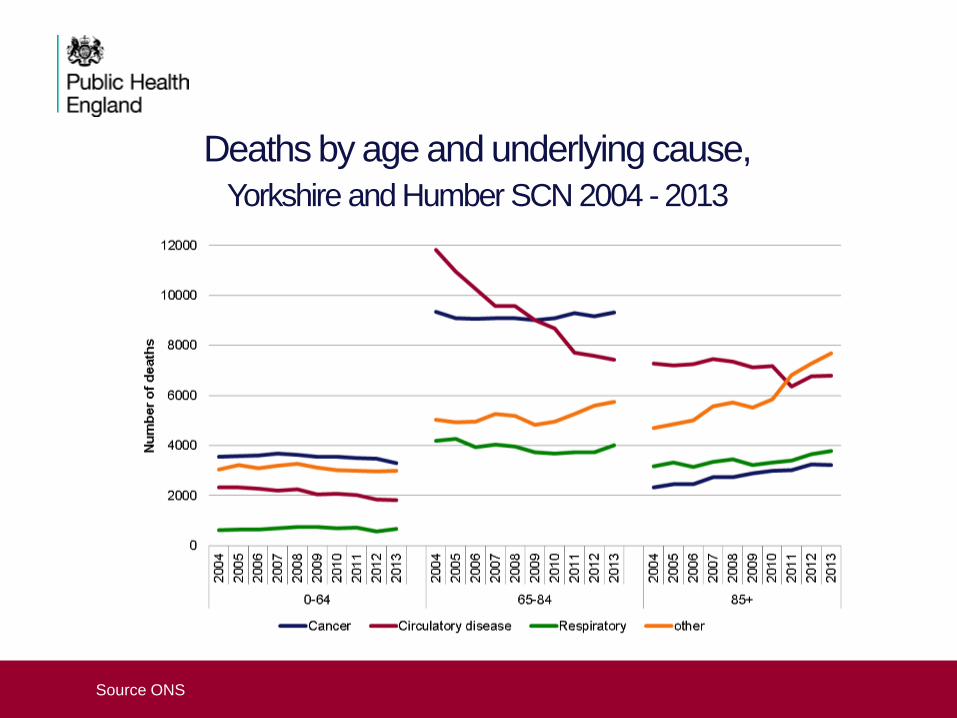
Deaths by age and underlying cause,
Yorkshire and Humber SCN 2004 - 2013
Source ONS

Deaths by place of death and age group, Yorkshire and Humber SCN 2004 - 2013
Source ONS

Place and cause of death, Yorkshire and Humber SCN 2004 - 2013
Source ONS

Deaths by place of death, Yorkshire and Humber SCN 2003 -2014
Source ONS

Developing the use of
quantitative data sources

Percentage of people admitted to an acute hospital trust
during the last 6 months of life – England 2010 -2012
Source HES and ONS
CCG SCN IDAOPI Quintile Percentage going to hospital
during the last 6 month of life
ISLE OF WIGHT Wessex 3 24.1
HEREFORDSHIRE West Midlands 4 67.7
HORSHAM AND MID SUSSEX South East Coast 5 68.0
WYRE FOREST West Midlands 3 68.1
SHROPSHIRE West Midlands 4 68.3
CENTRAL LONDON (WESTMINSTER) London 3 68.7
WEST HAMPSHIRE Wessex 5 69.0
NORTH SOMERSET South West Coast 5 69.5
SOUTH DEVON AND TORBAY South West Coast 3 69.8
KERNOW South West Coast 3 70.0
HIGH WEALD LEWES HAVENS South East Coast 5 70.1
CASTLE POINT AND ROCHFORD East of England 4 81.4
WIGAN BOROUGH Greater Manchester, Lancs & S
Cumbria 2 81.4
HULL Yorkshire and the Humber 1 81.8
BARKING AND DAGENHAM London 1 81.8
SOLIHULL West Midlands 4 81.9
WALTHAM FOREST London 1 81.9
DONCASTER Yorkshire and the Humber 2 82.1
SUNDERLAND Northern England 1 82.7
GATESHEAD Northern England 1 82.7
NORTH TYNESIDE Northern England 2 83.6
SOUTH TYNESIDE Northern England 1 83.9
England Average 75.7

Percentage of people admitted to an acute
hospital trust in the last 6 months of life
– Yorkshire and Humber SCN 2010 - 2012
Source HES and ONS
CCG
Percentage of people
admitted to hospital in the
last 6 months of life Difference from the
England Average
Airedale Wharfedale & Craven 70.6 -5.1
Harrogate & Rural District 72.2 -3.5
Scarborough & Ryedale 72.3 -3.4
North East Lincolnshire 74.1 -1.6
Bradford City 74.3 -1.4
Greater Huddersfield 75.9 0.2
Bradford Districts 76.0 0.3
North Kirklees 76.3 0.6
Vale of York 76.4 0.7
East Riding of Yorkshire 77.2 1.5
Bassetlaw 77.3 1.6
Sheffield 77.7 2.0
Leeds North 78.4 2.7
North Lincolnshire 78.6 2.9
Leeds South & East 79.2 3.5
Wakefield 79.4 3.7
Leeds West 79.8 4.1
Calderdale 80.3 4.6
Rotherham 80.8 5.1
Barnsley 81.3 5.6
Hull 81.8 6.1
Doncaster 82.1 6.4
England 75.7

Average number of days spent in an acute hospital during the last
6 months of life – England 2010 - 2012 CCG SCN IDAOPI Quintile
Average time spent in hospital
(days)
SOUTH DEVON AND TORBAY South West Coast 3 14.9
CANTERBURY AND COASTAL South East Coast 4 15.4
KERNOW South West Coast 3 15.7
THANET South East Coast 2 15.9
SOUTH KENT COAST South East Coast 3 15.9
ISLE OF WIGHT Wessex 3 16.0
HEREFORDSHIRE West Midlands 4 17.7
SOUTHPORT AND FORMBY Cheshire and Merseyside 3 18.1
BRADFORD CITY Yorkshire and the Humber 1 18.1
DARLINGTON Northern England 3 18.2
ASHFORD South East Coast 4 18.4
EALING London 1 28.7
SOUTHWARK London 1 28.8
WALTHAM FOREST London 1 29.0
SOUTH MANCHESTER Greater Manchester, Lancs
& S Cumbria 1 29.1
TOWER HAMLETS London 1 29.1
NEWCASTLE NORTH AND EAST Northern England 1 29.3
SHEFFIELD Yorkshire and the Humber 2 29.4
LEWISHAM London 1 29.8
CENTRAL MANCHESTER Greater Manchester, Lancs & S
Cumbria 1 31.9
NORTH TYNESIDE Northern England 2 32.2
CITY AND HACKNEY London 1 32.5
England Average 22.8
Source HES and ONS

Average days spent in an acute trust
during the last 6 months of life Yorkshire and Humber SCN 2010 -2012
Source HES and ONS

Percentage of people admitted to an acute trust spending more than
3 weeks in care – England 2010 - 2012
Source HES and ONS
CCG SCN IDAOPI Quintile Percentage admitted spending
over 3 weeks in hospital
SOUTH DEVON AND TORBAY South West Coast 3 23.7%
SOUTH KENT COAST South East Coast 3 25.2%
KERNOW South West Coast 3 25.8%
CANTERBURY AND COASTAL South East Coast 4 26.0%
THANET South East Coast 2 26.2%
HEYWOOD, MIDDLETON AND ROCHDALE Greater Manchester, Lancs & S Cumbria 2 28.5%
ASHFORD South East Coast 4 29.4%
BURY Greater Manchester, Lancs & S Cumbria 3 29.6%
SOUTH WORCESTERSHIRE West Midlands 4 29.8%
BRADFORD CITY Yorkshire and the Humber 1 30.2%
ISLE OF WIGHT Wessex 3 30.5%
CENTRAL MANCHESTER Greater Manchester, Lancs & S Cumbria 1 46.9%
NEWCASTLE NORTH AND EAST Northern England 1 47.0%
TRAFFORD Greater Manchester, Lancs & S Cumbria 3 47.4%
SHEFFIELD Yorkshire and the Humber 2 47.6%
SOUTH TYNESIDE Northern England 1 47.7%
SOUTHWARK London 1 48.1%
CAMDEN London 1 48.1%
LEWISHAM London 1 49.3%
TOWER HAMLETS London 1 50.1%
CITY AND HACKNEY London 1 50.2%
NORTH TYNESIDE Northern England 2 50.7%
England Average 38.3%

Admissions to acute trusts spending more
than 3 weeks in care during the last 6 months of life
Yorkshire and Humber SCN 2010 - 2012
Source HES and ONS
CCG
Percentage of people
admitted to an acute
hospital trust spending
more than 21 days in care
Difference from the
England Average Bradford City 30.2 -8.0
Bassetlaw 31.4 -6.8
Bradford Districts 32.6 -5.7
Airedale Wharfedale & Craven 33.5 -4.7
Scarborough & Ryedale 34.8 -3.4
Greater Huddersfield 35.5 -2.8
North Kirklees 35.8 -2.5
Harrogate & Rural District 36.9 -1.4
East Riding of Yorkshire 37.0 -1.3
Doncaster 37.1 -1.2
Calderdale 37.4 -0.9
North Lincolnshire 37.5 -0.7
Leeds North 38.6 0.4
North East Lincolnshire 38.7 0.4
Leeds West 39.2 0.9
Barnsley 39.2 0.9
Wakefield 39.8 1.5
Rotherham 39.9 1.6
Hull 40.7 2.5
Vale of York 41.0 2.8
Leeds South & East 43.2 4.9
Sheffield 47.6 9.3
England Average 38.3
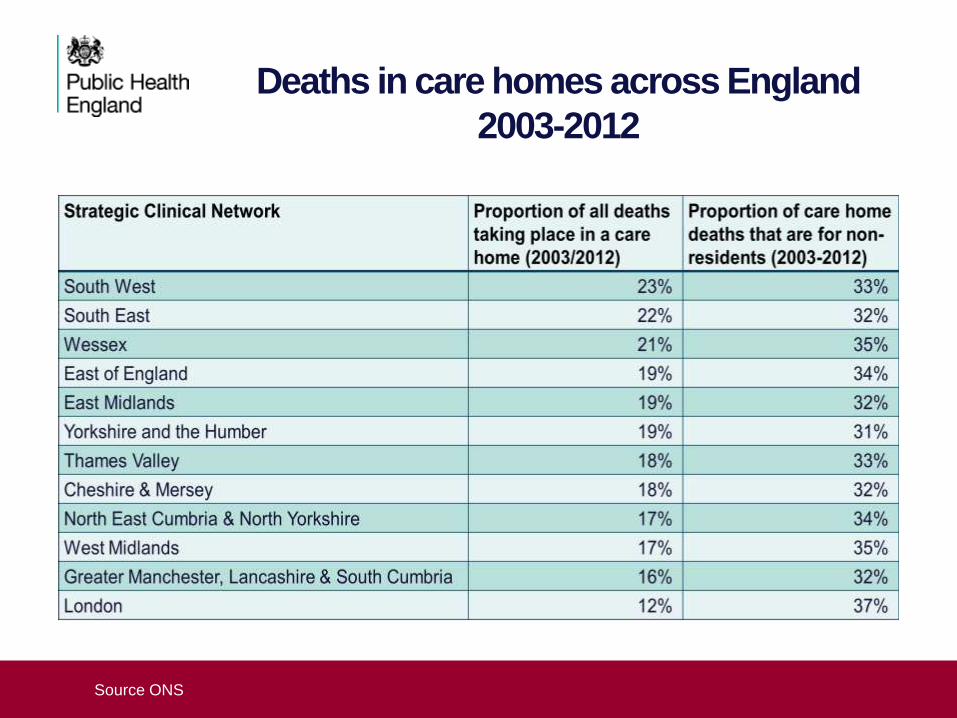
Deaths in care homes across England
2003-2012
Source ONS

Deaths in care homes across England
age and gender of residents and non - residents
2003 - 2012
Source ONS

Deaths in care homes across England
Cause of death residents and non - residents
2003 - 2012
Source ONS
0%
5%
10%
15%
20%
25%
30%
35%
Cancer Cerebrovascular CHD Dementia Other Respiratory
De
ath
s
Cause of death
Non-residents Residents

Qualitative data –
what its telling us about
end of life care

How Well was Pain Managed in the Last 3 Months of Life, by Care
Setting
Source: Voices 2013

Complete pain relief (SCN area team max, England, SCN area team min)
21 Sources: Voices
43
21
46
68
37
18
45
63
36
17
43
55
0
20
40
60
80
100
Hospital Home Care Home Hospice
We
igh
ted
Pe
rce
nta
ge
Place of death
Max Min Max Min Max Min

Which of the
following would
be most
important to you
regarding how
you spend your
final days?
22 Sue Ryder – A Time and a Place Survey 2014

Source: ONS and Sue Ryder
Preferred and Actual Place of
Death
0.0
10.0
20.0
30.0
40.0
50.0
60.0
70.0
Hospital Home Care home Hospice
Perc
en
t
What people want What actually happens

National care of the dying audit
of hospitals_Acute hospitals

Key Findings (nationally)
25 GML&SC_EOLC_data_20141208
• Most patients (87%) had documented recognition that they were in last days
of life – but discussion only recorded in 46% of cases thought capable of
doing so
• Discussions of spiritual needs documented for only 21% of patients
• Mandatory training in care of the dying was only required in 19% of trusts
for doctors, and 28% for nurses
• Only 21% of sites had access to face to face palliative care services 7 days
per week – despite longstanding national recommendation.

Health Professionals’ discussions with both the patient and their relatives/friends
regarding their recognition that the patient is dying (Clinical KPI2)
26 GML&SC_EOLC_data_20141208
0
20
40
60
80
100
(sco
re r
an
ge 0
to
4):
%
of
cases a
ch
iev
ing
a s
co
re o
f 4
KPI 2: Health Professionals' discussions with both the patient and their relatives/friends regarding their recognition thatthe patient is dying.
KPI2 national average score achieved per hospital
KPI2 average score per Yorkshire and The Humber SCN hospital

Assessment of the spiritual needs of the patient and their nominated relatives or
friends.(Clinical KPI3)
27 GML&SC_EOLC_data_20141208
0
20
40
60
80
100
(sco
re r
an
ge 0
to
4):
%
of
cases a
ch
iev
ing
a s
co
re o
f 1 o
r h
igh
er
KPI 4: Assessment of the spiritual needs of the patient and their nominated relatives or friends.
KPI4 national average score achieved per hospital
KPI4 average score per Yorkshire and The HumberSCN hospital

Care of the Dying: continuing education, training and audit. Organisational KPI3
28 GML&SC_EOLC_data_20141208
0
5
10
15
20
sco
re (
ran
ge 0
to
20)
KPI 3: Care of the Dying: continuing education, training and audit.
KPI3 national average score achieved per hospital
KPI3 average score per Yorkshire and The HumberSCN hospital