ends 4: life management and personal awareness
TRANSCRIPT
ENDS 4: Life Management and Personal Awareness May 23, 2018
Students will live healthy, satisfying, and productive lives. Interpretation:
We interpret students to mean all students in our K-12 educational system and students who have recently graduated.
We interpret live healthy lives to mean our students will make informed and appropriate choices regarding their physical, social and emotional condition.
We interpret live satisfying lives to mean our students will demonstrate self-assurance about one’s ability to accomplish his/her personal grade level goals and plan for post-secondary pursuits.
We interpret live productive lives to mean students will progress through their K-
12 learning experience, meeting grade level appropriate behavioral,
social/emotional, and academic standards and apply those skills to their goals in
life.
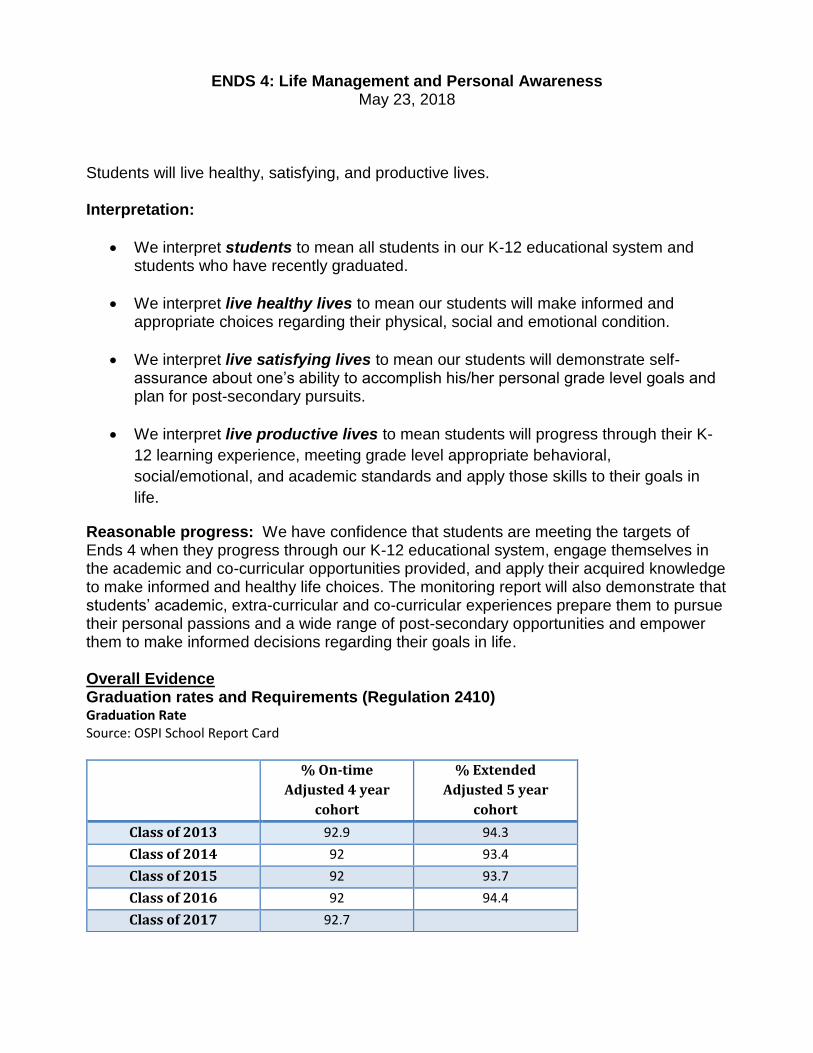
Reasonable progress: We have confidence that students are meeting the targets of Ends 4 when they progress through our K-12 educational system, engage themselves in the academic and co-curricular opportunities provided, and apply their acquired knowledge to make informed and healthy life choices. The monitoring report will also demonstrate that students’ academic, extra-curricular and co-curricular experiences prepare them to pursue their personal passions and a wide range of post-secondary opportunities and empower them to make informed decisions regarding their goals in life. Overall Evidence Graduation rates and Requirements (Regulation 2410) Graduation Rate Source: OSPI School Report Card
% On-time
Adjusted 4 year
cohort
% Extended
Adjusted 5 year
cohort
Class of 2013 92.9 94.3
Class of 2014 92 93.4
Class of 2015 92 93.7
Class of 2016 92 94.4
Class of 2017 92.7
Ends 4 Life Management and Personal Awareness
2
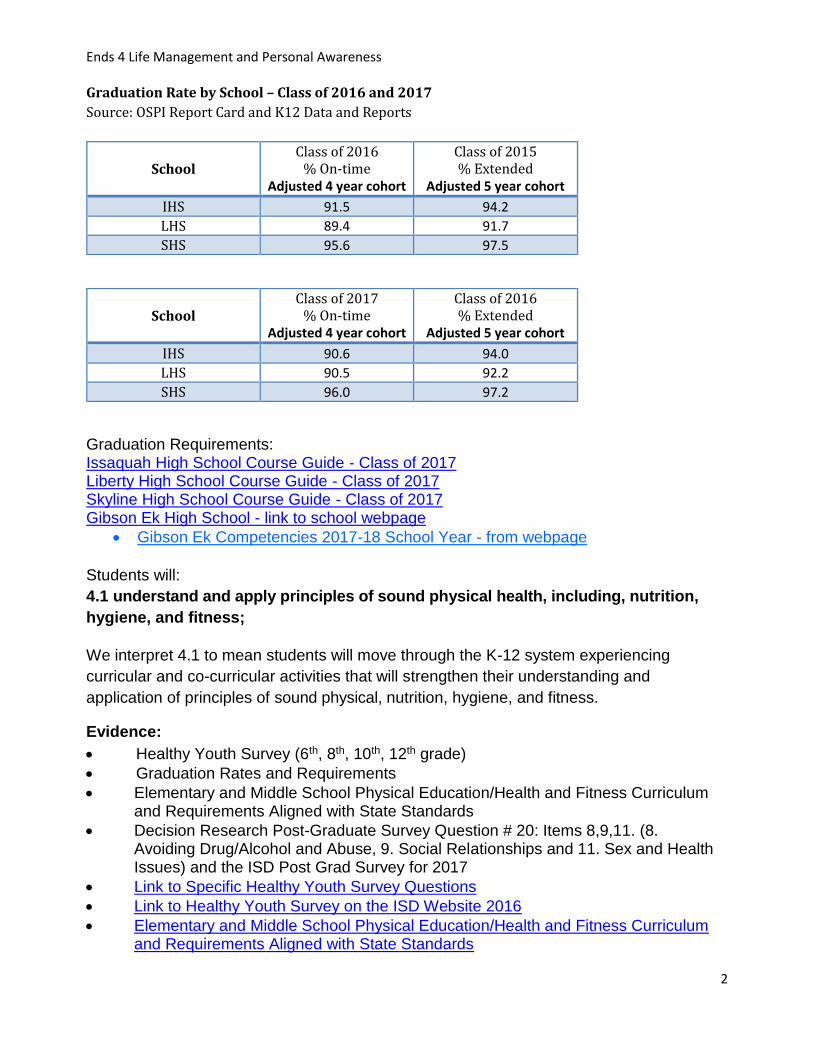
Graduation Rate by School – Class of 2016 and 2017
Source: OSPI Report Card and K12 Data and Reports
Graduation Requirements: Issaquah High School Course Guide - Class of 2017 Liberty High School Course Guide - Class of 2017 Skyline High School Course Guide - Class of 2017 Gibson Ek High School - link to school webpage
Gibson Ek Competencies 2017-18 School Year - from webpage
Students will:
4.1 understand and apply principles of sound physical health, including, nutrition,
hygiene, and fitness;
We interpret 4.1 to mean students will move through the K-12 system experiencing
curricular and co-curricular activities that will strengthen their understanding and
application of principles of sound physical, nutrition, hygiene, and fitness.
Evidence:
Healthy Youth Survey (6th, 8th, 10th, 12th grade)
Graduation Rates and Requirements
Elementary and Middle School Physical Education/Health and Fitness Curriculum and Requirements Aligned with State Standards
Decision Research Post-Graduate Survey Question # 20: Items 8,9,11. (8. Avoiding Drug/Alcohol and Abuse, 9. Social Relationships and 11. Sex and Health Issues) and the ISD Post Grad Survey for 2017
Link to Specific Healthy Youth Survey Questions
Link to Healthy Youth Survey on the ISD Website 2016
Elementary and Middle School Physical Education/Health and Fitness Curriculum and Requirements Aligned with State Standards
School Class of 2016
% On-time Adjusted 4 year cohort
Class of 2015 % Extended
Adjusted 5 year cohort
IHS 91.5 94.2
LHS 89.4 91.7
SHS 95.6 97.5
School Class of 2017
% On-time Adjusted 4 year cohort
Class of 2016 % Extended
Adjusted 5 year cohort
IHS 90.6 94.0
LHS 90.5 92.2
SHS 96.0 97.2

Ends 4 Life Management and Personal Awareness
3
Two charts below – Decision Research 2011-15 and ISD Post Grad Survey 2017, same question: Upon graduation, how prepared did you feel in each of the following areas, regardless of where you acquired the knowledge and skills
Source: Decision Research Post-Graduate Survey Question 20:
Source: ISD Post-Graduate Survey Question 9:
Percentages are rounded. Students are surveyed in the year following graduation.
4.2 understand and apply principles of sound mental and emotional health, and learn to identify signs of emotional health concerns in self and others, and when to seek supportive resources;
We interpret 4.2 to mean students will move through the K-12 system experiencing
curricular and co-curricular activities that will strengthen their understanding and practice
of sound mental and emotional health. Students will recognize concerns related to
emotional health in themselves and others and when to seek supportive resources.
Evidence:
Graduation Rates and Requirements
Elementary Social Emotional Learning Curriculum was implemented
Middle School Social Emotional Learning Curriculum adoption began
Specific Healthy Youth Survey Questions addressing emotional health - link
% Prepared % Not Sure % Not Prepared
Graduating Class
2011 2013 2015 2011 2013 2015 2011 2013 2015
8. Avoiding Drug/Alcohol Use
82 75 78 12 17 11 7 9 10
9. Social Relations 86 82 77 8 14 11 7 4 12
11. Sex and Health Issues
89 84 85 6 12 10 5 4 4
% of Very Prepared and Somewhat Prepared
% Not sure % of Not Prepared and Somewhat Unprepared
Graduating Class of 2017
2017
2017 2017
Avoiding Drug/Alcohol Use
72% 12% 16%
Social Relations 75% 9% 16% Sex and Health Issues 84% 4% 12%

Ends 4 Life Management and Personal Awareness
4
Healthy Youth Survey on the ISD Website 2016 - link
Health and Fitness State Standards - link
PBSES - link
Healthy Youth Initiative - Issaquah Schools Foundation - link
Health Curriculum ES, MS, HS - link
FLASH for 5th Grade through High School - link
Health and Fitness Curriculum ISD Website - link 4.3 understand the opportunities and risks posed by digital technology and social media, including social-emotional risks and safety impacts; We interpret 4.3 to mean students will move through the K-12 system experiencing curricular and co-curricular activities that will strengthen their understanding of the opportunities and risks posed by digital technology and social media, including social-emotional risks and safety impacts; Evidence:
Graduation Rates and Requirements
Digital Citizenship and Responsible Use Agreement
Healthy Youth Survey: Social Media
Tech Smart: Appropriate Blog Posting
Health curriculum
High School Family Life and Sexual Health (FLASH) Curriculum: personal safety, ethical and respectful behavior with information technology
Internet Safety Training provided yearly to all students K-12
Digital Citizenship The Children’s Internet Protection Act (CIPA) requires schools to provide Internet Safety training every year to all students. There is no provision from CIPA for what curriculum is used so each school makes its own choices of Internet Safety Curriculum. In Issaquah all schools are required to complete Internet Safety Training and submit a completed form certifying that they have done so. The completed certifications are sent to the Executive Director of Compliance and Legal Affairs. K-5 Students Responsible Use Agreement 2017-18, 6-12 Students Responsible Use Agreement 2017-18
Ends 4 Life Management and Personal Awareness
5
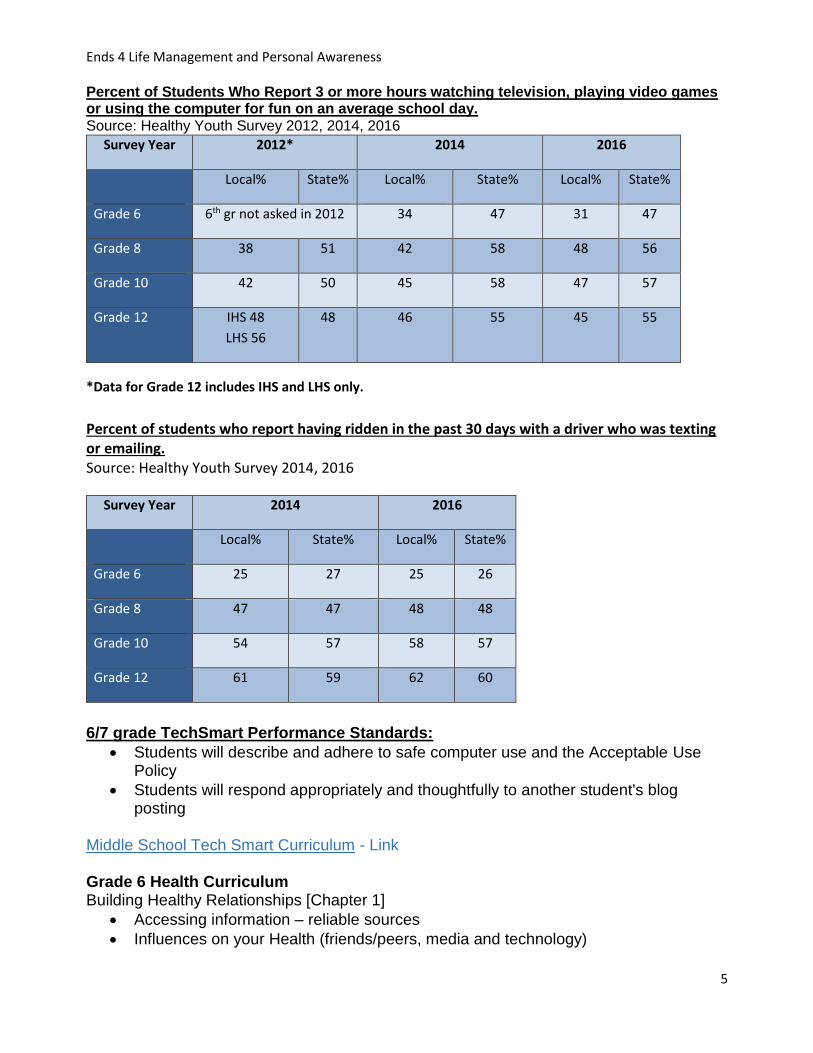
Percent of Students Who Report 3 or more hours watching television, playing video games or using the computer for fun on an average school day. Source: Healthy Youth Survey 2012, 2014, 2016
*Data for Grade 12 includes IHS and LHS only.
Percent of students who report having ridden in the past 30 days with a driver who was texting or emailing. Source: Healthy Youth Survey 2014, 2016
Survey Year 2014 2016
Local% State% Local% State%
Grade 6 25 27 25 26
Grade 8 47 47 48 48
Grade 10 54 57 58 57
Grade 12 61 59 62 60
6/7 grade TechSmart Performance Standards:
Students will describe and adhere to safe computer use and the Acceptable Use Policy
Students will respond appropriately and thoughtfully to another student's blog posting
Middle School Tech Smart Curriculum - Link Grade 6 Health Curriculum Building Healthy Relationships [Chapter 1]
Accessing information – reliable sources
Influences on your Health (friends/peers, media and technology)
Survey Year 2012* 2014 2016
Local% State% Local% State% Local% State%
Grade 6 6th gr not asked in 2012 34 47 31 47
Grade 8 38 51 42 58 48 56
Grade 10 42 50 45 58 47 57
Grade 12 IHS 48
LHS 56
48 46 55 45 55
Ends 4 Life Management and Personal Awareness
6
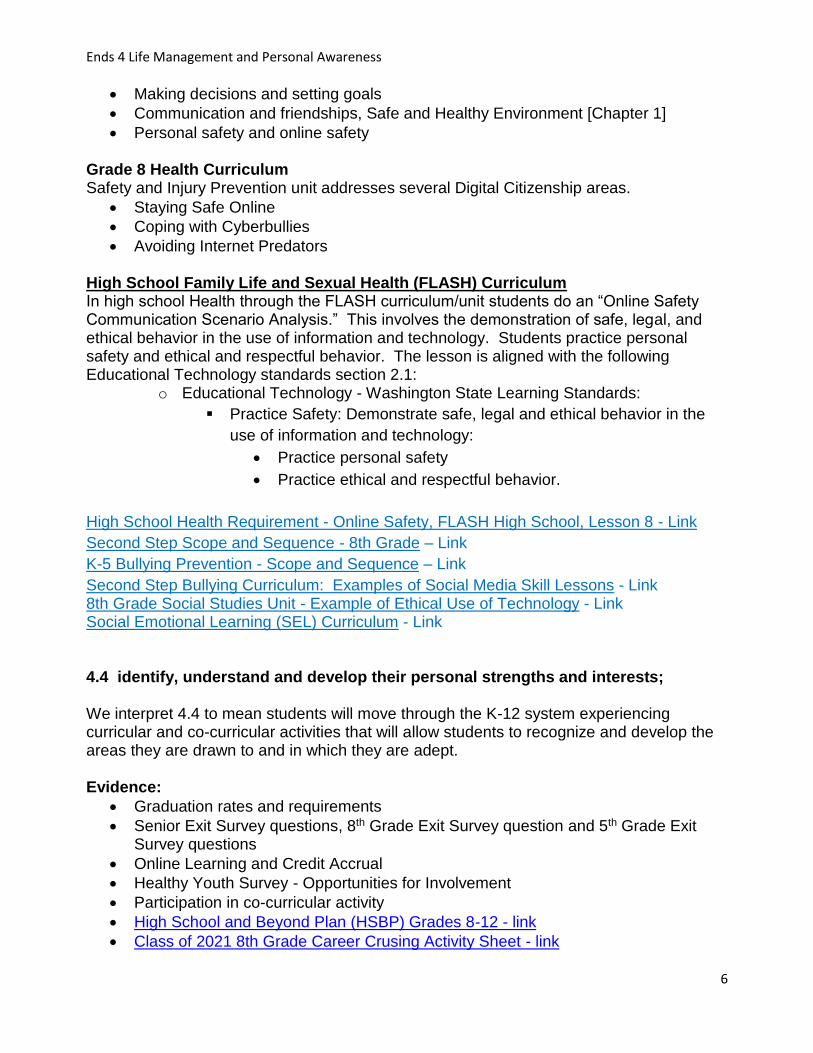
Making decisions and setting goals
Communication and friendships, Safe and Healthy Environment [Chapter 1]
Personal safety and online safety Grade 8 Health Curriculum Safety and Injury Prevention unit addresses several Digital Citizenship areas.
Staying Safe Online
Coping with Cyberbullies
Avoiding Internet Predators
High School Family Life and Sexual Health (FLASH) Curriculum In high school Health through the FLASH curriculum/unit students do an “Online Safety Communication Scenario Analysis.” This involves the demonstration of safe, legal, and ethical behavior in the use of information and technology. Students practice personal safety and ethical and respectful behavior. The lesson is aligned with the following Educational Technology standards section 2.1:
o Educational Technology - Washington State Learning Standards:
Practice Safety: Demonstrate safe, legal and ethical behavior in the
use of information and technology:
Practice personal safety
Practice ethical and respectful behavior.
High School Health Requirement - Online Safety, FLASH High School, Lesson 8 - Link
Second Step Scope and Sequence - 8th Grade – Link
K-5 Bullying Prevention - Scope and Sequence – Link
Second Step Bullying Curriculum: Examples of Social Media Skill Lessons - Link 8th Grade Social Studies Unit - Example of Ethical Use of Technology - Link Social Emotional Learning (SEL) Curriculum - Link
4.4 identify, understand and develop their personal strengths and interests; We interpret 4.4 to mean students will move through the K-12 system experiencing curricular and co-curricular activities that will allow students to recognize and develop the areas they are drawn to and in which they are adept. Evidence:
Graduation rates and requirements
Senior Exit Survey questions, 8th Grade Exit Survey question and 5th Grade Exit Survey questions
Online Learning and Credit Accrual
Healthy Youth Survey - Opportunities for Involvement
Participation in co-curricular activity
High School and Beyond Plan (HSBP) Grades 8-12 - link
Class of 2021 8th Grade Career Crusing Activity Sheet - link
Ends 4 Life Management and Personal Awareness
7
All students are exposed to academic and elective course offerings, and extra and co-curricular opportunities
Extra and co-curricular opportunities provided through Issaquah Schools Foundation
Extra and co-curricular opportunities and participation: PTSA funded opportunities
Additional opportunities for students to pursue personal development through creation of informed self-select in Middle School math, science, and humanities Middle School Math Curriculum Middle School Science Paths Middle School Language Arts Selection Form Spring 2017 Creation of Middle School Independent Health/PE to open student schedules Independent Health and PE (8)
Students consider learning recommendations when choosing courses course offerings.
Senior and 8th Grade Exit Survey Results.
Balanced Literacy Approach with Guided Reading, and Readers’ and Writers’ Workshops in our elementary schools provides leveled reading choice for students.
Grade 4 Elementary Writing Common Assessment 2016-17 Gr 4 Writing Pre and Post Assessment by School
2016-17 Gr 4 Cohort Writing Pre and Post Assessment
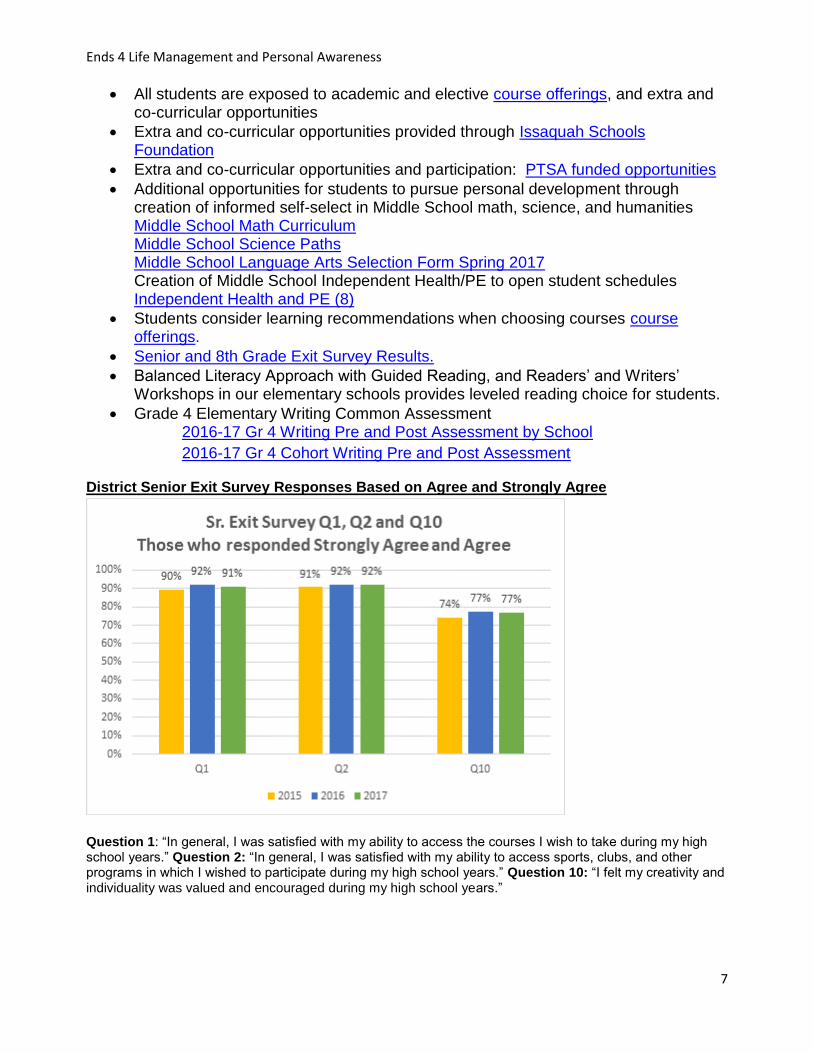
District Senior Exit Survey Responses Based on Agree and Strongly Agree
Question 1: “In general, I was satisfied with my ability to access the courses I wish to take during my high school years.” Question 2: “In general, I was satisfied with my ability to access sports, clubs, and other programs in which I wished to participate during my high school years.” Question 10: “I felt my creativity and individuality was valued and encouraged during my high school years.”

Ends 4 Life Management and Personal Awareness
8
5TH Grade Exit Survey Questions 8 and 18 Question 8: I feel my creativity and individuality is valued and encouraged at my school. Question 18: I have enough opportunities to participate in before and after school activities, before and after school sports, clubs, and activities.
68% 71%63%
0%
10%
20%
30%
40%
50%
60%
70%
80%
90%
2015 2016 2017
8th Grade Exit Survey Q7 - "I feel my creativity and individuality is valued and encouraged during middle school."
Strongly Agree and Agree
88% 83%83% 84%82% 80%
Q8 Q18
2015
2016
2017

Ends 4 Life Management and Personal Awareness
9
E-4 Source: Skyward
Summer School for Credit Accrual - Class Enrollment – students may be duplicated (online not included, see link below) This chart does not include students taking classes for grade improvement.
*2016-17 only includes numbers for live summer school. Previous years may have included some online enrollment. Online Enrollment for credit accrual is listed in the link below. One student may have taken more than one class (in 2016-17 112 individual students enrolled).
Online Learning Report for 2016-17, Credit Accrual Data on page 7 in this link ASB Participation
*Gibson Ek students purchased their ASB cards through their home high school in 2016-17. GE will issued their own ASB cards in 2017-18.
School Year - Summer
2014-15 2015-16 2016-17*
Subject Area Enrollment Enrollment Enrollment
ISD SUMMER SCHOOL
Physical Education 84 58 80
English 1 3 2
Math 3 4 5
Science 4 1 0
Social Studies 3 9 15
Digital Painting: Art of Photoshop 0 0 0
Art: Guided Studies 8 0 0
Ecology Summer Research Program 17 24 17
Total ISD Summer School Class Enrollment 120 99 119
ASB Participation Number/Percentage of all ISD MS & HS Students as of Oct
School Year: 2014-15 2015-16 2016-17
Middle School 4,127/92.3% 4,289/92.9% 4,368/89.96%
High School* 4,636/87.5% 4,595/85.9% 4,632/85.7%
Total Enrollment all
ISD MS HS
9736/90% 10,027/88.6% 10,363/86.8%

Ends 4 Life Management and Personal Awareness
10
Link to Link to Healthy Youth Survey on the ISD Website 2016 Participation in Extra- and Co-Curricular Opportunities and Participation-Clubs/Activities:
Elementary Clubs and Activities 2016-17 - link
Middle School Clubs and Activities 2016-17 - link
High School Clubs and Activities 2016-17 - link
*Total enrollments as of October 1, 2016, 2016-17 includes 17 Special Services students not included in subtotals as they were not enrolled in any of the 4 high schools.
Healthy Youth Survey Data Question: “Opportunities for Involvement” Percent of students who agree that they have lots of chances for involvement in school activities.
Grade 2012 2014 2016
8 93%
96%
96%
10 96%
95%
94%
12 IHS 97% LHS 94%
95%
96%
CLUBS/ACTIVITIES: Extra and Co-curricular Student Participation Rates (numbers of students) and number of clubs/activities. Students participating in multiple clubs/activities are counted more than once.
School Year
2014-15 rate & total
2014-15 #clubs/activities
2015-16 rate & total
2015-16 #clubs/activities
2016-17 rate and
total
2016-17 rate and total
Elem rate Elem total *
6,146 9,017
149 6,256 9,184
145 7,977 9,382
170
Middle rate Middle total*
2,859
4,439 44 3,107
4,678 73 3,201
4,844 76
High rate High total*
5,223 5,368
131 5,882 5,385
178 5,623 5,519
190
Total rate Total Enrollment*
14,228 18,824
324 15,245 19,254
396 19,762*
428
Ends 4 Life Management and Personal Awareness
11
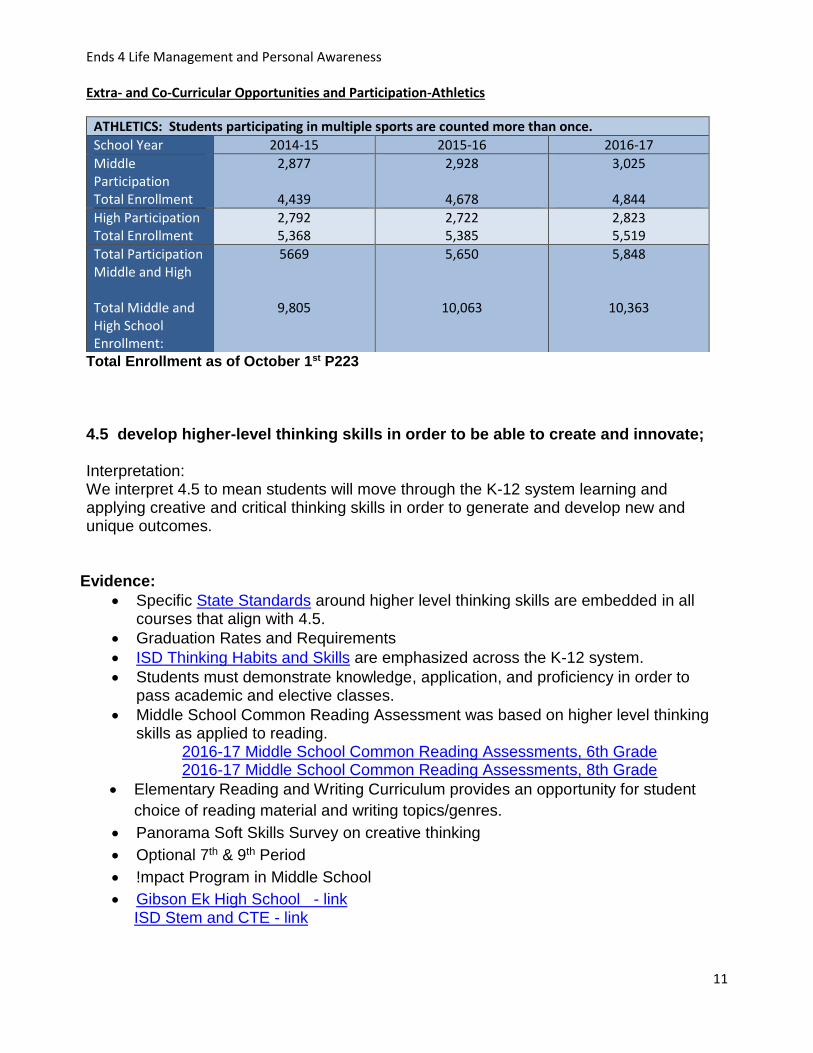
Extra- and Co-Curricular Opportunities and Participation-Athletics
Total Enrollment as of October 1st P223
4.5 develop higher-level thinking skills in order to be able to create and innovate; Interpretation: We interpret 4.5 to mean students will move through the K-12 system learning and applying creative and critical thinking skills in order to generate and develop new and unique outcomes.
Evidence:
Specific State Standards around higher level thinking skills are embedded in all courses that align with 4.5.
Graduation Rates and Requirements
ISD Thinking Habits and Skills are emphasized across the K-12 system.
Students must demonstrate knowledge, application, and proficiency in order to pass academic and elective classes.
Middle School Common Reading Assessment was based on higher level thinking skills as applied to reading.
2016-17 Middle School Common Reading Assessments, 6th Grade 2016-17 Middle School Common Reading Assessments, 8th Grade
Elementary Reading and Writing Curriculum provides an opportunity for student
choice of reading material and writing topics/genres.
Panorama Soft Skills Survey on creative thinking
Optional 7th & 9th Period
!mpact Program in Middle School
Gibson Ek High School - link ISD Stem and CTE - link
ATHLETICS: Students participating in multiple sports are counted more than once.
School Year 2014-15 2015-16 2016-17
Middle Participation Total Enrollment
2,877
4,439
2,928
4,678
3,025
4,844
High Participation Total Enrollment
2,792 5,368
2,722 5,385
2,823 5,519
Total Participation Middle and High Total Middle and High School Enrollment:
5669
9,805
5,650
10,063
5,848
10,363
Ends 4 Life Management and Personal Awareness
12
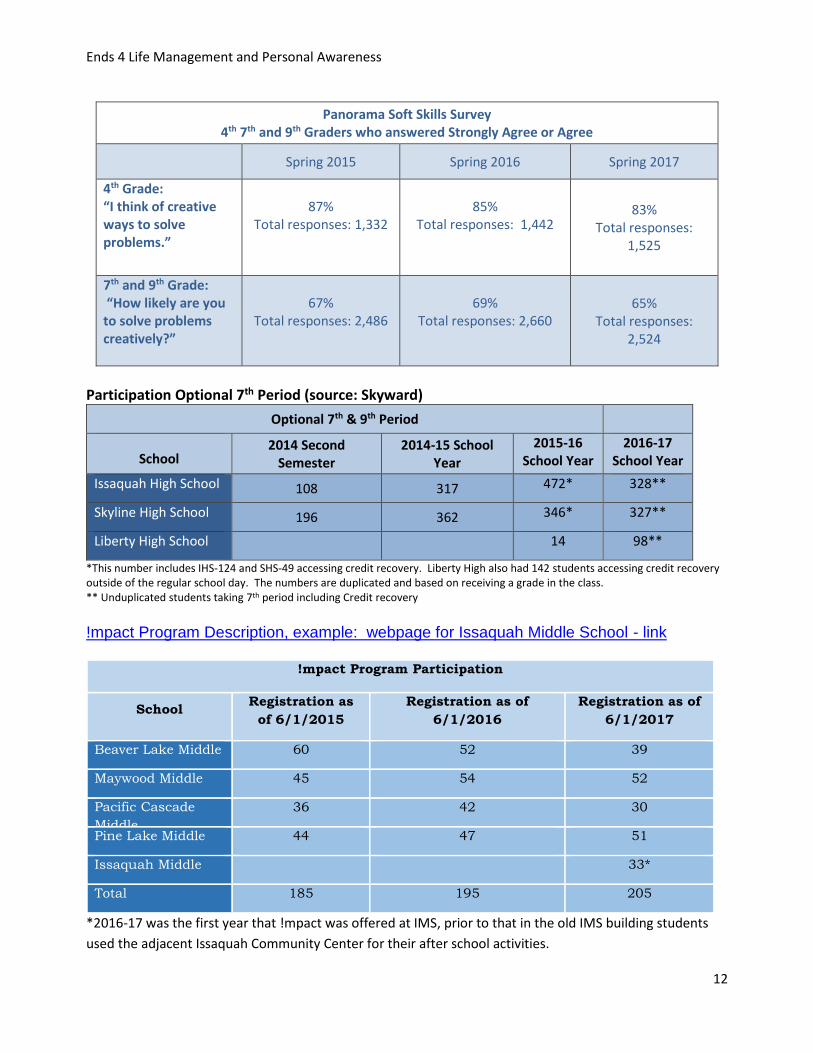
Panorama Soft Skills Survey 4th 7th and 9th Graders who answered Strongly Agree or Agree
Spring 2015 Spring 2016 Spring 2017
4th Grade: “I think of creative ways to solve problems.”
87%
Total responses: 1,332
85%
Total responses: 1,442 83%
Total responses: 1,525
7th and 9th Grade: “How likely are you to solve problems creatively?”
67%
Total responses: 2,486
69%
Total responses: 2,660 65%
Total responses: 2,524
Participation Optional 7th Period (source: Skyward)
Optional 7th & 9th Period
School 2014 Second
Semester 2014-15 School
Year
2015-16 School Year
2016-17 School Year
Issaquah High School 108 317 472* 328**
Skyline High School 196 362 346* 327**
Liberty High School 14 98**
*This number includes IHS-124 and SHS-49 accessing credit recovery. Liberty High also had 142 students accessing credit recovery outside of the regular school day. The numbers are duplicated and based on receiving a grade in the class. ** Unduplicated students taking 7th period including Credit recovery
!mpact Program Description, example: webpage for Issaquah Middle School - link
!mpact Program Participation
School Registration as
of 6/1/2015
Registration as of
6/1/2016
Registration as of
6/1/2017
Beaver Lake Middle 60 52 39
Maywood Middle 45 54 52
Pacific Cascade
Middle
36 42 30
Pine Lake Middle 44 47 51
Issaquah Middle 33*
Total 185 195 205
*2016-17 was the first year that !mpact was offered at IMS, prior to that in the old IMS building students
used the adjacent Issaquah Community Center for their after school activities.
Ends 4 Life Management and Personal Awareness
13
4.6 be resilient, take informed risks, deal constructively with failure, and be flexible and adaptable to change. We interpret 4.6 to mean students will persist in their education pursuits by adjusting to changing circumstances and challenges throughout their K-12 experience.)
Evidence:
Graduation Rates and Requirements
Secondary Summer school enrollment/Students taking classes for grade improvement
Juniors and Seniors enrolled in AP, IB, College in the High School enrollments, Ethnicity/Race and Gender data (links to charts), Running Start, online learning courses
Senior Exit Survey questions 8 and 9
Learning recommendations
Number of Students Enrolled in WaNIC (Washington Network of Innovative Careers)
Sixth grade self-select for math, language arts, and science
Seventh Grade Math Path Self Select for 2015-16 (directly after 6th grade Math SS)
Self-select data by Ethnicity/Race/Gender (links to charts)
Fifth Grade Exit Survey data questions 7 and 17
Eighth Grade Exit Survey data questions 16 Panorama Survey Data
Grading - Secondary Grading Principles - ISD Webpage
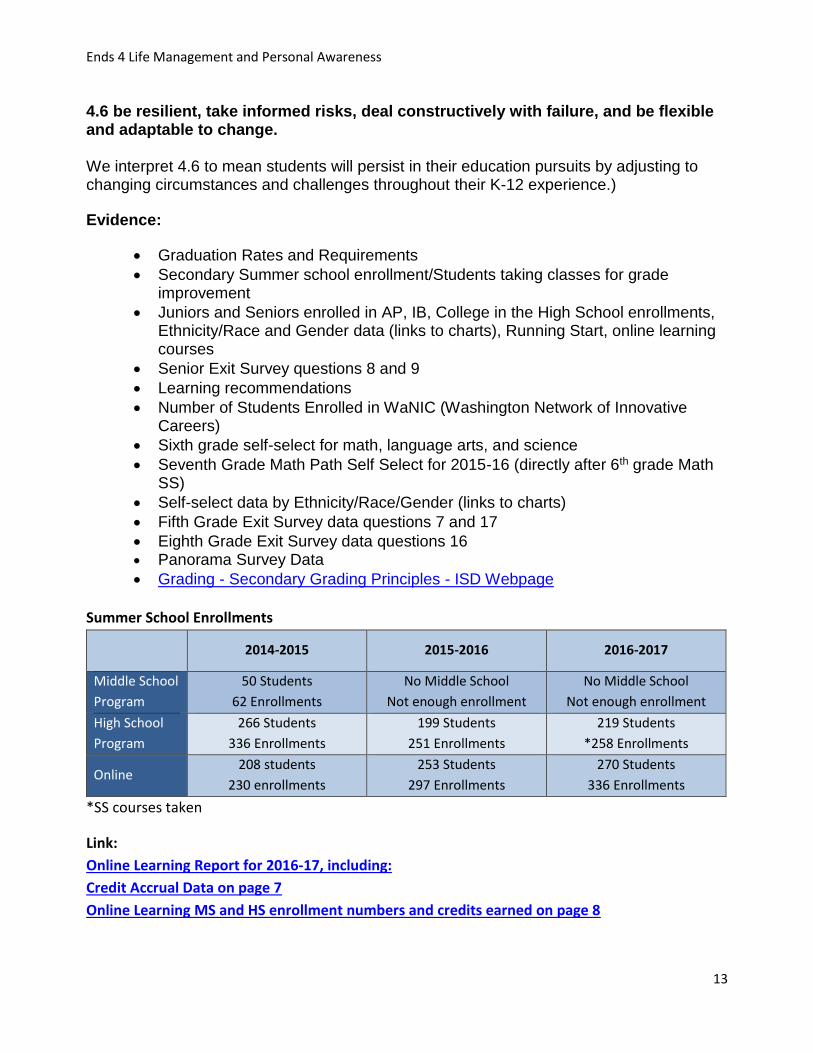
Summer School Enrollments
2014-2015 2015-2016 2016-2017
Middle School
Program
50 Students
62 Enrollments
No Middle School
Not enough enrollment
No Middle School
Not enough enrollment
High School
Program
266 Students
336 Enrollments
199 Students
251 Enrollments
219 Students
*258 Enrollments
Online 208 students
230 enrollments
253 Students
297 Enrollments
270 Students
336 Enrollments
*SS courses taken
Link:
Online Learning Report for 2016-17, including:
Credit Accrual Data on page 7
Online Learning MS and HS enrollment numbers and credits earned on page 8
Ends 4 Life Management and Personal Awareness
14
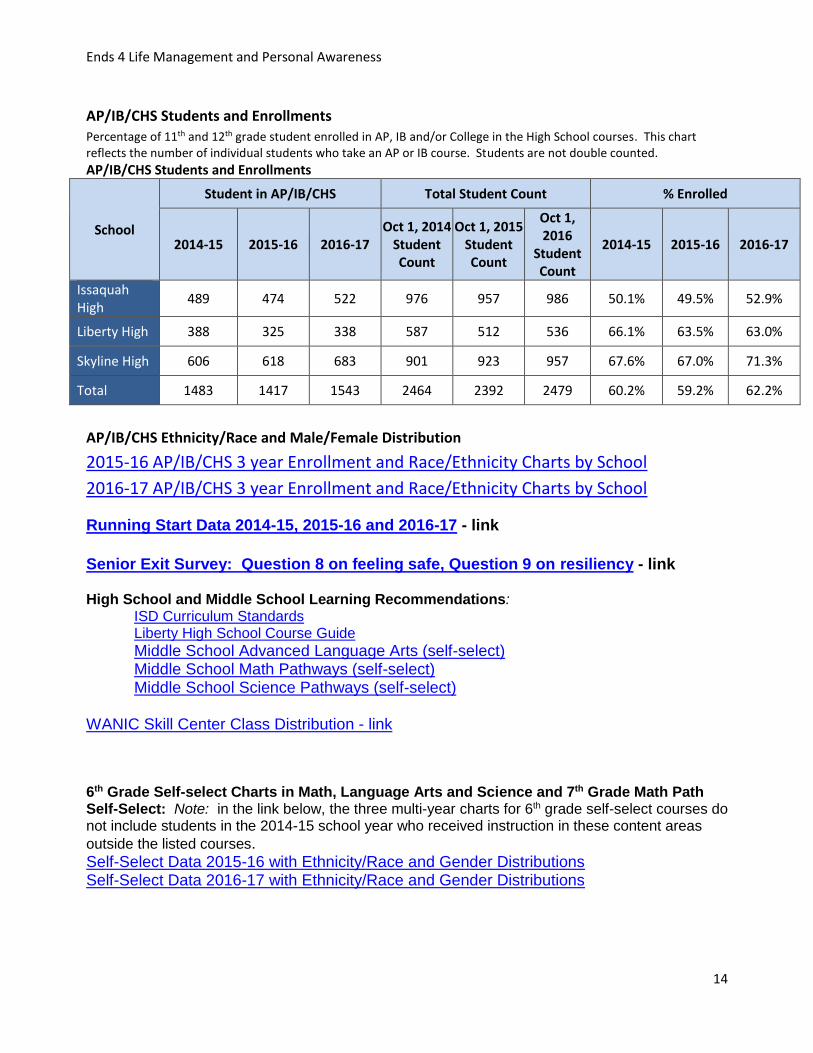
AP/IB/CHS Students and Enrollments Percentage of 11th and 12th grade student enrolled in AP, IB and/or College in the High School courses. This chart reflects the number of individual students who take an AP or IB course. Students are not double counted.
AP/IB/CHS Students and Enrollments
School
Student in AP/IB/CHS Total Student Count % Enrolled
2014-15 2015-16 2016-17 Oct 1, 2014
Student Count
Oct 1, 2015 Student Count
Oct 1, 2016
Student Count
2014-15 2015-16 2016-17
Issaquah High
489 474 522 976 957 986 50.1% 49.5% 52.9%
Liberty High 388 325 338 587 512 536 66.1% 63.5% 63.0%
Skyline High 606 618 683 901 923 957 67.6% 67.0% 71.3%
Total 1483 1417 1543 2464 2392 2479 60.2% 59.2% 62.2%
AP/IB/CHS Ethnicity/Race and Male/Female Distribution
2015-16 AP/IB/CHS 3 year Enrollment and Race/Ethnicity Charts by School
2016-17 AP/IB/CHS 3 year Enrollment and Race/Ethnicity Charts by School
Running Start Data 2014-15, 2015-16 and 2016-17 - link
Senior Exit Survey: Question 8 on feeling safe, Question 9 on resiliency - link High School and Middle School Learning Recommendations: ISD Curriculum Standards
Liberty High School Course Guide
Middle School Advanced Language Arts (self-select) Middle School Math Pathways (self-select) Middle School Science Pathways (self-select)
WANIC Skill Center Class Distribution - link 6th Grade Self-select Charts in Math, Language Arts and Science and 7th Grade Math Path Self-Select: Note: in the link below, the three multi-year charts for 6th grade self-select courses do not include students in the 2014-15 school year who received instruction in these content areas
outside the listed courses. Self-Select Data 2015-16 with Ethnicity/Race and Gender Distributions Self-Select Data 2016-17 with Ethnicity/Race and Gender Distributions

Ends 4 Life Management and Personal Awareness
15
Exit Survey ISD Webpage - data by school – link 5th Grade Exit Survey Question 7 - Source: Fifth Grade Exit Survey
*Data duplicated in some of the elementary schools.
5th Grade Exit Survey Question 17 - Source: Fifth Grade Exit Survey
*Data duplicated in some of the elementary schools. 8th Grade Survey Question 16 (32 in 2014) - Source: ISD Survey
Panorama Survey 2015, 2016 and 2017 - Question on Resiliency grades 4, 7 & 9 4.7 be able to cooperate and collaborate within a diverse group of people in order to attain desired outcomes We interpret 4.7 to mean students will acquire and apply the skills of collaboration and
teamwork to achieve goals.
When I struggle with something in school, I am able to learn from it, get past it, and eventually be successful.
Strongly Agree/Agree
District Results For all Elementary Schools*
2015 95%
1,441 responded
2016 93%
1,474 responded
2017 91%
1,544 responded
I feel free to express my thoughts and opinions in my school.
Strongly Agree/Agree
District Results For all Elementary Schools*
2015 74%
1,393 responded
2016 72%
1,474 responded
2017 71%
1,549 responded
I feel free to express my thoughts and opinions in my classes
Strongly Agree/Agree
BLMS IMS MMS PCMS PLMS
2015 66%
275 responses 70%
227 responses 71%
268 responses 62%
258 responses
74% 228 responses
2016 68%
279 responses 62%
195 responses 73%
241 responses 77%
259 responses
73% 267 responses
2017 66%
253 responses 60%
243 responses 60%
349 responses 64%
283 responses 67%
207 responses

Ends 4 Life Management and Personal Awareness
16
Evidence:
Graduation Rates and Requirements
Embedded in instructional strategies, Danielson Instructional Framework, curriculum, and classroom environment such as:
o Eurika Math curriculum o Guided Language Acquisition Design (GLAD) instructional model o See Talk Apply Reflect (STAR) Protocol, a research instrument to measure
Powerful Teaching and Learning (PTL) o National Board Certification Teacher program (NBCT), etc.
Support for incoming freshman: SHS Link Crew, LHS Patriot Crew, IHS Eagle Crew Programs at all High Schools
Extracurricular/Co-curricular Club, Activities, Sports
Decision Research Post-Graduate Survey Question # 20—Items 7 and 9 and ISD Post-Graduate Survey for 2017
Extra and Co-curricular Opportunities and Participation-Clubs/Activities Elementary and Middle Student Participation 2015-16 (link) Elementary Clubs and Activities Detail 2016-17 - link Middle School Clubs and Activities Detail 2016-17 - link Clubs and Activities Participation Rate Including High School:
*Total enrollments as of October 1, 2016, 2016-17 includes 17 Special Services students not included in subtotals as they were not enrolled in any of the 4 high schools.
CLUBS/ACTIVITIES: Extra and Co-curricular Student Participation Rates (numbers of students) and number of clubs/activities. Students participating in multiple clubs/activities are counted more than once.
School Year
2014-15 rate & total
2014-15 #clubs/activities
2015-16 rate & total
2015-16 #clubs/activities
2016-17 rate and
total
2016-17 rate and total
Elem rate Elem total *
6,146 9,017
149 6,256 9,184
145 7,977 9,382
170
Middle rate Middle total*
2,859
4,439
44 3,107 4,678
73 3,201 4,844
76
High rate High total*
5,223 5,368
131 5,882 5,385
178 5,623 5,519
190
Total rate Total Enrollment*
14,228 18,824
324 15,245 19,254
396 19,762*
428

Ends 4 Life Management and Personal Awareness
17
Two charts below – Decision Research 2011-15 and ISD Post-Graduate Survey 2017, same question:
Upon graduation how prepared were you: Understanding National/World problems? and
Upon graduation, how prepared were you in: Social Relations?
ISD Post-Graduate Survey
% of Very Prepared and Somewhat Prepared
% Not sure % of Not Prepared and Somewhat Unprepared
Graduating Class of 2017, 299 responses
2017 299 responses
2017 2017
World and National Problems
67% 13% 20%
Social Relations 75% 9% 16%
Students are surveyed in the year following graduation.
4.8 identify challenging personal goals and develop, evaluate and implement plans to achieve them, including post-high school goals that extend their K-12 learning to attainable next levels of education, training or employment;
We interpret 4.8 to mean students will be able to articulate their personal and educational
goal(s) and plans for implementation.
Evidence:
Graduation Rates and Requirements
Senior Exit Interviews High School and Beyond Plan—College and career goals are included in the High School and Beyond Plan.
High School IEP with Transition Plans
Decision Research Post-Graduate Survey Question #20 – Item 6. Seeking and Getting a Job and ISD Post-Graduate Survey for 2017
Post Secondary Data – Decision research and Education Research and Development Center (EDRC)
Decision Research
% Prepared % Not Sure % Not Prepared
Graduating Class
2011 2013 2015 2011 2013 2015 2011 2013 2015
7. World and National problems
64 72 68 19 9 17 16 19 15
9. Social Relations
86 82 77 8 14 11 7 4 or less
12

Ends 4 Life Management and Personal Awareness
18
Senior Exit Interviews
Senior Exit Interview Questions – (same questions for all high schools) High School and Beyond Plan
Skyline
Issaquah
Liberty Other Links
OSPI High School and Beyond Plans
High School IEP with Transition Plans
WA State Post-School Special Education Data 2015-16
Issaquah Post-School Special Education Data 2015-16
Issaquah and State: Special Education Grads vs. Non-Grads 2015-16 o Issaquah 3 year overview 2013-2016 and Issaquah Post School Outcomes
2015-2016
Issaquah Post-School Data by Disability 2015-16
Issaquah Post-School Special Education Data by Gender 2015-16 Two charts below – Decision Research 2011-15 and ISD Post-Graduate Survey 2017, similar question: Source: Decision Research Post-Graduate Survey Question 20—Item 6 Upon graduation how prepared were you in seeking and getting a job.
Source – ISD Post Grad Survey for 2017– Survey Question 9
Upon graduation how prepared were you in seeking and getting employment.
Students are surveyed in the year following graduation.
% Prepared % Not Sure % Not Prepared
Graduating Class
2011 2013 2015 2011 2013 2015 2011 2013 2015
6. Seeking, Getting a Job
53 43 57 27 34 19 20 23 23
% of Very Prepared and Somewhat Prepared
% Not sure % of Not Prepared and Somewhat Unprepared
Graduating Class of 2017, 299 responses
2017 299 responses
2017 2017
Seeking and getting employment
48% 19% 35%

Ends 4 Life Management and Personal Awareness
19
Post secondary enrollment of the students who took the survey Source: Decision Research Survey
Education Research Data Center:
ERDC - 2016 HS Graduates Enrolled in Postsecondary Education - Issaquah and State
ERDC Website - High School Feedback Reports (click on Statewide Comparison and select district)
4.9 learn and apply principles of sound financial management in order to support self and family
We interpret 4.9 to mean students will know and apply effective and accurate strategies
for personal and/or family financial stability.
Evidence:
Co-curricular Activities (DECA) and students enrolled in financial/economics/accounting
Consumer/Financial Literacy in Social Studies
Financial Literacy as part of the 8th grade curriculum for all students
Financial Consumerism—Decision Research Post-Graduate Survey Question # 20—Items 3, 10 and ISD Post Grad Survey for 2017
2016-17 Financial Literacy Coursework Financial/Consumer Literacy in Social Studies Financial/Consumer Literacy descriptors Financial Literacy as part of the 8th grade curriculum for all students
Type of Post-Secondary Enrollment
Graduation Year Attending Post-Secondary Full or
Part Time
4 Year College or University
Community College
Trade or Tech School
Other/Don’t Know
2007 N=324
87% 69% 27% 3% 1%
2009 N=332
86% 68% 27% 4% 1%
2011 N=333
80% 68% 28% 3% 1%
2013 N=345
84% 69% 27% 2% 2%
2015 N=332
84% 71% 23% 3% 3%

Ends 4 Life Management and Personal Awareness
20
Two charts below – Decision Research 2011-15 and ISD Post Grad Survey for 2017, similar question: Question 20.3. Upon graduation how prepared were you in working numerical problems/finances, and 20.10. Upon graduation how prepared were you in informed consumerism Source: Decision Research
Source – ISD Post Grad Survey for 2017
% of Very Prepared and Somewhat Prepared
% Not sure % of Not Prepared and Somewhat Unprepared
Graduating Class of 2017, 299 Responses
2017
2017 2017
3. Working numerical problems and finances
66% 9%
26%
10. Being an informed consumer
67% 14% 19%
Capacity Building: (4.2) Data from the Counseling Department for the 2017-18 school year (4.5) Consider art, coding, writing, robotics, music, and Reflections
Board acceptance:
% Prepared % Not Sure % Not Prepared
Graduating Class 2011 2013 2015 2011 2013 2015 2011 2013 2015
3.Numerical Problems and Finances
68 67 67 14 19 15 17 14 19
10.Informed Consumerism
72 70 64 16 21 22 12 10 15