endsem report
TRANSCRIPT
5/6/2018 Endsem Report - slidepdf.com
http://slidepdf.com/reader/full/endsem-report 1/60
P a g e | 1
INDIAN INSTITUTE OF INFORMATION
TECHNOLOGY ALLAHABAD
(A Centre of Excellence in Information Technology Established by Govt. of India)
WSN for Environment Protection Climate Monitoring
A BACHELOR¶S THESIS
Submitted in fulfillment
of the requirements for the award of the degree
of
BACHELOR OF TECHNOLOGY
in
Electronics and communication
(B. Tech ECE)
Submitted by
Puneet Khanna
(IEC2007060)
Under the Guidance of:
Prof. G N Pandey
IIIT-Allahabad
MAY, 2011

5/6/2018 Endsem Report - slidepdf.com
http://slidepdf.com/reader/full/endsem-report 2/60
P a g e | 2
INDIAN INSTITUTE OF INFORMATION
TECHNOLOGY ALLAHABAD
(A Centre of Excellence in Information Technology Established by Govt. of India)
CANDIDATE¶S DECLARATION
I hereby declare that the work presented in this project entitled ³WSN for Environment
Protection ± Climate Monitoring´, submitted in the fulfillment of the degree of
Bachelor of Technology (B.Tech), in Electronics and Communication at Indian Institute
of Information Technology, Allahabad, is an authentic record of my original work carriedout under the guidance of Prof. G N Pandey. Due acknowledgements have been made in
the text of the project to all the other materials used. This project work was done in full
compliance with the requirements and constraints of the prescribed curriculum.
Place: Allahabad
Date: 15-05-11
Puneet Khanna
(IEC2007060)

5/6/2018 Endsem Report - slidepdf.com
http://slidepdf.com/reader/full/endsem-report 3/60
P a g e | 3
INDIAN INSTITUTE OF INFORMATION
TECHNOLOGY ALLAHABAD
(A Centre of Excellence in Information Technology Established by Govt. of India)
CERTIFICATE
This is to certify that the above statement made by the candidate is correct to the best of
my knowledge.
Prof. G N Pandey
Date: 15-05-11
Place: Allahabad
Committee on Final Examination for Evaluation of the project
_______________________
_______________________

5/6/2018 Endsem Report - slidepdf.com
http://slidepdf.com/reader/full/endsem-report 4/60
P a g e | 4
INDIAN INSTITUTE OF INFORMATION
TECHNOLOGY ALLAHABAD
(A Centre of Excellence in Information Technology Established by Govt. of India)
ACKNOWLEDGEMENTS
I would like to take this opportunity to express my deep gratitude to my guide Prof. G N
Pandey, under whose able guidance this work has been done. His valuable suggestions,
constant encouragement and inspiration were of immense help in preparation of the
project. I am also thankful to my colleagues for their feedbacks. Besides, comments and
suggestions of the examining board are welcome as well.
Place: Allahabad Puneet Khanna
(IEC2007060) Date: 15-05-11

5/6/2018 Endsem Report - slidepdf.com
http://slidepdf.com/reader/full/endsem-report 5/60
P a g e | 5
INDIAN INSTITUTE OF INFORMATION
TECHNOLOGY ALLAHABAD
(A Centre of Excellence in Information Technology Established by Govt. of India)
ABSTRACT
This project aims at use of wireless sensor networks for environment protection.
Climate monitoring using sensors gives a huge advantage over other existing methods
to date.
Reliable climate information can help countries plan for adverse and beneficialclimate events, allocate resources, and achieve development goals.
Advances in climate science, including forecasting on seasonal and sub-seasonal
timescales, decadal- scale climate change and variability, real-time climate
monitoring, and tailoring of climate information to specific user needs are creating
opportunities to improve climate risk management, especially in developing countries
where societal needs are greatest.
The use of cables makes the system bulkier, complicating the scalability issue andthus rendering the system costly.
The advantages of using wireless sensor networks include:
y Fully automated data monitoring 24 hours/day, 7 days/week
y Wireless connectivity eliminates the need of cabling
y Efficient even for outdoor use
y Low current consumption

5/6/2018 Endsem Report - slidepdf.com
http://slidepdf.com/reader/full/endsem-report 6/60
P a g e | 6
TABLE OF CONTENTS
1. INTRODUCTION...«««.««««««««««««««««««««7-15
2. LITERATURE REVIEW««««««.««««««««««««««..16-39
3. PLAN OFWORK...««««««««««««««««««««««...40-45
4. RESULT AND FINDINGS«..«««««««««««.«««««««46-57
5. CONCLUSION AND FUTURE PERSPECTIVE««««««««««««..58
6. BIBILOGRAPHY««««««««««««««««««.««««««..59
7. COMMENTS AND SUGGESTIONS«««««««««««««««««.60

5/6/2018 Endsem Report - slidepdf.com
http://slidepdf.com/reader/full/endsem-report 7/60
P a g e | 7
1. INTRODUCTION
1.1. OBJECTIVE
The objective of the project is to use wireless sensor networks for the
protection of the environment. This is achieved by monitoring the temperature and
humidity values using wireless sensors.
1.2. MOTIVATION
The motivation behind this project comes from the fact that existing systems
used for maintaining the temperature and humidity levels are bulky, costly and
create hassles from time-to-time. Also, societal needs have increased.
Thus, a technology which can provide efficient solutions without much cost
or hassle is always preferred.
Climate Monitoring is required in various fields today, so there is a demand
of this technology.
1.3. OVERVIEW
1.3.1. WIRELESS SENSOR NETWORKS
Wireless Sensor Networks (WSNs) consists of spatially distributed
autonomous sensors to monitor physical or environmental conditions, such as
temperature, sound, vibration, pressure, motion or pollutants and to cooperatively
pass their data through the network to a main location.
The development of WSNs was motivated by military applications such as battlefield surveillance; today such networks are used in many industrial and
consumer application, such as industrial process monitoring and control, machine
health monitoring, environment and habitat monitoring, healthcare applications,
and traffic control.

5/6/2018 Endsem Report - slidepdf.com
http://slidepdf.com/reader/full/endsem-report 8/60
P a g e | 8
1.3.2. WHYWIRELESS SENSOR NETWORKS
Fundamental objectives of sensor networks are reliability, accuracy,
flexibility, cost effectiveness and ease of deployment.
Key characteristics and benefits of WSN (Wireless Sensor Networks) are
outlined below:
� Sensing accuracy
The utilization of a larger number and variety of sensor nodes provides
potential for greater accuracy in the information gathered as compared to that
obtained from a single sensor.
� Area coverage
This implies that fast and efficient sensor network could span a greater geographical area without adverse impact on the overall network cost.
� Fault tolerance
Device redundancy and consequently information redundancy can be
utilized to ensure a level of fault tolerance in individual sensors.
� Connectivity
Multiple sensor networks may be connected through sink nodes, along with
existing wired networks (e.g. Internet).
The clustering of networks enables each individual network to focus on
specific areas or events and share only relevant information.
� Minimal human interaction
Having minimum human interaction makes the possibility of having less
interruption of the system.
� Operability in harsh environments
Sensor nodes, consisting of robust sensor design, integrated with high levelsof fault tolerance can be deployed in harsh environments that make the sensor
networks more effective.

5/6/2018 Endsem Report - slidepdf.com
http://slidepdf.com/reader/full/endsem-report 9/60
P a g e | 9
1.3.3. CLIMATE MONITORING APPLICATIONS
For decades, museums have kept their thermostats at a steady 21 degrees
Celsius (70 degrees Fahrenheit), with a relative humidity of 50 percent.
Researchers have found that most museum objects can safely tolerate a wider range of both temperature and relative humidity.
In fact, according to the teams research, there can be as much as plus or
minus 15 percent fluctuation in relative humidity and as much as 10C (50 F)
difference in temperature.
Within that range the scientists say, any object ± whether it¶s Leonardo da
Vinci¶s painting ³Mona Lisa´ or an installation of Jeff Koons¶ vacuum cleaners ±
may be safely stored or placed in exhibit.
The researchers¶ insights could save museums, archives and libraries
millions of dollars in construction and energy costs necessary to maintain
environment controls. [10]
Thus, there is a need of monitoring climate changes to prevent such artifacts.
Moreover, climate monitoring is beneficial for the following fields:
y HOSPITAL / HEALTH
Monitoring temperature and humidity is essential in hospitals for drug storage,
vaccine storage, blood bank monitoring, tissue storage, refrigerator monitoring,
laboratory, surgical suites, etc.
y MEDICAL EQUIPMENTS
Monitoring temperature for ovens, refrigerators, packaging, sterilizers,
laboratories, storage, clean rooms, is essential for effectiveness and efficiency.
y FOOD
Ensuring that our food supply is safe is of utmost importance. Monitoring
temperature and humidity can ensure that the food is produced and stored
safely.
5/6/2018 Endsem Report - slidepdf.com
http://slidepdf.com/reader/full/endsem-report 10/60
P a g e | 10
y TRANSPORTATION
Proper storage in any part of the supply chain like temperature controlled
warehouses is important and thus arises a need to monitor temperature.
y MANUFACTURING
Monitoring the production facility, from warehouses to clean rooms, ensures
products are created in safe and controlled environments.
y CONSTRUCTION
Environmental monitoring of construction sites ensures building materials are
stored and utilized properly and safely.
y SCHOOLOn campuses, large or small, everything needs to be monitored from research
labs and building efficiency to student comfort in dormitories.
y AUTOMOBILES
From assembly line to showroom, climate monitoring can ensure proper
production and sale of the inventory.
y PRINTING/ PACKAGINGClimate Monitoring can help protect papers, inks, and other high quality
resources the customers demand.
Thus, climate monitoring finds a wide range of applications and proves to be
a good substitute to the old cable systems. Since the applications of climate
monitoring are vast and varied, the demand of this technology is also huge.
1.3.4. HARDW
AREThe hardware used for monitoring temperature and humidity is TelosB mote.
The TelosB mote platform is an open source, low power wireless sensor module
designed to enable cutting edge experimentation for research community.
5/6/2018 Endsem Report - slidepdf.com
http://slidepdf.com/reader/full/endsem-report 11/60
P a g e | 11
1.3.5. SOFTWARE
The software for sensing is TinyOS. It is an open source component-based
operating system and platform targeting wireless sensor networks (WSNs). Its
applications are written in nesC, a dialect of the C language optimized for
memory limits of sensor networks.
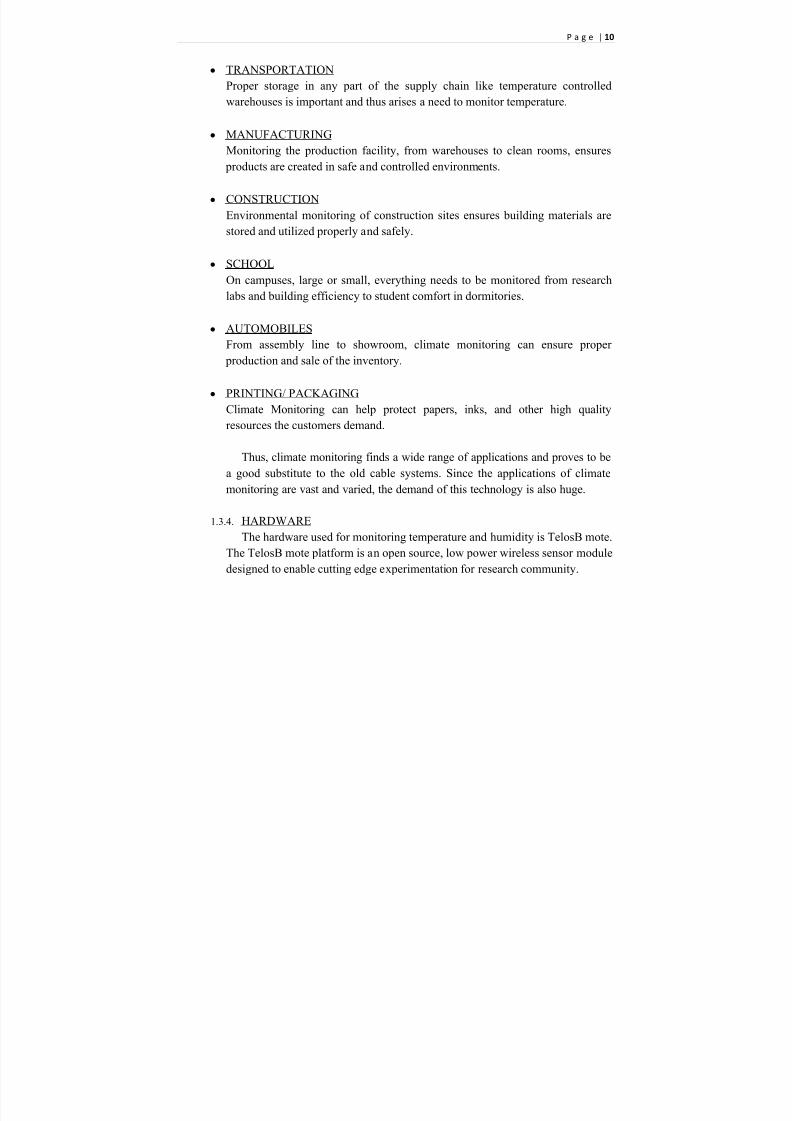
1.3.6. TELOSB MOTE
The Telos module is a low power mote with integrated sensors, radio,
antenna, microcontroller, and programming capabilities.
Fig: CrossBow¶s TelosB mote with integrated temperature, humidity and light sensors [9]
TelosB mote may be powered by two AA batteries. AA cells may be used in
the operating range of 2.1 to 3.6V DC, however the voltage must be at least 2.7V
when programming the microcontroller flash or external flash.
If the TelosB mote is plugged into the USB port for programming or
communication, it will receive power from the host computer.
The mote operating voltage when attached to USB is 3V. If the TelosB mote
is always attached to the USB, no batteries are required.

5/6/2018 Endsem Report - slidepdf.com
http://slidepdf.com/reader/full/endsem-report 12/60
P a g e | 12
The input voltage should never be more than 3.6V or it may damage the
microcontroller, radio or other components.
Fig: TelosB mote
The humidity/temperature sensor is manufactured by Sensirion AG. The
SHT11 sensor is calibrated and produces a digital output. The calibration
parameters are stored in the sensor¶s onboard EEPROM.
For measuring the temperature and relative humidity, Sensirion SHT11 all-round temperature and humidity sensor will be used. SHT11 is Sensirion¶s family
of surface mountable relative humidity and temperature sensors.
The sensors integrate sensor elements plus signal processing on a tiny foot
print and provide a fully calibrated digital output. A unique capacitive sensor
element is used for measuring relative humidity while temperature is measured by
a band gap sensor.
The sensor is produced using a CMOS process and is coupled with a 14-bitA/D converter.
The low power humidity sensor is small in size and may be used for a
variety of applications.[16]
5/6/2018 Endsem Report - slidepdf.com
http://slidepdf.com/reader/full/endsem-report 13/60
P a g e | 13
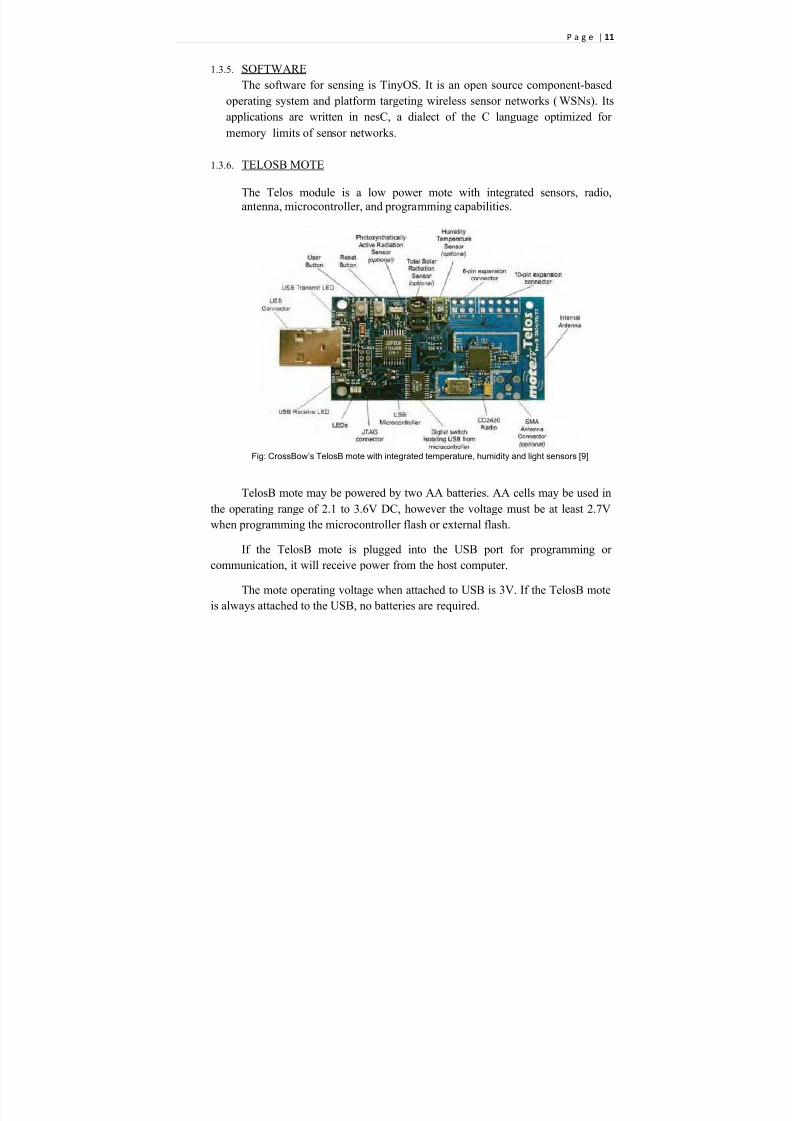
Fig: Referred from [17]
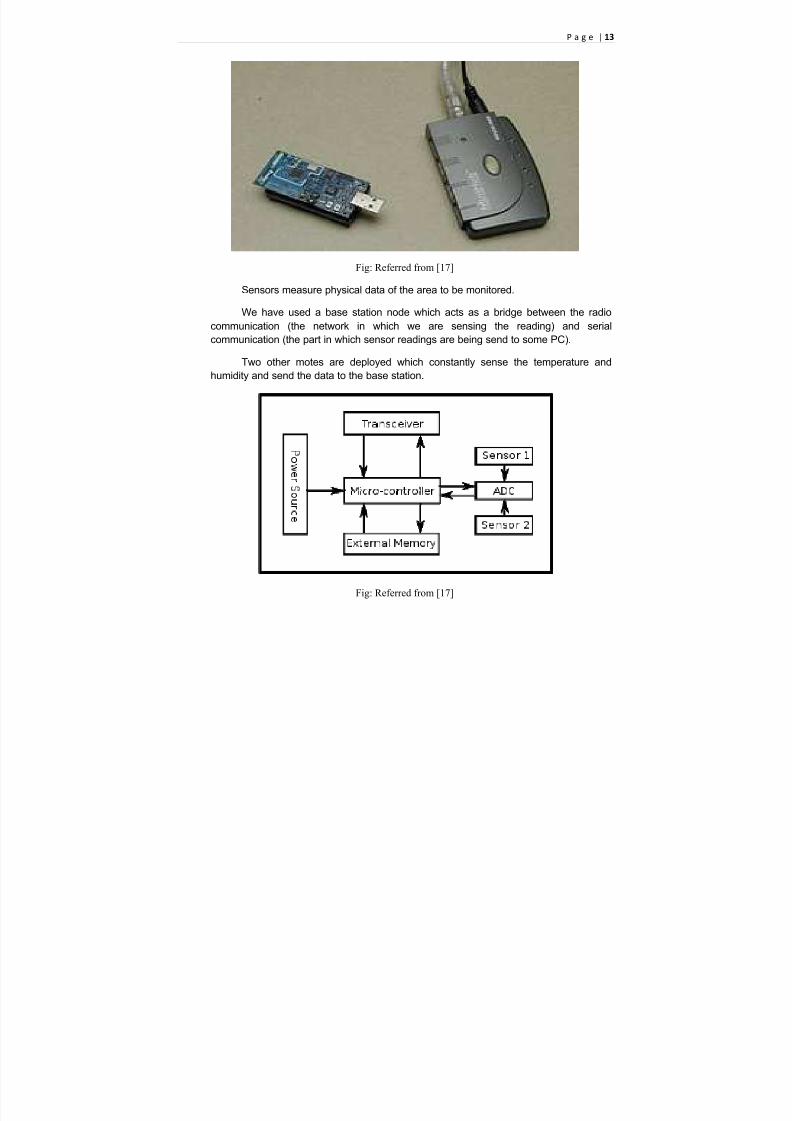
Sensors measure physical data of the area to be monitored.
We have used a base station node which acts as a bridge between the radio
communication (the network in which we are sensing the reading) and serial
communication (the part in which sensor readings are being send to some PC).
Two other motes are deployed which constantly sense the temperature and
humidity and send the data to the base station.
Fig: Referred from [17]

5/6/2018 Endsem Report - slidepdf.com
http://slidepdf.com/reader/full/endsem-report 14/60
P a g e | 14
1.3.7. Features of TelosB mote [2]
� IEEE 802.15.4 compliant RF transceiver
� 2.4 to 2.4835 GHz, a globally compatible ISM band
� 250 kbps data rate
� Integrated onboard antenna� 8 MHz TI MSP430 microcontroller with 10kB RAM
� 1MB external flash for data logging
� Programming and data collection via USB
� Sensor suite including integrated light, temperature and humidity sensor
� Runs TinyOS 1.1.11 or higher
� Processor Performance - 16-bit RISC
� Program Flash Memory ± 48 Kbytes
� RAM ± 10 Kbytes
� EEPROM ± 16 Kbytes
� Analog to Digital Converter ± 12 bit ADC
� Digital to Analog Converter ± 12 bit DAC
� Current Draw ± 1.8 mA (Active mode), 5.1 uA (Sleep mode)
� Frequency band ± 2400 MHz to 2483.5 MHz
� Transmit Data Rate ± 250 kbps
� RF Power - -24dBm to 0 dBm
� Receive Sensitivity - -90 dBm (min), -94 dBm (typ)
� Outdoor Range ± 75 m to 100 m
� Indoor Range ± 20 m to 30 m
� Humidity Sensor Range ± 0 to 100% RH
� Resolution ± 0.03% RH
� Accuracy ± ±3.5% RH
� Temperature Sensor Range - -40 °C to 123.8 °C
� Resolution ± 0.01 °C
� Accuracy- ± 0.5 °C @ 25 °C
� Weight 0.8 grams� Power Source from USB or 2 AA batteries
1.3.8. APPLICATIONS OF TELOSB MOTE
� Platform for Low Power Research Development
� Wireless Sensor Network Experimentation

5/6/2018 Endsem Report - slidepdf.com
http://slidepdf.com/reader/full/endsem-report 15/60
P a g e | 15
1.3.9. TINYOS
TinyOS is a free and open-source component based operating system and
platform targeting wireless sensor networks.
It is an embedded operating system written in the nesC programming
language as a set of cooperating tasks and processes.
TinyOS is an operating environment designed to run on embedded devices
used in distributed Wireless Sensor Networks.
1.3.10. NESC
All TinyOS code is written in NesC.
NesC (network embedded systems C) is a component-based, event-drivenprogramming language used to build applications for the TinyOS platform.
NesC is a C language with additional components. It consists of one or
more components assembled to form an executable application.
The components in nesC include the following:
a) Modules - provide the implementations of interfaces.
b) Configurations - assemble other components together, connecting interfacesused by components.

5/6/2018 Endsem Report - slidepdf.com
http://slidepdf.com/reader/full/endsem-report 16/60
P a g e | 16
2. LITERATURE REVIEW
The field of wireless sensor networks is relatively new. Wireless sensors can be
used for a lot of applications. A lot of work has been done towards monitoring of
temperature and humidity using various techniques and for varied applications. Someof the research papers which include sensing of temperature and humidity are as
follows:
2.1. Smartening the environment using wireless sensor networks in
a developing country by Pathan, A.-S.K. ; Choong Seon Hong ;
Hyung-Woo Lee ; Dept. of Comput. Eng., Kyung Hee Univ.,
Seoul, 2006 [14]
2.1.1. ABSTRACT
The miniaturization process of various sensing devices has become a reality
by enormous research and advancements accomplished in micro electro-
mechanical systems (MEMS) and very large scale integration (VLSI)
lithography.
Regardless of such extensive efforts in optimizing the hardware, algorithm,
and protocols for networking, there still remains a lot of scope to explore
how these innovations can all be tied together to design wireless sensor networks (WSN) for smartening the surrounding environment for some
practical purposes.
In this paper the prospects of wireless sensor networks are explored and a
design level framework for developing a smart environment using WSNs is
proposed, which could be beneficial for a developing country like
Bangladesh or India.
2.1.2. INTRODUCTION
The notion of smart environment is becoming a reality with the
advancements of various smart technologies. Smart environments represent the
future evolutionary development step for the real world environment of present
time.

5/6/2018 Endsem Report - slidepdf.com
http://slidepdf.com/reader/full/endsem-report 17/60
P a g e | 17
A smart environment, like any conscious organism, relies first and foremost
on sensory data acquired from multiple sensors in distributed locations of real
world. It gathers information about its surroundings as well as about its internal
workings.
In the recent years, an exciting new type of networks has emerged, called
Wireless Sensor Networks (WSN). The deployment of such networks not only
effectively acquires the data from different locations and then distribute to the
management centers but also facilitates other applications for facing disasters and
other environmental issues.
In this paper, we explore the scope to deploy Wireless Sensor Networks for
developing a smart environment especially in Bangladesh to facilitate various
sophisticated systems to face disasters like flood, tsunami, and cyclones as well as
to enhance road traffic monitoring system.
In fact, the notion of smart environment has a great potential for a
developing country like Bangladesh which faces different types of natural
disasters each year.
While some other works focus on specific topics like smart homes, smart
classrooms etc. as a part of smart environment, we explore the promise of
wireless sensor networks for smartening the environment by up-gradation of
various monitoring and warning systems aided with wireless sensing technology.
2.1.3. SMART SENSORS AND WSN
Massive advancements in wireless communications, Micro-Electro-
Mechanical Systems (MEMS), and optics have opened the new chapter of
modern civilization, populated with small, low-power, cost-effective, autonomous
devices, termed sensor nodes, which would pervade our society redefining the way
it is at present.
Sensor nodes are of the combination of sensing and special-purposecomputing devices tied with wireless communications. When networked, such
sensor nodes would build up the part of larger systems, providing data, as well as
performing and controlling multitude of tasks and functions.
Small size and cost of individual sensor nodes would be the key ingredient
for a large number of applications both in ordinary as well as harsh

5/6/2018 Endsem Report - slidepdf.com
http://slidepdf.com/reader/full/endsem-report 18/60
P a g e | 18
environments. Given the utility of sensor networks in environmental data
collection, surveillance, and target tracking, they can aid numerous applications as
their requirements vary along with the time-space-context continuum.
Sensor networks can be used in support of preparation and prevention during
various phases of pre-event, rapid response during the event, and post recovery
along with analysis after the event.
To benefit the environment, in practical, these large number of miniaturized
commodity sensor nodes could be installed, for example in buildings, on roads, in
vehicles, at the riverbanks, or at coastal areas etc.
Deployment of new sensor nodes may take place on demand at any time at
designated locations, referred to as area of interest (AOI) or at random in
specified areas.
Fig: Basic Sensor Architecture [14]
A smart sensor node is a combination of sensing, processing and
communication technologies. The above figure shows the basic architectural
components of a sensor node.
The sensing unit senses the change of parameters, signal conditioning
circuitry prepares the electrical signals to convert to the digital domain, thesensed analog signal is converted and is used as the input to the application
algorithms or processing unit, the memory helps processing of tasks and the
transceiver is used for communicating with other sensors or the base stations
or sinks inWSN.
5/6/2018 Endsem Report - slidepdf.com
http://slidepdf.com/reader/full/endsem-report 19/60
P a g e | 19
Sensors can monitor temperature, pressure, humidity, soil makeup, vehicular
movement, noise levels, lighting conditions, the presence or absence of
certain kinds of objects or substances, mechanical stress levels on attached
objects, and other properties. Their mechanism may be seismic, magnetic,
thermal, visual, infrared, acoustic, or radar.
A smart sensor is also capable of self-identification and self-diagnosis. The
mechanisms of smart sensors work in one of three ways: by a line of sight to
the target (such as visual sensors), by proximity to target (such as seismic
sensors), and by propagation like a wave with possible bending (such as
acoustic sensors).
Sensor networks are predominantly data-centric rather than address-centric.
In such a network, queries are directed to a region containing a cluster of sensor
nodes rather than specific sensor addresses. Given the similarity in the dataobtained by sensors in a dense cluster, aggregation of the data is performed locally.
That is, a summary or analysis of the local data is prepared by an aggregator node
within the cluster, thus reducing the communication bandwidth requirements.
Aggregation of data increases the level of accuracy and incorporates data
redundancy to compensate node failures. A network hierarchy and clustering
of sensor nodes allows for network scalability, robustness, efficient resource
utilization and lower power consumption which are some of the key issues in
WSN.
2.1.4. APPLICATION OFWSN TOWARDS BANGLADESH
By the geographical location in the globe, Bangladesh is very susceptible to
many environmental calamities like, flood, cyclone, tsunami etc.
Good warning systems could effectively help to mitigate the damages
caused by these natural disasters. Hence, the development of wireless sensor
networks to assist meteorologists has a great deal of national importance in
Bangladesh.
Sensor networks provide the ability to gather accurate and reliable
information, to enable early warnings and rapid coordinated responses to
potential threats. This encompasses the ability to save lives throug
environmental monitoring of natural disasters.

5/6/2018 Endsem Report - slidepdf.com
http://slidepdf.com/reader/full/endsem-report 20/60
P a g e | 20
Only proper infrastructure through long term research and implementation of
these technologies can make huge difference in a country like Bangladesh.
Environmental sustainability is of great importance in such geographical
locations in the world, where it could be improved through sensor monitoring, by
protecting valuable resources, and collecting valuable information previously
considered too difficult and too costly.
y Flood andWater Level Monitoring System
y Traffic Monitoring and Controlling
y Environmental monitoring
y Future Steps: Effective Localization scheme and Cost Effectiveness of the
System
2.1.5. CONCLUSION
As technology emerges over the decades, WSN has come to the spotlight for
its unattained potential and significance. Consequently, billions of dollars are being
committed to the research and development of sensor networks in order to address
the operational challenges that are still associated with the large-scale
implementation of sensor networks.
Without having the proper blueprint, no construction manager could put up
any building according to architect¶s intention. Similar approach appliesalmost in everywhere for developing any new system in the society.
This paper is mainly focused on the design level issues provided with a
framework for WSN to be applied on various systems. In case of Bangladesh,
flood and water level monitoring, traffic monitoring, and environmental
monitoring are among the systems having much potential to be aided with WSN,
which would lead the development of a smart environment.
Various smart applications and sophisticated systems could share the same
sensor nodes, deployed around the particular area of interest (AOI) for
performing the job simultaneously.
WSN, the emerging technology makes the possibility of recognizing present
and predicting future in a way not possible in past. A smart environment is to be
regarded as indispensable stage of a real time system for sensing and prevention of
any undesirable occurrence.

5/6/2018 Endsem Report - slidepdf.com
http://slidepdf.com/reader/full/endsem-report 21/60
P a g e | 21
2.2. Don¶t Sweat Your Privacy - Using Humidity to Detect Human
Presence by Jun Han, Abhishek Shah, Mark Luk, Adrian
Perrig, 2007 [11]
2.2.1. ABSTRACT
Sensor nodes are increasingly deployed in many environments. Most of
these nodes feature on-board sensor chips to measure environmental data such
as humidity, temperature and light.
In this paper, it is shown that seemingly innocuous and non-sensitive data
such as humidity measurements can disclose private information such as
human presence.
2.2.2. INTRODUCTION
Sensor networks are generally deployed to measure some characteristics
about a particular environment of interest. The data they gather can then be
analyzed to extract important information regarding the occurrence of events
in that environment.
Some well-known applications of sensor networks include surveillance of
critical infrastructure, tracking of environmental pollutants, measurement of
traffic flows, and climate sensing and control in office buildings and homes.
Sensor networks are tools for collecting information, and an adversary can
gain access to sensitive information either by accessing stored sensor data or
by querying or eavesdropping on the network.
Since sensor networks communicate over a wireless medium, even a remote
adversary can eavesdrop and gain access to the data collected by the network.
The need for privacy of data is evident in applications where sensor networksare deployed to collect personally identifiable information, such as sensing the
location of people in buildings for disaster preparedness.
However, in some environments, an adversary can use seemingly innocuous
data to derive sensitive information other than the data monitored.

5/6/2018 Endsem Report - slidepdf.com
http://slidepdf.com/reader/full/endsem-report 22/60
P a g e | 22
In this paper, one such instance of this problem is discussed. Specifically, it is
shown how seemingly innocuous data such as humidity measurements can be
used to determine human presence or absence in a room. This is shown
because humidity data is not considered to be privacy-sensitive today. Hence,
to reduce cost, the sensor networks monitoring humidity data will likely to be
unprotected, and the data collected throughout such system might be shared
freely without regard to privacy concerns.
The present work, however, overturns this conventional wisdom by
demonstrating that humidity data, is in fact, privacy-sensitive, since it yields
information about human presence. Several experiments using Moteiv Telos
motes running TinyOS are conducted and the results from these experiments
justify the claims.
It may be argued that an adversary could collect such personal informationdirectly through site surveillance. However, as prior work points out, the main
privacy problem posed by sensor networks is not that they facilitate the
collection of information that would otherwise be impossible, but that sensor
networks aggravate the privacy problem by making important information
easily available through remote access.
Hence, an adversary can gather information in a low risk, anonymous manner
without being physically present to maintain surveillance. As the results from
the experiments in this paper indicate, given a room with a setup of sensor nodes that measure humidity, a remote adversary can determine human
presence or absence in that room by only using the humidity readings from the
sensor nodes deployed in that room.
It is noted that this system is not a substitute for a human activity/motion
detector system. Rather, it serves as a demonstration for inferring privacy-
sensitive personal information such as human presence by only using humidity
measurements.
2.2.3. SYSTEM DESCRIPTION
Before we explain the details of our system, we first give a brief overview to
summarize the main ideas in our approach.

5/6/2018 Endsem Report - slidepdf.com
http://slidepdf.com/reader/full/endsem-report 23/60
P a g e | 23
In our system, we deploy a sensor node in proximity to a user in a room.
This sensor node performs humidity measurements and reports the readings
to a data collection server.
The humidity readings are then processed at the server, and based on the
dynamics of the humidity data we are able to detect human presence and
absence.
Our system consists of the following three phases:
(a) data acquisition,
(b) data calibration, and
(c) detection algorithm.
We now proceed to the detailed description of each of these phases.
(a) Data Acquisition
For our experiments, we use the Sensirion SHT15 humidity sensor mounted
on a Moteiv Telos mote that is placed within a distance of one meter from the
subject.
The Moteiv Telos is a popular mote architecture in the sensor network
research community. It features the 8MHz TI MSP
430 micro-controller, a 16-bitRISC processor with 10 Kbytes of SRAM, a 48Kbytes flash ROM, and a 12-bit
Analog/Digital Converter with multiple input channels.
It also carries a variety of sensors that include the Hamamatsu light sensors
and Sensirion temperature and humidity sensors. Telos motes run TinyOS,
a real time operating system that is light weight and is specially designed for
sensor nodes that have limited resources.
Sensirion SHT 15 is a high precision humidity sensor that uses the CMOS
process and outputs digital values using its internal 12-bit A/D converter. It has atypical resolution of 0.03% Relative Humidity (RH), and its humidity and
temperature accuracies are 2.0 (%RH), and 0.3 (at 25 Celsius).
We use a small TinyOS application written in nesC (the programming
language for TinyOS) to obtain the sensor readings and transmit them to the PC.
5/6/2018 Endsem Report - slidepdf.com
http://slidepdf.com/reader/full/endsem-report 24/60
P a g e | 24
The application samples humidity and temperature data every 500
milliseconds from the SHT15. The readings are then transferred to the UART,
which is MSP430¶s universal synchronous/asynchronous receiver/transmitter
(USART) set in an asynchronous mode. This allows us to transfer the data from the
Telos mote to the server via a USB connection.
The data transferred from the Telos mote is read at the serial port on the
server. To process this data, we implement a real-time analysis script written
in MATLAB. When an event is triggered at the serial port, the script executes a
callback function to process and graph the raw data in real time.
(b) Data Calibration
In order to process the received data, it must first be calibrated to the standardunits: Relative Humidity ( RH ) for humidity and degree Celsius for temperature.
We use well-known standard techniques to perform data calibration for humidity
and temperature.
For the sake of completeness, we briefly discuss them here. We use Equation 1 to
calibrate the raw temperature readings obtained from the sensor node.
C = D1+ D2 t (1)
In the above equation, D1 and D2 are temperature conversion coefficients
equivalent to í39.6 and 0.01 respectively, and t is the raw temperature reading
from the sensor. To calibrate the raw humidity readings, we use Equation 2 given
below.
RH = (C í25) (T 1+T 2 s) + h (2)
In the above equation, C is the calibrated temperature in degrees Celsius, T 1 and
T 2 are the temperature compensation coefficients equivalent to 0.01 and 0.00008
respectively, s is the raw humidity reading from the sensor, and h is the
temperature-uncompensated humidity value given by:
h = K 1+ K 2 s + K 3 s2 (3)
5/6/2018 Endsem Report - slidepdf.com
http://slidepdf.com/reader/full/endsem-report 25/60
P a g e | 25
where K 1, K 2, and K 3 are the humidity conversion coefficients equivalent to í4,
0.0405, and í2.8×10í6 respectively.
(c) Data Algorithm
First, we apply a high pass filter to the calibrated humidity data obtained in the
second phase of Data Calibration, which is equivalent to the first order discrete
derivative of the input data. This will detect the changes in the original data.
Next, we set a threshold value T over the filtered humidity data.
Finally, we set a sliding window of size n for the data samples from the high pass
filtered data. At any point of time, we evaluate the samples in the current sliding
window to check if at least m of these samples exceeds the threshold value T . If the
check succeeds, then the system infers that a human is present.
This decision holds true until some point of time, when the above check fails. At
this point, the system decides that the human is absent.
Definition 1 Event E1 is the case where the system is able to successfully detect
human presence for a given sample when the human is present. We define
Detection Rate as the ratio of the total number of samples when event E1 occurs to
the total number of samples when the subject is present.
Definition 2 Event E2 is the case where the system detects human presence for a
given sample when the human is absent. We define False Positive Rate as the ratio
of the total number of samples when event E2 occurs to the total number of
samples when the subject is absent.
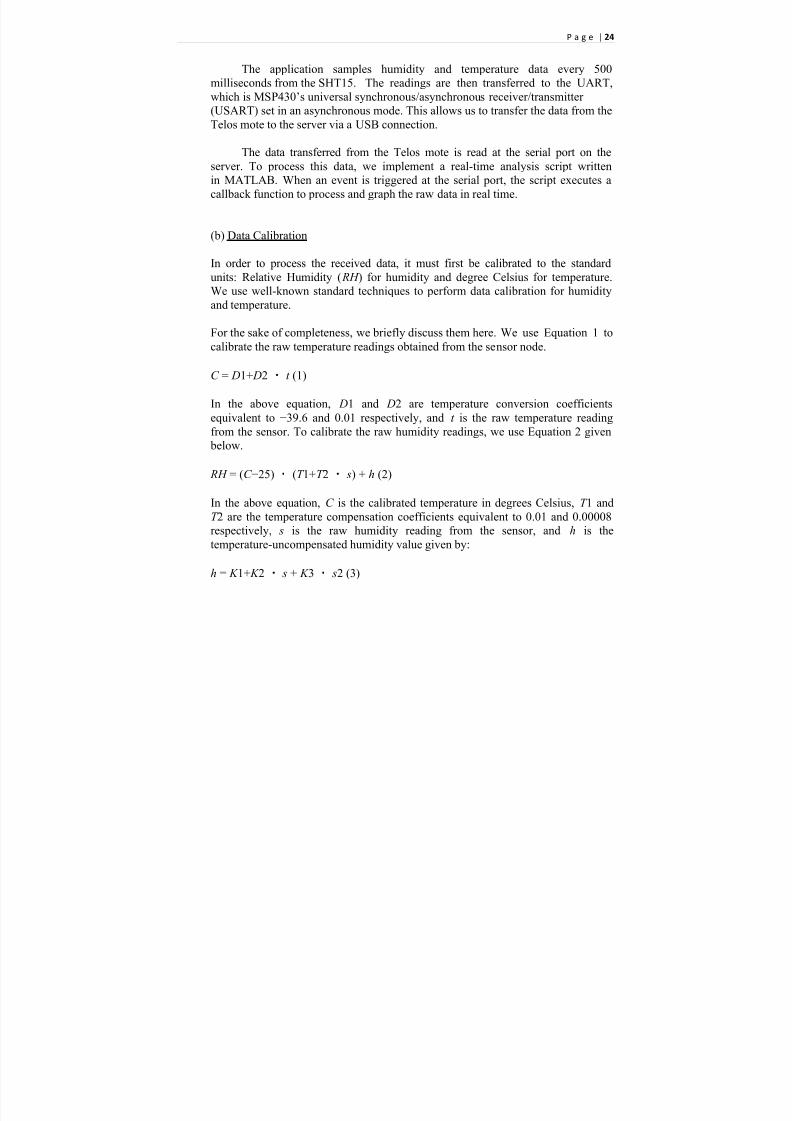
2.2.4. EXPERIMENTAL RESULTS
Experiment Detection Rate False Positive Rate
A 95.59 2.67
B 92.25 28.33C 91.80 29.70
Fig: This table summarizes the results from three different experiments.
Experiment B gives the trade-off value between Detection Rate and False Positive
Rate.

5/6/2018 Endsem Report - slidepdf.com
http://slidepdf.com/reader/full/endsem-report 26/60
P a g e | 26
2.3. Wireless Sensor Networks for Living Environment Monitoring
by Wu Zhengzhong ; Liu Zilin ; Liu Jun ; Huang Xiaowei ;
Dept. of Inf. Eng., Logistical Eng. Univ., Chongqing, China,
2009[15]
2.3.1. ABSTRACT
Wireless sensor networks (WSN) greatly extend our ability to monitor and
control the physical world. It can collaborate and aggregate a huge amount
of sensed data to provide continuous and spatially dense observation of
environment.
The control and monitoring of indoor atmosphere conditions represents an
important task with the aim of ensuring suitable working and living spaces
to people.
However, the comprehensive air quality, which includes monitoring of
humidity, temperature, gas concentrations, etc., is not so easy to be
monitored and controlled. In this paper a WSN monitoring system was
developed for living environment.
In the system several sensors were built in a RF transceiver board for
monitoring living conditions. The indoor environmental monitoring
parameters can be transmitted by wireless to database server and then
viewed throw PC or PDA accessed to the local area networks by
administrators.
The system, which was also field-tested and showed a reliable and robust
characteristic, is significant and valuable to people.
2.3.2. INTRODUCTION
The ability to monitor essential environmental factors can prove helpful and
very valuable to commercial or residential building owners.
To monitor factors such as temperature, humidity, and light coverage and
noise can help those building administrators improve local environmental
settings for human comfort levels or for the purpose of keeping certain goods in a
warehouse in a controlled temperature and humidity.

5/6/2018 Endsem Report - slidepdf.com
http://slidepdf.com/reader/full/endsem-report 27/60
P a g e | 27
The main issue to solve is gathering this data in an organized fashion and
viewing in human readable forms. Thanks for information technology nowadays
all electronic appliances in a home will be currently networked: PCs, telephones,
stereos, refrigerators, washing machines, even heating and air conditioning, and so
on.
But hard wiring up a monitoring system to perform the desired sensing
operations in each room is not very economical, in terms of wires to run and time
to take to complete the job.
There is also the issue of central data collection from each individual room
in building. The data collected from each room in every building location would
need to be stored in a central database server for remote viewing by the building
administrators.
With the constraints in mind, the desired system to perform sensing
operations must be small, easy to install, require very little maintenance, and
be out of reach from unauthorized people.
Recent advances in micro-electronics and micro electro-mechanical systems
(MEMS) and wireless communication technologies, have enabled the
development of low-cost, low-power, multifunctional sensor nodes that are small
in size and communicate wirelessly in short distances.
Environment monitoring system based on wireless sensor networks have
become more and more important in the field of protection and control of natural
and man-made environments, providing vast arrays of real-time, remote interaction
with the physical world.
Smart, wireless networked sensors system can collect and process an
enormous amount of data, from monitoring and control of air quality, traffic
conditions, to weather. A sensor network monitors not only just a few isolated
sensors, but also actually hundreds of intelligent sensor nodes providing local
measurements as well as overall patterns of change.
The promising technology of WSN helps to run factories, optimize widely
spread processes, monitor the weather, detect the spread of toxic gases in chemical
industries and even provide precious extra time in advance of earthquakes.

5/6/2018 Endsem Report - slidepdf.com
http://slidepdf.com/reader/full/endsem-report 28/60
P a g e | 28
Widespread use of WSN powered with the concept of distributed sensing
and computing of indoor and outdoor environment promises to revolutionize the
present state of environmental protection and control.
Rather than transmitting large amounts of raw data, the sensor nodes can
perform signal analysis and processes, communicating only the processed results.
Now intelligent sensor nodes can monitor control networks to establish an activity
easily when a sample is taken or even to determine when to sample, because
reducing the cost of obtaining and processing data reduces overall cost, and
improves system performance.
WSN are dense wireless networks of small, low cost unattended micro-
sensors that collect and disseminate environmental data indoor and outdoor. These
microsensors are equipped with a sensor module, e.g. acoustic, light, temperature,
magnetic, image sensor, capable of sensing a parameter or a quantity regarding theenvironment, a digital processor for processing the signals from the sensors and for
performing operating system applications and network functions, a radio module
for communication and finally a battery to provide energy for operation.
Each sensor senses the environment and sends monitoring data to an
internetworking access point, then transmits the data to a web server, from which
an end-user can get required data.
Wireless sensor networks facilitate monitoring and controlling of a varietyof inhospitable physical environments from remote locations with better accuracy.
They have applications in a variety of fields such as home security, machine-
failure diagnosis, chemical or biological detection, medical and wild habitat
monitoring as well as secure military purposes.
Sensor nodes have various energy and computational constraints because of
their inexpensive nature and ad hoc method of deployment. WSN applications
require reliable, accurate, fault-proof and possibly real-time monitoring.
Meanwhile, the low energy and processing capacities of the nodes requireefficient and energy-aware operation when it is very difficult to distribute the main
supply.
However, due to the large number of nodes, a suitable multiple access
scheme is also required to coordinate the transmissions so that multiple user
interferences can be minimized.

5/6/2018 Endsem Report - slidepdf.com
http://slidepdf.com/reader/full/endsem-report 29/60
P a g e | 29
The improvement for currently available wireless sensor networks is
apparently quite important for utilizing WSN for sensing and reporting
applications especially in the living environmental monitoring and controlling.
In wireless networks, there are two different types of networks: Data
Communication Networks and Wireless Sensor Networks, which are used in
communicating with pieces of information among wireless nodes.
SENSING UNIT PROCESSING UNIT ANTENNA
Fig: Components of a Wireless Sensor Node [15]
2.3.3. MONITORING SOFTWARE
The monitoring software system is implemented using C#.net under the
Windows environment. It carries out the following tasks: data collection and
processing such as temperature, humidity, concentrations of CO and H2
illumination, of each wireless node, and transmitting the data to database server.
The system consists of sensing data source and view part, which are
distributed among a client program and a server program. The main programming
techniques employed in the system include: serial port communication in C#,
multiple threads, distributed objects, and sensing data displaying.
Receiving of real time environmental parameters of wireless nodes from a
RF transceiver is a part of the system. It is implemented in a client program. The
client program receives the wireless node sensing data from a transceiver through aserial port and transmits to database server for other terminal to access.
Microsoft DOTNET does not offer built-in class for the serial
communications, so a class called SerialPort to implement the serial port
communications using the Win32 API is developed, it can provide the low level
SENSOR ADC
PROCESSOR
STORAGE
TRANSCEIVER
POWER UNIT
5/6/2018 Endsem Report - slidepdf.com
http://slidepdf.com/reader/full/endsem-report 30/60
P a g e | 30
functions that can be used to open, close, and manipulate serial ports, transmit and
receive data, and manage connections.
The Win32 serial communication function is unmanaged code that runs
outside the CLR. P/Invoke is used to wrap the API functions, constants, and
structure definitions as static members of the managed SerialPort class.
The database server uses Oracle8i. Since the data that the wireless nodes
send don¶t arrive at a regular time interval, a monitor function is needed to listen to
the serial port continuously. The monitor function is executed in an independent
thread. Therefore, the client program is designed as a multiple threads application.
In the client GUI, users can set the parameters of connections between a
client and a server, such as server¶s IP address, port number and communication
channel type (TCP/HTTP), and set the parameters of a serial port communication,such as serial port number and baud rate. Users can also connect/disconnect
to/from a server, start data collection and stop data collection through this GUI.
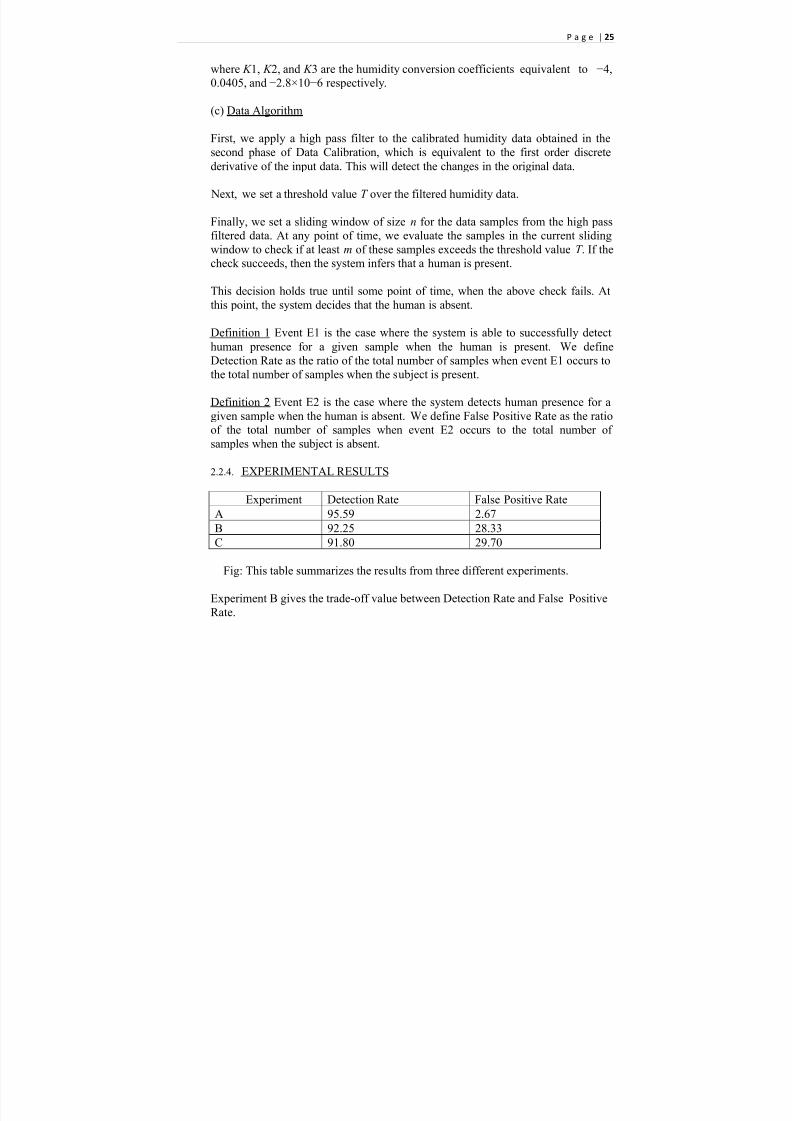
The other thread is a serial port monitor thread that is responsible for serial
port communication between a transceiver and a client program.
Fig: Monitor Interface of WSN System[15]
5/6/2018 Endsem Report - slidepdf.com
http://slidepdf.com/reader/full/endsem-report 31/60
P a g e | 31
2.3.4. SYSTEM TEST AND CONCLUSION
In a living apartment the WSN monitoring system had been experimented
for 3 weeks.
The radio transmitter and receiver pair can transfer their data in a maximal
data rate of 165 kbit/s when the distances between the wireless sensor nodes and
the access point up to 75m in building and 320m open ground.
The experiment result of data rate and RF communication distances can
meet requirements of indoor environmental monitor system.
Wireless sensor nodes could be attached on the walls of room or at
convenient place, added to the campus or home networking system.
For a warehouse or a living house environment, temperature, humidity,
illumination and concentrations of CO and H2, and other toxic gases are very
important, then the WSN indoor monitoring system can provide the physical
environmental parameters at low cost conveniently.
TheWSN realtime monitoring system has three advantages:
(1) The independence of roles between sensing nodes,
(2) The automated system by self-communication function,
(3) The user-friendly monitoring system to access the environment information
and to process the urgent situation more easily.
5/6/2018 Endsem Report - slidepdf.com
http://slidepdf.com/reader/full/endsem-report 32/60
P a g e | 32
2.4. Design guidelines for building a wireless sensor network for
environmental monitoring by Nikos Giannopoulos, Christos
Goumopoulos, Achilles Kameas, 2009 [12]
2.4.1. ABSTRACT
Environmental monitoring is a critical process that demands accuracy,
reliability and stability at the operation level.
Monitoring variables such as temperature, humidity, barometric pressure, soil
moisture and ambient light facilitates research in fields such as precision
agriculture, habitat monitoring, weather monitoring etc.
The use of wireless sensor networks (W
SNs) provides a technology solution for dynamic and unattended environmental monitoring, under the condition that
requirements such as efficient power management and system robustness are
satisfied.
This paper presents the design and implementation of a WSN for monitoring
environmental variables and evaluates its effectiveness.
2.4.2. INTRODUCTION
Recent advances in the technology of electronic circuits gave theopportunity for minimizing the size and reducing the cost of circuits¶ productions.
This rapid development led to the implementation of autonomous compact nodes
(motes) that are capable to run complicate operations consuming very little energy
using plain batteries. These nodes have approximately the size of a box of matches.
Such nodes communicate wirelessly and use sensors that are capable to
measure physical variables such as temperature, moisture, light level etc. The most
important thing is that they do not need the human presence in order to operate.
This gives the advantage of using them in remote places that may be alsohazardous for the human life as for example in volcanoes.
These nodes consist of a wireless communication unit, a microprocessor, a
data acquisition unit and a memory unit. The existence of both microprocessor and
memory unit give the ability the nodes to be programmed in order to perform

5/6/2018 Endsem Report - slidepdf.com
http://slidepdf.com/reader/full/endsem-report 33/60
P a g e | 33
specific measurements taken either at fixed time intervals or based on an event
driven model.
Also they can be programmed in such ways in order to follow specific
routing protocols. WSNs allow the coverage of wide geographical areas. The range
of the area depends on several factors such as the number of nodes, the way that
have been placed and the range of the wireless units.
Researchers have proposed placements in a structure aiming for power
efficiency and data reliability. This paper presents the design and implementation
of a WSN for monitoring environmental variables and evaluates its effectiveness
using laboratory tests.
In order to develop the monitoring applications we used on the hardware
side the Mica2 motes by Crossbow, embedded and external sensors; on the
software side we have used TinyOS, an open source operating system developed by the University of Berkeley and NesC, a component-based and event driven
programming language.
2.4.3. SYSTEM DESCRIPTION
a) Hardware Tools
o implement our WSN, we used the following hardware:
� Three MPR2400 MICAz modules.� The MIB520CA base station module.
� One MDA100CA data acquisition board.
It provides a precision thermistor, a light sensor/photocell and general
prototyping area.
� One MDA300 data acquisition board which includes an onboard
temperature and humidity sensor.
Finally, we used the moisture probe Echo-10 by Decagon, which was
plugged on MDA300 acquisition board.
b) Software Tools
For the needs of our project we used a variety of programming
environments. For the implementation of the applications which run on the
motes we used the nesC programming language and the MoteWorks
environment.

5/6/2018 Endsem Report - slidepdf.com
http://slidepdf.com/reader/full/endsem-report 34/60
P a g e | 34
We used Java to implement the application for the communication
between the MIB520CA and the database.
For the web based application we used the Microsoft Visual Studio .Net
2003 and the .aspx technology.
For the graphs we used the Dundas Chart for asp .net 2003. Finally, we
used the Microsoft SQL Server 2000 to develop the database in which the data
will be logged.
2.4.4. DESIGN AND IMPLEMENTATION
The nature of the hardware of WSNs imposes many constraints that must be
considered when establishing the design goals and trade-offs of the applications.
These constraints are mainly attributed to the limited resources of the motes:
processing power, memory, communication bandwidth/range and power supply.
Therefore, developers need to take into account energy requirements during the
design phase.
Regarding the engineering approach we followed, given that no prior
experience existed, we had to be ready to confront several new challenges and to
overcome many difficulties.
For that reason a risk management analysis had to be done before starting
the implementation. During that phase, we identified the potential risks that would
jeopardize the project.
The risks were classified into the following categories: sensitive equipment
usage, integration of heterogeneous systems and technologies, open source,
insufficient tool documentation, limited number of nodes, measurement accuracy
and network reliability.
After creating the list of the risks, a risk analysis was performed evaluating
the issues depending on the severity and the impact of each of them on the project.
A major issue that we had to confront related to the combination of TinyOS with
Crossbow software.

5/6/2018 Endsem Report - slidepdf.com
http://slidepdf.com/reader/full/endsem-report 35/60
P a g e | 35
Although the use of open source software has many advantages like no cost
and customizability, it may also come with a few holes. The most important in our
case were related with the inadequate documentation and the existence of not well
tested code. As a consequence of the constraints discussed above we have followed
an incremental development model with risk analysis and assessment which can be
seen as a light spiral model.
The basic functional requirements of the project were specified in the
previous section. Furthermore, two critical non functional requirements specified
are data reliability and power efficiency.
2.4.5. DISCUSSION
The testing of our system took place in the lab. We have tested that the
embedded and the external sensors can make accurate measurements, the motescan store measured values, the transmission of values and associated ID data
trough the wireless link and the transmission of data from the BS to the database.
For the measurements of the soil moisture we used a plant. The WSN was
able to operate without interruption for 15 days with a sampling rate of 3 seconds.
From the lab tests, there is sufficient evidence that the system performs the
basic functionality specified. The experiments serve as a feasibility study of our
prototype and the design goals made. Using the TOSSIM simulator we tested our network in order to ensure that is functional for more than two nodes.
2.4.6. CONCLUSION
We presented the design and implementation of a WSN for monitoring
environmental variables and evaluated its effectiveness. Based on the acquired
experience we described how we have confronted certain problems and we
provided certain design guidelines for building such a system.
Future work will focus on addressing the limitations of the current prototypeand building a larger network with additional sensors such as a photosynthetic
solar radiation meter.
We plan also to deploy the network to an open field for agricultural
monitoring.
5/6/2018 Endsem Report - slidepdf.com
http://slidepdf.com/reader/full/endsem-report 36/60
P a g e | 36
2.5. A practical deployment of Intelligent Building Wireless Sensor
Network for environmental monitoring and air-conditioning
control by Tao Zheng, Yajuan Qin, Deyun Gao, Junqi Duan,
Hongke Zhang, 2010 [13]
2.5.1. ABSTRACT
Wireless Sensor Networks (WSNs) is the core support technology in the
framework of the internet of things. Environmental monitoring and devices control
of intelligent building based on WSN is considered as one of the most crucial
applications.
It can perceive several environmental parameters and feedback controlinformation to devices to provide more comfortable environment for people.
However, it is difficult to ensure performance of WSNs deployed in the
buildings, because there usually are several serious disturbances from coexistence
wireless systems and human actions.
In this paper, an intelligent WSN is deployed that satisfies the need of the
proposed applications for environmental monitoring and air-conditioning control.
2.5.2. INTRODUCTION
The Internet of Things (IoTs) is a technological revolution that integrates
technologies such as wireless sensor network, radio frequency identification and
networked embedded devices with existing Internet aiming to exchange
information and communicate between objects through different information
sensing devises.
As the core support technology in the framework of IoTs, wireless sensor network (WSN) is receiving sustained attentions in the application scenarios.
Particularly, the environmental monitoring and device control in the buildings is a
crucial application to ensure a comfortable environment.
WSN can provide real-time and remote interaction to multiply devices and
are very suitable for such tasks. Even though there are many advantages of WSN,

5/6/2018 Endsem Report - slidepdf.com
http://slidepdf.com/reader/full/endsem-report 37/60
P a g e | 37
it is not easy to deploy WSN in the buildings because the radio environment
suffers from serious frequency conflicts and human action disturbances within the
intelligent buildings.
For example, there are other coexistent wireless networks operating in the
same 2.4GHz industrial, scientific and medical (ISM) band with WSN.
References show that interferences do exist between the coexistent wireless
networks in the 2.4GHz-ISM band and the presence of interferences in the same
frequency band may even lead to disruptive effects in the transmission of data
packets.
In this paper, we analyze actual spectrum characteristics, Link Quality
Indicator (LQI), Received Signal Strength Indicator (RSSI) and Package Loss Rate
(PLR) of sensor nodes deployed in our laboratory building.
And we focus on the practical application of intelligent building wireless
sensor network defined as IBWSN for temperature, humidity monitoring and air-
conditioning control.
Performance evaluation demonstrates that the proposed IBWSN satisfies the
needs of such applications.
2.5.3. P
LATFORM SETUP
We conduct our platform in the National Engineering Laboratory Building
located at Beijing Jiaotong University.
We install some nodes with temperature and humidity sensors along the
corridor of size 50m 1.87m 2.6m for monitoring real-time building environmental
information.
For data visualization we put a gateway and data server in the testing room
nearby the corridor.
The environmental parameters of the building are transmitted via the data
communication networks and monitored from data server or mobile phones.

5/6/2018 Endsem Report - slidepdf.com
http://slidepdf.com/reader/full/endsem-report 38/60
P a g e | 38
Fig: WSN devices[13]
2.5.4. USER INTERFACE
The user interface consists of two parts: theWSN server and the mobile
phone client. The server manages the network events, while the mobile client
monitors the network status and feeds back control command remotely.
Fig: Network User Interface of the system [13]
5/6/2018 Endsem Report - slidepdf.com
http://slidepdf.com/reader/full/endsem-report 39/60
P a g e | 39
2.5.5. PERFORMANCE EVALUATION
In order to evaluate the performance of our platform, several measurements
have been made. Our testing mainly focuses on monitoring temperature and
humidity of the seventh floor corridor.
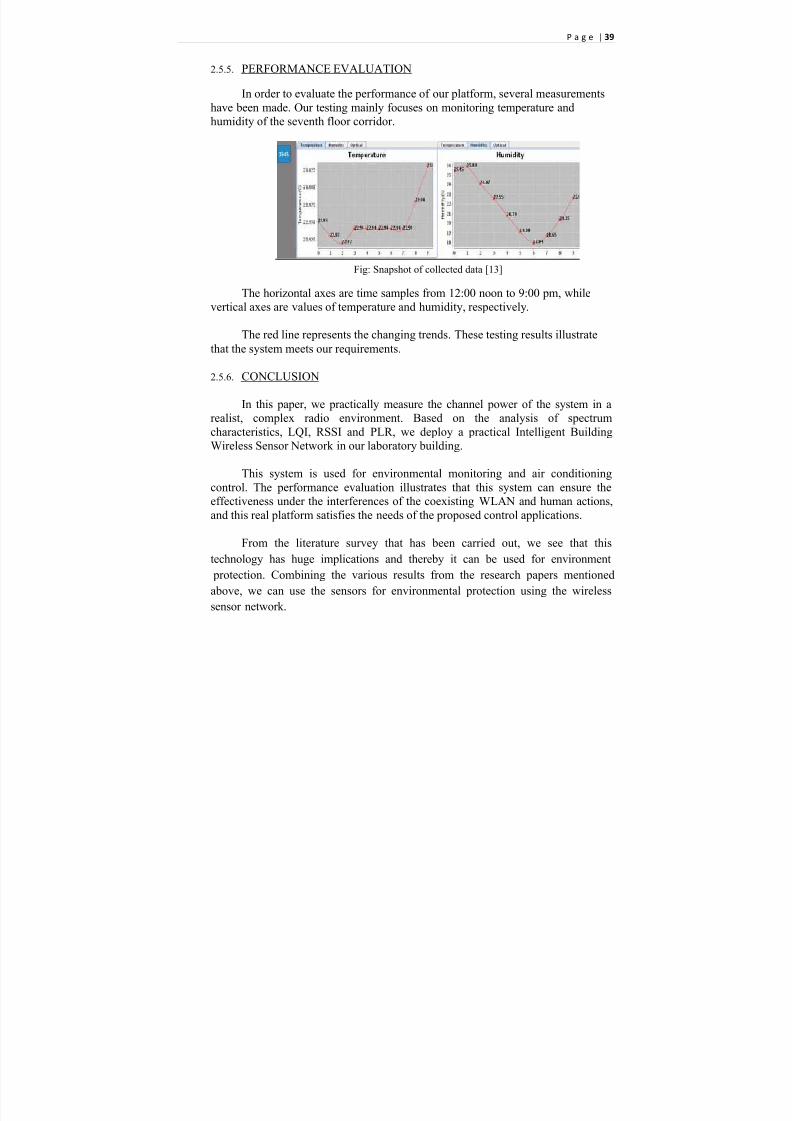
Fig: Snapshot of collected data [13]
The horizontal axes are time samples from 12:00 noon to 9:00 pm, while
vertical axes are values of temperature and humidity, respectively.
The red line represents the changing trends. These testing results illustrate
that the system meets our requirements.
2.5.6. CONCLUSION
In this paper, we practically measure the channel power of the system in a
realist, complex radio environment. Based on the analysis of spectrum
characteristics, LQI, RSSI and PLR, we deploy a practical Intelligent Building
Wireless Sensor Network in our laboratory building.
This system is used for environmental monitoring and air conditioning
control. The performance evaluation illustrates that this system can ensure the
effectiveness under the interferences of the coexisting WLAN and human actions,
and this real platform satisfies the needs of the proposed control applications.
From the literature survey that has been carried out, we see that this
technology has huge implications and thereby it can be used for environment
protection. Combining the various results from the research papers mentioned
above, we can use the sensors for environmental protection using the wireless
sensor network.

5/6/2018 Endsem Report - slidepdf.com
http://slidepdf.com/reader/full/endsem-report 40/60
P a g e | 40
3. PLAN OF WORK
3.1. METHODOLOGY
Various applications are used to take the temperature and humidity readingsfrom the mote. The applications used are:
3.1.1. SENSE APPLICATION
Sense application is used to sense the temperature and humidity. It
periodically samples the default sensor and displays the bottom bits of the readings
on the LEDs.
The SenseAppC.nc file contains the following code:
configuration SenseAppC
{
}
implementation {
components SenseC, MainC, LedsC, new TimerMilliC(), new DemoSensorC() as Sensor;
SenseC.Boot -> MainC;
SenseC.Leds -> LedsC;
SenseC.Timer -> TimerMilliC;
SenseC.Read -> Sensor;
}
3.1.2. OSCILLOSCOPE APPLICATION
Oscilloscope is an application that let's you visualize sensor readings on the
PC. Every node that has Oscilloscope installed periodically samples the default

5/6/2018 Endsem Report - slidepdf.com
http://slidepdf.com/reader/full/endsem-report 41/60
P a g e | 41
sensor via (SensirionSht11C) and broadcasts a message with 10 accumulated
readings over the radio.
We implemented a Oscilloscope application that let us visualize sensor
readings on the PC. A node that has Oscilloscope installed periodically samplesthe sensor via (SensirionSht11C) component in OscilloscopeAppC.nc and
broadcasts a message with 10 accumulated readings over the radio.
A node running the BaseStation application will forward these messages to
the PC using the serial communication.
To run Oscilloscope therefore we need at least two nodes: one node attached
to your PC running the BaseStation application and one or more nodes runningthe Oscilloscope application.
The OscilloscopeAppc.nc file contains the following code:
configuration OscilloscopeAppC { }
implementation
{
components OscilloscopeC, MainC, ActiveMessageC, LedsC,
new TimerMilliC(), new SensirionSht11C() as Sensor,
new AMSenderC(AM_OSCILLOSCOPE), new AMReceiverC(AM_OSCILLOSCOPE);
OscilloscopeC.Boot -> MainC;
OscilloscopeC.RadioControl -> ActiveMessageC;
OscilloscopeC.AMSend -> AMSenderC;
OscilloscopeC.Receive -> AMReceiverC;
OscilloscopeC.Timer -> TimerMilliC;
OscilloscopeC.Read -> Sensor;
OscilloscopeC.Leds -> LedsC;
}
5/6/2018 Endsem Report - slidepdf.com
http://slidepdf.com/reader/full/endsem-report 42/60
P a g e | 42
The Oscilloscope.nc file contains the following code:
module OscilloscopeC
{
uses {
interface Boot;
interface SplitControl as RadioControl;
interface AMSend;
interface Receive;
interface Timer<TMilli>;
interface Read<uint16_t>;
interface Leds;
}
}
When it has gathered 10 sensor readings OscilloscopeC puts them into a
message and broadcasts that message via the AMS end interface.
OscilloscopeC uses the Receive interface for synchronization purposes and
the SplitControl interface, to switch the radio on.
A node running Oscilloscope will toggle its second LED for every message
it has sent and it will toggle its third LED when it has received
an Oscilloscope message from another node: incoming messages are used for
sequence number synchronization to let nodes catch up when they are switched on
later than the others; they are also used for changing the sample rate that defines
how often sensor values are read. In case of a problem with the radio connectionthe first LED will toggle.
Similarly we will install BaseStation on another node and connect it to our
PC. As usual, on the BaseStation node we will should see the second LED toggle
for every message bridged from radio to serial.

5/6/2018 Endsem Report - slidepdf.com
http://slidepdf.com/reader/full/endsem-report 43/60
P a g e | 43
3.1.3. BASESTATION APPLICATION
BaseStation is a basic TinyOS utility application. It acts as a bridge between
the serial port and radio network.
When it receives a packet from the serial port, it transmits it on the radio;
when it receives a packets over the radio, it transmits it to the serial port.
The BaseStationC.nc file contains the following code:
configuration BaseStationC {
}
implementation {
components MainC, BaseStationP, LedsC;
components ActiveMessageC as Radio, SerialActiveMessageC as Serial;
MainC.Boot <- BaseStationP;
BaseStationP.RadioControl -> Radio;
BaseStationP.SerialControl -> Serial;
BaseStationP.UartSend -> Serial;
BaseStationP.UartReceive -> Serial;
BaseStationP.UartPacket -> Serial;
BaseStationP.UartAMPacket -> Serial;
BaseStationP.RadioSend -> Radio;
BaseStationP.RadioReceive -> Radio.Receive;

5/6/2018 Endsem Report - slidepdf.com
http://slidepdf.com/reader/full/endsem-report 44/60
P a g e | 44
BaseStationP.RadioSnoop -> Radio.Snoop;
BaseStationP.RadioPacket -> Radio;
BaseStationP.RadioAMPacket -> Radio;
BaseStationP.Leds -> LedsC;
}
The Oscilloscope code is compiled on the motes for taking the readings from
the environment. Once the Oscilloscope is installed on the motes, the Base Stationcode is run on the third mote.
The motes on which Oscilloscope is installed sense temperature andhumidity values through their sensors and send the data to the Base Station mote.
The Base Station mote gathers data from the various deployed motes anddisplays their readings on the Oscilloscope.
3.1.4. SENSIRIONSHT11 APPLICATION
The SensirionSht11.nc file consists of the following code for measuring
temperature and humidity:interface SensirionSht11 {
/**
* Resets the sensor.*
* @return SUCCESS if the sensor will be reset*/
command error_t reset();
/*** Signals that the sensor has been reset.
** @param result SUCCESS if the reset succeeded
*/event void resetDone( error_t result );
/**
* Starts a temperature measurement.
5/6/2018 Endsem Report - slidepdf.com
http://slidepdf.com/reader/full/endsem-report 45/60
P a g e | 45
*
* @return SUCCESS if the measurement will be made*/
command error_t measureTemperature();
/*** Presents the result of a temperature measurement.
** @param result SUCCESS if the measurement was successful
* @param val the temperature reading*/
event void measureTemperatureDone( error_t result, uint16_t val );
/*** Starts a humidity measurement.
*
* @return SUCCESS if the measurement will be made*/command error_t measureHumidity();
/**
* Presents the result of a humidity measurement.*
* @param result SUCCESS if the measurement was successful* @param val the humidity reading
*/event void measureHumidityDone( error_t result, uint16_t val );
/**
* Reads the current contents of the SHT11 status and control* register. See the datasheet for interpretation of this register.
** @return SUCCESS if the read will be performed
*/command error_t readStatusReg();
/**
* Presents the value of the status register.
** @param result SUCCESS if the read succeeded* @param val the value of the register
*/event void readStatusRegDone( error_t result, uint8_t val );
/**
* Writes a new value to the SHT11 status and control register.
5/6/2018 Endsem Report - slidepdf.com
http://slidepdf.com/reader/full/endsem-report 46/60
P a g e | 46
*
* @param val the new value to be written*
* @return SUCCESS if the write will be performed*/
command error_t writeStatusReg( uint8_t val );
/*** Signals the completion of the status register write.
** @param result SUCCESS if the write was successful
*/event void writeStatusRegDone( error_t result );
}
This code enables the sensor SHT11 present on the mote to sense the values of
temperature and humidity.
5/6/2018 Endsem Report - slidepdf.com
http://slidepdf.com/reader/full/endsem-report 47/60
P a g e | 47
4. RESULT AND FINDINGS
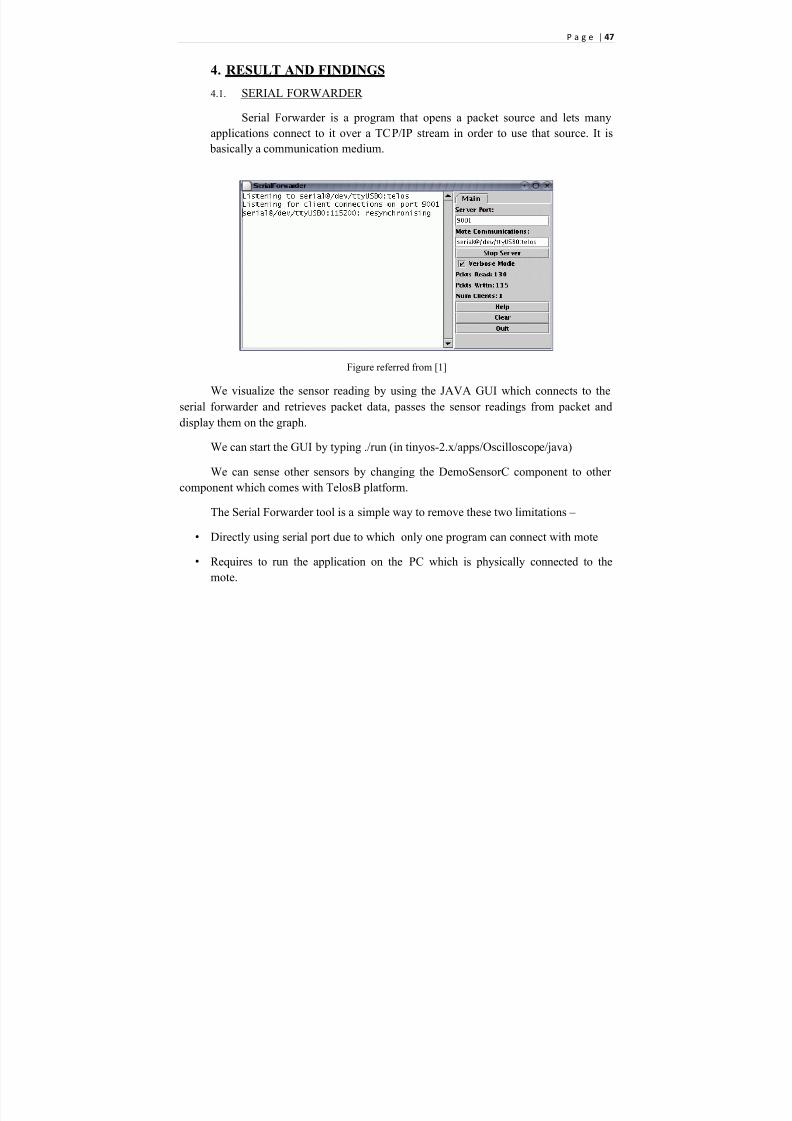
4.1. SERIAL FOR WARDER
Serial Forwarder is a program that opens a packet source and lets many
applications connect to it over a TCP/IP stream in order to use that source. It is basically a communication medium.
Figure referred from [1]
We visualize the sensor reading by using the JAVA GUI which connects to theserial forwarder and retrieves packet data, passes the sensor readings from packet and
display them on the graph.
We can start the GUI by typing ./run (in tinyos-2.x/apps/Oscilloscope/java)
We can sense other sensors by changing the DemoSensorC component to other
component which comes with TelosB platform.
The Serial Forwarder tool is a simple way to remove these two limitations ±
� Directly using serial port due to which only one program can connect with mote
� Requires to run the application on the PC which is physically connected to the
mote.

5/6/2018 Endsem Report - slidepdf.com
http://slidepdf.com/reader/full/endsem-report 48/60
P a g e | 48
4.2. COMMANDS USED
The commands that are used for sensing data are as follows:
$ make telosb
Compiles Application and prepares Mote
$ motelist
Displays a list of motes connected
$ make telosb reinstall bsl,Devicepath
This command is used for installing BaseStation and Oscilloscope applications
on mote.
$ Java net.tinyos.sf.SerialForwarder ±comm serial@Devicepath:telosb
Runs the serial forwarder
$ make
Runs the make command
$ ./run
Runs the Oscilloscope Java application.
4.3. CALIBRATION
4.3.1. Calibration of temperature
import java.util.*;
/* Hold all data received from motes */
class Data {/* The mote data is stored in a flat array indexed by a mote's identifier.
A null value indicates no mote with that identifier. */ private Node[] nodes = new Node[256];
private Oscilloscope parent;
Data(Oscilloscope parent) {this.parent = parent;

5/6/2018 Endsem Report - slidepdf.com
http://slidepdf.com/reader/full/endsem-report 49/60
P a g e | 49
}
/* Data received from mote nodeId containing NREADINGS samples from
messageId * NREADINGS onwards. Tell parent if this is a new node. */void update(int nodeId, int messageId, int readings[]) {
if (nodeId >= nodes.length) {
int newLength = nodes.length * 2;if (nodeId >= newLength) {
newLength = nodeId + 1;}
Node newNodes[] = new Node[newLength];
System.arraycopy(nodes, 0, newNodes, 0, nodes.length);nodes = newNodes;
}
Node node = nodes[nodeId];if (node == null) {
nodes[nodeId] = node = new Node(nodeId);
parent.newNode(nodeId);}
node.update(messageId, readings);}
/* Return value of sample x for mote nodeId, or -1 for missing data */
int getData(int nodeId, int x) {if (nodeId >= nodes.length || nodes[nodeId] == null)
return -1;return (int) (nodes[nodeId].getData(x)*0.01-39.6);
}
/* Return number of last known sample on mote nodeId. Returns 0 for unknown motes. */
int maxX(int nodeId) {if (nodeId >= nodes.length || nodes[nodeId] == null)
return 0;return nodes[nodeId].maxX();
}
/* Return number of largest known sample on all motes (0 if there are no motes) */int maxX() {
int max = 0;
for (int i = 0; i < nodes.length; i++) {if (nodes[i] != null) {
int nmax = nodes[i].maxX();
5/6/2018 Endsem Report - slidepdf.com
http://slidepdf.com/reader/full/endsem-report 50/60
P a g e | 50
if (nmax > max)max = nmax;
}}
return max;
}}
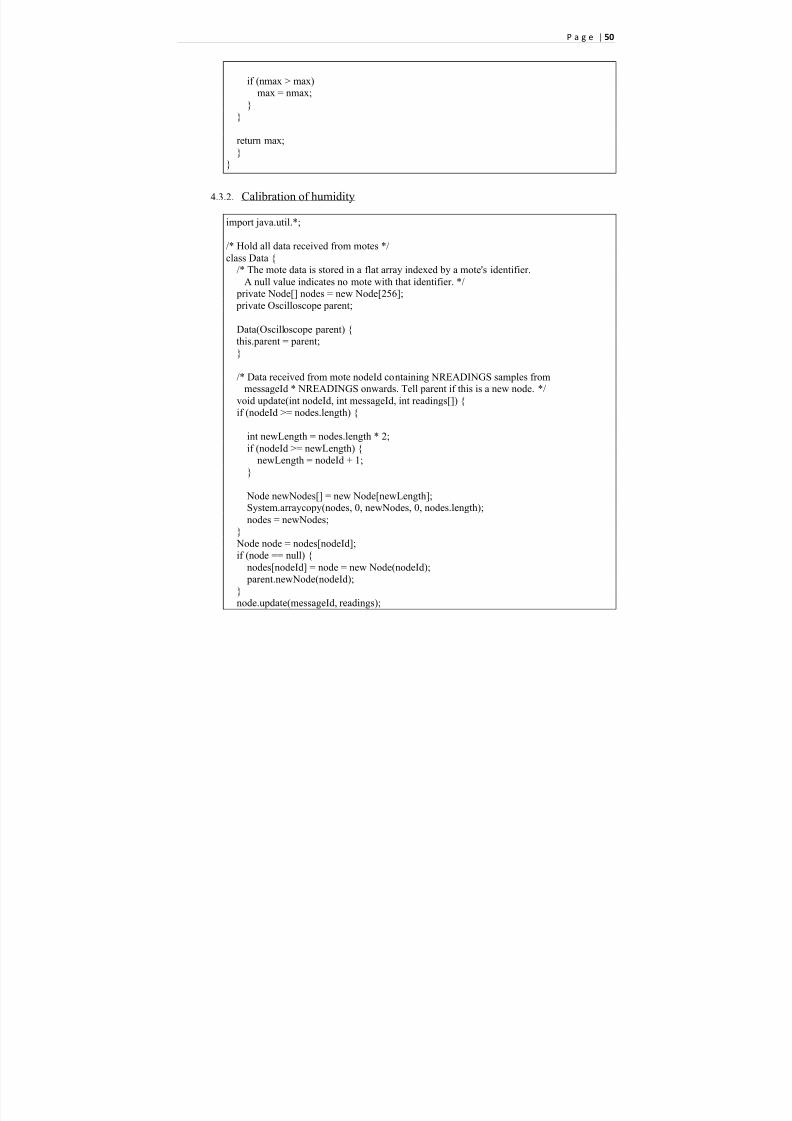
4.3.2. Calibration of humidity
import java.util.*;
/* Hold all data received from motes */
class Data {/* The mote data is stored in a flat array indexed by a mote's identifier.
A null value indicates no mote with that identifier. */ private Node[] nodes = new Node[256];
private Oscilloscope parent;
Data(Oscilloscope parent) {this.parent = parent;
}
/* Data received from mote nodeId containing NREADINGS samples from
messageId * NREADINGS onwards. Tell parent if this is a new node. */void update(int nodeId, int messageId, int readings[]) {if (nodeId >= nodes.length) {
int newLength = nodes.length * 2;
if (nodeId >= newLength) {newLength = nodeId + 1;
}
Node newNodes[] = new Node[newLength];System.arraycopy(nodes, 0, newNodes, 0, nodes.length);
nodes = newNodes;}
Node node = nodes[nodeId];if (node == null) {
nodes[nodeId] = node = new Node(nodeId); parent.newNode(nodeId);
}node.update(messageId, readings);

5/6/2018 Endsem Report - slidepdf.com
http://slidepdf.com/reader/full/endsem-report 51/60
P a g e | 51
}
/* Return value of sample x for mote nodeId, or -1 for missing data */
int getData(int nodeId, int x) {if (nodeId >= nodes.length || nodes[nodeId] == null)
return -1;return (int) (nodes[nodeId].getData(x)*0.00367-2.0468);
}
/* Return number of last known sample on mote nodeId. Returns 0 for unknown motes. */
int maxX(int nodeId) {if (nodeId >= nodes.length || nodes[nodeId] == null)
return 0;return nodes[nodeId].maxX();
}
/* Return number of largest known sample on all motes (0 if there are nomotes) */
int maxX() {int max = 0;
for (int i = 0; i < nodes.length; i++) {
if (nodes[i] != null) {int nmax = nodes[i].maxX();
if (nmax > max)
max = nmax;}
}
return max;}
}
4.4. GRAPHS
The following graphs are obtained by data sensed from motes running theOscilloscope application, which are sent to the BaseStation.
The BaseStation receives data and this data is calibrated to measure either
temperature in degrees Celsius or humidity in %RH.

5/6/2018 Endsem Report - slidepdf.com
http://slidepdf.com/reader/full/endsem-report 52/60
P a g e | 52
4.4.1. Graphs depicting change in temperature with two connected motes
The value of temperature changes suddenly when brought close to a heat source.

5/6/2018 Endsem Report - slidepdf.com
http://slidepdf.com/reader/full/endsem-report 53/60
P a g e | 53
4.4.2. Graphs depicting change in temperature with one connected mote

5/6/2018 Endsem Report - slidepdf.com
http://slidepdf.com/reader/full/endsem-report 54/60
P a g e | 54
4.4.3. Graphs depicting constant temperature
The graphs show constant temperature reading for a period of time.

5/6/2018 Endsem Report - slidepdf.com
http://slidepdf.com/reader/full/endsem-report 55/60
P a g e | 55
4.4.4. Graph depicting loss of data (temperature)
4.4.5. Graph depicting humidity values
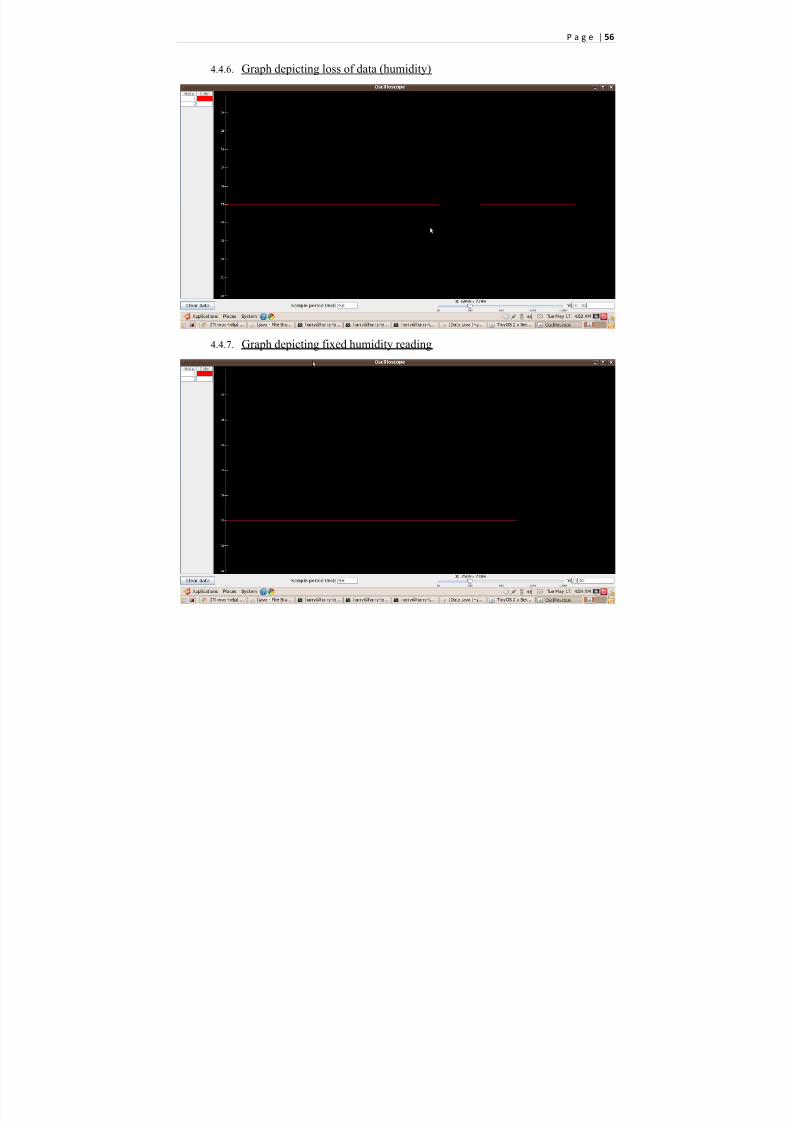
5/6/2018 Endsem Report - slidepdf.com
http://slidepdf.com/reader/full/endsem-report 56/60
P a g e | 56
4.4.6. Graph depicting loss of data (humidity)
4.4.7. Graph depicting fixed humidity reading

5/6/2018 Endsem Report - slidepdf.com
http://slidepdf.com/reader/full/endsem-report 57/60
P a g e | 57
4.4.8. Graph depicting change in humidity reading
The above graphs show results of data taken from the sensors which run theOscilloscope application and the Base Station application.
The Java Graphical User Interface displays graphs where the y-axis shows
the value of the parameter sensed (temperature/humidity) and the x-axis shows thetime.
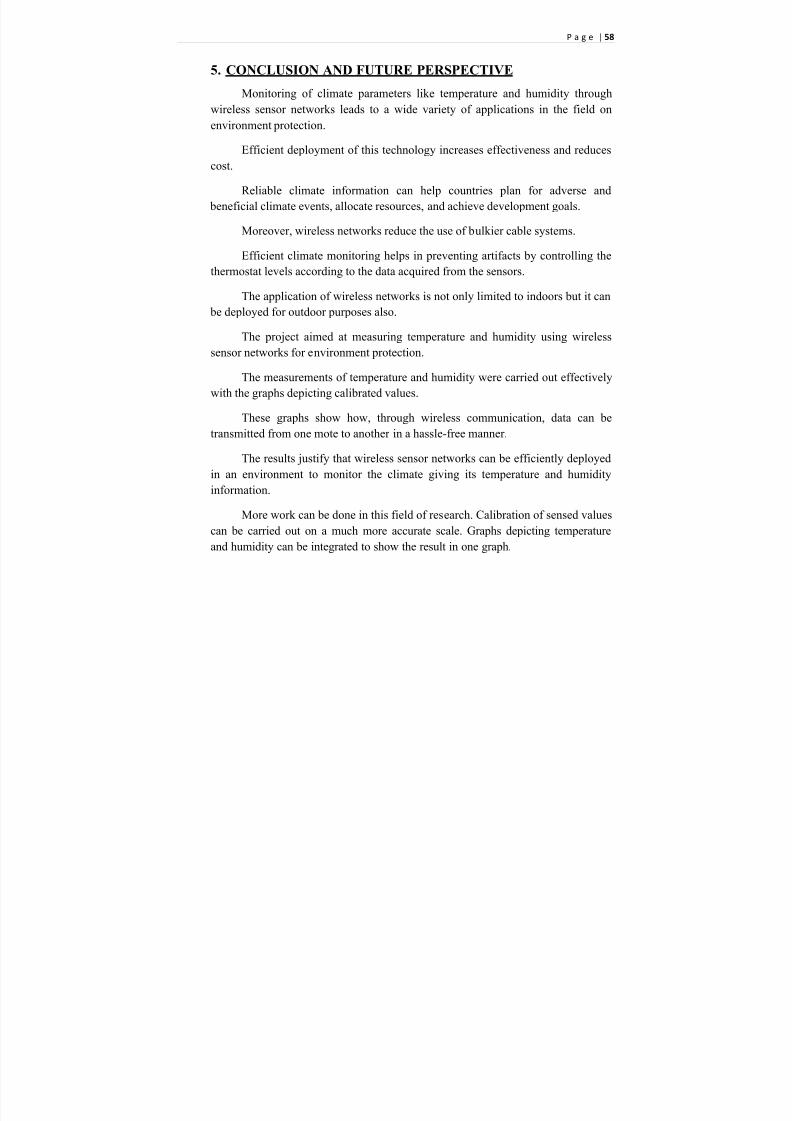
5/6/2018 Endsem Report - slidepdf.com
http://slidepdf.com/reader/full/endsem-report 58/60
P a g e | 58
5. CONCLUSION AND FUTURE PERSPECTIVE
Monitoring of climate parameters like temperature and humidity through
wireless sensor networks leads to a wide variety of applications in the field on
environment protection.
Efficient deployment of this technology increases effectiveness and reduces
cost.
Reliable climate information can help countries plan for adverse and
beneficial climate events, allocate resources, and achieve development goals.
Moreover, wireless networks reduce the use of bulkier cable systems.
Efficient climate monitoring helps in preventing artifacts by controlling the
thermostat levels according to the data acquired from the sensors.
The application of wireless networks is not only limited to indoors but it can
be deployed for outdoor purposes also.
The project aimed at measuring temperature and humidity using wireless
sensor networks for environment protection.
The measurements of temperature and humidity were carried out effectively
with the graphs depicting calibrated values.
These graphs show how, through wireless communication, data can be
transmitted from one mote to another in a hassle-free manner.
The results justify that wireless sensor networks can be efficiently deployed
in an environment to monitor the climate giving its temperature and humidity
information.
More work can be done in this field of research. Calibration of sensed values
can be carried out on a much more accurate scale. Graphs depicting temperature
and humidity can be integrated to show the result in one graph.

5/6/2018 Endsem Report - slidepdf.com
http://slidepdf.com/reader/full/endsem-report 59/60
P a g e | 59
6. BIBILOGRAPHY
Following is the list of the references and citations made during this project.
1. http://portal.iri.columbia.edu/portal/server.pt?open=512&objID=768
&mode=2&cached=true 2. www.willow.co.uk/TelosB_Datasheet.pdf
3. http://docs.tinyos.net/index.php/TinyOS_Tutorials
4. http://docs.tinyos.net/index.php/Getting_started_using_Ubuntu_9.10_
and_TelosB_motes
5. http://en.wikipedia.org/wiki/Wireless_sensor_networks
6. http://blog.memsic.com/telosb/
7. http://www.tempsensor.net/
8. http://www.nutronicsindia.com/humidity-instruments/humidity-sensors.html
9. http://delivery.acm.org/10.1145/1840000/1838010/a7-
murad.pdf?key1=1838010&key2=9204248921&coll=DL&dl=ACM&
ip=210.212.48.3&CFID=9801281&CFTOKEN=87214889
10. http://eldridgeappraisals.com/appraisal-information/effects-of-
humidity-and-temperature/
11. http://sparrow.ece.cmu.edu/group/pub/han_jain_luk_perrig_privacy.p
df
12. http://www.computer.org/portal/web/csdl/doi/10.1109/PCI.2009.17
13. http://ieeexplore.ieee.org/xpls/abs_all.jsp?arnumber=5657858&tag=1
14. http://ieeexplore.ieee.org/search/srchabstract.jsp?tp=&arnumber=1625
668&queryText%3Dwireless+sensor+network+for+environment%26
openedRefinements%3D*%26searchField%3DSearch+All
15. http://ieeexplore.ieee.org/search/srchabstract.jsp?tp=&arnumber=5319
379&queryText%3Dtelosb+mote+for+temperature+and+humidity+se
nsing%26openedRefinements%3D*%26searchField%3DSearch+All
16. TelosB manual
17. ´Sensor Node´ ,August 2009 [Online] .Available
http://en.wikipedia.org/wiki/File:Sensornode.svg

5/6/2018 Endsem Report - slidepdf.com
http://slidepdf.com/reader/full/endsem-report 60/60
P a g e | 60
7. COMMENTS AND SUGGESTION S OF THE EXAMINING BOARD