energy and carbon management with osisoft and sap … · for a consolidated visualization, sap mii,...
TRANSCRIPT
ENERGY AND CARBON MANAGEMENT WITH
OSIsoft AND SAP® SOLUTIONS
Version: 1.0
Date: October 2010
Editors: Carol Jackson (OSIsoft), Kevin Liu (SAP Co-Innovation Lab)
Project Team:
OSIsoft: Ken Morikawa, Michelle Kuiee, Danilo Ribeiro, Francois J. Gagnon, Carol Jackson
SAP: Peter Huyen, Raj Valame, Michael Appleby, David Branley, Stephan Boecker, Jeffery West, Kevin Liu
Thanks for the support of the SAP facility team led by Larry Morgan and the SAP Co-Innovation Lab team at Palo Alto,
especially David Cruickshank, Peter Aeschlimann, Siva Gopal Modadugula, and Irakli Natsvlishvili

Energy and Carbon Management with OSIsoft and SAP Solutions 2
Content Executive Summary ................................................................................................................................................... 3
1 Sustainable Practices from Green-Minded Companies ............................................................................. 3
2 A Proof of Concept at SAP Co-Innovation Lab ........................................................................................... 5
3 The Joint Solution Architecture ................................................................................................................... 6
4 Building the Platform at SAP Co-Innovation Lab ....................................................................................... 7 4.1 The Data Sources .............................................................................................................................................7 4.2 Prerequisites – Meters ......................................................................................................................................8 4.3 OSIsoft Products ...............................................................................................................................................8 4.4 SAP Products ....................................................................................................................................................9
5 Presenting the Results in a Dashboard ....................................................................................................... 9
6 Scale Beyond SAP Co-innovation Lab ...................................................................................................... 14 6.1 Application to Facilities .................................................................................................................................. 14 6.2 Application to Industry .................................................................................................................................... 16
7 Key Learning ................................................................................................................................................ 17
8 References .................................................................................................................................................... 18

Energy and Carbon Management with OSIsoft and SAP Solutions 3
Executive Summary
The statement “you can’t control what you can’t see” is very appropriate when it comes to sustainability initiatives. Without access to timely information, consumers of energy cannot adequately react to changes and disruptions in their daily work. To gain visibility of energy consumption and identify areas where more efficiency can be achieved, customers can benefit from solutions from OSIsoft and SAP. To demonstrate how an integrated solution might succeed in helping customers become more energy efficient and reduce their carbon footprint, SAP and OSIsoft have worked together at SAP® Co-innovation Lab to design a joint architecture that showcases a best practice of collecting, analyzing, and presenting energy data using components from both companies. At the heart of this architecture is OSI PI system, the SAP Manufacturing Integration and Intelligence (SAP MII) application, SAP BusinessObjects™ Dashboards software, SAP Carbon Impact OnDemand solution, and SAP NetWeaver® Portal component. OSIsoft’s PI system is the historical platform for collecting real-time data from many different data sources with built-in analytical features. With appropriate aggregation, PI system can pass up the data to various SAP components for consolidated presentation in SAP NetWeaver Portal, or for further processing in components such as SAP MII, SAP BusinessObjects Dashboards, and SAP Carbon Impact OnDemand. The team didn’t stop at the architectural level. We actually developed and deployed a platform based on the joint architecture in SAP Co-Innovation Lab that allows the lab to collect its real-time energy consumption information, analyze the data, generate a set of reports, and present a dashboard of the key results to help business decision making. Validated at the lab, the OSIsoft and SAP solutions can work together and potentially scale to assist all kinds of manufacturing companies in their sustainability efforts.
1 Sustainable Practices from Green-Minded Companies
OSIsoft and SAP are companies committed to environmental concerns. Both place high priorities on waste reduction, energy conservation, and giving time and money to community efforts. SAP walks the talk. Over the past 10 years, SAP has been recognized by the Dow Jones Sustainability Index for upholding ethical, environmental, social, and governance values in products and services. For the last three years, the index has named SAP as the leader in the software sector. SAP is a member of Econsense, the forum for sustainable development of German business. SAP is a member of CSR Europe, the leading European business network for promoting corporate social responsibility. AccountAbility is a think tank that promotes accountability in sustainable development efforts, including it principles-based standards that provide the basis for improving the sustainability performance of organizations. SAP works with AccountAbility to define materiality and stakeholder engagement. In the Americas, SAP employees participate in programs that support a wide range of causes. For example, employees in North America participate in “Month of Service,” which includes projects that range from school renovations to tutoring programs and celebrates employee commitment to year-round civic action.

Energy and Carbon Management with OSIsoft and SAP Solutions 4
As a software company, SAP makes a relatively low impact on the environment from its own operations. But the expectations of our clients and their stakeholder are quite clear: climate change is a cross-industry issue and all industries must respond to the challenge.
As part of our belief that SAP solutions can help companies better manage their ecological impact, SAP shows commitment through participation in the following initiatives.
• SAP is one of 49 signatory companies of the 3C Initiative, a global opinion group whose principles
and road map aim for a low-emitting society.
• SAP voluntarily reports its known carbon footprint to the Carbon Disclosure Project.
• SAP is a signatory of the UN Global Compact's statement “Caring for Climate,” pledging action
alongside other major corporations to reduce environmental impact and stimulate the development of
effective public policy, innovation, and market-based incentives.
Even as a small company, OSIsoft has made great strides towards building a sustainable community. OSIsoft is a member of the San Leandro Sustainability Circle based in San Leandro, California, run by the Natural Capital Group. The Natural Capital Group includes partner companies such as Ghirardelli Chocolate, Tortilla Factory, Spring Factory, the San Leandro waste management corporation, ALCO recycling, and a local sustainable developer. The group is forming a neighborhood consortium to set sustainable guidelines around water use, power use, transportation, and travel policies. At company headquarters in San Leandro, OSIsoft is in the process of improving building lighting, promoting the benefits of using public transportation and living near the office, and changing IT policies to reflect our power management initiative. OSIsoft and the City of San Leandro have joined the East Bay Green Corridor. Mayors from surrounding communities and the chancellor of Berkeley have formed a cooperative effort to make the East Bay a center of environmental innovation, emerging green business industry, green jobs, and renewable energy. In an office of 250 OSIsoft employees, 20% use Bay Area Rapid Transit (BART), 10% live within walking distance, and up to 5% bike to work. OSIsoft uses its own software, similar to the efforts at SAP Co-Innovation Lab, to monitor building energy usage and display commitment to its own product, PI system. OSIsoft sponsors a biking program in San Leandro and has recently launched an annual “Bike Day” (May 13). Each year OSIsoft hosts a “Green Fair” and invites all city businesses and residents to attend. The company is a major sponsor of Shai Agassi’s “Better Place,” and has introduced key individuals to local mayors and energy market players in and around the Bay area. In addition, both companies have software platforms that help customers with their sustainability initiatives. By enabling the use of software on virtual machines, consolidation of multiple software applications on a single computer, cloud computing, and more, OSIsoft and SAP have been market leaders in green IT. Both companies have built service practices to promote remote installations of their software, thereby saving energy consumption associated with travel to remote areas of the world. OSIsoft started with its first remote installations almost 7 years ago, and today approximately 50% of all of its software installations are accomplished without any energy consumed by various modes of travel.

Energy and Carbon Management with OSIsoft and SAP Solutions 5
Both companies share a dual sustainability strategy where we not only want to be enablers for our customers via our solutions, but also to become exemplars by following sustainability best practices inside our own corporate boundaries (see Figure 1).
Figure 1 - Dual Sustainability Strategy
2 A Proof of Concept at SAP Co-Innovation Lab
As businesses face today’s economic climate, along with market globalization, a key strategy to reduce costs while still meeting sustainability initiatives is to reduce energy consumption. How can you monitor energy use, optimize assets and materials, and ultimately meet your company carbon reduction objectives? Many companies turn to SAP and OSIsoft for answers.
The two companies share thousands of mutual customers, and many of these customers are already engaged in software projects to deliver various components from both companies to conduct tasks such as:
o Collecting energy consumption from various areas of the facility
o Collecting energy production from the rooftop solar panels
o Collecting weather data
Data collection is only the first step. To really benefit business, the data needs to be processed,
analyzed, and presented to right audience in the right format – for example:
o Present energy data and its analysis to the occupants of the building so they can see their efforts over
time to reduce energy costs
o Use alerts to maintain equipment when necessary
o Report on the carbon impact of the energy system in the building

Energy and Carbon Management with OSIsoft and SAP Solutions 6
When appropriately integrated, software from SAP and OSIsoft can feasibly help you gain greater insight into your energy and carbon footprint across all scopes of emissions. Such insight can ultimately help you with energy management by providing visibility into asset utilization and energy use, identifying cost reduction opportunities, and linking to plant control systems to monitor plant operating performance. It can also help organizations accurately measure, mitigate, and monetize carbon emissions and other environmental impacts.
The question is: What are the relevant components from OSIsoft and SAP, and how do these components work best together to provide a solution for collecting, analyzing, and presenting energy data? That’s the main reasons the two companies came together in SAP Co-Innovation Lab:
• To validate how the integration of OSIsoft and SAP software works
• To demonstrate how the integration can potentially provide our customers with timely information to
help reduce energy consumption and create an environment where equipment is maintained
efficiently and carbon impact is appropriately calculated and reported
3 The Joint Solution Architecture
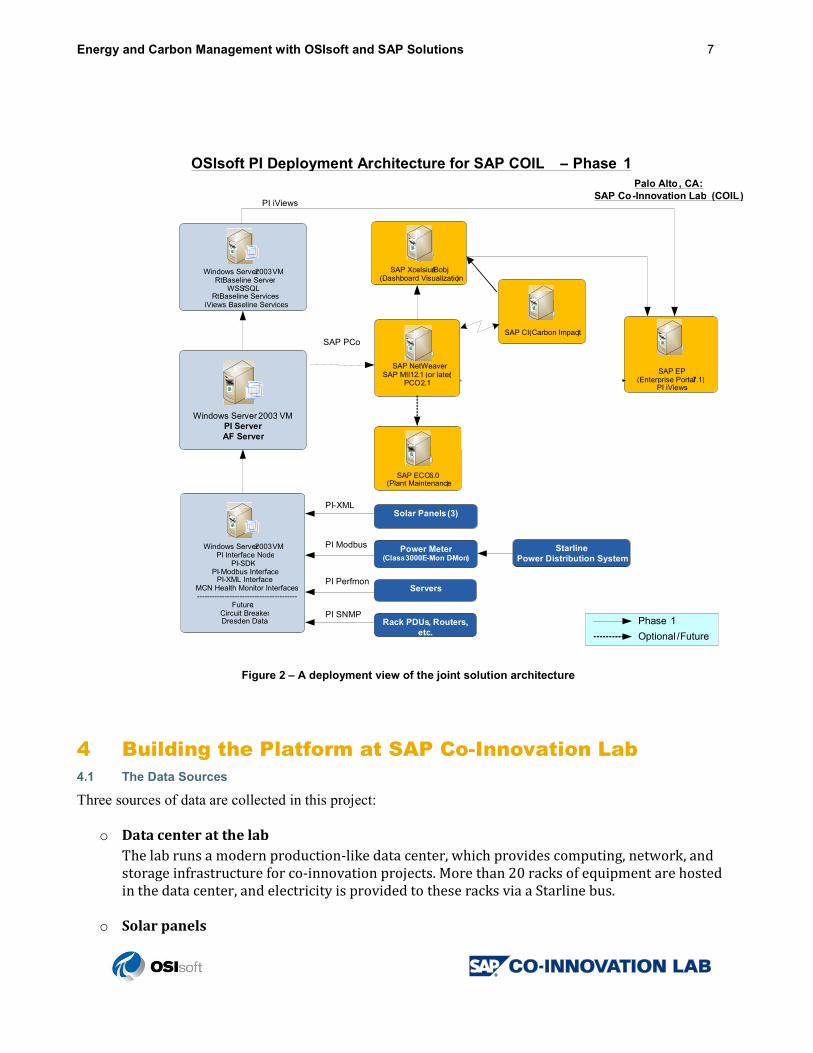
Figure 2 shows a deployment view of the solution architecture developed at the lab. At the heart of this joint solution are OSI PI system, SAP MII, SAP Carbon Impact OnDemand, and SAP NetWeaver Portal. How do they work together? In a nutshell, OSIsoft’s PI system collects real-time data from many different data sources. With built-in analytical features, PI system can directly produce iViews for SAP NetWeaver Portal and present real-time energy consumption reports in the portal. PI system can also pass along data for further processing in SAP MII where energy consumption data is analyzed, aggregated, displayed, and tracked, including generating alerts based on user needs. The energy consumption data is then fed into SAP Carbon Impact OnDemand to calculate the carbon impacts. For a consolidated visualization, SAP MII, SAP Carbon Impact OnDemand, and OSIsoft PI can all present their reports into a dashboard in the portal.
Energy and Carbon Management with OSIsoft and SAP Solutions 7
Figure 2 – A deployment view of the joint solution architecture
4 Building the Platform at SAP Co-Innovation Lab
4.1 The Data Sources
Three sources of data are collected in this project:
o Data center at the lab
The lab runs a modern production-like data center, which provides computing, network, and
storage infrastructure for co-innovation projects. More than 20 racks of equipment are hosted
in the data center, and electricity is provided to these racks via a Starline bus.
o Solar panels
Windows Server 2003 VM
PI Server
AF Server
Windows Server 2003 VMPI Interface Node
PI-SDKPI-Modbus Interface PI -XML Interface
MCN Health Monitor Interfaces ----------------------------------------
Future: Circuit BreakerDresden Data
OSIsoft PI Deployment Architecture for SAP COIL – Phase 1
Rack PDUs, Routers , etc .
SAP NetWeaver SAP MII 12. 1 (or later)
PCO 2. 1
SAP ECC 6.0(Plant Maintenance)
Power Meter(Class 3000 E -Mon D-Mon)
PI Modbus Starline
Power Distribution System
PI SNMP
ServersPI Perfmon
SAP PCo
PI iViews
Palo Alto , CA : SAP Co-Innovation Lab ( COIL )
SAP Xcelsius /Bobj (Dashboard Visualization)
Windows Server2003 VMRtBaseline Server
WSS/ SQLRtBaseline Services
iViews Baseline Services
Solar Panels (3 )PI - XML
SAP EP (Enterprise Portal 7.1)
PI iViews
SAP CI (Carbon Impact )
( )
Phase 1
Optional /Future

Energy and Carbon Management with OSIsoft and SAP Solutions 8
On the rooftop of the building where the lab is located, 400 solar panels are installed and
provide electricity to the whole building, including the lab.
o The building where the lab is located
Power is provided to the SAP campus by the City of Palo Alto. The building energy data is
collected by reading electrical flow from the City of Palo Alto’s Web site for this building.
o HVAC
Energy consumption data is provided by the building’s Trane HVAC equipment.
4.2 Prerequisites – Meters
The preparation for the deployment of this solution at the lab involved adding some additional energy meters and software systems so that real-time readings of energy consumption and production could be accessible
o EMON/DMON energy meter
A meter is installed in the data center that measures energy consumption of all the equipment
in the room. By default, this meter provides data only in its own proprietary format. For PI
system to read data from this meter via Modbus interface, additional software for the meter is
required.
o Smart PDUs
A few racks are powered by smartPDUs, which measure rack-level energy consumption.
o Additional software from Trane for the HVAC systems was also required.
4.3 OSIsoft Products
The PI system is the historical platform for all real-time data coming from many different data sources and providing analytics on that same data as it passed to the SAP platform. PI system interfaces – at the core of the data collection are a suite of more than 400 smart process connectors that connect to various sources of raw data and pass the uncompromised data up “by exception” to the PI system historian.
The PI system interfaces used in the lab initiative are as follows:
o PI-XML – to interpret raw data from solar panels and weather station
o PI- Modbus – to interpret data from the EMON energy meters in the lab data center
o PI-BacNet – to read HVAC energy consumption data from the building’s Trane HVAC equipment
o PI- HTML – to read electrical flow from the City of Palo Alto’s Web site for building one
PSA – PI Software Access clients that connect SAP MII to the PI system via OLEDB, SDK, JDBC or Web services

Energy and Carbon Management with OSIsoft and SAP Solutions 9
Enterprise business package – Web parts that render real-time data in real-time graphics in SAP NetWeaver Portal 4.4 SAP Products
SAP MII – SAP MII assists in moving real-time data into SAP software and provides a platform for analytics combining real-time data with SAP transactional information. SAP MII provides a direct connection between plant information systems and business systems. It ensures that all data that affects manufacturing is visible – including information about orders, materials, equipment status, costs, and product quality. SAP MII provides an extensible interface layer of operational data models, Web services, RFCs, BAPIs and intermediate documents (iDocs) at the top end for data exchange with enterprise applications. Internally, its business logic services and data transformation services add a layer of analytical capability for data enrichment, aggregation, and processing of the collected data into its proper format for the destination system. As a result, SAP MII enables a true manufacturing composition environment based on a manufacturing service-oriented architecture (SOA). SAP BusinessObjects Dashboards software helps customers visualize and analyze the energy consumption and cost data to accurately measure and reduce energy across your internal operations and supply chain. SAP Carbon Impact OnDemand helps customers accurately measure, mitigate, and monetize greenhouse gas emissions and other environmental impacts across their internal operations and supply chain. SAP NetWeaver Portal – To achieve tangible increases in efficiency, quality, and value, SAP NetWeaver Portal delivers relevant information and functionality, and unifies critical enterprise information sources. Unlike other portals, the SAP NetWeaver Portal component transcends the simple aggregation of enterprise information and services and delivers on the promise of a unified enterprise. It empowers people with the tools they need to find relevant information and act on it in a way that resolves business issues in far less time and at a dramatically reduced cost.
SAP Enterprise Asset Management solution – Integral to enterprise asset management programs in
operational environments is the plant maintenance functionality in SAP Enterprise Asset Management
and SAP MII. The interaction between these software solutions enables project managers, maintenance
engineers, and others to optimize operation of physical assets and equipment. Using the real-time
ability to detect and alert, SAP MII can provide key information to the plant maintenance software
when assets fail to operate within optimal parameters. Strategies using SAP Enterprise Asset
Management can automate condition-based maintenance programs by providing timely information
for work requests and keep assets operating at their highest efficiencies.
5 Presenting the Results in a Dashboard
The energy management results are presented on two flat-screen panels on the first floor outside SAP Co-Innovation Lab, at the base of the staircase to the executive briefing center. Each morning employees and visitors can see their daily and month-to-date progress towards reducing energy consumption. The idea is to have the entire picture available. Specifically, data is collected in real time from disparate data sources. In

Energy and Carbon Management with OSIsoft and SAP Solutions 10
this case data is gathered from the solar panels as well as power consumed from the utility. In addition to showing real-time data, data aggregation and analysis is also presented, both from a consumption as well as cost basis. People can see the contribution of power from the solar panels and any spikes in usage. The goal is to continually evaluate energy “anomalies” to see if building maintenance is needed to help get energy consumption back in control. 5.1 Real-Time Energy Consumption at SAP Co-Innovation Lab
The first dashboard presented at the lab shows the real-time usage of both solar power and utility power, as shown in Figure 3.
Figure 3 – Real-time energy consumption data collected and presented by OSIsoft PI System
In addition to the solar panel performance, related data values such as temperature are also gathered so as to provide realistic context to facilities managers to be able to analyze the trends and identify potential actions.
5.2 A Closer Look: Solar Power Generation in the Last 24 Hours

Energy and Carbon Management with OSIsoft and SAP Solutions 11
Figure 4 provides a closer look at solar power generation in the last 24 hours. SAP MII plays an important role in aggregating the real-time data collected by PI system, and the data is visualized using SAP BusinessObjects Dashboards software.
Figure 4 – 24 hours solar power generation overview
The aggregation of real-time data provides opportunities to understand solar power generation patterns. The gauges for key solar power measurements are very useful for monitoring the performance of the solar panels and the DC to AC inverter, which feeds the solar-generated electricity in the building electrical grid. 5.3 Power Consumption in the Last Seven Days: Purchased Versus Solar
Figure 5 summarizes the last seven days’ power consumption at the data center of the co-innovation lab. It shows usage of energy provided by both solar panels and utility provider.

Energy and Carbon Management with OSIsoft and SAP Solutions 12
Figure 5 – 7 days’ summary of power consumption
The comparison of solar power generated versus required consumption also provides viewers an understanding of the portion of “green” energy use vs. utility consumption. Further, anomalies in consumption usage can be interesting to observe. For example, why is the weekend usage very similar to weekday usage? Is this behavior as expected or are there any “low-hanging fruit” opportunities that can be implemented to save energy? 5.4 Cost Avoidance
The ability to add the cost aspects to the views is also important. For example, comparing the various utility tariffs – flat rate versus time of use, especially given the solar panels that can offset the peak period – gives facility managers a tool to understand trade-offs.
Energy and Carbon Management with OSIsoft and SAP Solutions 13
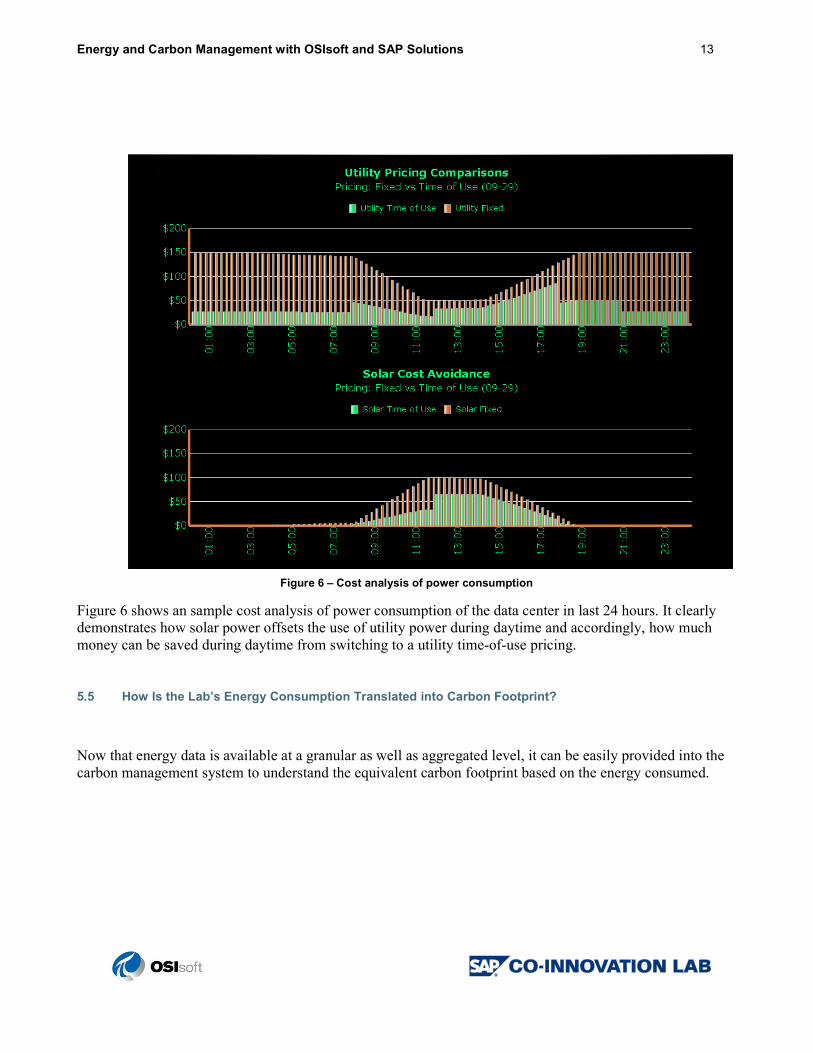
Figure 6 – Cost analysis of power consumption
Figure 6 shows an sample cost analysis of power consumption of the data center in last 24 hours. It clearly demonstrates how solar power offsets the use of utility power during daytime and accordingly, how much money can be saved during daytime from switching to a utility time-of-use pricing.
5.5 How Is the Lab’s Energy Consumption Translated into Carbon Footprint?
Now that energy data is available at a granular as well as aggregated level, it can be easily provided into the carbon management system to understand the equivalent carbon footprint based on the energy consumed.
Energy and Carbon Management with OSIsoft and SAP Solutions 14
Figure 7 – Dashboard for energy and carbon management at SAP Co-Innovation Lab
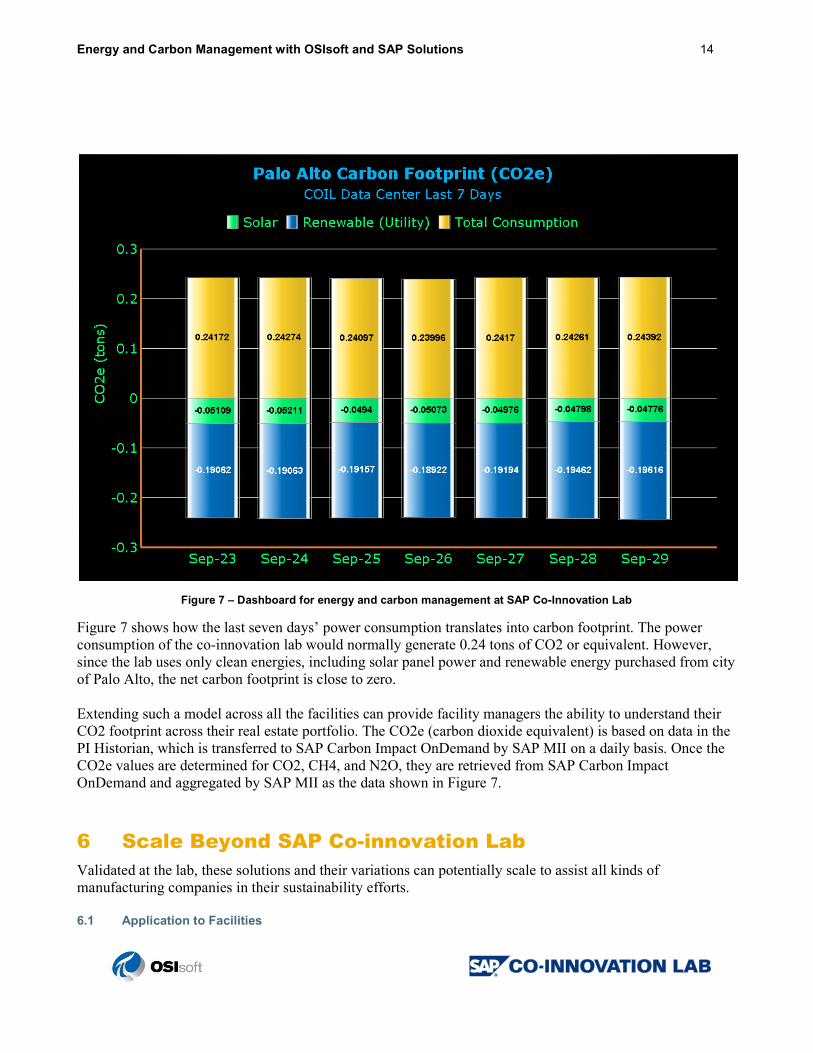
Figure 7 shows how the last seven days’ power consumption translates into carbon footprint. The power consumption of the co-innovation lab would normally generate 0.24 tons of CO2 or equivalent. However, since the lab uses only clean energies, including solar panel power and renewable energy purchased from city of Palo Alto, the net carbon footprint is close to zero. Extending such a model across all the facilities can provide facility managers the ability to understand their CO2 footprint across their real estate portfolio. The CO2e (carbon dioxide equivalent) is based on data in the PI Historian, which is transferred to SAP Carbon Impact OnDemand by SAP MII on a daily basis. Once the CO2e values are determined for CO2, CH4, and N2O, they are retrieved from SAP Carbon Impact OnDemand and aggregated by SAP MII as the data shown in Figure 7.
6 Scale Beyond SAP Co-innovation Lab
Validated at the lab, these solutions and their variations can potentially scale to assist all kinds of manufacturing companies in their sustainability efforts. 6.1 Application to Facilities

Energy and Carbon Management with OSIsoft and SAP Solutions 15
Sustainability is not a new concept to facility management. At its core, smart energy management not only helps environmental causes, it also saves money. A real-world example is Eastman Kodak Business Park in Rochester, New York, which began in the early 1900s as an industrial manufacturing company dedicated to the production of film. As the digital age replaced the need for photographic film, the company had to “reinvent” its purpose. As a result, this large manufacturing complex set its sights on becoming a state-of-the-art industrial complex. Eastman Business Park, now a 1,200-acre office park and industrial complex, is currently home to more than 25 companies and on-site suppliers. Eastman Business Park offers more than 2.6 million square feet of existing office space, manufacturing space, laboratories, and warehouse space for immediate occupancy. Often referred to as “a city within a city,” Eastman Business Park is a self-sufficient manufacturing facility with a highly efficient and highly reliable infrastructure. Low-cost services and unparalleled infrastructure are the hallmarks of Eastman Business Park, providing a range of services including low-cost utilities, on-site railroad, facilities management, on-site security and access control, and emergency medical services. Because this business park was once a self-contained manufacturing facility, it now can boast of its world-class, energy-efficient utility infrastructure. Power and water systems at the former plant are equally as progressive and significantly more reliable than typical public utilities. This enables tenants to concentrate on their core business knowing they’re receiving the highest-quality services at the lowest possible cost. At the heart of the park’s IT infrastructure are a PI system and SAP NetWeaver Portal. This foundation provides valuable information for energy and water conservation and control. The data is also used to balance metering of the utilities back to the 25 companies that occupy various spaces within the complex. Data is collected from a variety of building automation sources and distributed control systems such as:
• Rosemount – Fix 32
• Siemens – Apogee
• Emerson – Delta V
• SQL-Based Historians
• Powers
• Andover
• Fisher Provox
• Westinghouse WDPF
• Westinghouse Ovation
• Taylor Mod 300
• Emerson – Delta V The result is a real-time monitor for energy consumption, correlating energy consumption to the various manufactured production volumes for all companies to see in real time. Additionally, the site’s power-generation assets are optimized through improved demand-side management. As presented at the 2008 OSIsoft PI Users’ Conference, and again at the 2010 conference, each Kodak Business Park tenant can see a real-time and summary energy information in SAP NetWeaver Portal, as shown in Figure 8.

Energy and Carbon Management with OSIsoft and SAP Solutions 16
Figure 8 – Dashboard for Energy and Carbon management at Eastman Kodak
6.2 Application to Industry
Results from a recent Aberdeen Group study on SAP Enterprise Asset Management revealed that the top pressures driving manufacturers to focus on asset management are to maximize return on assets and reduce risk due to failure of critical assets.
“The research found that Best-in-Class manufacturers are taking a holistic approach by investing
in a common technology platform to address these pressures. Best-in-Class manufacturers are
adopting asset management solutions and integrating it with both plant floor systems as well as
ERP by creating real-time interoperability across these systems to manage information across the
complete asset lifecycle. SAP provides manufacturers with a common enterprise wide solution for
asset management, which the research has shown as a differentiator for Best-in-Class
performance.”
Mehul Shah
Manufacturing Research Analyst, Aberdeen Group
Global pressures have forced manufacturing companies to maximize production and efficiencies across all assets. The key to optimizing performance is management and promotion of continuous improvement initiatives. This starts with visibility of manufacturing operations, establishing KPIs and metrics to measure effectiveness, and driving best practices across production lines, shifts, and plants. Therefore, material and labor costs can be reduced while maintaining the same level of system quality, and costs for the use of external service providers can be optimized. SAP Enterprise Asset Management allows for more transparent and simplified processes through integrated plant maintenance capabilities. Many manufacturing facilities generate and update production schedules. Production schedules help managers and supervisors coordinate

Energy and Carbon Management with OSIsoft and SAP Solutions 17
activities to increase productivity and reduce operating costs. Because a manufacturing system is dynamic, and unexpected events occur, rescheduling is necessary to update a production schedule when the state of the manufacturing system makes it infeasible. Rescheduling updates an existing production schedule in response to disruptions or other changes. Typical events to trigger the rescheduling include machine breakdowns, job arrival or cancellation, job priority changes, quality problems, shortage of materials, and tools or personnel delays. For example, Valero developed an Operations Center Dashboard for its 15 U.S. refineries. Incorporated as one of five focus areas for the dashboard was an energy scorecard measuring steam, electricity, and fuel gas usage. Valero used many of the same software solutions (OSIsoft’s PI system and SAP MII, as well as some other data historians) to collect data in the refineries and display this energy consumption to business decision makers on a “right-time” basis.
Figure 9 – Snapshot of Valero Energy Stewardship Dashboard (subset)
As shown in Figure 9, Valero’s second project, Energy Stewardship Dashboard, provides eight levels of detailed drill downs with alerts and alarms to prompt corrective actions. From visualizing the data and taking corrective action to curtail energy usage, Valero’s estimated ROI was US$120 million in 2009. .
7 Key Learning

Energy and Carbon Management with OSIsoft and SAP Solutions 18
In today's economic climate, sustainability initiatives have a compelling business case in terms of cost savings and energy consumption in every area of the business. To get started, companies need transparency into their energy usage and emissions, as well as the ability to benchmark usage and identify and execute on the optimal abatement levers for reduction.
The SAP and OSIsoft initiative for energy and carbon management at SAP Co-Innovation Lab is intended to help customers meet corporate energy needs in today’s deregulated energy market. The PI system and associated interfaces from OSIsoft can provide the platform for real-time data collection. SAP MII can bring data connectivity up from the PI system to SAP software and provide an analytical platform via SAP BusinessObjects Dashboards for combining operational metrics with SAP asset information. Furthermore, the SAP Energy Data Management application can help you accurately measure and reduce energy, and SAP Carbon Impact OnDemand helps mitigate and monetize greenhouse gas emissions and other environmental impacts across your internal operations and supply chain. Combined, these offerings, published in the SAP NetWeaver Portal component can improve your access to information and overall view of asset performance – leading to increased overall efficiency.
8 References
SAP Co-Innovation Lab: http://coil.sap.com SAP MII: www1.sap.com/solutions/manufacturing/manufacturing-intelligence-software/index.epx SAP Carbon Impact OnDemand: www.sap.com/solutions/sustainability/offerings/carbon-impact/index.epx SAP NetWeaver Portal: www.sap.com/platform/netweaver/components/portal/index.epx OSIsoft PI system: www.osisoft.com/
Copyright/Trademark (www.sap.com/about/company/legal/copyright/index.epx )