energy and voltage management methods for multilevel
TRANSCRIPT

Scholars' Mine Scholars' Mine
Doctoral Dissertations Student Theses and Dissertations
Spring 2009
Energy and voltage management methods for multilevel Energy and voltage management methods for multilevel
converters for bulk power system power quality improvement converters for bulk power system power quality improvement
Atousa Yazdani
Follow this and additional works at: https://scholarsmine.mst.edu/doctoral_dissertations
Part of the Electrical and Computer Engineering Commons
Department: Electrical and Computer Engineering Department: Electrical and Computer Engineering
Recommended Citation Recommended Citation Yazdani, Atousa, "Energy and voltage management methods for multilevel converters for bulk power system power quality improvement" (2009). Doctoral Dissertations. 2165. https://scholarsmine.mst.edu/doctoral_dissertations/2165
This thesis is brought to you by Scholars' Mine, a service of the Missouri S&T Library and Learning Resources. This work is protected by U. S. Copyright Law. Unauthorized use including reproduction for redistribution requires the permission of the copyright holder. For more information, please contact [email protected].


ENERGY AND VOLTAGE MANAGEMENT
METHODS FOR MULTILEVEL CONVERTERS FOR
BULK POWER SYSTEM POWER QUALITY IMPROVEMENT
by
ATOUSA YAZDANI
A DISSERTATION
Presented to the Faculty of the Graduate School of the
MISSOURI UNIVERSITY OF SCIENCE AND TECHNOLOGY
In Partial Fulfillment of the Requirements for the Degree
DOCTOR OF PHILOSOPHY
in
ELECTRICAL ENGINEERING
2009
Approved by
Mariesa L. Crow, Advisor
Badrul H. Chowdhury Keith Corzine
Mehdi Ferdowsi Bruce M. McMillin


iii
PUBLICATION DISSERTATION OPTION
This dissertation has been prepared in the form of four papers for publication. The first paper
consisting from pages 6 to 26 has been published in the Power and Energy Society General
Meeting, 20-24 July 2008, pp. 1-6. The second paper consisting from pages 27 to 48 has
submitted to the IEEE Transactions on Power Delivery in September 2008. The third paper
consisting from pages 49 to 66 will be submitted to the IEEE Transactions on Power Delivery by
the end of 2008. The fourth paper consisting from pages 67 to 74 is under review for publication
in the IEEE Transactions on Power Systems.

iv
ABSTRACT
Electric arc furnaces (EAFs) are prevalent in the steel industry to melt iron and scrap
steel. EAFs frequently cause large amplitude fluctuations of active and reactive power and are
the source of significant power quality disturbances. Also EAFs comprise a major portion of
industrial loading on the bulk power system. Typically, a static VAR compensator (SVC) or
Static Synchronous compensator (STATCOM) are use to provide the reactive power support in
order to alleviate the fluctuations in voltage at PCC. Static Synchronous Compensators
(STATCOMs) provide a power electronic-based means of embedded control for reactive power
support. Integrating an energy storage system (ESS) such as large capacitors with the
STATCOM will improve the device performance to have active power controllability as well as
the reactive power.
A cascaded multilevel STATCOM has been utilized in order to compensate for all the
fluctuations caused by an EAF both in the RMS of the voltage at PCC and also the active power
generation. Designing a sophisticated controller, it is possible to get the STATCOM track the
variations of active power in load. Therefore, the generator does not need to produce the random
active power demanded by the load.
Throughout the study, power quality assessment has been done by measuring the flicker
level and also the Total Harmonic Distortion of the three phase voltages. It has been seen that the
nonlinear controllers will show better performances in case of improving power quality indices
and they show more robustness.

v
ACKNOWLEDGMENTS
I would like to express my deepest appreciation to my advisor, Dr. Mariesa L. Crow for
my continuous guidance, advice and help during this research.
My appreciation is extended to the members of advisory committee, Dr. Badrul H.
Chowdhury, Dr. Keith Corzine, Dr. Mehdi Ferdowsi and Dr. Bruce M. McMillin for their time
and effort for reviewing this dissertation. Special thanks to Dr. Corzine for his advices during my
work.
Lastly, and most importantly, I wish to thank my parents, They bore me, raised me,
supported me, taught me, and loved me and also my husband who has always been supportive
and helping.

vi
TABLE OF CONTENTS
Page
PUBLICATION DISSERTATION OPTION------------------------------------------- iii ABSTRACT---------------------------------------------------------------------------------- iv ACKNOWLEDGEMENTS---------------------------------------------------------------- v TABLE OF CONTENTS------------------------------------------------------------------- vi LIST OF ILLUSTRATIONS-------------------------------------------------------------- ix SECTION 1. INTRODUCTION--------------------------------------------------------------- 1 PAPER
I. A Comparison of Linear and Nonlinear STATCOM Control for Power
Quality Enhancement
ABSTRACT---------------------------------------------------------------------------- 6 I. INTRODUCTION--------------------------------------------------------------- 6 II. SYSTEM MODELING --------------------------------------------------------- 7 A. ELECTRICAL NETWORK-------------------------------------------- 7 B. ARC FURNACE-------------------------------------------------------- 8 C. STATCOM---------------------------------------------------------------- 10 III. SYSTEM CONTROL----------------------------------------------------------- 12 D. PULSE WIDTH MODULATION------------------------------------- 12 E. CAPACITOR VOLTAGE BALANCING AND REDUNDANT
STATE SELECTION (RSS) ------------------------------------------ 12
IV. OBTAINING THE CONTROL PARAMETERS---------------------------- 14 F. LINEAR CONTROL---------------------------------------------------- 14 G. NONLINEAR CONTROL BASED ON ENERGY FUNCTION- 15 V. POWER QUALITY ASSESSEMENT---------------------------------------- 18 H. RMS VALUE ------------------------------------------------------------ 18 I. VOLTAGE BALANCING ---------------------------------------------- 19 J. TOTAL HARMONIC DISTORTION -------------------------------- 21 K. FLICKER MITIGATION ---------------------------------------------- 22 VI. CONCLUSION-------------------------------------------------------------------- 24 REFERENCES------------------------------------------------------------------------ 25

vii
II. An Improved Nonlinear STATCOM Control for Electric Arc Furnace
Voltage Flicker Mitigation
ABSTRACT---------------------------------------------------------------------------- 27 I. INTRODUCTION-------------------------------------------------------------- 27 II. A NEW NONLINEAR CONTROL FOR STATCOM-------------------- 30 III. THE TEST SYSTEM---------------------------------------------------------- 34
A. ARC FURNACE FLICKER SIGNAL GENERATION------------ 34
B. THE STATCOM -------------------------------------------------------- 37 IV. PROPOSED CONTROL EFFECTIVENESS------------------------------ 39
A. RMS VOLTAGE AND LINE ACTIVE POWER------------------- 39
B. VOLTAGE BALANCING--------------------------------------------- 40
C. TOTAL HARMONIC DISTORTION (THD)----------------------- 43
D. FLICKER MITIGATION----------------------------------------------- 43
V. CONCLUSION------------------------------------------------------------------- 44
ACKNOWLEDGEMENT----------------------------------------------------------- 45
REFERENCES------------------------------------------------------------------------ 45
III. Fault Detection and Mitigation in Multilevel Converter STATCOMs
ABSTRACT--------------------------------------------------------------------------- 49
I. INTRODUCTION-------------------------------------------------------------- 49
II. THE MULTILEVEL STATCOM------------------------------------------- 52
III. FAULT ANALYSIS FOR THE MULTILEVEL STATCOM------------- 53
IV. EXAMPLE AND RESULTS-------------------------------------------------- 57
A. DYNAMIC PERFORMANCE----------------------------------------- 58
B. THD PERFORMANCE------------------------------------------------- 62
V. CONCLUSION------------------------------------------------------------------- 64
ACKNOWLEDGEMENTS--------------------------------------------------------- 65
REFERENCES------------------------------------------------------------------------ 65
IV. Application of STATCOM for Electric Arc Furnace Distortions
ABSTRACT--------------------------------------------------------------------------- 67
I. INTRODUCTION-------------------------------------------------------------- 67
II. OBTAINING THE CONTROL PARAMETERS OF PWM------------- 68
III. TEST SYSTEM ---------------------------------------------------------------- 69

viii
IV. EXPREMENTAL RESULTS------------------------------------------------- 70
V. CONCLUSION----------------------------------------------------------------- 73
REFERENCES------------------------------------------------------------------------ 73
SECTION
2. CONCLUSIONS---------------------------------------------------------------- 75
APPENDICES
A. BACKGROUND ON REDUNDANT STATE SELECTION------------- 77
B. BACKGROUND ON CROW BAR------------------------------------------- 80
C. BACKGROUND ON FAULTED CELL IN A MULTILEVEL
CONVER WITH BATTERIES------------------------------------------------ 82
D. IEEE 14 BUS TEST SYSTEM DATA---------------------------------------- 86
VITA------------------------------------------------------------------------------------------ 90

ix
LIST OF ILLUSTRATIONS
Figure PagePAPER I 1. Case Study Network------------------------------------------------------------------------ 8 2. EAF Flicker Waveform-------------------------------------------------------------------- 9 3. EAF Flicker Frequency Spectrum-------------------------------------------------------- 10 4. Eleven Level Cascaded Multilevel Inverter (STATCOM)---------------------------- 11 5. Control System------------------------------------------------------------------------------ 14 6. Linear Control Block Diagram------------------------------------------------------------ 15 7. RMS Value of the Voltage at the PCC with no Control (top), Linear Control
(Middle), and Nonlinear Control (Bottom) --------------------------------------------- 19
8. Three Phase Voltages at PCC, a) without Control (top), b) Linear Control, c)
Nonlinear Control (Bottom) --------------------------------------------------------------- 20
9. Average of the Internal DC Voltages with no Control (top), Linear Control
(Middle), and Nonlinear Control (Bottom) --------------------------------------------- 21
10. THD of the Three Phase Voltages at PCC Applying Linear Controller------------ 22 11. THD of the Three Phase Voltages at PCC Applying Nonlinear Controller------- 22 12. Flicker Meter Signal at PCC with Linear Control------------------------------------- 23 13. Flicker Meter Signal at PCC with Nonlinear Control--------------------------------- 23 PAPER II 1. PI Control------------------------------------------------------------------------------------ 33 2. Test System---------------------------------------------------------------------------------- 34 3. EAF Flicker Waveform-------------------------------------------------------------------- 37 4. EAF Flicker Frequency Spectrum-------------------------------------------------------- 37 5. Actual RMS EAF Flicker Waveform----------------------------------------------------- 37 6. Phase Voltages at PCC No Control------------------------------------------------------- 37 7. Eleven Level Cascaded Multilevel Inverter (STATCOM)---------------------------- 38 8. RMS Voltage for Test System------------------------------------------------------------- 40 9. Load and Line Active Powers for Test System----------------------------------------- 41

x
10. Phase voltages at the PCC; PI control - top, proposed control - bottom----------- 42 11. THD of PCC voltage (phase a) ---------------------------------------------------------- 42 12. Flicker measure of PCC voltage (phase a)--------------------------------------------- 43 13. Flicker measure of PCC voltage (phase a)--------------------------------------------- 44 PAPER III 1. Eleven Level Cascaded Multilevel Inverter (STATCOM)---------------------------- 50 2. (a) Carrier and reference waveform for PSPWM (b) Output waveform----------- 52 3. Cell with fault switch----------------------------------------------------------------------- 54 4. Simplified eleven level cascaded multilevel STATCOM------------------------------ 55 5. Flow chart------------------------------------------------------------------------------------ 56 6. Proposed fault detection and remediation control for cell 1--------------------------- 56 7. Test system----------------------------------------------------------------------------------- 58 8. Active power drawn by arc furnace load------------------------------------------------- 59 9. Line active power--------------------------------------------------------------------------- 59 10. STATCOM voltage before, during, and after fault----------------------------------- 60 11. Line active power before, during, and after fault-------------------------------------- 60 12. DC voltage before, during, and after fault---------------------------------------------- 60 13. Converter output with faulted cell------------------------------------------------------- 61 14. Modulation gain k before, during, and after fault------------------------------------- 62 15. Individual module capacitor voltages before, during, and after fault--------------- 63 16. Percent THD of the faulty phase before, during, and after fault-------------------- 64 17. Percent harmonic content of the fault phase before, during and after fault-------- 64 PAPER IV 1. Test System---------------------------------------------------------------------------------- 69 2. RMS of the Voltage at PCC, Before STATCOM (top), After STATCOM
(bottom)-------------------------------------------------------------------------------------- 70
3. Active Power from the System, Before STATCOM (top), After STATCOM
(bottom) -------------------------------------------------------------------------------------------------------- 71
4. Active Power through the StatCom Line ------------------------------------------------ 71 5. RMS of the Voltage at PCC before Fault, During the Fault and After Fault-------- 72 6. Before Fault, During the Fault and After Fault-----------------------------------genP 72 7. THD of the Three Phase Voltages at PCC, Before STATCOM (top), After
STATCOM (bottom) ---------------------------------------------------------------------- 73

1. INTRODUCTION
Electric arc furnaces (EAFs) are prevalent in the steel industry to melt iron and
scrap steel. EAFs frequently cause large amplitude fluctuations of active and reactive
power and are the source of significant power quality disturbances. Also EAFs comprise
a major portion of industrial loading on the bulk power system. EAF flicker is induced by
a low-frequency modulation (5- 35 Hz) of the voltage at the point of common coupling
(PCC) with the system. Typically, a static VAR compensator (SVC) or Static
Synchronous compensator (STATCOM) is used to provide the reactive power support in
order to alleviate the fluctuations in voltage at PCC. Static Synchronous Compensators
(STATCOMs) provide a power electronic-based means of embedded control for reactive
power support.
A cascaded multilevel STATCOM has been utilized in order to compensate for all
the fluctuations caused by an EAF both in the RMS of the voltage at PCC and also the
active power generation. There are several compelling reasons to consider a cascaded
multilevel converter topology for the STATCOM. These well known reasons include
lower harmonic injection into the power system, decreased stress on the electronic
components due to decreased voltages, and lower switching losses. Various multilevel
converters also readily lend themselves to a variety of PWM strategies to improve
efficiency and control. Third, the cascaded multilevel converter can achieve better
voltage balancing across levels than other multilevel topologies. Sinusoidal Pulse Width
Modulation (SPWM) has been used to control the switching pattern of the STATCOM.
The STATCOM was utilized to implement two control approaches. The first
control approach was designed to track and counteract the variations in active power of

the load. This minimizes the disturbance on the system and improves the power quality.
The second approach was designed to control the average dc voltage across the capacitors
and the RMS PCC voltage. Each control approach was implemented with linear and
nonlinear control of the STATCOM. The linear controllers are traditional PI controllers.
The nonlinear controllers have been designed based on Lypanov’s criteria.
Throughout the study, power quality assessment has been performed by
measuring the flicker level and also the Total Harmonic Distortion (THD) of the three
phase voltages. It is shown that the nonlinear controllers provide better performances for
improving power quality indices and are more robust.
The EAF load was developed in PSCAD and has been utilized within the IEEE 14
bus test system. The nonlinear controller is shown to provide constant active power
generation and constant RMS PCC voltage. Also, fault studies have been performed on
the network to further validate the effectiveness of the proposed nonlinear controller.
The complex topology of these inverters coupled with the large number of devices
increase the probability of the STATCOM failure. As increasingly higher level converters
are used for high output rating power applications, a large number of power switching
devices will be used. Each of these devices is a potential failure point. Therefore it is
important to design a sophisticated control to produce a fault-tolerant STATCOM. A
faulty power cell in a cascaded H-bridge STATCOM can potentially cause switch
modules to explode leading to fault conditions such as a short circuit or an overvoltage on
the power system resulting in expensive down time. Subsequently, it is crucial to identify
the existence of any fault and also to determine the location of the fault for it to be
removed. In this dissertation, a fault detection method is proposed that requires only that
2

the output DC link voltage of each phase be measured. This measurement is typically
accomplished routinely for control purposes. If a fault is detected, the module in which
the fault occurred is then isolated and removed from service. This approach is consistent
with the modular design of cascaded converters in which the cells are designed to be
interchangeable and rapidly removed and replaced. Until the module is replaced, the
multilevel STATCOM continues to operate with slightly decreased, but still acceptable,
performance. The proposed approach is validated through an analysis of the dynamic
performance and the THD.
The primary contributions of this dissertation are grouped into two main areas.
The first contribution area is the development of a STATCOM controller to mitigate the
effects of electric arc furnace fluctuations. Specific developments include:
• Modeling of the EAF; A new model was developed for simulating the dynamic
performance of an electric arc furnace through the application of varying
resistances. Each phase is randomly varying and potentially unbalanced. This
model was implemented in PSCAD. (all papers)
• Implementing redundant state selection (RSS); Redundant state selection has been
utilized to balance the capacitor voltages in the eleven-level cascaded multilevel
converter. This has been developed and implemented in PSCAD. (all papers)
• A novel nonlinear VPCC-Vdc STATCOM control has been proposed and compared
against a traditional PI controller. This has been developed and implemented in
PSCAD on the EAF test system. (paper 1)
3

• A novel nonlinear VPCC-Pline STATCOM control has been proposed and compared
against a traditional PI controller. This has been developed and implemented in
PSCAD on the EAF test system. (paper 2)
• Total Harmonic Distortion (THD); A THD analysis has been performed on the
results from the proposed controllers and the traditional controllers. The mean
and maximum THD for each method is compared. (all papers)
• Flicker Analysis; An IEC flicker meter has been developed and implemented in
PSCAD for the EAF test system for the proposed and traditional controllers.
(paper 2)
• Large scale system application: The proposed nonlinear control method is
applied to the IEEE 14 bus test system with an EAF load. This has been
developed and implemented in PSCAD. (paper 4)
The second contribution area is the development of a novel approach to identify and
mitigate switch faults in a multilevel STATCOM. Specific developments include:
• Fault identification: A novel method has been proposed based on the DC voltage
profile to identify the location of faulty switches in the multilevel converter
without the aid of additional sensors. This has been developed and implemented
in PSCAD. (paper 3)
• Multilevel converter reconfiguration: A method to remove the faulted module
and corresponding modules is proposed. This has been developed and
implemented in PSCAD. (paper 3)
4

• The impact of the reduced level STATCOM on system performance including
dynamic control and THD is analyzed. (paper 3)
5

I. A Comparison of Linear and Nonlinear STATCOM Control for Power Quality
Enhancement A. Yazdani, Student Member, IEEE, M. L. Crow, Senior Member, IEEE, J. Guo
ABSTRACT: This paper introduces a multilevel STATCOM for electric arc furnace
power quality enhancement. An eleven level cascaded multilevel converter is used to
alleviate the impacts of an unbalanced arc furnace load. The STATCOM provides a
power electronic-based means of embedded control for reactive power support.
Index Terms: Cascaded Multilevel Inverter, Arc Furnace, STATCOM, Power Quality
I. INTRODUCTION
Some industrial loads such as electric arc furnaces cause rapid and large swings in
active and reactive power with harmonic distortion and phase imbalances. This
fluctuation in load leads to fast nonperiodic voltage variations with appreciable voltage
distortion. Customers who share the distribution feeder with these nonlinear loads
frequently experience significant voltage variations that produce disturbances in their
equipment operation.
The use of fast acting power electronics converters such as the static synchronous
compensator (STATCOM) with fast and efficient controllers can provide precise and
flexible control to alleviate disturbances and improve power quality.
6

In this paper, an eleven level cascaded multilevel STATCOM with PWM control is
introduced to compensate for a nonlinear unbalanced load that emulates an electric arc
furnace. There are many papers in the literature that utilize a STATCOM to enhance
power quality [1-10], but few of them address how to quantify the improvement in power
quality. Additionally, most STATCOM control is based on a linear approach; in this
paper we introduce a nonlinear control for power quality improvement and compare it to
traditional PI control.
II. SYSTEM MODELING
A. Electrical network
The single line diagram of the electrical distribution system feeding an arc furnace
is shown in Fig. 1. The electrical network consists of a 115 kV generator and impedance
that is equivalent of a large network at the point of common coupling (PCC). The
STATCOM is connected to the system through a 115/25 kV Y-Delta transformer. The
electrical arc furnace load is non-sinusoidal, unbalanced, and randomly fluctuating [11].
Also to improve the harmonic levels before the transformer, a 100 uF parallel capacitor
bank filter is used.
7

115 kV
PCC
Fig. 1. Case Study Network
B. Arc Furnace
Electric arc furnaces are typically used to melt steel and will produce current harmonics
that are random. In addition to integer harmonics, arc furnace currents are rich in inter-
harmonics. To synthesize the variations to the RMS waveform, an aperiodic waveform is
generated by
)cos()cos()( HHHLLL tatat θωθωφ +++= (1)
Where, Lω and Hω are randomly generated frequencies in the range of interest and
and are randomly generated positive scalars such thatLa Ha 1≤+ HL aa . At each zero
crossing, a new set of parameters HHLL aa ωω ,,, are generated. The phase angles Lθ and
Hθ are then calculated such that the waveform is continuous across the zero crossing.
For arc furnace applications, the low frequency component Lω should be centered
about a frequency in the 5-35 Hz range. The high frequency component Hω should be
8

centered about an odd integer multiple of Lω . The human eye is particularly sensitive to
variations around 10 Hz [11]. A non-sinusoidal randomly fluctuating flicker waveform
can be produced from
2 (1 8)Lω π ρ= +
Where, ρ∈ [0, 1] is a randomly generated number. Similarly,
2 (10 30)Hω π ρ= +
50La ρ= and 10Ha ρ= Figure 2 shows the unbalanced nonlinear resistances that have been modeled to
produce the EAF load. The load imbalance is modeled by using a base resistance of 135
Ω for phases a and b, and a base resistance of 80 Ω for phase c.
Fig. 2. EAF flicker waveform
Figure 3 shows the frequency spectrum of the load signal. Note the clustering about 30
Hz and again around 8 Hz with a much wider frequency spread at low frequencies.
9

Fig.3. EAF flicker frequency spectrum
C. STATCOM
In this paper, the model of STATCOM (cascaded multilevel inverter) is implemented
in PSCAD. The configuration of the STATCOM can be seen in Fig. 4 [3]. The power
electronic switches are controlled to balance the internal DC capacitor voltages; a look up
table has been used to select the redundant states (RSS) such that in each voltage level the
lookup table will decide which capacitors should provide the desired voltage. The
primary objective of this paper is to compare and contract two methods, one linear and
one nonlinear to calculate the control parameters: the modulation index k and the
modulation phase angleα.
10

Fig. 4. Eleven Level Cascaded Multilevel Inverter (STATCOM)
A cascaded multilevel STATCOM contains several H-bridges in series to synthesize a
staircase waveform. The inverter legs are identical and are therefore modular. For our
case study, each leg has five H-bridges. Since each full bridge generates three different
level voltages (V, 0, -V) under different switching states, the number of output voltage
levels will be eleven. This configuration is chosen because it has the following
advantages comparing to other converter types:
1. It is more suitable to high-voltage, high-power applications than the conventional
inverters since the currents and voltages across the individual switching devices
11

are less,
2. It generates a multistep staircase voltage waveform approaching a pure sinusoidal
output voltage by increasing the number of levels [3], and
3. It is far better than other types of multilevel converters in DC voltage balancing,
because each bridge has its own DC source.
III. SYSTEM CONTROL
D. Pulse Width Modulation
Sinusoidal Pulse Width Modulation (SPWM) is utilized to control the power electronic
switches. This strategy is used to synthesize a sinusoidal waveform proportional in
magnitude to the modulation gain k and shifted by the phase angle α. The advantage of
pulse width modulation is that both parameters k and α can be independently controlled.
As the phase angle of the voltage on the converter side is changed with respect to the
phase angle of the AC system voltage, the STATCOM will attempt to generate or absorb
active power from the AC system. The exchanged active power will charge or discharge
the internal DC capacitors.
E. Capacitor Voltage Balancing using Redundant State Selection (RSS)
To achieve a high quality output voltage waveform, the voltages across all DC capacitors
should maintain a constant value. However, the power system operation and modulation
12

scheme together have different effects on each capacitor so that they are not charged and
discharged evenly leading to different voltages in each leg of each phase. However,
because of redundancy, there is always more than one switching state that can form any
given voltage level. Therefore, there exists a “best” state among all the possible states
that produces the most balanced voltages [2]. For example, if a DC capacitor is
scheduled to charge, then the capacitor with the current lowest voltage is chosen to be
charged. Thus, to balance the capacitor voltages, redundant state selection (RSS) is an
effective tool in balancing the DC capacitor voltages.
In this method the capacitor balancing is going to be achieved by using the proper
capacitor in each level in order to get the desired level dictated by SPWM. In each level if
the current direction of the phase is tending to charge the capacitors the least charged
ones should be used to maintain the desired level and if the current direction tends to
discharge the capacitors the most charged capacitors come into play. Figure 5 shows the
outline of the SPWM control system.
(a) System One Line Diagram
13

(b) SPWM control
Figure 5. (cont) Control System
IV. OBTAINING THE CONTROL PARAMETERS
F. Linear Control
The primary control targets of a STATCOM are to control the AC line voltage (Vstat) and
the DC capacitor voltage (Vdc). The AC voltage control is achieved by filtering out the
second harmonic and the low frequencies of the AC voltage and then a lead-lag and a PI
controller are applied to the voltage error in order to obtain the modulation phase shift α.
The DC capacitor voltage error is put through a PI controller to provide the modulation
index gain k. Figure 6 shows the linear control system.
14

Fig. 6. Linear Control Block Diagram
G. Nonlinear Control Based on Energy Function
Linear control has the advantages of simplicity, ease of implementation, and
computational efficiency. However, the disadvantages include the requirement that it be
tuned about a particular operating point. For this reason, nonlinear control sometimes
provides improved performance. In this section, a nonlinear control is developed and
applied to the 11-level cascaded STATCOM.
The STATCOM state equations are given by [7]:
'' '
' ''
' '
[ ] 00
d d
bq q
dc dc
Vi i
p i A iL
V V
ω⎡ ⎤⎡ ⎤ ⎡ ⎤⎢ ⎥⎢ ⎥ ⎢ ⎥
= − ⎢ ⎥⎢ ⎥ ⎢ ⎥⎢ ⎥⎢ ⎥ ⎢ ⎥⎢ ⎥⎣ ⎦ ⎣ ⎦ ⎣ ⎦
15

'
' '
'
' '
'' '
'
cos( )
[ ] sin( )
3 3cos( ) sin( )2 2
s b b
s b b
bb b
p
R kL L
R kA
L LC
kC kCR
ω ωω α
ω ωω α
ωω α ω α
⎡ ⎤−⎢ ⎥⎢ ⎥⎢ ⎥−
= −⎢ ⎥⎢ ⎥⎢ ⎥−− −⎢ ⎥⎢ ⎥⎣ ⎦
(2)
The target values for the dq currents are given by
'* '* '( )( Idcd dc dc pdc
Ki V V K
s= − + ) (3)
'* ' '( )( Iacq REF pac
Ki V V K
s= − + )
d
(4)
Where, and are the per unit values of the desired active and reactive currents
respectively and is the average value of the desired DC voltage.
'*
di'*
qi
'*
dcV
The errors are defined as:
'* 'd de i i= −
(5) '* '
q qe i iq= − (6)
The control approach is developed based on minimizing the system energy. Recall that a
positive definite Lyapunov function can be defined as:
2 2 , ( 0)2 2d qc cW e e c= + >
(7)
Where the derivative of (7) is given by:
16

2 21 1 2 2 3 ( )s s
d qs
RW p u p u p c e e
Lω•
= + + − +
(8)
Where:
1 cos( )u k α= (9)
2 sin( )u k α= (10)
and
'1
sdc d
s
p c VLω
= − e
'
2s
dc q
s
p c VL
ω= − e
'* '* * *
3
* * '
( ) (
( )
s sd d q q d d q q
s
sd q q d d
s
Rd dp c e i e i c e i e i
dt dt L
c e i e i c V eL
ω
ωω
= + + +
− − +
)
de
qe
The derivative of the Lypunov function is guaranteed to be negative if
1de c•
= − (11)
2qe c•
= − (12)
For positive constants c1 and c2. Using equations (2), (11) and (12) yields:
''* ' ' ' ' ' ' '*
1 ( )s sd d d s d s q
s s
L Le c i i R i L i V i
ω ω
•
= − − − − − − d (13)
' ''* ' ' ' ' ' '*
2 ( )s sq q q s q s d
s s
L Le c i i R i L i
ω ω qi•
= − − − + − (14)
17

Considering (9), (10), (13) and (14), results in the following control parameters [13]:
2 2
d qk e e= +
(15)
1tan ( )q
d
e
eα −=
(16)
V. POWER QUALITY ASSESSEMENT
To assess the effectiveness of the STATCOM, the impact of the control performance
on following factors is studied:
• RMS value
• Voltage Balancing
• Total Harmonic Distortion (THD)
• Flicker Mitigation
H. RMS Value
The effectiveness of STATCOM for power quality enhancement and the comparison
between linear and nonlinear control is illustrated in this part through the simulation
results. Figure 7 shows the voltage RMS value of Vpcc. The STATCOM control is
engaged at 1.3 seconds. The uncontrolled voltage varies randomly and often with greater
than 5% variation. Note that both the linear and nonlinear controllers improve the RMS
voltage considerably, but the nonlinear controller shows better performance over the
18

linear controller. With the linear control there are fluctuations that are in a tolerable
range, but with the nonlinear control a nearly constant Vpcc is obtained.
1 1.5 2 2.50.9
1
1.1
VPC
C (pu)
1 1.5 2 2.50.8
0.9
1V
PCC (p
u)
1 1.5 2 2.50.8
0.9
1
time (seconds)
VPC
C (pu)
no control
linear control
nonlinear control
Fig. 7. RMS Value of Voltage at the PCC with no control (top), linear control (middle),
and nonlinear control (bottom)
I. Voltage Balancing
Fig. 8 shows the impact of STATCOM on individual voltage phase balancing. In
Figure 8(a), the individual phases voltages show significant imbalance in peak magnitude
as well as variation in magnitude over time (due to the random fluctuations in load). The
STATCOM with linear control shows correction of the phase imbalance and improves
the peak magnitude consistency as well. The nonlinear control provides the best phase
voltage correction.
19

Fig. 8. Three phase voltages at PCC (a) without control, (b) linear control, and (c)
nonlinear control.
Fig. 9 shows the simulation results of the average value of the DC capacitor voltages.
In all cases, the capacitor voltage balancing scheme is used, so only the average DC
voltage variation is of interest. With no control, the DC voltage varies significantly, but
it does not show any long term decrease or increase since the STATCOM is essentially
idle without control. With control, the DC voltage is better maintained at the target value
(0.98 pu), with the nonlinear control providing the best performance.
20

1 1.5 2 2.50.8
0.9
1
1.1
Vdc
(pu)
1 1.5 2 2.50.8
0.9
1
1.1
time (seconds)
Vdc
(pu)
1 1.5 2 2.50.8
0.9
1
1.1
Vdc
(pu)
no control
linear control
nonlinear control
Figure 9: Average of the Internal DC Voltages Applying linear control (top) and
nonlinear control (bottom)
J. Total Harmonic Distortion
PSCAD modules have been used to get the RMS and THD of PCC voltage. For flicker
analysis, the IEC flicker meter given in [1] has been implemented in PSCAD.
Figs. 10 and 11 show the THD level of the three phase voltages at PCC using the linear
and nonlinear control respectively. Recall the STATCOM control is engaged at 1.3
seconds. Prior to engaging the control, the THD is quite large, at times reaching nearly
5%. However, once the control is engaged, the THD drops dramatically. The THD for
the linear controller is consistently less than 2%. The THD for the nonlinear controller is
consistently less than 1%. These results again validate the performance of both
controllers, with the nonlinear control providing slightly better performance.
21

Fig. 10: The THD of the Three Phase Voltages at PCC Applying the Linear
Controller
Fig. 11 THD of the Three Phase Voltages at PCC Applying the nonlinear control
K. Flicker Mitigation
22

Figs. 12 and 13 show the flicker meter signals at the PCC. Recall again that the control
is not engaged until 1.3 seconds. After the initial transients from engaging the control die
out, the flicker content of the waveform is nearly entirely mitigated for both the linear
and nonlinear controllers.
Fig. 12. Flicker meter signal at PCC with Linear Control
Fig. 13. Flicker meter signal at PCC with Nonlinear Control
23

VI. CONCLUSION
In this paper, two different methods for controlling the STATCOM have been
introduced. Comparing the results of the controllers, the nonlinear control is more robust
in compensating unbalanced and random loads such as arc furnaces. Also one of the
primary advantages of the nonlinear control is that it is not dependent on any of the
system or load parameters.
24

REFERENCES
[1] R. Mienski, R. Pawelek and I. Wasiak “Shunt Compensation for Power Quality
Improvement Using a STATCOM Controller: Modelling and Simulation” IEE Proc.-Gener.
Transm. Distrib., Vol. 151, No. 2, March 2004.
[2] K. A. Corzine, M. W. Wielebski, F. Z. Peng, and J. Wang, “Control of Cascaded
Multilevel Inverters”, IEEE Trans. On Power Electronics, Vol. 19, No. 3, May 2004.
[3] F. Z. Peng, J. S. Lai, W. Mckeever, J. Vancoevering, “ A Multilevel Voltage Source
Inverter with Separate DC Sources for Static Var Generation.” IEEE Trans. On Industry
Applications, Vol. 32, No. 5, Sep. 1996.
[4] Task Force on Harmonics Modeling and Simulation,” Modeling devices with nonlinear
voltage-current characteristics for harmonic studies,” IEEE Trans. on Power Delivery, vol.19, No.
4, Oct. 2004.
[5] L. Dong, M. L. Crow, Z. Yang, C. Shen, L. Zhang, and S. Atcitty, “A Reconfigurable
FACTS System for University Laboratories”, IEEE Trans. On Power Systems, Vol. 19, No. 1,
Feb. 2004.
[6] L. M. Tolbert, F. Z. Peng, T. Cunnyngham, and J. N. Chiasson, “ Charge Balance
Control Scheme for Cascade Multilevel Converter in Hybrid Electric Vehicles.”IEEE Trans. On
Industrial Electronics, Vol. 49, No. 5, Oct. 2002.
[7] C. Schauder and H. Mehta, “ Vector Analysis and Control of Advanced Static Var
Compensators.” IEE Proceedings-C, Vol. 140, No. 4, Jul. 1993.
[8] Y. Liang, and C. O. Nwankpa, “STATCOM modeling for mitigation of voltage
fluctuations caused by electric arc furnaces”, IEEE Trans on Industry Applications, Vol. 35, No.
5, Sep. 1999.
25

[9] Aguero, J.L.; Issouribehere, F.; Battaiotto, P.E.“ A New Type of STATCOM Based on
Cascading Voltage Source Inverters with Phase Shifted Unipolar SPWM.”, Power Engineering
Society General Meeting, 2006, IEEE.
[10] Han, C.; Yang, Z.; Chen, B.; Huang, A.Q.; Zhang, B.; Ingram, M.; Edris, A., “Evaluation
of cascade-multilevel converter based STATCOM for arc fumace flicker mitigation.”, Industry
Applications Conference, 2005, 2005. Fourtieth IAS Annual Meeting Conference Record of the
2005.
[11] Task Force on Harmonics Modeling and simulation, “ Modeling devices with nonlinear
voltage-current characteristics for harmonic studies”, IEEE Trans on Power Delivery , Vol. 19,
No. 4, Oct. 2004.
[12] C. Schauder, “STATCOM for Compensation of Large Electric Arc Furnace
Installations,” Proceedings of the 1999 IEEE Power Engineering Society Summer Meeting, pp.
1109-1112, July 1999.
[13] Jianjun Guo, Decentralized Control and Placement of Multiple Unified Power Flow
Controllers, Ph.D dissertation, University of Missouri – Rolla, 2006.
26

II. An Improved Nonlinear STATCOM Control for Electric Arc Furnace Voltage
Flicker Mitigation
A. Yazdani, Student Member, IEEE, M. L. Crow, Senior Member, IEEE, and J. Guo, Member, IEEE
ABSTRACT: Electric arc furnaces (EAF) are prevalent in the steel industry to melt
iron and scrap steel. EAFs frequently cause large amplitude fluctuations of active and
reactive power and are the source of significant power quality disturbances. Static
Synchronous Compensators (STATCOMs) provide a power electronic-based means of
embedded control for reactive power support and power quality improvement. This
paper introduces a new nonlinear control for the STATCOM that provides significant
reduction in EAF-induced aperiodic oscillations on the power system. This method is
compared with traditional PI controls and shown to have improved performance.
Index Terms – STATCOM, nonlinear control, arc furnace flicker
I. INTRODUCTION
Electric arc furnaces (EAF) comprise a major portion of industrial loading on the bulk
power system. EAF flicker is induced by a low-frequency modulation (generally
between 5-35 Hz) of the voltage at the point of common coupling (PCC) with the system.
The authors are with the Electrical & Computer Engineering Department, Missouri University of Science & Technology, Rolla, MO 65409-0810.
27

This fluctuation in load leads to fast nonperiodic voltage variations with appreciable
voltage distortion. Customers who share the distribution feeder with these nonlinear loads
frequently experience significant voltage variations that produce disturbances in their
equipment operation. Typically a static VAr compensator (SVC) or static synchronous
compensator (STATCOM) are added to compensate the reactive power fluctuation [1]
-[3]. Analyses of EAF loads indicated that variation in active power is nearly as great
as the variation in reactive power and is a significant contributor to voltage flicker [4].
Therefore it is necessary to develop controls that can impact both active and reactive
power flows to mitigate electric arc furnace mitigations. The SVC cannot react rapidly
enough to counteract the rapidly varying flicker, therefore the STATCOM is an attractive
solution [5].
Recent work has investigated the use of multilevel-converter-based STATCOMs for arc
furnace flicker mitigation [6]-[7]. Multilevel converters are attractive due to the reduction
in harmonics and smaller sized components. In this paper, an eleven level cascaded
multilevel STATCOM with PWM control is introduced to compensate for a nonlinear
load that emulates an electric arc furnace. Most STATCOM control proposed for EAF
flicker mitigation have focused on the use of PI or PID linear control to provide the
reactive and active power compensation through current control [3]-[7]. Linear control
often provides adequate control, but can suffer from degradation in performance if the
operating conditions change or if multiple modes of oscillation are present.
One recent STATCOM control development was reported in [8]. In this approach, an
energy-based control law is designed to provide stability whereas an adaptive mechanism
is used to improve the robustness to parametric uncertainties. In this work, the authors
28

coordinated the generator excitation and the STATCOM for improved performance.
Although the authors used a simplified model of the STATCOM, they were able to acheive
an effective control law that provided significant oscillation damping., The primary
drawback with the proposed approach is that in some applications, such as electric arc
furnaces, the STATCOM may be located significantly distant from the generator such
that a coordinated generator/STATCOM control may not be realistic.
Another similar nonlinear STATCOM control developed specifically for fast load
regulation such as electric arc furnace applications is presented in [9]. In this paper,
the authors propose a nonlinear controller that is robust in the face of system variations.
The authors design a nonlinear control strategy that achieves asymptotic regulation of the
voltage magnitude while compensating for uncertainties in the load conductance. While
the goal of this control is different than that of the STATCOM for EAF flicker mitigation,
this paper provides several salient approaches that will be exploited. In particular, the
authors proposed a coordinate transformation that allows the development a stable control
strategy utilizing a novel Lyapunov function. While the proposed control is significantly
different, there are still several conceptual similarities between these two approaches. For
this reason, we propose a new nonlinear controller that provides improved performance
for flicker mitigation and power quality improvement for EAF applications. Specifically,
the contributions of this paper are
1) the development of a new nonlinear control for the STATCOM
2) the introduction of a new method to model EAF voltage flicker,
3) the application of the proposed control to mitigate EAF flicker, and
4) a comparison with a traditional PI control method.
29

II. A NEW NONLINEAR CONTROL FOR STATCOM
The STATCOM state equations are given by [10]
Ls
ωsid = −Rsid + Lsiq + k cos (α + θi)Vdc − Vi cos θi (1)
Ls
ωsiq = −Rsiq − Lsid + k sin (α + θi) Vdc − Vi sin θi (2)
Cdc
ωsVdc = −k cos (α + θi) id − k sin (α + θi) iq − 1
RdcVdc (3)
where id and iq are the dq-axis currents, Vdc is the voltage across the dc-link capacitor
Cdc, Ls is the leakage reactance of the transformer, Rs is a resistance that represents
the losses in the converter, and Vi � θi is the PCC voltage. The two STATCOM control
inputs are the voltage phase angle α and the modulation index k. These control inputs
are fed to the VSC to synthesize the appropriate injected current waveform with variable
magnitude and angle.
The STATCOM injected power is
Pinj = Vi (id cos θi + iq sin θi)
and the injected reactive power is
Qinj = Vi (id sin θi − iq cos θi)
The control objective for the STATCOM is to track a desired injected active power P �inj
and desired reactive power Q�inj such that the variations in load are localized behind the
PCC and do not propagate into the system. The active power injection P �inj is specified
to keep the line active power constant and to account for the STATCOM losses:
P �inj = P �
line − Pload +(i2d + i2q
)Rs +
1
RdcV 2
dc
The reactive power injection Q�inj is chosen such that the voltage magnitude at the control
bus is maintained constant. The desired injected powers are converted into desired currents
30

i�d and i�q through
⎡⎢⎢⎢⎣
i�d
i�q
⎤⎥⎥⎥⎦ =
⎡⎢⎢⎢⎣
cos θi sin θi
sin θi − cos θi
⎤⎥⎥⎥⎦−1 ⎡⎢⎢⎢⎣
P �inj/Vi
Q�inj/Vi
⎤⎥⎥⎥⎦ (4)
To track the target, new state variables ed and eq are defined such that
ed = i�d − id (5)
eq = i�q − iq (6)
leading to new state equations:
d
dted =
d
dti�d +
Rsωs
Lsi�d −
Rsωs
Lsed − ωii
�q + ωieq
−ωs
LsVdck cos (α + θi) +
ωs
LsVi cos θi (7)
d
dteq =
d
dti�q +
Rsωs
Ls
i�q −Rsωs
Ls
eq + ωii�d − ωied
−ωs
LsVdck sin (α + θi) +
ωs
LsVi sin θi (8)
Let control inputs be defined as
u1 = k cos α (9)
u2 = k sin α (10)
A positive definite Lyapunov function is given by
V =c
2e2
d +c
2e2
q, c > 0 (11)
The derivative of V is given by
V = p1u1 + p2u2 + p3 − cRsωs
Ls
(e2
d + e2q
)(12)
31

where
p1 = −cωs
Ls
Vdc (ed cos θi + eq sin θi)
p2 = cωs
LsVdc (ed sin θi − eq cos θi)
p3 = c
(ed
d
dti�d + eq
d
dti�q
)+ c
Rsωs
Ls
(edi
�d + eqi
�q
)
−cωi
(edi
�q − eqi
�d
)+ c
ωs
LsVi (ed cos θi + eq sin θi)
The derivative V is guaranteed to be negative if
p1u1 + p2u2 + p3 = −c1
(e2
d + e2q
), c1 > 0 (13)
Therefore, from Lyapunov’s second theorem on stability [11], this system is asymptoti-
cally stable in the sense of Lyapunov for bounded inputs u1 and u2.
Solving for u1 and u2 yields
⎡⎢⎢⎢⎣
u1
u2
⎤⎥⎥⎥⎦ = −C−1
⎛⎜⎜⎜⎝E + c1
⎡⎢⎢⎢⎣
ed
eq
⎤⎥⎥⎥⎦⎞⎟⎟⎟⎠ (14)
where
C = −ωsVdc
Ls
⎡⎢⎢⎢⎣
cos θi − sin θi
sin θi cos θi
⎤⎥⎥⎥⎦
E =
⎡⎢⎢⎢⎣
ωs
Ls(Rsi
�d + Vi cos θi) − ωii
�q + d
dti�d
ωs
Ls
(Rsi
�q + Vi sin θi
)+ ωii
�d + d
dti�q
⎤⎥⎥⎥⎦
Equations (9) and (10) can be solved for k and α from
k =√
u21 + u2
2 (15)
32

and
α =
⎧⎪⎪⎪⎪⎪⎪⎪⎪⎨⎪⎪⎪⎪⎪⎪⎪⎪⎩
tan−1 u1
u2u1 > 0
tan−1 u1
u2+ π u1 < 0
sin−1 u2
ku1 = 0
(16)
Both k and α are limited to bound the magnitude of the injected current and therefore
limit the injected active and reactive powers. In this control, only the parameter c1 must
be tuned.
���
������
�
�
�
�� �� ��
����
�����
�����
��
�
�
����
�����
������������ ��
� �!���� ����"��#$
� �!���� ���%��#$
������
�������&���
�
��'!�
��
Fig. 1. PI Control
This control is compared against the traditional PI controller shown in Figure 1. The
primary control targets of a STATCOM are to control the PCC RMS line voltage (Vstat)
and the active power flow on the line. The AC voltage control is achieved by filtering
out the second harmonic and the low frequencies of the AC voltage and then a lead-lag
and a PI controller are applied to the DC voltage error in order to obtain the modulation
phase shift α. The DC capacitor voltage error is put through a PI controller to provide
the modulation index gain k.
One significant difference between the two controllers is the choice of parameters. The
proposed control only requires one paramater (c1) that is simply chosen to be large and
positive. The PI controller requires four separate parameters (two proportional gains and
33

two integral gains) that must be tuned at a specific operating point. If the operating point
changes significantly, these parameters must be retuned for optimal results.
III. THE TEST SYSTEM
The single line diagram of the electrical distribution system feeding an arc furnace
is shown in Figure 2. The electrical network consists of a 115 kV generator and
an impedance that is equivalent to that of a large network at the point of common
coupling (PCC). The STATCOM is connected to the system through a 115/25 kV Y-Delta
transformer. The electrical arc furnace load is non-sinusoidal, and randomly fluctuating.
(����)����� �**
+,(,*-.
/0)�1���� �������+2� �3
Fig. 2. Test System
A. Arc Furnace Flicker Signal Generation
Electric arc furnaces are typically used to melt steel and will produce current harmonics
that are random. In addition to integer harmonics, arc furnace currents are rich in inter-
harmonics [12]. The flicker waveform has subsynchronous variations in the 5-35Hz
range [4]. To synthesize the variations to the RMS waveform, an aperiodic waveform
is generated by
R(t) = R0 + aL cos (ωLt + θL) + aH cos (ωHt + θH) Ω (17)
34

where ωL and ωH are randomly generated frequencies in the range of interest and aL and
aH are randomly generated positive scalars. At each zero crossing, a new set of parameters
[aL ωL aH ωH ] is generated. The phase angles θL and θH are then calculated such that
the waveform is continuous across the zero crossings.
For arc furnace applications, the low frequency component ωL should be centered about
a frequency in the 5-35Hz range. The high frequency component ωH should be centered
about an odd integer multiple of ωL. For example, one such generated flicker waveform
can be produced from the following parameters:
ωL = 2π (1 + ρ8) where ρ ∈ [0, 1] is a random number
ωH = 2π (10 + ρ30)
aL = 50ρ
aH = 10ρ
R0 = 130 Ω (phase a, b) R0 = 80 Ω (phase c)
A three-phase set of resistive loads generated by equation (17) are shown in Figure 3.
Note that each phase contains considerable variance and multiple modal content. This
is consistent with the analysis of arc furnace load characteristics given in [13] which
indicate that imbalance and randomness exist in each phase independently. The harmonic
spectrum of the phases is shown in Figure 4. The waveform is aperiodic, but as expected,
the frequency spectrum shows a primary concentration around 8 Hz with a high frequency
concentration around 30 Hz with a much wider spread in harmonics.
This generated signal can be compared to an actual EAF 230kV RMS flicker shown
in Figure 5. While the signal generator given in equation (17) incorporates a random
35

0 0.2 0.4 0.6 0.8 1 1.2 1.4 1.6 1.820
40
60
80
100
120
140
160
180
200
time (seconds)
load
res
ista
nce
Fig. 3. EAF flicker waveform
0 10 20 30 40 50 600
0.2
0.4
0.6
0.8
1
1.2
1.4
1.6
1.8
2x 10
5
frequency spectrum
Fig. 4. EAF flicker frequency spectrum
component and cannot exactly reproduce actual signals, the qualitative behaviors are
very similar between the generated flicker and the actual flicker of Figure 5. These
results are also consistent with other proposed chaos-based models [14]. Therefore the
proposed signal generator will be used to produce the EAF flicker on which to test the
new control.
The phase voltages at the PCC are shown in Fig. 6. Note that the voltages are
considerably unbalanced as a result of the load imbalance.
36

4.54.03.53.0 5.0
0.30
0.25
0.20
0.15
0.10
0.05
0.00
Time (s)
RM
S fl
icke
r Fig. 5. Actual RMS EAF flicker waveform
12 12.01 12.02 12.03 12.04 12.05
−100
−80
−60
−40
−20
0
20
40
60
80
100
time (seconds)
PC
C v
olta
ge
Fig. 6. Phase voltages at the PCC - no control
B. The STATCOM
The configuration of the STATCOM is shown in Figure 7 [15]. A cascaded multilevel
STATCOM contains several H-bridges in series to synthesize a staircase waveform. The
inverter legs are identical and are therefore modular. In the eleven-level STATCOM, each
leg has five H-bridges. Since each full bridge generates three different level voltages
(V, 0,−V ) under different switching states, the number of output voltage levels will be
eleven. A multilevel configuration is used because it offers several advantages over other
converter types [15]:
1) It is better suited for high-voltage, high-power applications than the conventional
37

/� � (�
/� � 4�
/� � *�
/�
�*
�/
��(
�/
��4
�,
(�
",
(�
�
,(
�5
,(
�6
,*
�5
,*
��
,*
�"
,*
�6
,4
��
,4
�5
,4
�"
,4
�6
/�
�*
"
,*
"5
,*
"�
,*
""
,*
"6
/�
�4
",
4"
�
,4
"5
,4
""
,4
"6
/�
�(
",
("
",
("
�
,(
"5
,(
"6
/�
�(
6,
(6
",
(6
�
,(
65
,(
66
/�
�4
6,
46
�
,4
65
,4
6"
,4
66
/�
�*
6
,*
65
,*
6�
,*
6"
,*
66
/�
�(
5,
(5
",
(5
�
,(
55
,(
56
/�
�(
�,
(�
",
(�
�
,(
�5
,(
�6
/�
�4
5,
45
�
,4
55
,4
5"
,4
56
/�
�4
�,
4�
�
,4
�5
,4
�"
,4
�6
/�
�*
5
,*
55
,*
5�
,*
5"
,*
56
/�
�*
�
,*
�5
,*
��
,*
�"
,*
�6
�����7μ�8
�����7μ�8�����7μ�8�����7μ�8�����7μ�8
�����7μ�8�����7μ�8�����7μ�8�����7μ�8�����7μ�8
�����7μ�8 �����7μ�8�����7μ�8 �����7μ�8
�����7μ�8
Fig. 7. Eleven level cascaded multilevel STATCOM
converters since the currents and voltages across the individual switching devices
are smaller,
2) It generates a multistep staircase voltage waveform approaching a more sinusoidal
output voltage by increasing the number of levels, and
3) It has better DC voltage balancing, since each bridge has its own DC source.
To achieve a high quality output voltage waveform, the voltages across all of the DC
capacitors should maintain a constant value. However, the randomly varying load causes
the DC capacitors to charge and discharge unevenly leading to different voltages in each
leg of each phase. However, because of redundancy in switching states, there is frequently
more than one state that can synthesize any given voltage level. Therefore, there exists a
“best” state among all the possible states that produces the most balanced voltages [16].
Since there are multiple possible switching states that can be used to synthesize a given
voltage level, the particular switching topology is chosen such that the capacitors with
the lowest voltages are charged or conversely, the capacitors with the highest voltages
are discharged.
38

The test system is simulated using the software platform PSCAD. PSCAD provides
the ability to fully model all three phases of the system down to the component level
of the multi-level STATCOM. This level of detail is required to study the affects of the
electric arc furnace load on harmonics, load imbalance, and flicker. These effects cannot
be fully represented in a system level simulation package. One drawback of this level of
system simulation however, is that it is difficult to perform large-scale system studies.
IV. PROPOSED CONTROL EFFECTIVENESS
The effectiveness of the controls presented earlier is assessed using several quantitative
assessments. The controllers are compared and contrasted for their performance in:
• maintaining the RMS voltage and line active power
• voltage balancing between phases
• reduction of total harmonic distortion (THD), and
• flicker mitigation
A. RMS Voltage and Line Active Power
Figure 8 shows the RMS value of VPCC with the unbalanced varying arc furnace
load. The uncontrolled voltage magnitude varies randomly and often with greater than
5% variation. Note that both the linear and nonlinear controllers improve the RMS
voltage considerably, but the nonlinear controller shows better performance than the
linear controller and is better able to control it to the specified reference voltage (0.9
pu). With the linear control there are fluctuations that are in a tolerable range, but with
the nonlinear control a nearly constant voltage magnitude is obtained.
39

3 4 5 6 7 8 9 100.82
0.84
0.86
0.88
0.9
0.92
0.94
time (seconds)
VP
CC
(pu
)
no control
PI controlproposed control
Fig. 8. RMS voltage for test system
Figure 9 shows the active power load and the line active power for the PI and proposed
control. Note that in addition to maintaining the bus voltage magnitude to a constant value,
the STATCOM is also required to compensate for the variations in load such that the
line active power from the system is constant. Even though the load varies randomly and
with large variations, the STATCOM is able to effectively charge and discharge the dc
link capacitors to compensate so that the system sees a nearly constant load.
B. Voltage Balancing
Numerous control approaches have been introduced to mitigate voltage unbalance in
STATCOM applications. Voltage imbalance, if not controlled, can significantly affect the
STATCOM’s ability to provide reactive power compensation and voltage control at the
PCC. IEC standards require that the steady-state voltage imbalance must remain below
2% [17]. For unbalanced loads, the main problems that exist are harmonic generation on
the dc side and consequent generation of low-frequency harmonics on the ac side [18].
It will be shown that neither of these problems exist in the proposed system and control.
40

3 4 5 6 7 8 9 1060
65
70
75
80
time (seconds)
P lin
e (MW
)
3 4 5 6 7 8 9 1060
65
70
75
80
time (seconds)
P lin
e (MW
)
3 4 5 6 7 8 9 1060
65
70
75
80
time (seconds)
P lin
e (MW
)(a) Active power drawn by load
(b) line active power with STATCOM PI control
(c) line active power with proposed control
Fig. 9. Load and Line active powers for test system
The use of a multi-level converter, redundant state selection, and the proposed control
can effectively mitigate any reasonable level of voltage imbalance.
Recall from Fig. 6 that the EAF load caused considerable unbalance and harmonic
41

content in the PCC voltage. The uncontrolled voltages exhibit a phase imbalance of over
20% with the difference in peak-peak voltage between phases of nearly 20kV. Fig. 10
shows the PCC voltage with both PI control (top) and the proposed nonlinear control
(bottom). The imbalance in the PI control phase voltages is reduced to 5%. The phase
imbalance in the proposed control case is 2% which is within the specified standard.
12.0 12.01 12.02 12.03 12.04−100
−50
0
50
100PI control
PC
C v
olta
ge
12.0 12.01 12.02 12.03 12.04 12.05−100
−50
0
50
100Proposed control
time (seconds)
PC
C v
olta
ge
Fig. 10. Phase voltages at the PCC; PI control - top, proposed control - bottom
3 4 5 6 7 8 9 100
0.01
0.02
0.03
0.04
0.05
TH
D
3 4 5 6 7 8 9 100
0.01
0.02
0.03
0.04
0.05
time (seconds)
TH
D
PI control
proposed control
Fig. 11. THD of PCC voltage (phase a)
42

#�&!'����4) ����� !�
-����9�
���'����4) ����� !�
-����9%�
:���"$��������
�"
:�"
�
:�;
��<�=�
-�����9�"
<�=
>"���'����
4) ����� !�-����9�
>"?
?��5�5"
�.
+
�
�
������
���,
��
%%�6@�6 �
)�
2�
Fig. 12. Flicker measure of PCC voltage (phase a)
C. Total Harmonic Distortion (THD)
The total harmonic distortion of the system with the STATCOM under both two controls
are shown in Fig. 11. The THD has been calculated using the THD module in PSCAD.
For generality, only phase a is shown in the figure, but phases b and c are qualitatively
similar although quantitatively different. Note that the mean THD for the PI control is
0.0125 and the maximum is 0.039. For the proposed control, the mean THD is 0.018
and the maximum is 0.023. Note that although the mean THD is similar for the PI
and proposed controls, the maximum THD for the PI control is nearly twice that of the
proposed control.
D. Flicker Mitigation
Voltage flicker is typically considered to be random variations in voltage that can
by detected by the naked eye at a level to cause discomfort. The primary sources
of flicker are industrial loads, usually arc furnaces, rolling mills, welding, and other
manufacturing processes. To measure flicker, a flickermeter is typically comprised of a
squaring demodulator to model the response of the lamp to supply voltage variation,
a weighting filter to model perception ability of the human eye, and a squaring and
first order filter to model the memory tendency of the human brain. The IEC 1000-4-15
43

standard provides the specifics of a measurement approach for flicker [19]. The following
transfer function
H(s) = G2ω0
1 + 2z sω0
+ s2
ω20
(18)
is provided as a reasonable model for human eye. The coefficients are given by the IEC
for 230V, 60 W incandescent lamps. The flicker meter proposed in [20] and shown in
Fig. 12 is used to measure the flicker in the PCC voltage.
The flicker content of the PCC voltages are shown in Fig. 13. Note that the case of no
control and the PI control have nearly the same qualitative content of flicker, whereas the
proposed control is significantly lower. In fact, for most of the time interval, the proposed
control reduced the flicker contect by nearly a full order of magnitude from the case of
no control.
3 4 5 6 7 8 9 100
1
2x 10
4 No control
3 4 5 6 7 8 9 100
1
2x 10
4 PI control
3 4 5 6 7 8 9 100
1
2x 10
4 Proposed control
time (seconds)
Fig. 13. Flicker measure of PCC voltage (phase a)
V. CONCLUSIONS
In this paper, a multi-level STATCOM is used to mitigate voltage flicker induced by
an electric arc furnace. The applied load is randomly fluctuating and unbalanced. A
44

novel nonlinear control is proposed to provide improved control for RMS voltage and
line active power control. In addition, the traditional PI control is compared against the
proposed control in reducing total harmonic content, flicker, and phase imbalance. In all
cases, the proposed control produced similar or improved results when compared with
the PI control. One additional advantage of the proposed control is that only one control
parameter is required whereas the PI control requires four parameters to be tuned.
ACKNOWLEDGMENTS
This work was supported in part by a grant from the National Science Foundation under
ECCS 0701643.
REFERENCES
[1] C. Schauder, “STATCOM for compensation of large electric arc furnace installations,”
Proceedings of the 1999 Power Engineering Society Summer Meeting, vol. 2, 1999.
[2] P. Ladoux, G. Postiglione, H. Foch and J. Nuns, “A Comparative study of AC/DC
converters for high-power DC arc furnace,” IEEE Transactions on Industrial Electron-
ics, vol. 52, no. 3, June 2005.
[3] Y. F. Wang, J. G. Jiang, L. S. Ge, and X. J. Yang, “Mitigation of electric arc furnace
voltage flicker using static synchronous compensator,” IEEE Power Electronics and
Motion Control Conference, vol. 3, pp. 1-5, August 2006.
[4] J-L Guan, J-C Gu, C-J Wu, “A Novel method for estimating voltage flicker,” IEEE
Transactions on Power Delivery, vol. 20, no. 1, January 2005.
45

[5] A. Garcia-Cerrada, P. Garcia-Gonzalez, R. Collantes, T. Gomez, and J. Anzola, “Com-
parison of thyristor-controlled reactors and voltage-source inverters for compensation
of flicker caused by arc furnaces,” IEEE Transactions on Power Delivery, vol. 15, no.
4, pp. 1225-1231, October 2000.
[6] C. Han, Z. Yang, B. Chen, A. Huang, B. Zhang, M. Ingram, A-A Edris, “Evaluation
of cascade-multilevel-converter-based STATCOM for arc furnace flicker mitigation,”
IEEE Transactions on Industry Applications, vol. 43, no. 2, March/April 2007.
[7] P. Lauttamus and H. Tuusa, “Simulated electric arc furnace voltage flicker mitigation
with 3-level current-controlled STATCOM,” IEEE Applied Power Electronics Confer-
ence and Exposition, pp. 1697 - 1703, Feb. 2008.
[8] Q. J. Liu, Y. Z. Sun, T. L. Shen and Y. H. Song, “Adaptive nonlinear co-ordinated
excitation and STATCOM controller based on Hamiltonian structure for multimachine-
power-system stability enhancement,” IEE Proceedings - Control Theory Applications,
vol. 150, no. 3, May 2003.
[9] A. Jain, A. Behal, X. Zhang, D. Dawson, and N. Mohan, “Nonlinear controllers for
fast voltage regulation using STATCOMs”, IEEE Transactions on Control Systems
Technology, vol. 12, no. 6, November 2004.
[10] C. Schauder and H. Mehta, “Vector analysis and control of advanced static VAr
compensators,” IEE Proceedings C, vol. 140, no. 4, 1993.
[11] H. K. Khalil, Nonlinear Systems, Prentice-Hall, Upper Saddle River, New Jersey,
2002.
46

[12] Task Force on Harmonics Modeling and Simulation, “Modeling devices with
nonlinear voltage-current characteristics for harmonic studies,” IEEE Transactions on
Power Delivery, vol. 19, no. 4, October 2004.
[13] T-H Fu and C-J Wu, “Load characteristics analysis of ac and dc arc furnaces using
various power definitions and statistic method,” IEEE Trans. on Power Delivery, vol.
17, no. 4, October 2002.
[14] G. Carpinelli, F. Iacovone, A. Russo, P. Varilone, “Chaos-based modeling of DC
arc furnaces for power quality issues,” IEEE Trans on Power Delivery, vol. 19, no. 4,
October 2004.
[15] F. Z. Peng, J. S. Lai, W. Mckeever, J. Vancoevering, “A Multilevel voltage source
inverter with separate DC sources for static var generation,” IEEE Trans. on Industry
Applications, vol. 32, no. 5, Sept. 1996.
[16] K. A. Corzine, M. W. Wielebski, F. Z. Peng, and J. Wang, “Control of cascaded
multilevel inverters,” IEEE Trans. On Power Electronics, vol. 19, no. 3, May 2004.
[17] K. Li, Z. Wang, B. Wei, “Strategies and operating point optimization of STATCOM
control for voltage unbalance mitigation in three-phase, three-wire systems,” IEEE
Trans. on Power Delivery, vol. 22, no. 1, January 2007.
[18] B. Blazic and I. Papic, “Improved D-StatCom control for operation with unbalanced
currents and voltages,” IEEE Trans. on Power Delivery, vol. 21, no. 1, January 2006.
[19] S. Mark Halpin, R. Bergeron, T. Blooming, R. Burch, L. Conrad, and T. Key,
“Voltage and lamp flicker issues: Should the IEEE adopt the IEC approach?”, Report
of the IEEE Power Engineering Society Flicker Task Force - P1453, 2004.
47

[20] R. Mienski, R. Pawelek and I. Wasiak, “Shunt compensation for power quality
improvement using a STATCOM controller: Modelling and Simulation,” IEE Proc.-
Gener. Transm. Distrib., vol. 151, no. 2, March 2004.
48

III. Fault Detection and Mitigation in Multilevel Converter STATCOMs
A. Yazdani, Student Member, IEEE, M. L. Crow, Senior Member, IEEE
ABSTRACT: Many STATCOMs utilize multilevel converters due to lower harmonic
injection into the power system, decreased stress on the electronic components due to
decreased voltages, and lower switching losses. One disadvantage, however, is the
increased likelihood of a switch failure due to the increased number of switches in a
multilevel converter. A single switch failure, however, does not necessarily force an
(2n+1)-level STATCOM off-line. Even with a reduced number of switches, a
STATCOM can still provide a significant range of control by removing the module of the
faulted switch and continuing with (2n-1) levels. This paper introduces an approach to
detect the existance of the faulted switch; identify which switch is faulty; and reconfigure
the STATCOM. This approach is illustrated on an 11-level STATCOM and the effect on
dynamic performance and the total harmonic distortion (THD) is analyzed.
Index Terms – STATCOM, multilevel converter, total harmonic distortion
I. INTRODUCTION
There are several compelling reasons to consider a multilevel converter topology for the
STATCOM. These well known reasons include lower harmonic injection into the power
system, decreased stress on the electronic components due to decreased voltages, and
The authors are with the Electrical & Computer Engineering Department, Missouri University of Science & Technology, Rolla, MO 65409-0810.
49

lower switching losses. Various multilevel converters also readily lend themselves to a
variety of PWM strategies to improve efficiency and control. An eleven-level cascaded
multilevel STATCOM is shown in Fig. 1. This converter uses several full bridges in
series to synthesize staircase waveforms. Because every full bridge can have three output
voltages with different switching combinations, the number of output voltage levels is
2n + 1 where n is the number of full bridges in every phase. The converter cells are
identical and therefore modular.
As increasingly higher level converters are used for high output rating power applica-
tions, a large number of power switching devices will be used. Each of these devices
is a potential failure point. Therefore it is important to design a sophisticated control
to produce a fault-tolerant STATCOM. A faulty power cell in a cascaded H-Bridge
STATCOM can potentially cause switch modules to explode [1] leading to fault conditions
such as a short circuit or an overvoltage on the power system resulting in expensive
down time [2]. Subsequently, it is crucial to identify the existence of any fault and also
to determine the location of the fault for it to be removed. Several recent works have
focused on this aspect of multilevel converters.
�������
�������
������
�
�
��
�
��
�
��
��
��
�
��
�
��
��
��
��
�
��
�
��
�
�
�
��
��
��
��
��
��
�
��
��
�
�
�
�
�
�
�
�
�
�
��
�
�
�
��
�
��
��
�
�
��
�
�
�
�
�
��
�
��
�
�
��
��
��
�
��
�
��
��
��
��
�
��
��
��
�
��
��
��
�
��
��
�
�
�
�
��
�
��
�
�
�
��
�
��
��
��
�
��
�
��
��
��
��
�
��
��
��
�
��
�
��
��
��
��
�
��
��
��
�
��
��
��
�
��
��
�
��
��
��
�
��
��
��
�
��
��
�
�
�
�
��
�
��
�
�
�
��
�
�
�
�
��
�
��
�
�
�
��
�������
����������������������������
�����������������������������������
������� �������������� �������
�������
Fig. 1. Eleven level cascaded multilevel STATCOM
50

Many fault detection methods have been proposed over the last few years [1]-[5].
Resistor sensing, current transformation, and VCE sensing are some of the more common
approaches. For example, a method based on the output current behavior is used to
identify IGBT short-circuits [3]. The primary drawback with the proposed approach is that
the fault detection time depends on the time constant of the load. Therefore for loads with
a large RL time constant, the faulty power cell can go undetected for numerous cycles,
potentially leading to disasterous results. Another fault detection approach proposed in [4],
is based on a switching frequency analysis of the output phase voltage. This method was
applied to flying capacitor converters and has not been extended to cascaded converters.
In [5], sensors are used to measure each IGBT current and to initiate forced switching
if a fault is detected.
In this paper, the method we propose requires only that the output DC link voltage of
each phase be measured. This measurement is typically accomplished anyway for control
purposes. If a fault is detected, the module in which the fault occurred is then isolated and
removed from service. This approach is consistent with the modular design of cascaded
converters in which the cells are designed to be interchangeable and rapidly removed and
replaced. Until the module is replaced, the multilevel STATCOM continues to operate
with slightly decreased, but still acceptable, performance.
In summary, the proposed approach offers the following advantages:
• no additional sensing requirements,
• additional hardware is limited to one bypass switch per module,
• is consistent with the modular approach of cascaded multilevel converters, and
• the dynamic performance and THD of the STATCOM is not significantly impacted
51

0 0.002 0.004 0.006 0.008 0.01 0.012 0.014 0.016−1
−0.5
0
0.5
1
(a)
0 0.002 0.004 0.006 0.008 0.01 0.012 0.014 0.016−1
−0.5
0
0.5
1
time (seconds)(b)
Fig. 2. (a) Carrier and reference waveform for PSPWM (b) Output waveform
II. THE MULTILEVEL STATCOM
A cascaded multilevel STATCOM contains several H-bridges in series to synthesize
a staircase waveform. The inverter legs are identical and are therefore modular. In the
eleven-level STATCOM, each leg has five H-bridges. Since each full bridge generates
three different level voltages (V, 0,−V ) under different switching states, the number of
output voltage levels will be eleven. A multilevel configuration offers several advantages
over other converter types [6]:
1) It is better suited for high-voltage, high-power applications than the conventional
converters since the currents and voltages across the individual switching devices
are smaller,
2) It generates a multistep staircase voltage waveform approaching a more sinusoidal
output voltage by increasing the number of levels, and
3) It has better DC voltage balancing, since each bridge has its own DC source.
To achieve a high quality output voltage waveform, the voltages across all of the DC
capacitors should maintain a constant value. However, variations in load cause the DC
52

capacitors to charge and discharge unevenly leading to different voltages in each leg
of each phase. However, because of redundancy in switching states, there is frequently
more than one state that can synthesize any given voltage level. Therefore, there exists a
“best” state among all the possible states that produces the most balanced voltages [7].
Since there are multiple possible switching states that can be used to synthesize a given
voltage level, the particular switching topology is chosen such that the capacitors with
the lowest voltages are charged or conversely, the capacitors with the highest voltages
are discharged. This redundant state selection approach is used to maintain the total DC
link voltage to a near constant value and each individual cell capacitor within a tight
bound.
Different pulse width modulation (PWM) techniques have been used to obtain the
multilevel converter output voltage. One common PWM approach is the phase shift PWM
(PSPWM) switching concept [8]. The PSPWM strategy causes cancellation of all carrier
and associated sideband harmonics up to the (N − 1)th carrier group for an N-level
converter. Each carrier signal is phase shifted by
Δφ =2π
n
where n is the number of cells in each phase. Fig. 2 illustrates the carrier and reference
waveforms for a phase leg of the 11-level STATCOM. In this figure, the carrier frequency
has been decreased for better clarity. Normally the carrier frequency for PWM is in the
range of 1-10 kHz.
III. FAULT ANALYSIS FOR THE MULTILEVEL STATCOM
A converter cell block as shown in Fig. 3 can experience several types of faults. Each
53

switch in the cell can fail in an open or closed state. The closed state is the most severe
failure since it may lead to shoot through and short circuit the entire cell. An open circuit
can be avoided by using a proper gate circuit to control the gate current of the switch
during the failure [9]. If a short circuit failure occurs, the capacitors will rapidly discharge
through the conducting switch pair if no protective action is taken. Hence the counterpart
switch to the failed switch must be quickly turned off to avoid system collapse due to a
sharp current surge.
��
��
�
���
��
�
��
��
��
��
��
Fig. 3. Cell wit h fault switch
The staircase voltage waveform shown in Figure 2 is synthesized by combining the
voltages of the various cells into the desired level of output voltage. At the middle levels
of the voltage waveform, due to switching state redundancy, there are more than one
set of switching combinations that may be used to construct the desired voltage level.
Therefore by varying the switching patterns, the loss of any individual cell will not
signifantly impact the middle voltages of the output voltage. However, the peak voltages
require that all cells contribute to the voltage; therefore the short circuit failure of any
one cell will lead to the loss of the first and (2n+1) output levels and cause degradation
54

Eout, a
�
�
Eout, b
�
�
Eout, c
�
�
A1 A2 A3 A4 A5
B1 B2 B3 B4 B5
C1 C2 C3 C4 C5
- Vdc,1+ - Vdc,2+ - Vdc,3+ - Vdc,4+ - Vdc,5+
Fig. 4. Simplified eleven level cascaded multilevel STATCOM
in the ability of the STATCOM to produce the full output voltage level.
Consider the simplified 11-level converter shown in Fig. 4. The process for identifying
and removing the faulty cell block is summarized in Fig. 5. The input to the detection
algorithm is the filtered Eout for each phase. Although Eout is a DC voltage, it contains
high-frequency ripple and sensor noise. It is passed through a low pass filter to extract
the average Eout value for each phase. The average DC voltage Eout is then compared
against V ′dc. The voltage V ′
dc is chosen to be less than the reference value, Vdc,ref . The
average DC link voltage will naturally vary with changes in the system, therefore it is
prudent to have a “deadband” in the reference voltage levels. If there is a faulted module,
the steady-state DC link voltage will be the voltage associated with 2(n− 1) + 1 levels.
In an 11-level converter, the faulted DC voltage will decrease by 20%. Therefore a good
choice for V ′dc is 0.85Vdc,ref .
If Eout < V ′dc, then a fault has most likely occurred. The next step is to then determine
which block is faulty so that it may be removed. By utilizing the switching signals in each
converter cell, (i.e. Aj1 and Aj2), it is possible to calculate all of the possible voltages that
can be produced at any given instant. When there is a fault in the multilevel converter,
the capacitor at the faulty block will rapidly discharge. This discharge results in a phase
55

shift in the output AC voltage as well as a change in amplitude of voltage. The set of
all possible phase a fault voltages for an 11-level converter is given by:
����������� �!"
Eout < Vdc ?
Eout
�� �# ��!��f1, f2, f3, f4, f5
�� �# ��!��x1, x2, x3, x4, x5
T $�%�&'�����������������������(x1, x2, x3, x4, x5
T = x1)�
�"�g1 = 1)
T = x4)�
�"�g4 = 1)
T = x2)�
�"�g2 = 1)
T = x5)�
�"�g5 = 1)
T = x3)�
�"�g3 = 1)
Eout
*!� *!� *!� *!� *!�
g1=1 g4=1 g2=1 g5=1 g3=1
$���%!�! �*
&�
+
+ &�������&
&�
+&�
+
&�
+
&�
+
&�
+
Fig. 5. Flow chart
��#��
,-,����������#��!"�"�.�/"!"$�
��-�
�%��"0����"
�%��"0����"
�%��"0����"
�%��"0����"
�%��"0����"
-
-�
-�
-�
�+
�� ��
1! �*��
Fig. 6. Proposed fault detection and remediation control for cell 1
fi = Vdc0
n∑j=1
j �=i
(Aj1 − Aj2) i = 1, . . . , n (1)
56

where Vdc0 is the ideal voltage across a single cell block. During a fault, only the fi
corresponding to the faulted cell will be low. Therefore, if
xi = |Eout − fi| i = 1, . . . , n (2)
then the smallest xi indicates the location of the faulted block. The last step is to actuate
the module bypass switch gi shown in Fig. 3. A slight time delay is added to the logic to
neglect for momentary spikes that may occur in response to system faults. It is desirable to
neglect momentary sags in the DC link voltage, but respond to sags of increased duration
that indicate a faulted module. Fig. 6 shows the realization logic for the proposed fault
detection and module removal method.
IV. EXAMPLE AND RESULTS
The single line diagram of the electrical distribution system feeding an arc furnace
is shown in Figure 7. The electrical network consists of a 115 kV generator and an
impedance that is equivalent to that of a large network at the point of common coupling
(PCC). The STATCOM is connected to the system through a Y-Delta transformer.
The electrical arc furnace load is non-sinusoidal, unbalanced, and randomly fluctuating.
Electric arc furnaces are typically used to melt steel and will produce current harmonics
that are random. In addition to integer harmonics, arc furnace currents are rich in inter-
harmonics [10]. The flicker waveform has subsynchronous variations in the 5-35Hz range
[11]. Fig. 8 shows the active power drawn by the arc furnace. Note that the STATCOM
is able to improve the line active power such that arc furnace variations do not propagate
throughout the system as shown in Fig, 9.
57

A. Dynamic Performance
To test the proposed fault detection and mitigation approach, a faulty switch was
initiated at 2.5 seconds. Within 300ms, the fault has been detected, the module removed,
and the STATCOM restored to steady-state operation. The STATCOM bus voltage and
line active powers are shown before the fault, during, and after the faulty module is
removed. Note that both the bus voltage and line active power are adversely affected
during the fault. In both cases, the high-frequency oscillations are increased. Once the
faulty module is removed, the system returns to its pre-fault behavior. There is a small
induced low-frequency oscillation that can be observed in the line active power, but this
is rapidly damped by the STATCOM’s control.
The average DC link voltage before, during, and after the fault is shown in Fig. 12.
During the fault, the DC voltage drops rapidly as the faulted module capacitor discharges.
When the faulty module is removed, the average DC voltage drops to roughly 80% of
the initial voltage, as expected. The continued variation in the DC link voltage is due to
the continual variation of the arc furnace load that is STATCOM is compensating and is
normal.
Fig. 13 shows two cycles of the STATCOM multilevel voltage output. There are several
�"���#"&��! 2
3���/4
�5#�6� !&��2��!"�3*��!%
Fig. 7. Test system
58

3 4 5 6 7 8 9 1060
65
70
75
80
time (seconds)
Plo
ad (
MW
)
Fig. 8. Active power drawn by arc furnace load
3 4 5 6 7 8 9 1060
65
70
75
80
time (seconds)
Plin
e (M
W)
Fig. 9. Line active power
important aspects of this output waveform that have been highlighted. First, note the
voltage collapse of the first level due to the faulted cell. This collapse in voltage will
occur at the level that corresponds to the faulty cell. It is not possible to directly correlate
the level number with the cell number (i.e. a collapse in level four does not necessarily
indicate a fault in cell 4) because of the redundant state selection scheme that is used to
balance the capacitor voltages.
59

2.3 2.4 2.5 2.6 2.7 2.8 2.9 30.95
1.0
1.05
time (seconds)
ST
AT
CO
M b
us v
olta
ge
(p
u)
Fig. 10. STATCOM voltage before, during, and after fault
2.3 2.4 2.5 2.6 2.7 2.8 2.9 368
70
72
74
76
78
80
82
84
time (seconds0
Lin
e a
ctive p
ow
er
Fig.11. Line active power before, during, and after fault
A further aspect of note is the increase in length of the top level duration. This is due
to the increase in the modulation gain k due to the decrease in DC link voltage. Since
the STATCOM output voltage is directly proportional to
Vstat = kVdc cos α
where k is the modulation gain and α is the phase angle. If Vdc decreases by 20%, then k
60

2.5 3 3.5 4 4.5 514.5
15
15.5
16
16.5
17
17.5
18
18.5
19
time (seconds)
Vd
c (
kV
)
block removed
fault occurs
Fig. 12. DC voltage before, during, and after fault
0.09 0.095 0.1 0.105 0.11 0.115 0.12 0.125 0.13−100
−80
−60
−40
−20
0
20
40
60
80
100
time (seconds)
Vd
c
faulted switchvoltage collapse
impact of increasedmodulation gain
Fig. 13. Converter output with faulted cell
must increase by 20% to compensate. An increase of this magnitude in modulation gain
takes the PWM into over-modulation where the magnitude of the reference waveform
exceeds the magnitude of the carrier. This results in an increased length of time at
higher voltage levels. Over-modulation may also result in the increase of lower frequency
harmonics. The modulation gain k is shown in Fig. 14.
The individual module capacitor voltages in each phase for a faulty a phase switch are
61

2.5 3 3.5 4 4.5 50.8
0.9
1
1.1
1.2
1.3
1.4
1.5
time (seconds)
modula
tion g
ain
k
faulted cell removed
fault occurs
Fig. 14. Modulation gain k before, during, and after fault
shown in Fig. 15. Note that the faulted module voltage decays rapidly at 2.5 seconds
(when the fault was applied). The remaining capacitor voltages in phase a show significant
“chopping” as the redundant state selection approach rapidly alternates between modules
to maintain the average DC link voltage. A crowbar circuit is used with each module
to limit the maximum DC voltage, leading to the chopping behavior. Phase b shows a
continual decline in all of the capacitor voltages until the corresponding faulty module
is removed at 2.8 seconds. The capacitor voltages increase until they are in the nominal
range and then exhibit similar “chopping” until they are regulated. Phase c does not
exhibit chopping because all of the individual cell voltages are of similar magnitude and
do not exceed the crowbar maximum.
B. THD Performance
A harmonic analysis has been performed on the output voltage at the point of common
coupling. One of the primary reasons for using a multilevel converter is the reduction
in harmonic content in the output waveform. Fig. 16 shows the total harmonic distortion
62

2.4 2.5 2.6 2.7 2.8 2.9 3.0 3.1 3.2 3.3 3.417
18
19
20
Vdc (
Phase a
)
2.4 2.5 2.6 2.7 2.8 2.9 3.0 3.1 3.2 3.3 3.415
16
17
18
19
20
Vdc (
Phase b
)
2.4 2.5 2.6 2.7 2.8 2.9 3.0 3.1 3.2 3.3 3.417
18
19
20
time (seconds)
Vdc (
Phase c
)
Fig. 15. Individual module capacitor voltages before, during, and after fault
levels at the STATCOM PCC before, during, and after the fault. Since this is measured
at the PCC, the output waveform has already been filtered to remove high frequency
components. Before the fault, the THD level is less than 1% which is quite good. During
the fault, the THD increase significantly to over 5% which is unacceptably high. When
the fault is removed, the THD decreases and settles at approximately 2.5% which is in
the acceptable range for a 115 kV system [12]. Therefore the loss of one of the cells
does not necessitate the immediate removal of the STATCOM from service.
The increase in THD after removing the faulty cell is due to several reasons. Firstly,
the STATCOM filters were tuned to the resonant frequencies associtated with the 11-
level converter and are not as effective when the converter topology changes to a 9-level.
Secondly, the over modulation required for the 9-level converter increases the content
of the lower frequency harmonics. This effect is illustrated in Fig. 17 which shows the
content level of the third, fifth, and seventh harmonics. While the third harmonic is quite
high during the fault, it returns to pre-fault levels after the fault is cleared, whereas the
63
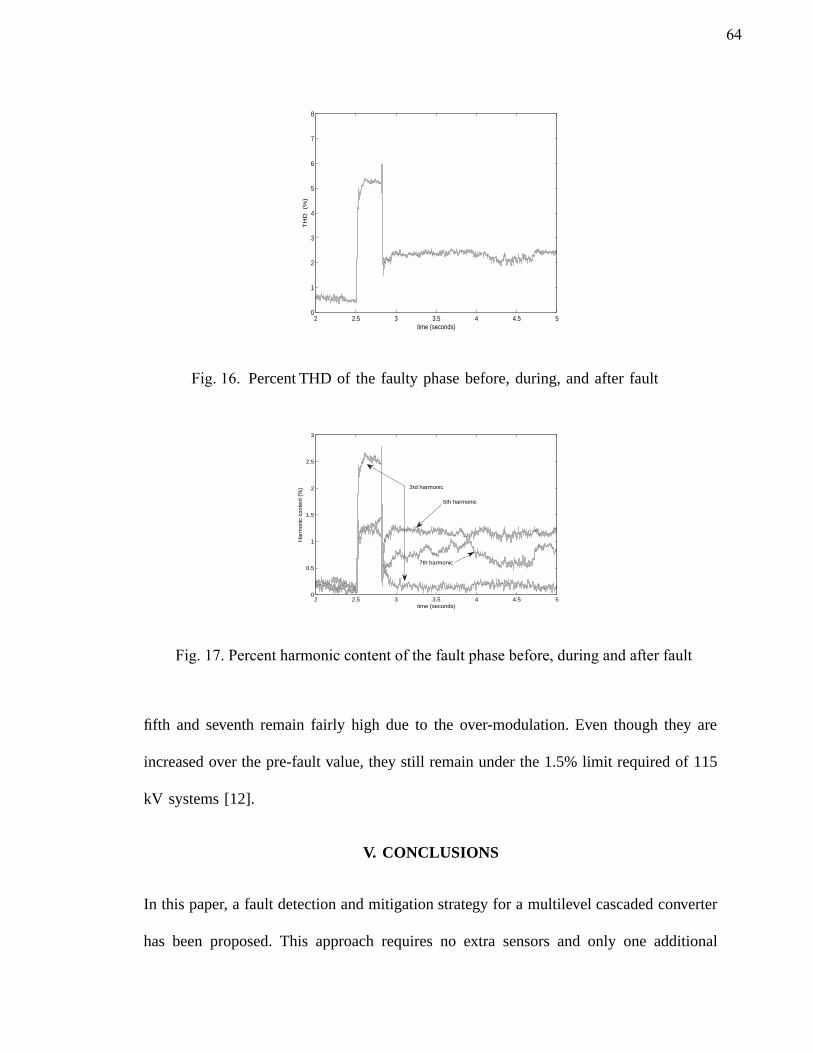
2 2.5 3 3.5 4 4.5 50
1
2
3
4
5
6
7
8
time (seconds)
TH
D
(%)
Fig. 16. Percent THD of the faulty phase before, during, and after fault
2 2.5 3 3.5 4 4.5 50
0.5
1
1.5
2
2.5
3
time (seconds)
Har
mon
ic c
onte
nt (
%)
5th harmonic
7th harmonic
3rd harmonic
Fig. 17. Percent harmonic content of the fault phase before, during and after fault
fifth and seventh remain fairly high due to the over-modulation. Even though they are
increased over the pre-fault value, they still remain under the 1.5% limit required of 115
kV systems [12].
V. CONCLUSIONS
In this paper, a fault detection and mitigation strategy for a multilevel cascaded converter
has been proposed. This approach requires no extra sensors and only one additional
64

bypass switch per module per phase. The approach has been validated on a 115 kV
system with a STATCOM compensating an electric arc furnace load. This application
was chosen since the arc furnace provides a severe application with its non-sinusoidal,
unbalanced, and randomly fluctuating load. The proposed approach was able to accurately
identify and remove the faulted module. In addition, the STATCOM was able to remain
in service and continue to provide compensation without exceeding the total harmonic
distortion allowances.
ACKNOWLEDGEMENTS
This work was supported in part by a grant from the National Science Foundation under
ECCS 0701643.
REFERENCES
[1] C. Turpin, P. Baudesson, F. Richardeu, F. Forest, T. A. Meynard “Fault Management
of Multicell Converters,” IEEE Trans. On Industrial Electronics, vol. 49, No. 5, Oct.
2002.
[2] S. Wei, B.Wu, F. Li, X. Sun, “Control Method for Cascaded H-Bridge Multilevel
Inverter with Faulty Power Cells,” Proceedings of the 2003 Applied Power Electronics
Conference and Exposition, vol. 1, pp. 261-267, Feb 2003.
[3] S. Li and L. Xu, “Fault-Tolerant Operation of a 150kW 3-level Neutral Point Clamped
PWM Inverter in a Flywheel Energy Storage System,” Proceedings of the IEEE 36th
Annual Meeting of Industry Applications Conference, Chicago, Illinois, Oct. 2001.
65

[4] F. Richardeau, P. Baudesson, T. Meynard, “Failure-tolerance and remedial strategies
of a PWM multicell inverter,” IEEE Trans. on Power Electronics, vol. 17, no. 6, pp.
905-912, Nov. 2002.
[5] M. Ma, L. Hu, A. Chen, and X. He, “Reconfiguration of carrier-based modulation
strategy for fault tolerant multilevel inverters,” IEEE Transactions on Power Electron-
ics,, vol. 22, no. 5, September 2007.
[6] F. Z. Peng, J. S. Lai, W. Mckeever, J. Vancoevering, “A Multilevel voltage source
inverter with separate DC sources for static var generation,” IEEE Trans. on Industry
Applications, vol. 32, no. 5, Sept. 1996.
[7] K. A. Corzine, M. W. Wielebski, F. Z. Peng, and J. Wang, “Control of cascaded
multilevel inverters,” IEEE Trans. On Power Electronics, vol. 19, no. 3, May 2004.
[8] B. McGrath and D. Holmes, “Multicarrier PWM strategies for multilevel converters,”
IEEE Transactions on Industrial Electronics, vol. 19, no. 4, Aug. 2002.
[9] P. Lezana, J. Rodriguez, R. Aguilera and C. Silva “Fault detection on multicell
converter based on output voltage frequency analysis,” IEEE Industrial Electronics,
IECON 2006 - 32nd Annual Conference on, Nov. 2006.
[10] Task Force on Harmonics Modeling and Simulation, “Modeling devices with
nonlinear voltage-current characteristics for harmonic studies,” IEEE Transactions on
Power Delivery, vol. 19, no. 4, October 2004.
[11] J-L Guan, J-C Gu, C-J Wu, “A Novel method for estimating voltage flicker,” IEEE
Transactions on Power Delivery, vol. 20, no. 1, January 2005.
[12] “IEEE recommended practices and requirements for harmonic control in electrical
power systems,” IEEE Standard 519-1992, April 1993.
66

IV. Application of STATCOM for Electric Arc Furnace Distortions Alleviation Atousa Yazdani, Student Member, IEEE, Mariesa. L. Crow, Senior Member, IEEE
ABSTRACT— this letter presents the experimental results of IEEE 14 bus test
system that is dealing with an Electric Arc Furnace (EAF). STATCOM is applied to
alleviate the voltage and active power variations caused by the random nonlinear load
(EAF). The studied topology for the STATCOM is a Multilevel Cascaded Converter. A
nonlinear control has been used in order to obtain the control parameters of the converter.
Index Terms: Cascaded Multilevel Inverter, Electrical Arc Furnace, Nonlinear
Control
I. INTRODUCTION
In this study, the impact of EAF in IEEE 14 bus system has been investigated. To
alleviate the variations caused by the EAF a multilevel converter has been implanted. The
STATCOM is a Cascaded Multilevel Converter and the switching of that is performed by
Pulse Width Modulation (PWM). A nonlinear controller is used to get the control
parameters of the PWM ),( αk . The load is a random varying resistive load which models
the Electric Arc Furnace.
67

II. OBTAINING THE CONTROL PARAMETERS OF PWM
A Nonlinear control has been implemented in PSCAD in order to use STATCOM as a
source to provide both active and reactive variations of load at the point of common
coupling. Equations (1) and (2) are describing the voltage balance across the lines that the
STATCOM has been applied.
''
' ' ' 'cos( ) cos( ) d
ddc pcc pcc pcc q
diLkV V R i Lidt
θ α θ '
ω+ − = + − (1)
''' ' ' 'sin( ) sin( ) q
qdc pcc pcc pcc d
diLkV V R i Lidt
θ α θω
+ − = + + ' (2)
Assuming the generator is producing constant active power the angle of the voltage at
PCC can be calculated by (3).
2
1cos ( )pcc const gpcc g
pcc
V P ZV E
θ θ− − ×= − −
× (3)
pccV : Voltage at
PCC
constP : Desired Active Power
Generation
E : Voltage at the Generator Bus
gZ : Thevenin Equivalent Impedance seeing from PCC
gθ : Angel of gZ
68

Using (4) the P and Q can be converted to and . 'di
'qi
'
'
cos( ) sin( )1sin( ) cos( )
pcc pccd
pcc pccq pcc
i Pi QV
θ θθ θ
⎛ ⎞⎡ ⎤ ⎡ ⎤ ⎡ ⎤= ⎜ ⎟⎢ ⎥ ⎢ ⎥ ⎢ ⎥⎜ ⎟ −⎢ ⎥ ⎣ ⎦⎣ ⎦⎣ ⎦ ⎝ ⎠
(4)
P and Q can be obtained by (5) and (6)
constload PPP −= (5)
))(( *
sk
kVVQ ippcc +−= (6)
0P : Constant Active Power that is absorbed by the load
*V : Commanded Voltage at PCC
Applying the
and in (1) and (2) it is possible to obtain the control parameters'di
'qi ),( αk .
III. TEST SYSTEM
In this study an Electric Arc Furnace Load has been supplied through the IEEE 14 bus
test system [1]. Figure 1 shows the test system.
#1 #2
Fig. 1. Test System The system is working on 100 MVA and 115 kV RMS.
69
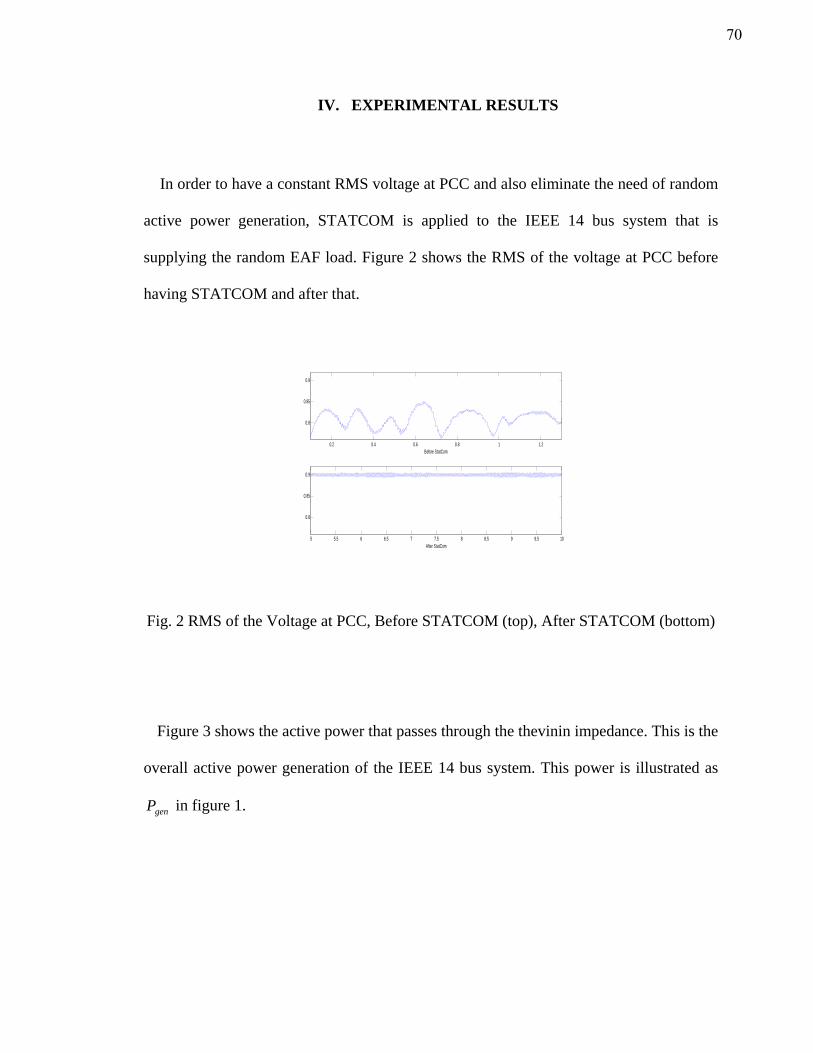
IV. EXPERIMENTAL RESULTS
In order to have a constant RMS voltage at PCC and also eliminate the need of random
active power generation, STATCOM is applied to the IEEE 14 bus system that is
supplying the random EAF load. Figure 2 shows the RMS of the voltage at PCC before
having STATCOM and after that.
0.2 0.4 0.6 0.8 1 1.2
0.8
0.85
0.9
Before StatCom
5 5.5 6 6.5 7 7.5 8 8.5 9 9.5 10
0.8
0.85
0.9
After StatCom
Fig. 2 RMS of the Voltage at PCC, Before STATCOM (top), After STATCOM (bottom)
Figure 3 shows the active power that passes through the thevinin impedance. This is the
overall active power generation of the IEEE 14 bus system. This power is illustrated as
in figure 1. genP
70

0.2 0.4 0.6 0.8 1 1.255
60
65
70
75
80
Before StatCom
5 5.5 6 6.5 7 7.5 8 8.5 9 9.5 1055
60
65
70
75
80
After StatCom
Fig. 3 Active Power from the System, Before STATCOM (top), After STATCOM
(bottom)
Figure 4 illustrates the active power that passes through the STATCOM line. As it can be
seen STATCOM is picking up all the variations of the load.
5 5.5 6 6.5 7 7.5 8 8.5 9 9.5 10-40
-30
-20
-10
0
10
20
Fig 4. Active Power through the StatCom Line
The effect of fault in system has been studied. A solid fault applied to the bus 5 of the
IEEE test system. In order to clear the fault the line between buses 5 and 1 has been
71

removed. From figures 5 and 6, it is apparent that the controller is pretty robust in case of
fault. In figure 5, the RMS of the voltage before fault, during the fault and after that is
shown. In figure 6 the defined , before fault, during the fault and after that is
illustrated. Fault happens at 3 sec. and is cleared at 3.1 sec.
genP
2.5 3 3.5 4 4.5 50.55
0.6
0.65
0.7
0.75
0.8
0.85
0.9
0.95
Fig. 5- RMS of the Voltage at PCC before Fault, During the Fault and After Fault
2.5 3 3.5 4 4.5 5-200
-150
-100
-50
0
50
100
150
Fig. 6. Before Fault, During the Fault and After Fault genP
Figure 7 shows the THD of the three phase voltages at PCC. By applying the
STATCOM, we will have 40% of improvement in maximum of THD.
72

0.2 0.4 0.6 0.8 1 1.20
0.01
0.02
0.03
0.04
0.05
Before StatCom
5 5.5 6 6.5 7 7.5 8 8.5 9 9.5 100
0.01
0.02
0.03
0.04
0.05
After StatCom Fig. 7. THD of the Three Phase Voltages at PCC, Before STATCOM (top), After
STATCOM (bottom)
V. CONCLUTION
The proposed controller has been tested when there is a %10± change in Thevenin
impedance. The output results are as expected. Therefore, without knowing the exact
parameters of the lines, the controller still have a valid performance. Also, it can be seen
from the results the proposed controller is very robust in case of fault.
REFERENCES
[1] http://www.ee.washington.edu/research/pstca/pf14/pg_tca14bus.htm.
[2] Y. Liang, and C. O. Nwankpa, “STATCOM modeling for mitigation of voltage
fluctuations caused by electric arc furnaces”, IEEE Trans on Industry Applications,
Vol. 35, No. 5, Sep. 1999.
[3] C. Schauder and H. Mehta, “Vector Analysis and Control of Advanced Static Var
Compensators.” IEE Proceedings-C, Vol. 140, No. 4, Jul. 1993.
73

[4] K. A. Corzine, M. W. Wielebski, F. Z. Peng, and J. Wang, “Control of Cascaded
Multilevel Inverters”, IEEE Trans. On Power Electronics, Vol. 19, No. 3, May 2004.
74

2. CONCLUSIONS
Electric arc furnaces (EAF) are prevalent in the steel industry to melt iron and
scrap steel. Electric arc furnaces frequently cause large amplitude random and
unbalanced fluctuations of active and reactive power and are the source of significant
power quality disturbances. Static Synchronous Compensators (STATCOMs) provide a
power electronic-based means of embedded control for reactive power support and power
quality improvement. This dissertation introduces two new nonlinear controls for a
multi-level STATCOM that provide significant reduction in EAF-induced aperiodic
oscillations on the power system. These controls are a VPCC-Vdc control and a VPCC-Pline
control. These proposed methods are compared with traditional PI controls and shown to
have improved performance. In all cases, the proposed controls produced similar or
improved results when compared with the PI control in terms of total harmonic distortion
reduction, dynamic response, and flicker mitigation. Furthermore, the proposed
controllers were validated on the IEEE 14 bus test system including response to faults. In
all cases, the controllers continued to provide consistently good results.
Many STATCOMs utilize multilevel converters due to lower harmonic injection
into the power system, decreased stress on the electronic components, decreased voltages,
and lower switching losses. One disadvantage, however, is the increased likelihood of a
switch failure due to the increased number of switches in a multilevel converter. This
dissertation introduces an approach to detect the existence of the faulted switch; identify
which switch is faulty; and reconfigure the STATCOM. This approach requires no extra
sensors and only one additional bypass switch per module per phase. The approach has
been validated on a 115 kV system with a STATCOM compensating an electric arc
75

furnace load. This application was chosen since the arc furnace provides a severe
application with its non-sinusoidal, unbalanced, and randomly fluctuating load. The
proposed approach was able to accurately identify and remove the faulted module. This
work showed that a STATCOM can still provide a significant range of control by
removing the module of the faulted switch and continuing with a reduced number of
levels. In addition, the STATCOM was able to remain in service and continue to provide
compensation without exceeding the total harmonic distortion allowances.
76

APPENDIX A.
BACKGROUND ON REDUNDANT STATE SELECTION

The Redundant State Selection (RSS) is a method to get the capacitor voltages
balanced in Cascaded Multilevel Converter. The Pulse Width Modulation will dictate a
certain voltage level and this voltage level should be made by proper capacitors. Figure 1
shows one of the phases of the cascaded multilevel converter. If is positive,
therefore the capacitors are getting discharged. Thus, the most charged capacitors should
provide the desired voltage. If is negative, the capacitors are charging up and
therefore the least charged capacitors should make the desired voltage. Figure 2 shows
the PSCAD realization of the RSS. For each phase the RSS has been made. As it can be
seen in figure 2, the input of each block is the capacitor voltages and also the switchings
that has been made by PWM and the output of each block is the new switchings.
phaseI
phaseI
phaseI
1dcV2dcV3dcV4dcV5dcV
Fig. 1. One Phase of the Cascaded Multilevel Converter
78

TC11CM_f77_gcc.c
EdcA1 TA11TA11EdcA2EdcA3EdcA4EdcA5
TA12TA13TA14TA21TA22TA23TA24TA31TA32TA33TA34
TA42TA43TA44
TA41
TA52TA53TA54
TA51
"subroutine"Call of C
out=6*in EdcB1 TB11TB11EdcB2EdcB3EdcB4EdcB5
TB12TB13TB14TB21TB22TB23TB24TB31TB32TB33TB34
TB42TB43TB44
TB41
TB52TB53TB54
TB51
"subroutine"Call of C
out=6*in EdcC1 TC11EdcC2EdcC3EdcC4EdcC5
TC12TC13TC14TC21TC22TC23TC24TC31TC32TC33TC34
TC42TC43TC44
TC41
TC52TC53TC54
TC51
"subroutine"Call of C
out=6*in
S1a S1b S1c
0.0 120.0 240.0
t t t
alpha alpha alpha
A11A12A21A22A31A32A41A42A51A52 B52
B51B42B41B32B31B22B21B12B11
C52C51C42C41C32C31C22C21C12C11
IcSIbSIaS
Fig. 2. PSCAD Realization of the Redundant State Selection
79

APPENDIX B.
BACKGROUND ON CROW BAR

Capacitor voltages in the cascaded multilevel converter may not stay at theit
designed point, especially when there is no control on them. Therefore if the STATCOM
is absorbing a small amout of active power, this will result in capacitor voltages to go up.
Therefore, chopper circuit can be used in order to maintain the capacitor voltages at the
desired point. Figure 1 shows the chopper circuit and which is called Crow Bar.
Whenever the capacitor voltage gets larger than the designed value the illustrated switch
in the crow bar will turn on and will chop the voltage down to the desired value.
10000 [uF]
0.127 [ohm]
gA1
Fig. 1. Crow Bar Circuit
81

APPENDIX C.
BACKGROUND ON FAULTED CELL IN A MULTILEVEL CONVERTER
WITH BATTERIES

If the output voltage of each block in the multilevel converter was strictly
constant (i.e. using batteries instead of capacitors) the effect of having faults on different
modules could be investigated from the output voltage. Each H-Bridge will produce three
different voltage levels (-1, 0, 1). In the following figures the top one shows the case
when there is fault on one of the switches that is producing the positive voltage and the
bottom one shows when the fault is on one of the switches that produces the negative
voltage.
Figure 1 shows the output voltage of STATCOM when there is fault in the first block.
Figure 2 shows the output voltage of STATCOM when there is fault in the second block.
Figure 3 shows the output voltage of STATCOM when there is fault in the third block.
Figure 4 shows the output voltage of STATCOM when there is fault in the fourth block.
Figure 5 shows the output voltage of STATCOM when there is fault in the fifth block.
0.024 0.026 0.028 0.03 0.032 0.034 0.036 0.038 0.04 0.042 0.044-100
-50
0
50
100
0.024 0.026 0.028 0.03 0.032 0.034 0.036 0.038 0.04 0.042 0.044-100
-50
0
50
100
Fig. 1. Output Voltage of STATCOM in Case of Having Fault in the First Block
83

0.024 0.026 0.028 0.03 0.032 0.034 0.036 0.038 0.04 0.042-100
-50
0
50
100
0 024 0 026 0 028 0 03 0 032 0 034 0 036 0 038 0 04 0 042-100
-50
0
50
100
Fig. 2. Output Voltage of STATCOM in Case of Having Fault in the Second Block
0.024 0.026 0.028 0.03 0.032 0.034 0.036 0.038 0.04 0.042 0.044-100
-50
0
50
100
0.024 0.026 0.028 0.03 0.032 0.034 0.036 0.038 0.04 0.042 0.044-100
-50
0
50
100
Fig. 3. Output Voltage of STATCOM in Case of Having Fault in the Third Block
84

0.024 0.026 0.028 0.03 0.032 0.034 0.036 0.038 0.04 0.042 0.044-100
-50
0
50
100
0.024 0.026 0.028 0.03 0.032 0.034 0.036 0.038 0.04 0.042 0.044-100
-50
0
50
100
Fig. 4. Output Voltage of STATCOM in Case of Having Fault in the Fourth Block
0.024 0.026 0.028 0.03 0.032 0.034 0.036 0.038 0.04 0.042 0.044-100
-50
0
50
100
0.024 0.026 0.028 0.03 0.032 0.034 0.036 0.038 0.04 0.042 0.044-100
-50
0
50
100
Fig. 5. Output Voltage of STATCOM in Case of Having Fault in the Fifth Block
85

APPENDIX D.
IEEE 14 BUS TEST SYSTEM DATA

Figure 1 shows the one line diagram of IEEE 14 bus test system.
Fig. 1. IEEE 14 Bus Test System One Line Diagram
Table 1 contains the bus data of the system and table 2 contains the line data of
the system.
87

Table 1 Bus Data
Bus No.
Bus Type
Bus Voltage
Bus Angle(deg)
loadP (MW)
loadQ
(MVAR) genP
(MW) genQ
(MVAR) 1 SL 1.06 0 0 0 232.4 ‐16.9
2 PV 1.045 ‐4.98 21.7 12.7 40 42.4
3 PV 1.01 ‐12.72 94.2 19 0 23.4
4 PQ 1.019 ‐10.33 47.8 ‐3.9 0 0
5 PQ 1.02 ‐8.78 7.6 1.6 0 0
6 PV 1.07 ‐14.22 11.2 7.5 0 12.2
7 PQ 1.062 ‐13.37 0 0 0 0
8 PV 1.09 ‐13.36 0 0 0 17.4
9 PQ 1.056 ‐14.94 29.5 16.6 0 0
10 PQ 1.051 ‐15.1 9 5.8 0 0
11 PQ 1.057 ‐14.79 3.5 1.8 0 0
12 PQ 1.055 ‐15.07 6.1 1.6 0 0
13 PQ 1.05 ‐15.16 13.5 5.8 0 0
14 PQ 1.036 ‐16.04 14.9 5 0 0
88

Table 2 Line Data
From To R(pu) X(pu) B(pu)
1 2 0.0194 0.0592 0.0528
1 5 0.054 0.223 0.0492
2 3 0.047 0.198 0.0438
2 4 0.0581 0.1763 0.034
2 5 0.057 0.1739 0.0346
3 4 0.067 0.171 0.0128
4 5 0.0134 0.0421 0
4 7 0 0.2091 0
4 9 0 0.5562 0
5 6 0 0.252 0
6 11 0.095 0.1989 0
6 12 0.1229 0.2558 0
6 13 0.0662 0.1303 0
7 8 0 0.1762 0
7 9 0 0.11 0
9 10 0.0318 0.0845 0
9 14 0.1271 0.2704 0
10 11 0.082 0.1921 0
12 13 0.2209 0.1999 0
13 14 0.1709 0.348 0
89

VITA
Atousa Yazdani was born on June 5th 1975 in Tehran, Iran. She received her BSc
degree from Tehran University in 1997 and her MSc from Amirkabir University (Tehran
Polytechnics) in 2001. She joined the Electrical and Computer Engineering Department
of the Missouri University of Science and Technology in May 2005 to get her PhD
degree. She got her PhD in May 2009. Her research interests include Applying Power
Electronic Devices to enhance the Power System Performance, Power System Modeling,
Power System Dynamics and FACTS devices.
90