energy efficiency of indonesia’s sugar industry based …
TRANSCRIPT

Jurnal Akuntansi ISSN 2303-0356
Vol. 11, No.1, February, 2021 Hal. 53-66
53
ENERGY EFFICIENCY OF INDONESIA’S SUGAR INDUSTRY
BASED ON ECONOMIC FRAMEWORK: STOCHASTIC METAFRONTIER
ANALYSIS
Thinzar Win1), Dyah Wulan Sari*2) and Tri Haryanto3) Universitas Airlangga 1),2),3)
[email protected]), [email protected]), [email protected])
ABSTRACT
This study investigates the efficiency of energy use and technology gap in the Indonesian sugar industry and the
factors influencing energy efficiency. Using the firm-level data of sugar mills in 42 regencies in Indonesia from
2010 to 2014, this study applies the meta stochastic frontier based on the input distance function. The
metafrontier analysis is applied in sugar mills in the East Java province and other provinces in Indonesia. All
the data used in this study are secondary data taken from the Indonesian Central Board of Statistics. The results
reveal that there is a large room to save energy consumption in this industry. The mills in East Java provinces
have higher energy efficiency, technology gap ratio, and metafrontier energy efficiency compared to the mills in
other provinces. According to the metafrontier energy efficiency, energy inefficiencies in both groups come from
operational inefficiency and technology gap. The size of the mills and age of the mills have a positive
relationship with the energy efficiency of sugar mills and the size of the mills is positively related to the
technology gap ratio. Meanwhile, the productivity of labor and the types of ownership do not affect the energy
efficiency and technology gap.
Keywords: Energy Efficiency, Input distance function, Metafrontier, Sugar industry, the Technology gap
*Corresponding author
Email: [email protected]
DOI: https://doi.org/10.33369/j.akuntansi.11.1.53-66
INTRODUCTION
Sugar production is one of Indonesia's strategic industries as it is essential to meet the
basic food needs of a population of nearly 273 million, supply the raw material for other
industries, and create job opportunities (Susila & Sinaga, 2005). Besides, the sugar sector in
Indonesia is highly regulated with tight import controls and retail ceiling price settings.
According to official data from the Bureau of Statistics in Indonesia (BPS), for the last two
decades, the annual growth of sugar consumption is larger than production. From 2001 to
2018, the average sugar consumption increased 4%, with an average yearly consumption of
4.54 million tons. On the contrary, the average production increased by 1.01%, with an annual
average production of 2.24 million tons. In 2018, Indonesia's sugar consumption reached 6.35
million, with a per capita consumption of 25.8 kg per year. This amount is higher than
neighboring countries such as the Philippines (19.2 kg/capita), Vietnam (15.9 kg/capita), and
Cambodia (17.5 kg/capita) (ISO, 2019).
In 2018, the productivity of sugarcane in Indonesia declined by 2.56 tons/ha, with the
extraction rate decreasing by 0.36 % compared to 2017. The low rate of productivity and a
high level of demand likely influence the rise in sugar price. In August 2018, the domestic
price of sugar was nearly three times the international market price. This high price affects
households and the food and beverages (F&B) industry. According to the report of the
International Center for Applied Finance and Economics (2018), the increase in costs of
inputs, higher costs of fuel, and a growing per capita gross domestic product growth have
caused a rise in both price and demand for food. For instance, sugar mills' efficiency is an
essential aspect as it can directly affect the selling price of sugar in the domestic market. As
ENERGY EFFICIENCY OF INDONESIA’S SUGAR INDUSTRY BASED ON ECONOMIC FRAMEWORK:
STOCHASTIC METAFRONTIER ANALYSIS
Thinzar Win, Dyah Wulan Sari and Tri Haryanto
54
one of the main inputs of production in the sugar industry, energy efficiency is a crucial factor
in controlling the rise in production cost.
Azhari (2018) reports that between 2000 to 2014, the technical efficiency in the sugar
cane industry in Indonesia was 65.9% under variable return to scale and 55.7% under constant
return to scale. This figure indicates that Indonesia's sugar industry has the potential to
increase technical efficiency. As sugar factories are energy-intensive (Vivadinar, Purwanto, &
Saputra, 2016), one way to reduce the input cost and to improve technical efficiency is to
optimize energy utilization.
In Indonesia, the production of a ton of sugar takes 5.98 barrel oil equivalent (BOE)
which is high compared to the general industry standard (Specific Energy Consumption, SEC)
4.75 barrel oil equivalent (BOE) (Vivadinar et al., 2016). The increase in energy use in the
sector is not only derived from the rapid structural transformation (industrialization) but also
as a result of wasteful use of energy. Inefficiency in energy use will harm the industrial sector
as it will be translated into a higher cost of production and lower aggregate profits. Sugiharti
et al (2017) point out the fast increase in the cost of energy in manufacturing activities in
Indonesia, resulting in higher production costs. In the long term, rising wastefulness of energy
can cause economic inefficiency through poor allocation of resources (Ministry of Industry,
2012).
Previous studies analyzing the energy efficiency of the Indonesian manufacturing
sector point out that industrial activity could further improve the use of energy inputs.
Vivadinar, Purwanto, and Saputra (2012) studied the typical Specific Energy Consumption
(SEC), finding that changes in energy intensity in the food processing sector are mainly
explained by efficiency factors. Priambodo and Kumar (2001) analyzed the energy
consumption and CO2 emission of Indonesian Small and Medium Scale Industries (SMEs),
finding that the food sector employs the highest energy intensity ratio among SMEs in
Indonesia. Vivadinar et al. (2016) point out that the sugar industry is intensive and inefficient
in energy use for heating purposes, employing larger than usual energy to output ratios,
assumed to be derived from employing old equipment. McDonald and Meylinah (2019) point
out that more than 40 mills in the country are over 100 years old. Ramstetter and Narjoko
(2014) studied the relationship between ownership and energy efficiency in the manufacturing
sector of Indonesia, finding that no evidence of efficient use of energy derived from
ownership (foreign, government, or private). According to the report of the United Nations
Industrial Development Organization (2017), Indonesia Government implemented energy-
saving programs for GHG emissions, energy consumption, and water consumption of
Pagottan Sugar Mill and Tjoekir Sugar Mill in Indonesia reducing the SEC close to a
benchmark for sugar cane mills, suggesting that the sector has substantial room for
improvement and that analysis of energy efficiency is crucial for the sector.
The study on energy efficiency based on the economic foundation is very rare in the
sugar industry in Indonesia as it is generally analyzed within the food sector. There is still a
gap in the analysis of metafrontier energy efficiency with the application of the stochastic
frontier approach in sugar mills in Indonesia. To our knowledge, there is no previous study in
Indonesia exploring energy efficiency and the technological gap in a large sample of mills
across the country. We aim at filling this gap, by measuring the level of energy efficiency in
the sugar industry in Indonesia and by exploring whether factors like age of mills, size of the
mills, ownership, and labor productivity contribute to more efficient use of energy. We cover
the period of 2010-2014, analyzing sugar cane mills in 42 regencies in Indonesia. The period
of 2010-2014 is selected as a study period based on the Indonesian government’s Road Map
for a short-term period in the Sugar industry (2010-2014) and based on the updated ISIC
(International Standard of Industrial Classification) code. Finally, we compare the

Jurnal Akuntansi ISSN 2303-0356
Vol. 11, No.1, February, 2021 Hal. 53-66
55
performance of mills in East Java province, the largest producer of sugar in the country,
versus other provinces.
RESEARCH METHODS
The meta-production function was developed by Hayami and Ruttan (1970) as the
envelope of commonly conceived neoclassical production functions and it is an envelope of
production points with the highest efficiency. This supposed that all mills in groups can get a
range of production technologies, but each mill may select a certain technology, based on
particular conditions, such as regulation, the environments, production resources, and relative
input prices. These situations hamper the mills in some groups from selecting the excellent
technology from the arrangement of the potential technology set. A production technology
gap is a distinction between the best technology and the chosen sub-technology, i.e., the
group-specific frontier.
The meta-frontier production function describes the maximum production of the
maximum frontier. This function is built from each of the most efficient points of each
individual in each group. Because each group has a different technology, the meta-frontier
production function covers the entire frontier with different technology. This specifies that the
meta-frontier production function is in a very long run period. A comparison of frontier
production between groups means comparing production with different technologies so that it
can be seen that there are groups whose technology is lower or higher than the others. In the
long run, each group can improve its technology with its innovation or emulate other groups
with higher technology. The technology shift has an impact on the shift in the group's frontier
production function and eventually in the very long run period will shift the meta-frontier
function upward.
Based on the neoclassical production framework, suppose a production process in
which each sugar mills employs four inputs (𝑋𝑖), capital stock (K), the labor force (L), raw
materials (R), and Energy (E), to produce the output, sugar, (Y). The input distance function
is defined as the biggest scalar quantity that one can proportionally decrease all inputs,
energy, and other inputs, and still have the option to produce the output vector Y. Since the
input distance function DI(y, x) is described with the input sets P(y).
DI(y,x)= max{α:x/α∈P(y)} … … … … … … … … … … … … (1)
To consider the energy efficiency from a production efficiency' perspective, Shephard
sub-vector input distance function can be used as follows:
DE = (Xi, Y)
= (K, L, R, E, Y)
= sup{α: (K, L, R, E/α, Y) T } … … … … … … … . . … ( 2)
Equation (1) attempts to diminish the energy use as long as is viable with the resulting
input-output combination in the production technology set characterized by equation (1).
Thus, E/ DE = (K, L, R, E, Y) shows the hypothetical energy use if the firm is efficient in
energy. At that point, the proportion of hypothetical real consumption of energy is equal to the
reciprocal of the sub-vector distance function. This can be specified as the firm's energy
efficiency index (EE hereafter), i.e.
EE=E/DE(K,L,R,E,Y)
E

ENERGY EFFICIENCY OF INDONESIA’S SUGAR INDUSTRY BASED ON ECONOMIC FRAMEWORK:
STOCHASTIC METAFRONTIER ANALYSIS
Thinzar Win, Dyah Wulan Sari and Tri Haryanto
56
EE = 1
DE(K, L, R, E, Y) … . . … … … … … … … … … . . … …. (3)
The EE is equal to one of the firms is on the best frontier. Otherwise, EE will be less
than one.
Following Zhou, Ang, and Zhou (2012) and Honma and Hu (2018), the stochastic
frontier distance function can be expressed in the translog production model as follows.
lnDE(Kit, Lit, Rit, Eit, Yit) = β0 + βKLnKit + βLlnLit + β𝑅lnRit + βElnEit + βYlnYit + 0.5βKK(lnKit)
2 + 0.5βLL(lnLit)2 + 0.5β𝑅𝑅(lnRit)2 +
0.5βEE(lnEit)2 + 0.5βYY(lnYit)2 + βKL(lnKit)(lnLit) +
βKR(lnKit)(lnRit) + βKE(lnKit)(lnEit) + βKY(lnKit)(lnYit) + βLR(lnLit)(lnRit) + βLE(lnLit)(lnEit) + βLY(lnLit)(lnYit) + βRE(lnRit)(lnEit) + βRY(lnRit)(lnYit) + βEY(lnEit)(lnYit) + vit … … … … … … … … … (4)
where vit is a random variable accounting for statistical noise which is supposed to be
normally distributed. Because of the properties of linearly homogenous energy in the
Shephard energy distance function, equation (5) becomes
lnDE(Kit, Lit, Rit, Eit, Yit) = lnEit + lnDE(Kit, Lit, Rit, 1, Yit) … … … … . . (5)
By substituting equation (4) to equation (5) and rearrange. It implies that
βKE(lnKit) + βLE(lnLit) + βRE(lnRit) + βYE(lnYit) = 1 − βE … … … … (6)
By substituting equation (6) to equation (4) and rearrange, it becomes that
−lnEit = β0 + βKLnKit + βLlnLit + βRlnRit + βYlnYit + βEln1 + 0.5βKK(lnKit)2 + 0.5βLL(lnLit)2 + 0.5βRR(lnRit)
2 + 0.5βYY(lnYit)2 + βKL(lnKit)(lnLit)+ βKR(lnKit)(lnRit) + βKY(lnKit)(lnYit) + βLR(lnLit)(lnRit)+ βLY(lnLit)(lnYit) + βRY(lnRit)(lnYit) + vit
− lnDE(Kit, Lit, 𝑅𝑖𝑡 , Eit, Yit) … … … … … . … … (7)
Thus,
ln(1/Eit) = β
0+β
KLnKit+β
LlnLit+β
RlnRit + β
YlnYit +0.5βKK(lnKit)2 + 0.5βLL(lnLit)
2 +
0.5βRR(lnRit)2 + 0.5β𝑌𝑌(lnYit)2 + βKL(lnKit)(lnLit) + βKR(lnKit)(lnRit) + βKY(lnKit)(lnYit) + βLR(lnLit)(lnRit) + βLY(lnLit)(lnYit) + βRY(lnRit)(lnYit) + 𝑣𝑖𝑡 − 𝑢𝑖𝑡 … … . . … … … … . . … … … … … … . (8)
where uit = lnDE(Kit, Lit, Rit, Eit, Yit) is a non-negative variable accounting for energy
efficiency. As a result, the SFA model presented as equation (8) can be derived from the
Shephard energy distance function. The ML technique can be used to evaluate the parameters
in equation (8). After the evaluation of equation (8), the energy inefficiency component 𝑢𝑖�̂�
can be attained and the corresponding energy efficiency can be measured with EE = exp (-
𝑢𝑖�̂� ). It is assumed that 𝑢𝑖𝑡 is assumed to be a truncation of the normal distribution. The
determinants of inefficiency can be simultaneously examined by Battese and Coelli (1995).
Jurnal Akuntansi ISSN 2303-0356
Vol. 11, No.1, February, 2021 Hal. 53-66
57
uit= 𝛿0 + ∑ δj Hjit
j
j=1
+ 휀𝑖𝑡 … … … … … … … … … … … … . . (9)
where 𝐻𝑗𝑖𝑡 represents the environmental variables and each 𝛿 is the parameters to be
estimated.
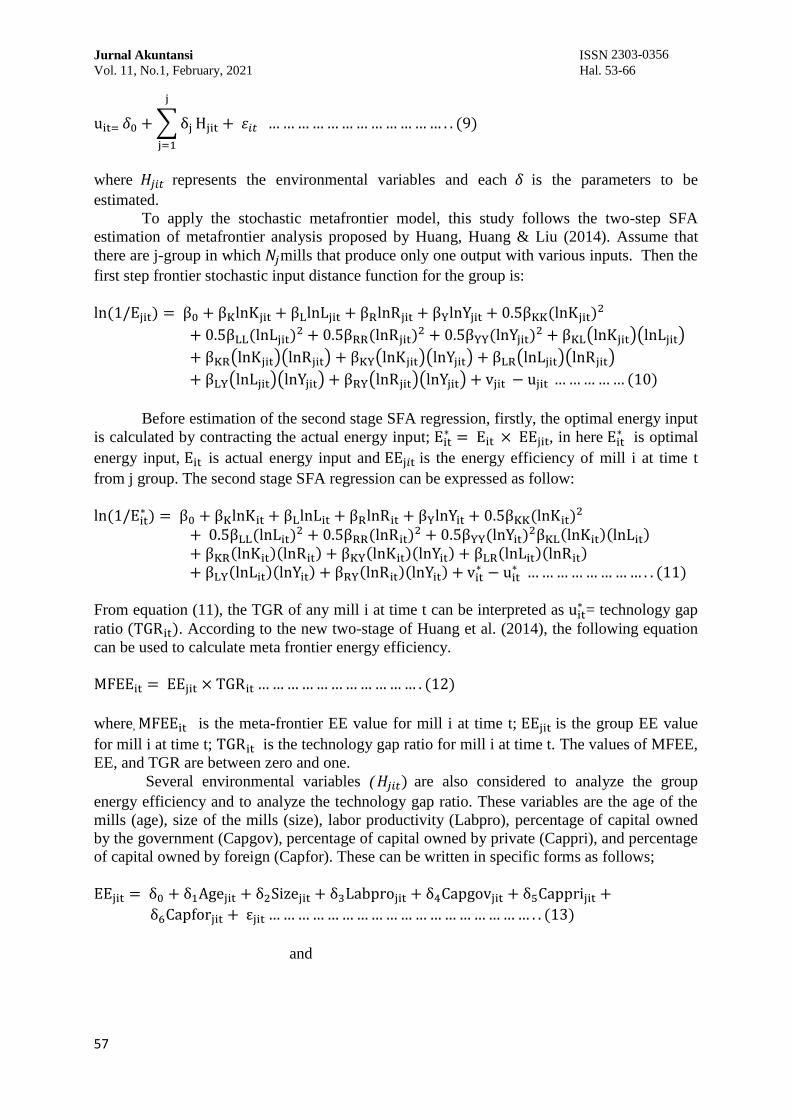
To apply the stochastic metafrontier model, this study follows the two-step SFA
estimation of metafrontier analysis proposed by Huang, Huang & Liu (2014). Assume that
there are j-group in which 𝑁𝑗mills that produce only one output with various inputs. Then the
first step frontier stochastic input distance function for the group is:
ln (1/Ejit) = β0 + βKlnKjit + βLlnLjit + βRlnRjit + βYlnYjit + 0.5βKK(lnKjit)2
+ 0.5βLL(lnLjit)2 + 0.5βRR(lnRjit)2 + 0.5βYY(lnYjit)2 + βKL(lnKjit)(lnLjit)
+ βKR(lnKjit)(lnRjit) + βKY(lnKjit)(lnYjit) + βLR(lnLjit)(lnRjit)
+ βLY(lnLjit)(lnYjit) + βRY(lnRjit)(lnYjit) + vjit − ujit … … … … … (10)
Before estimation of the second stage SFA regression, firstly, the optimal energy input
is calculated by contracting the actual energy input; Eit∗ = Eit × EEjit, in here Eit
∗ is optimal
energy input, Eit is actual energy input and EEj𝑖t is the energy efficiency of mill i at time t
from j group. The second stage SFA regression can be expressed as follow:
ln (1/Eit∗ ) = β0 + βKlnKit + βLlnLit + βRlnRit + βYlnYit + 0.5βKK(lnKit)2
+ 0.5βLL(lnLit)2 + 0.5βRR(lnRit)2 + 0.5βYY(lnYit)2βKL(lnKit)(lnLit)
+ βKR(lnKit)(lnRit) + βKY(lnKit)(lnYit) + βLR(lnLit)(lnRit)+ βLY(lnLit)(lnYit) + βRY(lnRit)(lnYit) + vit
∗ − uit∗ … … … … … … … … . . (11)
From equation (11), the TGR of any mill i at time t can be interpreted as uit∗ = technology gap
ratio (TGRit). According to the new two-stage of Huang et al. (2014), the following equation
can be used to calculate meta frontier energy efficiency.
MFEEit = EEjit × TGRit … … … … … … … … … … … . (12)
where, MFEEit is the meta-frontier EE value for mill i at time t; EEjit is the group EE value
for mill i at time t; TGRit is the technology gap ratio for mill i at time t. The values of MFEE,
EE, and TGR are between zero and one.
Several environmental variables ( 𝐻𝑗𝑖𝑡) are also considered to analyze the group
energy efficiency and to analyze the technology gap ratio. These variables are the age of the
mills (age), size of the mills (size), labor productivity (Labpro), percentage of capital owned
by the government (Capgov), percentage of capital owned by private (Cappri), and percentage
of capital owned by foreign (Capfor). These can be written in specific forms as follows;
EEjit = δ0 + δ1Agejit + δ2Sizejit + δ3Labprojit + δ4Capgovjit + δ5Capprijit +
δ6Capforjit + εjit … … … … … … … … … … … … … … … … … … . . (13)
and

ENERGY EFFICIENCY OF INDONESIA’S SUGAR INDUSTRY BASED ON ECONOMIC FRAMEWORK:
STOCHASTIC METAFRONTIER ANALYSIS
Thinzar Win, Dyah Wulan Sari and Tri Haryanto
58
TGRit = δ0 + δ1Ageit + δ2Sizeit + δ3Labproit + δ4Capgovit + δ5Cappriit + δ6Capforit + εit … … … … … … … … … … … … … … … … … (14)
In this study, the sample panel data in 2010-2014 include the sugar mills of Indonesia
in 42 regencies in which sugar mills are located. The period of 2010-2014 is selected as a
study period based on the newly updated ISIC (International Standard of Industrial
Classification) code and Indonesian Government Road Map for a short-term period in the
sugar industry (2010-2014). To apply the metafrontier analysis, the mills in 42 regencies are
divided into two groups according to their location. The mills in East Java are classified as
group 1 and the mills in other provinces are classified as group 2 because 48.5% of the sugar
mills are located in East Java and the number of sugar mills in each other province is too
small. Thus, the mills in other provinces are combined in one group. There are nine provinces
in another group namely, West Java, Central Java, Daista Yogyakarta, Banten, North
Sumatera, South Sumatera, Lampung, South Sulawesi, and Gorontalo.
Data are taken from the secondary data of the BPS (Indonesia Central Board of
Statistics). All the variables expressed in monetary terms are converted by using a wholesale
price index (WPI) published by BPS at a constant price of 2010. The output variable, gross
total output, Y, is characterized as the total amount of the output of a mill in a specific year.
The capital stock is calculated by the replacement value of fixed assets. The value of fixed
assets contains land, buildings, machinery equipment, vehicles, and other capital goods. The
number of employees is used as a measurement of the labor variable. The raw material is the
sum of costs of raw materials including domestic and imports. Energy included all kinds of
energy such as gasoline, diesel fuel, kerosene, coal, coal briquettes, gas from PGN, gas from
others, LPG, lubricants, and other fuels (coke, Fuel oil, Bunker C and MFO). All the different
units of energy measurement are converted into the standard unit of barrel oil equivalent
(BOE). The environmental variables included in the models are the age of the mill, size of the
mill, labor productivity, and capital ownership. The age of the mill is the length of the mill’s
operation time and this is measured by year. Because of data availability, the age of the mill is
measured from 1975 to 2014 in this study. The size of the mill is calculated as a logarithmic
value of the value-added of the mill. Labor productivity is calculated in terms of labor cost per
worker. Capital ownership is measured by the percentage of capital owned by the central
government, domestic private, and foreign. Summary statistics of variables are presented in
table (1).
In group 1, the average energy consumption is 6,082.33 with a standard deviation
value of 15,634.34. The minimum and maximum values of energy consumption are 15.50 and
167,320.3 respectively. The average value of capital is 21.58 billion rupiahs with a standard
deviation of 50.78. The maximum value of capital in this group is 382.95 billion rupiahs. The
minimum capital value is 0.06 billion rupiahs. This minimum value indicates that several
mills have a value that is very far from the mill’s average value of capital. For labor variables
in this group, the minimum number of workers is 20 people, while the maximum number of
workers in this industry is 2196 people. The minimum value of labor (20 people) indicates
that this industry consists of only two types of mills. A mill is said to be a medium enterprise
if the number of laborers in the mills is from 20 people up to 99 people. A mill is said to be a
large enterprise if the number of laborers in the mills is more than 99 people. The average raw
materials’ value is 182.58 billion rupiahs with a standard deviation is 15,634.34 billion
rupiahs and the cost of raw material reaches a maximum of 1,887.36 billion rupiahs.
Jurnal Akuntansi ISSN 2303-0356
Vol. 11, No.1, February, 2021 Hal. 53-66
59
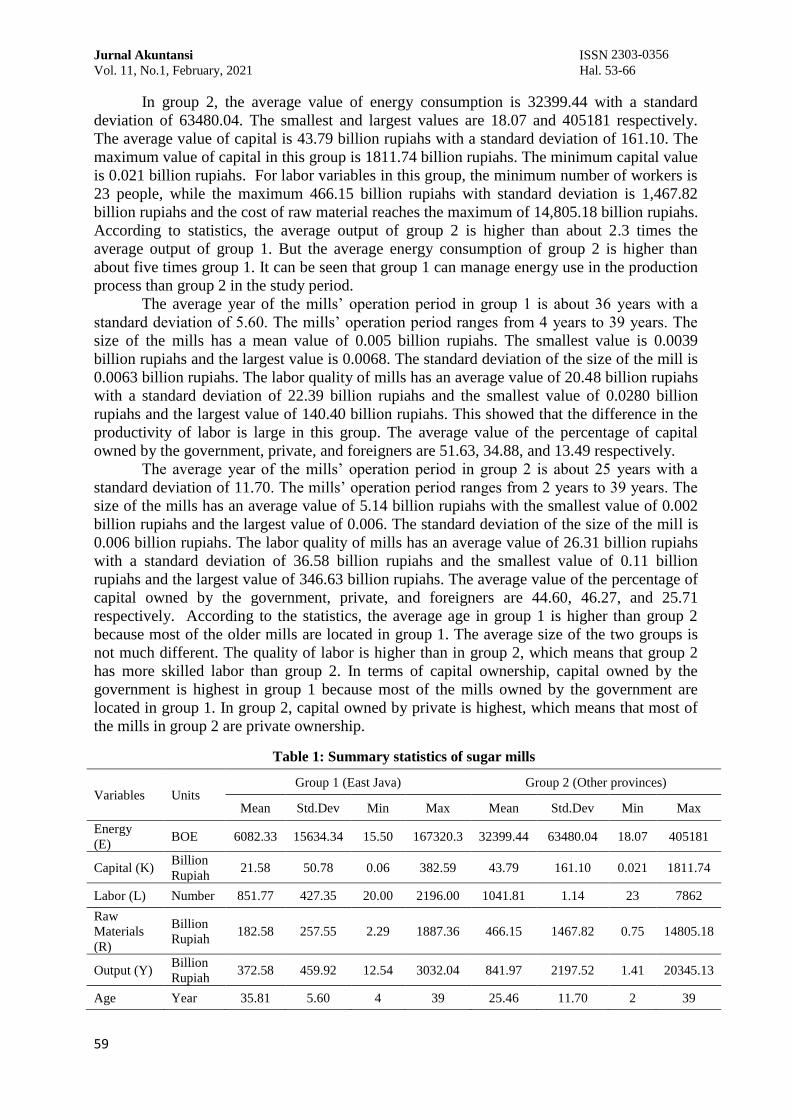
In group 2, the average value of energy consumption is 32399.44 with a standard
deviation of 63480.04. The smallest and largest values are 18.07 and 405181 respectively.
The average value of capital is 43.79 billion rupiahs with a standard deviation of 161.10. The
maximum value of capital in this group is 1811.74 billion rupiahs. The minimum capital value
is 0.021 billion rupiahs. For labor variables in this group, the minimum number of workers is
23 people, while the maximum 466.15 billion rupiahs with standard deviation is 1,467.82
billion rupiahs and the cost of raw material reaches the maximum of 14,805.18 billion rupiahs.
According to statistics, the average output of group 2 is higher than about 2.3 times the
average output of group 1. But the average energy consumption of group 2 is higher than
about five times group 1. It can be seen that group 1 can manage energy use in the production
process than group 2 in the study period.
The average year of the mills’ operation period in group 1 is about 36 years with a
standard deviation of 5.60. The mills’ operation period ranges from 4 years to 39 years. The
size of the mills has a mean value of 0.005 billion rupiahs. The smallest value is 0.0039
billion rupiahs and the largest value is 0.0068. The standard deviation of the size of the mill is
0.0063 billion rupiahs. The labor quality of mills has an average value of 20.48 billion rupiahs
with a standard deviation of 22.39 billion rupiahs and the smallest value of 0.0280 billion
rupiahs and the largest value of 140.40 billion rupiahs. This showed that the difference in the
productivity of labor is large in this group. The average value of the percentage of capital
owned by the government, private, and foreigners are 51.63, 34.88, and 13.49 respectively.
The average year of the mills’ operation period in group 2 is about 25 years with a
standard deviation of 11.70. The mills’ operation period ranges from 2 years to 39 years. The
size of the mills has an average value of 5.14 billion rupiahs with the smallest value of 0.002
billion rupiahs and the largest value of 0.006. The standard deviation of the size of the mill is
0.006 billion rupiahs. The labor quality of mills has an average value of 26.31 billion rupiahs
with a standard deviation of 36.58 billion rupiahs and the smallest value of 0.11 billion
rupiahs and the largest value of 346.63 billion rupiahs. The average value of the percentage of
capital owned by the government, private, and foreigners are 44.60, 46.27, and 25.71
respectively. According to the statistics, the average age in group 1 is higher than group 2
because most of the older mills are located in group 1. The average size of the two groups is
not much different. The quality of labor is higher than in group 2, which means that group 2
has more skilled labor than group 2. In terms of capital ownership, capital owned by the
government is highest in group 1 because most of the mills owned by the government are
located in group 1. In group 2, capital owned by private is highest, which means that most of
the mills in group 2 are private ownership.
Table 1: Summary statistics of sugar mills
Variables Units Group 1 (East Java) Group 2 (Other provinces)
Mean Std.Dev Min Max Mean Std.Dev Min Max
Energy
(E) BOE 6082.33 15634.34 15.50 167320.3 32399.44 63480.04 18.07 405181
Capital (K) Billion
Rupiah 21.58 50.78 0.06 382.59 43.79 161.10 0.021 1811.74
Labor (L) Number 851.77 427.35 20.00 2196.00 1041.81 1.14 23 7862
Raw
Materials
(R)
Billion
Rupiah 182.58 257.55 2.29 1887.36 466.15 1467.82 0.75 14805.18
Output (Y) Billion
Rupiah 372.58 459.92 12.54 3032.04 841.97 2197.52 1.41 20345.13
Age Year 35.81 5.60 4 39 25.46 11.70 2 39

ENERGY EFFICIENCY OF INDONESIA’S SUGAR INDUSTRY BASED ON ECONOMIC FRAMEWORK:
STOCHASTIC METAFRONTIER ANALYSIS
Thinzar Win, Dyah Wulan Sari and Tri Haryanto
60
RESULTS AND DISCUSSION
The most important step in analyzing the frontier is choosing the best model for this
industry. In this study, the Cobb-Douglas model and the Trans-log model are compared. The
best model from these two models is selected by applying the log-likelihood ratio test by
comparing the value of λ with the value of the Chi-Square table. The likelihood Ratio (LR)
test is λ = [L(H1)
L(H0)]
2
in which ln[L(H0)] is the LR value of the Cobb Douglas model and ln
[L(H1)] is the LR value of the trans-log model. The degree of freedom is the number of
parameters in the restricted model. The null hypothesis is that the Cobb-Douglas form is a
suitable production function frontier form against the translog specification. Based on the
estimation result, the Cobb Douglas model is rejected. So, the trans-log model is the
appropriate model for the sugar industry in Indonesia.
After testing for the best model, the next hypothesis is to test the necessity of the
metafrontier technique in the sugar industry. This hypothesis is tested by the LR test, λ =
[L(H1)
L(H2)]
2
, where ln [L (H0)] is the value of the loglikelihood function for the stochastic frontier
estimated by pooling the data for all mills in all groups and ln [L (H1)] is the sum of the value
of the loglikelihood functions for two group production frontiers. The degree of freedom is the
distinction between the number of parameters obtained from the estimated value under H1 and
H0. If all the mills share the same production frontier and the same technology, it does not
need to apply metafrontier. Based on the result, the null hypothesis, the production frontier is
homogeneous for two groups, is rejected and it can be concluded that the technology in these
groups is different. Thus, the meta-frontier method is suitable to estimate the energy
efficiency of the sugar industry in Indonesia. The hypothesis test is shown in table (2).
Table 2: Hypothesis test
Null hypothesis; H0 Test Statistics (λ) Critical Value (𝜒2) Decision
Cobb-Douglas form is a suitable production
function frontier 20.62 13.28 Reject
The production frontier is homogeneous for
two groups 27.6 23.68 Reject
Source: Compilation by the author
Table (3) reports the parameters estimates for efficiency and its determinants. Here,
for environmental variables, a minus sign of the coefficient of variables describes that this
variable is a factor increasing energy inefficiency and a plus sign of the coefficient of
variables shows that this variable is a factor decreasing energy inefficiency (Honma & Hu,
2018; Hsiao, Hu, Hsiao, & Chang, 2019). In this study, all the data are normalized around
their means before estimating the data.
Size Billion
Rupiah 0.005 0.0005 0.004 0.0063 5.14 0.006 0.002 0.006
Labpro Billion
Rupiah 20.48 22.39 0.0280 140.40 26.31 36.58 0.11 346.63
Capgov % 51.63 49.89 0 100 29.37 44.60 0 100
Cappri % 34.88 46.98 0 100 62 46.27 0 100
Capfor % 13.49 32.99 0 100 8.62 25.71 0 100
Number of
observations 160 165
Source: Indonesia Central Board of Statistics (BPS)

Jurnal Akuntansi ISSN 2303-0356
Vol. 11, No.1, February, 2021 Hal. 53-66
61
Table (3) reports that capital is significant only in group 2 and labor is significant only
in group 1. The raw material and output are significant in both groups. In terms of
environmental factors that affect the energy efficiency (EE) of the sugar industry, the mill’s
age has an impact on energy efficiency at 5% significance level in group 1only. The positive
sign implies that the older the age of the mill, the more efficient energy consumption. This
result is the opposite of Haider, Danish, and Sharma (2019) in which younger firms are more
efficient in energy use. Based on the literature, the older mills have lower performance in
energy efficiency. But, in Indonesia, Government collaborated with the state and private
sectors to improve the sugar industry. In 2009, the government invested $858.4 million in
state-owned plantations to expand land and to modernize the existing mills’ facilities. For this
reason, the mill’s age is directly related to energy efficiency in East Java because most of the
state-owned mills are located in this province.
The size of the mill positively affects energy efficiency in both groups showing that an
increase in size induces energy efficiency. This is consistent with the previous study of
Irawan, Hartono, and Achsani (2010), Mandal and Madheswaran (2011), and Haider et al.
(2019). Among the ownership type, the percentage of capital owned by the government,
private and foreign have a significant effect on both groups. However, negative signs imply
that the ownership type has not helped the energy efficiency of mills in both groups. The
value of γ is
0.6350 and 0.9999 in group 1 and group 2 respectively which shows that the inefficiency
variance is 63.5% and 99.99 % of the total variance of error components in each group.
For Technology Gap Ratio, the output is significant at a 10% significant level. The
size of the mill has a positive effect on TGR, showing that the larger the size of the firm, the
higher the TGR. This is in line with the assumption of various authors (Geroski, 2000; Hall &
Khan, 2002; Nelson & Winter, 1982) in which large mills are much more likely to undertake a
new technology for many reasons. All of the ownership types are significant at a 10%
significant level but the negative signs of coefficients show that the ownership types cannot
explain the TGR.
Table 3: Parameter estimates of efficiency and its determinants
Variable
Group 1 Group 2 TGR
Coefficient t-ratio Coefficient t-ratio Coefficient t-ratio
Constant (𝛽0) 0.8137* 2.9669 2.4519* 41.9004 2.2543* 6.6020
Capital (𝛽𝐾) -0.0727 -0.7221 0.1015* 5.2789 -0.1066 -0.9321
Labor (𝛽𝐿) 0.5325** 2.2202 0.2175 1.5670 -0.0317 -0.1414
Raw materials (𝛽𝑅) -0.6896* -2.8478 0.2740* 8.8213 0.1505 0.4983
Output (𝛽𝑌) 1.2898* 4.2118 0.4463* 13.6967 0.8205*** 1.8788
Capital *Capital (𝛽𝐾𝐾) 0.1378 1.0644 -0.0991 -1.5471 -0.0731 -0.5213
Labor*Labor (𝛽𝐿𝐿) 0.6132** 2.4749 -0.3314** -2.4098 0.0712 0.3301
Raw materials * Raw materials
(𝛽𝑅𝑅) -1.5171* -3.0297 -0.0668 -1.6219 -0.1365 -0.2306
Output * Output (𝛽𝑌𝑌) -1.3178*** -1.7043 0.1539** 2.1429 0.8754 1.1448
Capital * Labor (𝛽𝐾𝐿) -0.1787 -1.0084 -0.2108* -3.7504 -0.3414** -2.0726
Capital * Raw materials (𝛽𝐾𝑅) -0.0376 -0.2814 -0.0049 -0.2370 0.1765 0.9787
Capital * Output (𝛽𝐾𝑌) 0.1569 0.6946 0.0607 1.2789 -0.0974 -0.4251
Labor*Raw materials (𝛽𝐿𝑅) -0.1527 -0.3823 -0.0425 -0.9604 0.2462 -0.6964
Labor*Output (𝛽𝐿𝑅) 0.4953 0.8727 0.5537* 10.1000 0.7071 1.5714
Raw materials * output (𝛽𝑅𝑌) 1.3201* 2.6593 -0.0140 -0.4648 -0.1654 -0.2724
Constant (𝛿0) -0.0073 -0.0073 -0.0020 -0.0020 -0.0814 -0.0184
Age (𝛿1) 0.1631** 2.3989 0.0214 0.6311 -0.0063 -0.0797
Size (𝛿2) 3.0975** 2.4464 1.5147* 3.8070 9.7905** 1.9610
Labpro (𝛿3) 0.93E-05 0.9723 -1.190E-05 -1.6065 0.19E-04 1.1019
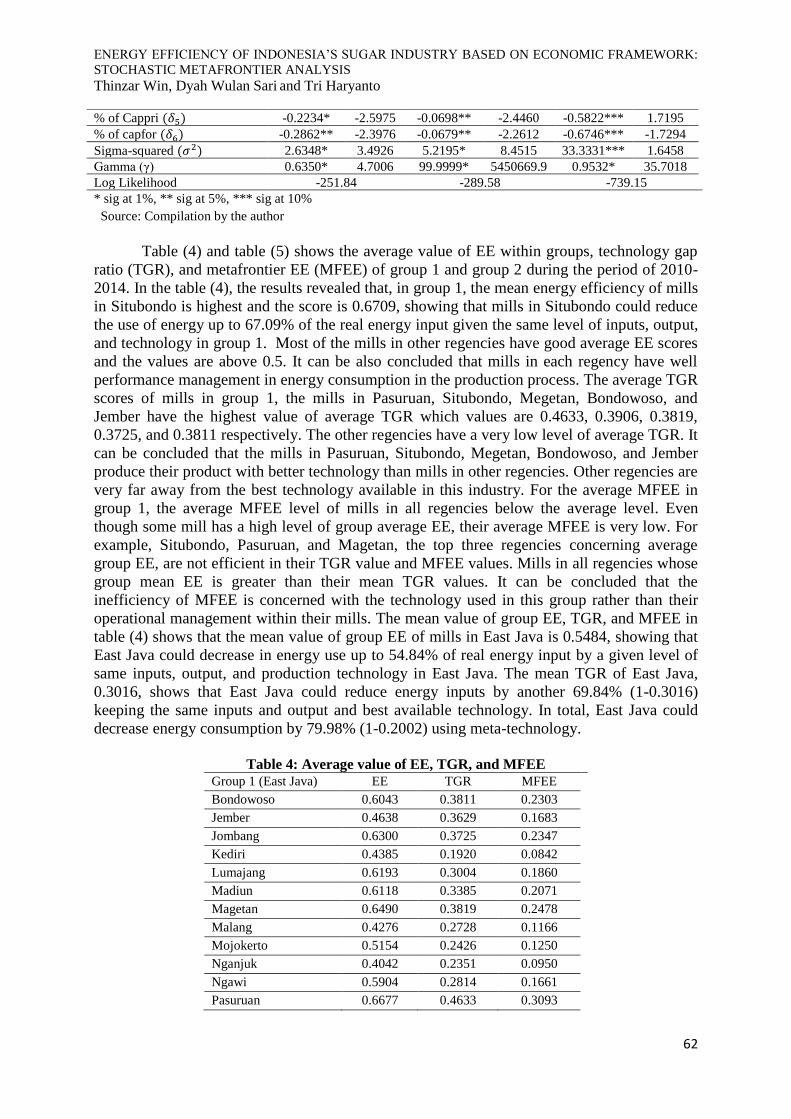
% of Capgov (𝛿4) -0.2229* -2.6315 -0.0620** -2.1579 -0.5806*** -1.7174
ENERGY EFFICIENCY OF INDONESIA’S SUGAR INDUSTRY BASED ON ECONOMIC FRAMEWORK:
STOCHASTIC METAFRONTIER ANALYSIS
Thinzar Win, Dyah Wulan Sari and Tri Haryanto
62
Table (4) and table (5) shows the average value of EE within groups, technology gap
ratio (TGR), and metafrontier EE (MFEE) of group 1 and group 2 during the period of 2010-
2014. In the table (4), the results revealed that, in group 1, the mean energy efficiency of mills
in Situbondo is highest and the score is 0.6709, showing that mills in Situbondo could reduce
the use of energy up to 67.09% of the real energy input given the same level of inputs, output,
and technology in group 1. Most of the mills in other regencies have good average EE scores
and the values are above 0.5. It can be also concluded that mills in each regency have well
performance management in energy consumption in the production process. The average TGR
scores of mills in group 1, the mills in Pasuruan, Situbondo, Megetan, Bondowoso, and
Jember have the highest value of average TGR which values are 0.4633, 0.3906, 0.3819,
0.3725, and 0.3811 respectively. The other regencies have a very low level of average TGR. It
can be concluded that the mills in Pasuruan, Situbondo, Megetan, Bondowoso, and Jember
produce their product with better technology than mills in other regencies. Other regencies are
very far away from the best technology available in this industry. For the average MFEE in
group 1, the average MFEE level of mills in all regencies below the average level. Even
though some mill has a high level of group average EE, their average MFEE is very low. For
example, Situbondo, Pasuruan, and Magetan, the top three regencies concerning average
group EE, are not efficient in their TGR value and MFEE values. Mills in all regencies whose
group mean EE is greater than their mean TGR values. It can be concluded that the
inefficiency of MFEE is concerned with the technology used in this group rather than their
operational management within their mills. The mean value of group EE, TGR, and MFEE in
table (4) shows that the mean value of group EE of mills in East Java is 0.5484, showing that
East Java could decrease in energy use up to 54.84% of real energy input by a given level of
same inputs, output, and production technology in East Java. The mean TGR of East Java,
0.3016, shows that East Java could reduce energy inputs by another 69.84% (1-0.3016)
keeping the same inputs and output and best available technology. In total, East Java could
decrease energy consumption by 79.98% (1-0.2002) using meta-technology.
Table 4: Average value of EE, TGR, and MFEE
Group 1 (East Java) EE TGR MFEE
Bondowoso 0.6043 0.3811 0.2303
Jember 0.4638 0.3629 0.1683
Jombang 0.6300 0.3725 0.2347
Kediri 0.4385 0.1920 0.0842
Lumajang 0.6193 0.3004 0.1860
Madiun 0.6118 0.3385 0.2071
Magetan 0.6490 0.3819 0.2478
Malang 0.4276 0.2728 0.1166
Mojokerto 0.5154 0.2426 0.1250
Nganjuk 0.4042 0.2351 0.0950
Ngawi 0.5904 0.2814 0.1661
Pasuruan 0.6677 0.4633 0.3093
% of Cappri (𝛿5) -0.2234* -2.5975 -0.0698** -2.4460 -0.5822*** 1.7195
% of capfor (𝛿6) -0.2862** -2.3976 -0.0679** -2.2612 -0.6746*** -1.7294
Sigma-squared (𝜎2) 2.6348* 3.4926 5.2195* 8.4515 33.3331*** 1.6458
Gamma (γ) 0.6350* 4.7006 99.9999* 5450669.9 0.9532* 35.7018
Log Likelihood -251.84 -289.58 -739.15
* sig at 1%, ** sig at 5%, *** sig at 10%
Source: Compilation by the author

Jurnal Akuntansi ISSN 2303-0356
Vol. 11, No.1, February, 2021 Hal. 53-66
63
Probolinggo 0.6069 0.3239 0.1965
Sidoarjo 0.3899 0.1744 0.0680
Situbondo 0.6709 0.3906 0.2621
Tunungagung 0.4661 0.2244 0.1046
Mean 0.5484 0.3016 0.2002
Source: Compilation by the author
In the table (5), in group 2, the mills in Kendal, Central Java province, is the highest
mean energy efficiency scores and the value is 0.7767, implying that mills in this province can
reduce 77.67% of energy use in their production process by using the same inputs, output, and
same technology. Mills in other regencies could not well-perform in energy use. In group 2,
Kendal (Central Java province), Barru (South Sulawesi province), and Bantul (Daista
Yogyakarta) have a greater value of average TGR compared with mills in other regencies.
Mills in Serang, Bantan province, is the lowest TGR and the value is 0.0003. According to
this figure, the technology gap between mills in each regency is very large. In group 2, the
group means EE of most of the regencies is low and their MFEE value is also low. Mills in all
regencies except Serang, Tegal, Cirebon, Pemalang, and Pati whowho'san TGR is greater than
the group means EE. It can be said that the inefficiency of the MFEE in this group comes
from operational inefficiency rather than the technology gap used in this group. In the table
(5), the results of other provinces showed that the mean group EE is 0.2334, showing that
other provinces could decrease energy inputs by 23.34% of actual energy input by keeping the
same other inputs and outputs with the available technology in these provinces. The value of
mean TGR (0.2506) means that other provinces could reduce the energy input by another
74.94% (1-0.2506) keeping the same inputs and output with the best available technology.
Overall, other provinces could reduce energy consumption by 88.66% (1-0.1134) by applying
meta-technology. According to this data, group EE, TGR, and MFEE show that East Java can
perform better than other provinces.
Table 5: Average value of EE, TGR, and MFEE of group 2
Group 2 (other povinces) EE TGR MFEE
Serang 0.0021 0.0001 0.0000003
Cilegon 0.2571 0.2880 0.0740
Bantul 0.4109 0.6703 0.2755
Boalemo 0.3271 0.5916 0.1935
Cirebon 0.1176 0.0799 0.0094
Majalengka 0.1983 0.4222 0.0837
Subang 0.1596 0.3772 0.0602
Tegal 0.0350 0.0201 0.0007
Kudus 0.0662 0.0568 0.0038
Brebes 0.1247 0.2377 0.0296
Pekalongan 0.4378 0.5177 0.2267
Pemalang 0.1590 0.1349 0.0214
Klaten 0.2383 0.3915 0.0933
Sragen 0.0585 0.0596 0.0035
Karanganyar 0.2726 0.3185 0.0868
Pati 0.3721 0.3572 0.1329
Kendal 0.7767 0.8017 0.6227
Tulang Bawang 0.0928 0.2342 0.0217
Tanggamus 0.0516 0.0570 0.0029
Waykanan 0.4045 0.6400 0.2589

ENERGY EFFICIENCY OF INDONESIA’S SUGAR INDUSTRY BASED ON ECONOMIC FRAMEWORK:
STOCHASTIC METAFRONTIER ANALYSIS
Thinzar Win, Dyah Wulan Sari and Tri Haryanto
64
East Lampung 0.1098 0.4429 0.0486
Barru 0.4814 0.6643 0.3198
Takalar 0.2235 0.4706 0.1052
Ogan Ilir 0.1683 0.3461 0.0582
Toba samosir 0.0790 0.0586 0.0046
Mandailing Natal 0.0692 0.1315 0.0091
Mean 0.2334 0.2506 0.1134
Source: Compilation by the author
CONCLUSIONS AND SUGGESTION
In this study, the energy efficiency of the sugar industry from 2010 to 2014 are
examined under the meta stochastic frontier approach. The energy efficiency of Indonesia's
sugar industry is still low in both the meta-frontier or group frontier. This means that there is
a large room to save energy consumption in this industry. During the study period, the score
of average TGR in East Java is slightly larger than the value of average TGR in other
provinces. But the value of average TGR is lower than the value of group average EE in East
Java and higher than in other provinces. According to this, East Java needs to focus more on
their production environment and other provinces need to focus more on their operational
environment. The score of energy efficiency in the group frontier is greater than the meta
frontier, which indicates that there is a considerable technological gap between the group
frontier and meta-frontier. Another reason for lowering MFEE is a low level of group EE. In
conclusion, both provinces need to focus both on operational and production environments
closer to the meta frontier. For the environmental factors affecting energy efficiency, the age
of the mills has an effect on energy efficiency in East Java. The size of the mills has an effect
on energy efficiency in both groups and it also affects the TGR.
The outcome of this study also provides the following policy suggestions. To achieve
energy saving in the sugar industry, the government should create the opportunity for
advanced technology, should invite the technical know-how from abroad, and also provide
technological training. In terms of managerial aspects, the owners of the mills need to
eliminate the old production apparatus which consumes a huge amount of energy in the
production process. Large technological gap levels will be a barrier in the long run progress of
efficiency of total energy use in the sugar industry. To close this gap, policymakers should
consider the appropriate policy for each province. The owner of mills, they should consider
their managerial environment to increase their efficiency in energy and need to replace old
technology with the new one to upgrade the technology. Finally, the industry-specific
environmental factors that may have a possible impact on meta-frontier energy efficiency
(MFEE) will be considered for further study. This can provide more specific information for
effective policies.

Jurnal Akuntansi ISSN 2303-0356
Vol. 11, No.1, February, 2021 Hal. 53-66
65
REFERENCES
Azhari, R. (2018). Analysis of efficiency of sugar industry in Indonesia (2000-2014).
[Unpublished thesis]. Universitas Sriwijaya.
Battese, G. E., & Coelli, T. J. (1995). A Model for Technical Inefficiency Effects in a
Stochastic Frontier Production Function for Panel Data. Empirical Economics, 20, 325–
332.
Geroski, P. A. (2000). Models of technology diffusion. Research Policy, 29(4–5), 603–625.
Haider, S., Danish, M. S., & Sharma, R. (2019). Assessing energy efficiency of Indian paper
industry and influencing factors: A slack-based firm-level analysis. Energy Economics,
81, 454–464.
Hall, B. H., & Khan, B. (2002). Adoption of new Technology. New Economy Handbook, 38.
University of California at Berkeley.
Hayami, Y., & Ruttan, V. W. (1970). Agricultural Productivity Differences among Countries.
American Economic Review, 60(5), 895–911.
Honma, S., & Hu, J. L. (2018). A meta-stochastic frontier analysis for energy efficiency of
regions in Japan. Journal of Economic Structures, 7(1), 21. Springer Berlin Heidelberg.
Retrieved from https://doi.org/10.1186/s40008-018-0119-x
Hsiao, W. L., Hu, J. L., Hsiao, C., & Chang, M. C. (2019). Energy efficiency of the baltic sea
countries: An application of stochastic frontier analysis. Energies, 12(1), 104.
Huang, C. J., Huang, T. H., & Liu, N. H. (2014). A new approach to estimating the
metafrontier production function based on a stochastic frontier framework. Journal of
Productivity Analysis, 42(3), 241–254.
International Center for Applied Finance and Economics. (2018). Market Study on Food
Sector in Indonesia. Jakarta
Irawan, T., Hartono, D., & Achsani, N. A. (2010). An Analysis Of Energy Intensity In
Indonesian Manufacturing ( No. 201007). Working Paper in Economics and
Development Studies, No. 21007.
ISO. (2019). International Sugar Organization, Sugar Year Book. London.
Mandal, S. K., & Madheswaran, S. (2011). Energy use efficiency of Indian cement
companies: A data envelopment analysis. Energy Efficiency, 4(1), 57–73.
McDonald, G., & Meylinah, S. (2019). Indonesia Sugar Annual Report 2019. Global
Agricultural Information Network.
Ministry of Industry. (2012). Planning for Industrial Sector Energy Demand in the Context of
Accelerated Industrialization, Indonesia. Jakarta.

ENERGY EFFICIENCY OF INDONESIA’S SUGAR INDUSTRY BASED ON ECONOMIC FRAMEWORK:
STOCHASTIC METAFRONTIER ANALYSIS
Thinzar Win, Dyah Wulan Sari and Tri Haryanto
66
Nelson, R., & Winter, S. G. (1982). An Evolutionary Theory of Economic Change (First edit.).
The Belknap Press of Harvard University Press.
Priambodo, A., & Kumar, S. (2001). Energy use and carbon dioxide emission of Indonesian
small and medium scale industries. Energy Conversion and Management, 42(11), 1335–
1348.
Ramstetter, E. D., & Narjoko, D. (2014). Ownership and Energy Efficiency in Indonesian
Manufacturing. Bulletin of Indonesian Economic Studies, 50(2), 255–276.
Sugiharti, L., Purwono, R., Primanthi, M. R., & Padilla, M. A. E. (2017). Indonesian
productivity growth: Evidence from the manufacturing sector in Indonesia. Journal of
Social Sciences and Humanities, 25(November), 29–44.
Susila, W. R., & Sinaga, B. M. (2005). Analysis Policy of National Sugar Industry. Jurnal
Agro Ekonomi, 23(1).
United Nations Industrial Development Organization. (2017). Sugar Mill Sector Pagottan
Sugar Mill PTPN-XI East Java, Indonesia, Resource Efficient and Cleaner Production
Program.
Vivadinar, Y., Purwanto, W. W., & Saputra, A. H. (2012). What are the Key Drivers of
Energy Intensity in Indonesia Manufacturing Sectors ? International Congress on
Informatics, Environment, Energy and Applications-IEEA 2012, 38.
Vivadinar, Y., Purwanto, W. W., & Saputra, A. H. (2016). Tracing the energy footprints of
Indonesian manufacturing industry. Energy Science and Engineering, 4(6), 394–405.
Zhou, P., Ang, B. W., & Zhou, D. Q. (2012). Measuring economy-wide energy efficiency
performance: A parametric frontier approach. Applied Energy, 90(1), 196–200. Elsevier
Ltd. Retrieved from http://dx.doi.org/10.1016/j.apenergy.2011.02.025