energy efficiency opportunities for pulp and paper
TRANSCRIPT

ENERGY EFFICIENCY OPPORTUNITIES FOR PULP AND
PAPER INDUSTRY IN SOUTH AFRICA: BARRIERS,
DRIVERS AND TECHNICAL OPPORTUNITIES
BY
HILTON MAVERENGO
Dissertation submitted in fulfilment of the academic requirements for the degree
of Master of Science in Mechanical Engineering
216063085
Supervisor: Professor Freddie L. Inambao
Co-Supervisor: Dr Samuel Ilupeju
AUGUST
2017

ii
“As the candidate’s Supervisors we agree to the submission of this dissertation”.
Prof. Freddie Inambao
…………………………………………………………………………………………………………………………………………………………
NAME OF SUPERVISOR SIGNATURE
Dr. S. Illupeju
……………………………………………………… …………………………………………………………………………………………………
NAME OF CO-SUPERVISOR SIGNATURE

iii
COLLEGE OF AGRICULTURE, ENGINEERING AND SCIENCE
DECLARATION 1 – PLAGIARISM
I, Hilton Maverengo, declare that:
1. The research reported in this dissertation, except where otherwise indicated is my
original research.
2. This dissertation had not been submitted for any degree or examination at any
university.
3. This dissertation does not contain other persons’ data, pictures, graphs or other
information, unless specifically acknowledged as being sourced from other persons
4. This dissertation does not contain other persons’ ‘writing, unless specifically
acknowledged as being sourced from other researchers. Where other written sources
have been quoted then:
a. Their words have been rewritten but the general information attributed to them
has been referenced; and
b. Where their exact words have been used, their writing has been placed in italics
and inside quotation marks and referenced.
5. The dissertation does not contain text, graphics or tables copied and pasted from
internet, unless specifically acknowledged, and the source being detailed in the
dissertation and in the Reference sections
Signed…… … ……………………………… Date: 16/08/2017…………………

iv
DECLARATION 2 – PUBLICATIONS
DETAILS OF CONTRIBUTION TO PUBLICATIONS that form part and/or include research
presented in this dissertation (include publications in preparation, submitted, in press and
published and give details of the contributions of each author to the experimental work and
writing of each publication).
Publication 1: S. Illupeju, H. Maverengo, F. L. Inambao, and M. Mutombo. Energy
Efficiency Evalution for Pulp and paper Mills in South Africa. International
Journal of Energy Research for Africa (ACCEPTED)

v
ACKNOWLEDGEMENTS
I would firstly like to thank Professor F. Inambao for all his input, advice, and encouragement
throughout the research, along with my co-supervisor Dr Samuel Ilupeju who was always being
on hand to provide helpful comments. I am indebted to the pulp mill management where the
energy audit was conducted and to the employees for their excellent co-operation and
assistance during the course of this study. They were extremely co-operative in providing the
wide range of information and data requested, and several are to be especially commended for
their patience in explaining certain points repeatedly and in great depth when requested. They
are very friendly and always in Great Spirit. I am very grateful to all those who piloted and
responded to the survey questions, and took an interest in the research.
I am also grateful to University of KwaZulu-Natal for providing me with the opportunity to
carry out my research, may they continue to offer the same chance to those who need the same
opportunity to further their studies.

vi
ABSTRACT
This research work was focused on verifying the sources of energy losses throughout the
pulping process in a pulp mill in South Africa. In addition to that, a case study on barriers and
drivers to energy efficiency adoption by this sector was conducted. The energy efficiency
options that were examined by this research focus on how to identify areas of energy losses
and then based on the results identify energy saving potential. A total of 10 projects were
identified with an energy saving of R3 429 250 which required an investment of R1 718 640
for implementation. Initially an energy use and loss analysis was conducted and it was found
that a total of 629 207 GJ/M energy units were lost by the pulp mill and that the major energy
losses are occurring in energy distribution channels, boilers and electricity generation units and
due to equipment inefficiency. Corrective measures that were recommended to curb the losses
for boiler and electricity generation units included use of heat stored in wet scrubbers to pre-
heat boiler feed water, reduction of pre-heating boiler feed water using low pressure steam
when turbines are not being used, increasing electricity production by decreasing low pressure
steam network operating pressure. Other conservation measures such as aiming to reduce
excess oxygen levels to between 4% and 6% at the coal fired boilers, and installation of a flash
tank at the coal fired boilers blowdown and inject that steam to low pressure network were
recommended. Electricity distribution losses can be achieved by repairing of leaking steam
pipes and broken steam traps on site, proper management of steam venting by either using
steam pipes, deaerator tanks, or demineralized water tanks as steam accumulators/sinks. This
analysis serves as a benchmark for present day pulping methods and as a basis for stimulating
advancement towards more energy efficient utilization in that sector. Although the accuracy of
the final results of this research were heavily dependent upon the accuracy of Pulp Mill A data
records, the savings discussed act as a reference point and can assist the pulp mill to identify
potential projects that need more detailed measurements for further action.
The objectives of this dissertation were, firstly, to study energy consumption patterns for a pulp
mill with a view to identifying areas of energy loss, and, secondly, to study barriers and drivers
to energy efficiency using the same pulp mill as a case study. Starting with the development of
an energy consumption inventory, detailed energy auditing activities were conducted with a
particular focus on rationalizing the energy profiles. Following the establishment of an energy

vii
consumption profile, the potential energy saving opportunities were identified. The findings of
the energy survey can be used as a reference for management in supporting commercial
decisions.
The barriers to energy efficiency audit reviewed the most prevalent barriers impeding adoption
of proven energy conservation technologies including financial, economic and market barriers
followed by uncertainty barriers, technological and finally institutional and organizational
barriers.
Recommended action plans were for government to put in place incentives for energy
efficiency and to start promoting energy auditing for energy intensive industries. Specific
sector energy surveys were also noted to yield substantial returns towards reduction energy
use.
The research concluded that pulp mill energy efficiency analysis can significantly help the pulp
and paper industry improve its energy efficiency and reduce its CO2 emissions since it is able
to identify areas of energy losses.
Key words: Energy Efficiency, Pulp and Paper, Barriers, Drivers, Opportunities

viii
TABLE OF CONTENTS
DECLARATION 1 – PLAGIARISM.................................................................................. iiii
DECLARATION PUBLICATIONS………………………………………………………iv
ACKNOWLEDGEMENTS .................................................................................................... v
ABSTRACT ............................................................................................................................ vii
TABLE OF CONTENTS ................................................................................................... viiii
LIST OF FIGURES ............................................................................................................ xiiii
LIST OF TABLES ............................................................................................................. xiiiii
SYMBOLS AND ABBREVIATIONS ............................................................................... xivv
CHAPTER 1 : INTRODUCTION .................................................................................. 1-- 1 -
1.1 Context and Justification ...................................................................................... 1-- 1 -
1.2 Background and Motivation for the Study ........................................................... 1-- 2 -
1.3 Pulp and Paper Industry ....................................................................................... 1-- 6 -
1.3.1 Energy Use in the Pulp and Paper Industry ................................................. 1-- 7 -
1.4 Objectives and Research Questions ..................................................................... 1-- 8 -
1.5 Research Limitations ........................................................................................... 1-- 9 -
1.6 Thesis Layout ....................................................................................................... 1-- 9 -
CHAPTER 2 : LITERATURE REVIEW ................................................................... 2-- 10 -
2.1 Introduction ........................................................................................................ 2-- 10 -
2.2 Energy Efficiency Research Work in the Pulp and Paper industry ................... 2-- 10 -
2.3 Understanding Energy Efficiency ...................................................................... 2-- 13 -
2.4 Potential for Industrial Energy Efficiency Improvement in South Africa Pulp and
paper Industry. ................................................................................................... 2-- 14 -
2.5 Reasons for Companies Not Adopting Energy Efficiency Measures? .............. 2-- 15 -
CHAPTER 3 : ENERGY EFFICIENCY OPPORTUNITIES FOR THE PULP AND
PAPER INDUSTRY ...................................................................................................... 3-- 17 -
3.1 Introduction ........................................................................................................ 3-- 17 -
3.2 Steam Systems ................................................................................................... 3-- 17 -
3.2.1 Boiler System Energy Conservation Measures.......................................... 3-- 18 -
ix
3.2.2 Steam Distribution System Energy Efficiency Measures .......................... 3-- 21 -
3.3 Motor Systems ................................................................................................... 3-- 23 -
3.4 Pumps ................................................................................................................. 3-- 26 -
3.5 Compressed Air System ..................................................................................... 3-- 30 -
3.6 Lighting .............................................................................................................. 3-- 32 -
3.7 Bleaching ........................................................................................................... 3-- 33 -
3.8 Chemical Recovery ............................................................................................ 3-- 34 -
3.9 Summary ............................................................................................................ 3-- 35 -
CHAPTER 4 : THEORY AND METHODS ............................................................... 4-- 36 -
4.1 Introduction ........................................................................................................ 4-- 36 -
4.2 System Theory ................................................................................................... 4-- 36 -
4.2.1 Definition of “System” .............................................................................. 4-- 36 -
4.2.2 System Boundaries..................................................................................... 4-- 37 -
4.3 Case Study ......................................................................................................... 4-- 37 -
4.3.1 Case Study as Strategy for Industrial Energy Systems Research .............. 4-- 37 -
4.3.2 Validity of Case Study ............................................................................... 4-- 38 -
4.3.3 Conclusions from Case Studies ................................................................. 4-- 39 -
4.4 Energy Auditing ................................................................................................. 4-- 39 -
4.5 Analysis of Data Collected from Energy Audit Using Energy Footprint Model 4-- 40
-
4.6 Barriers and Drivers Investigation Methodology .............................................. 4-- 40 -
4.7 Summary ............................................................................................................ 4-- 42 -
CHAPTER 5 : BARRIERS AND DRIVERS FOR ENERGY EFFICIENCY ......... 5-- 43 -
5.1 Introduction ........................................................................................................ 5-- 43 -
5.2 Background to Barriers and Drivers for Energy Efficiency Adoption .............. 5-- 43 -
5.3 Barriers to Energy Efficiency in Pulp and Paper Industry ................................. 5-- 44 -
5.3.1 Financial, Economic and Market Barriers ................................................. 5-- 44 -
5.3.2 Technological Barriers ............................................................................... 5-- 48 -
5.4 Drivers for Energy Efficiency Improvement ..................................................... 5-- 50 -
5.5 Summary ............................................................................................................ 5-- 51 -
CHAPTER 6 : ENERGY MANAGEMENT ............................................................... 6-- 52 -
6.1 What Is Energy Management? ........................................................................... 6-- 52 -

x
6.2 Energy Management Practices ........................................................................... 6-- 53 -
6.3 Energy Teams .................................................................................................... 6-- 55 -
6.4 Summary ............................................................................................................ 6-- 56 -
CHAPTER 7 : ENERGY ANALYSIS OF PULP MILL A ........................................ 7-- 57 -
7.1 Introduction ........................................................................................................ 7-- 57 -
7.2 Case Study of Energy Consumption and Loss Analysis .................................... 7-- 57 -
7.2.1 Audit Approach .......................................................................................... 7-- 57 -
7.2.2 Plant Description ........................................................................................ 7-- 57 -
7.3 Findings from Observations ............................................................................... 7-- 59 -
7.3.1 Instrumentation .......................................................................................... 7-- 59 -
7.3.2 Management and Organization .................................................................. 7-- 59 -
7.4 Energy Scenario for Mill A ................................................................................ 7-- 60 -
7.4.1 Benchmarking Comparison ....................................................................... 7-- 61 -
7.5 Analysis of Mill A Energy Losses Methodology .............................................. 7-- 62 -
7.5.1 Step 1: Questionnaire ................................................................................. 7-- 62 -
7.5.2 Step 2: Total Energy Supply, 513 082 GJ/M ............................................. 7-- 63 -
7.5.3 Step 3:. Central Energy Generation/ Utilities 1 281 098 GJ/M ................. 7-- 63 -
7.5.4 Step 4: Energy Distribution, 1 086 098 GJ/M ........................................... 7-- 64 -
7.5.5 Step 5: Energy Conversion, 815 446 GJ/M ............................................... 7-- 65 -
7.5.6 Step 6: Process Energy Use, 622 291 GJ/M .............................................. 7-- 66 -
7.6 Energy Loss Analysis ........................................................................................ 7-- 67 -
7.7 Energy Conservation Opportunities ................................................................... 7-- 70 -
7.8 Energy Saving Evaluation .................................................................................. 7-- 71 -
7.9 Other Identified Energy Efficiency Opportunities ............................................. 7-- 72 -
7.9.1 Substitution of V-Belts with Flat Belts in Chipper Drives ........................ 7-- 72 -
7.9.2 Installation of VFD on Recycle Pump to Tower 3 .................................... 7-- 73 -
7.9.3 Boiler 4 FD Fan Change of Material Design ............................................. 7-- 74 -
7.9.4 Chlorine Plant Hot Water Pump Replacement .......................................... 7-- 74 -
7.9.5 Vacuum Pumps Replacement With New Energy Efficient in the Chlorine
Dioxide Plant ............................................................................................. 7-- 75 -
7.9.6 Installation of a Metallic Gate for Easy Movement of Wood in the Water Channel
.................................................................................................................... 7-- 76 -

xi
7.10 Summary of Energy Conservation Opportunities .............................................. 7-- 77 -
7.11 Other Unquantified Identified Projects .............................................................. 7-- 77 -
7.12 Summary ............................................................................................................ 7-- 78 -
CHAPTER 8 : RESULTS AND DISCUSSIONS FROM QUESTIONNIARES ON
BARRIERS AND DRIVERS TO ENERGY EFFICIENCY ..................................... 8-- 79 -
8.1 Results from Questionnaires .............................................................................. 8-- 79 -
8.1.1 Analysis Results of Financial, Economic and Market Barriers ................. 8-- 79 -
8.1.2 Analysis of Results of Institutional, Organizational and Behavioral Barriers .. 8--
80 -
8.1.3 Analysis of Results of Technological Barriers .......................................... 8-- 81 -
8.1.4 Analysis of Results of Uncertainty ............................................................ 8-- 82 -
8.2 Discussion of Results ......................................................................................... 8-- 83 -
8.2.1 Merging Qualitative and Quantitative Findings on Barriers and Drivers .. 8-- 83 -
8.2.2 Specific Barriers and Drivers to Energy Efficiency Adoption .................. 8-- 86 -
8.2.3 Results of Most Significant Barriers .......................................................... 8-- 86 -
8.2.4 Significant Drivers ..................................................................................... 8-- 88 -
CHAPTER 9 : CONCLUSIONS AND RECOMMENDATIONS ............................. 9-- 90 -
9.1 RECOMMENDATIONS ................................................................................... 9-- 91 -
REFERENCES ............................................................................................................... 9-- 92 -
APPENDICES .............................................................................................................. 9-- 102 -
xii
LIST OF FIGURES
FIGURE 1-1: CO2 EMISSIONS (KILOTONS) PER YEAR FOR SOUTH AFRICA ........................................................ 1-- 3 -
FIGURE 1-2: FUTURE PROJECTED BASELINE UP TO 2030 FOR ENERGY SECTOR GREENHOUSE GAS EMISSIONS IN
SOUTH AFRICA ...................................................................................................................................... 1-- 3 -
FIGURE 1-3: PROJECTED ELECTRICITY DEMAND BY SECTOR FOR SOUTH AFRICA ............................................ 1-- 5 -
FIGURE 1-4: MAJOR ENERGY DEMAND PER SECTOR FOR FUEL IN SOUTH AFRICA ............................................ 1-- 6 -
FIGURE 1-5: MAJOR ENERGY USES OF PAPER MANUFACTURING BY END USE ENERGY TYPE IN 2002 ................ 1-- 8 -
FIGURE 3-1: STEAM LOOP .............................................................................................................................. 3-- 18 -
FIGURE 3-2: SCHEMATIC VIEW OF A RECOVERY BOILER OF A SULPHITE PULP MILL (BACKMAN ET AL., 1983) 3-- 19 -
FIGURE 3-3: MAJOR APPLICATION OF ELECTRIC MOTORS ON P&P INDUSTRY ................................................ 3-- 24 -
FIGURE 3-4: VARIABLE FREQUENCY DRIVE (ALESSON, 1995) ...................................................................... 3-- 25 -
FIGURE 3-5: LIFE CYCLE OF OWNING A PUMP (HASANBEIGI AND PRICE, 2012) ............................................. 3-- 26 -
FIGURE 3-6: CONVENTIONAL PUMPING SYSTEM (TOTAL EFFICIENCY = 31%) VS ENERGY EFFICIENT PUMPING SYSTEM
PUMPING COMBINING TECHNOLOGIES (TOTAL EFFICIENCY = 72%) ...................................................... 3-- 27 -
FIGURE 3-7: THROTTLING VALVE (ALESSON, 1995) ...................................................................................... 3-- 29 -
FIGURE 3-8: COMPRESSED AIR PLANT DIAGRAM .......................................................................................... 3-- 30 -
FIGURE 4-1: RESEARCH METHODOLOGY FLOW SCHEME ................................................................................ 4-- 41 -
FIGURE 6-1: DEMING'S CIRCLE ...................................................................................................................... 6-- 53 -
FIGURE 7-1: PROCESS FLOW DIAGRAM FOR PULP MILL A ............................................................................. 7-- 58 -
FIGURE 7-2: SPECIFIC STEAM CONSUMPTION TREND PER TON OF PRODUCTION ............................................. 7-- 60 -
FIGURE 7-3: SPECIFIC ELECTRICITY CONSUMPTION PER TON OF PRODUCTION ............................................... 7-- 61 -
FIGURE 7-4: SPECIFIC COAL CONSUMPTION TREND ....................................................................................... 7-- 61 -
FIGURE 7-5: PULP MILL A, ENERGY FLOW PROFILE FOR 2014 ....................................................................... 7-- 66 -
FIGURE 7-6: ENERGY SUPPLY PERCENTAGES ................................................................................................ 7-- 67 -
FIGURE 7-7: PRIMARY ENERGY USE DISTRIBUTION FOR PULP MILL A ........................................................... 7-- 68 -
FIGURE 7-8: ANALYSIS OF ENERGY LOSSES ................................................................................................... 7-- 69 -
FIGURE 7-9: METALLIC MOVABLE GATE ....................................................................................................... 7-- 76 -
FIGURE 8-1: RESULTS OF FINANCIAL, ECONOMIC AND MARKET BARRIERS .................................................... 8-- 79 -
FIGURE 8-2: RESULTS OF INSTITUTIONAL, ORGANIZATIONAL AND BEHAVIORAL BARRIERS .......................... 8-- 81 -
FIGURE 8-3: RESULTS OF TECHNOLOGICAL BARRIERS ................................................................................... 8-- 82 -
FIGURE 8-4: RESULTS OF UNCERTAINTY TO THE UPTAKE OF ENERGY EFFICIENT TECHNOLOGIES .................. 8-- 83 -
FIGURE 8-5: THE AVERAGE SIGNIFICANCE OF BARRIER CATEGORIES ............................................................. 8-- 84 -
FIGURE 8-6: RESULTS OF POLICY AND INSTITUTIONAL INSTRUMENTS ON THE ADOPTION OF ENERGY EFFICIENT
MEASURES ........................................................................................................................................... 8-- 85 -

xiii
LIST OF TABLES
TABLE 3-1: SUMMARY OF ENERGY EFFICIENCY MEASURES FOR BOILERS ...................................................... 3-- 19 -
TABLE 3-2: IMPLEMENTED ENERGY EFFICIENCY OPPORTUNITIES FOR BOILER ENERGY SAVINGS ................... 3-- 21 -
TABLE 3-3: SUMMARY OF STEAM DISTRIBUTION SAVINGS AND BENEFITS ..................................................... 3-- 22 -
TABLE 3-4: IMPLEMENTED ENERGY EFFICIENCY OPPORTUNITIES FOR STEAM SYSTEMS................................. 3-- 23 -
TABLE 3-5: IMPLEMENTED ENERGY EFFICIENCY PROJECTS FOR PUMPS ......................................................... 3-- 30 -
TABLE 3-6: IMPLEMENTED ENERGY EFFICIENCY PROJECTS FOR AIR COMPRESSED SYSTEM ........................... 3-- 32 -
TABLE 7-1: ENERGY SCENARIO FOR MILL A ................................................................................................. 7-- 60 -
TABLE 7-2: SPECIFIC ENERGY CONSUMPTION OF BEST PRACTICE (BP) AND PULP MILL A ............................ 7-- 62 -
TABLE 7-3: ENERGY SUPPLY FOR 2014 .......................................................................................................... 7-- 63 -
TABLE 7-4: OTHER ENERGY CONVERSION LOSSES ......................................................................................... 7-- 65 -
TABLE 7-5: ANALYSIS OF MACHINE DRIVE LOSSES ........................................................................................ 7-- 66 -
TABLE 7-6: PRIMARY ENERGY USE ................................................................................................................ 7-- 68 -
TABLE 7-7: ONSITE ENERGY LOSS PROFILE.................................................................................................... 7-- 69 -
TABLE 7-8: SUMMARY OF UTILITIES CONSUMPTION FIGURES FOR 2014 ........................................................ 7-- 71 -
TABLE 7-9: SUMMARY OF UTILITIES COSTS ................................................................................................... 7-- 71 -
TABLE 7-10: EVALUATION OF SAVING POTENTIAL ........................................................................................ 7-- 72 -
TABLE 7-11: OPERATION DATA FOR CHIPPER WITH POTENTIAL ENERGY SAVING AT MILL A......................... 7-- 73 -
TABLE 7-12: INVESTMENT SAVINGS AND PAYBACK IN RANDS ...................................................................... 7-- 73 -
TABLE 7-13: INVESTMENT SAVINGS AND PAYBACK IN RANDS ...................................................................... 7-- 73 -
TABLE 7-14: INVESTMENT SAVINGS AND PAYBACK IN RANDS ...................................................................... 7-- 74 -
TABLE 7-15: ENERGY CONSUMPTION AND SAVING POTENTIAL OF COOLING TOWER PUMPS IN THE CHLORINE PLANT
............................................................................................................................................................ 7-- 75 -
TABLE 7-16: INVESTMENT SAVING AND PAYBACK IN RANDS ........................................................................ 7-- 75 -
TABLE 7-17: SPECIFICATIONS OF VACUUM PUMPS ......................................................................................... 7-- 75 -
TABLE 7-18: INVESTMENT SAVING AND PAYBACK IN RANDS ........................................................................ 7-- 76 -
TABLE 7-19: INVESTMENT SAVINGS AND PAYBACK IN RANDS ...................................................................... 7-- 77 -
TABLE 7-20: SUMMARY OF THE COST SAVINGS AND INVESTMENT OPPORTUNITIES ....................................... 7-- 77 -
TABLE 8-1: MOST SIGNIFICANT BARRIERS TO THE ADOPTION OF ENERGY EFFICIENT TECHNOLOGIES ............ 8-- 86 -

xiv
SYMBOLS AND ABBREVIATIONS
ASDs Adjustable Speed Drives
CADDET Centre for the Analysis and Dissemination of Demonstrated Energy
Technologies
ClO2 Chlorine dioxide
CO Carbon monoxide
CO2 Carbon dioxide
Dept Department
FRP Fibre Reinforced Plastic
GJ/M Giga Joules/Month
HFO Heavy Fuel Oil
IAC Industrial Assessment Centre
IEA International Energy Agency
IRR Internal rate of return
NPV Net present value
KBS Knowledge based systems
LPG Low Pressure Gas
MWh Mega Watt hours
NOx Nitrogen oxides
OECD Organisation for Economic Co-operation and Development
P&P Pulp and Paper

xv
SA South Africa
SSL Spent Sulphite Liquor
SDB Social Desirability Bias
UN United Nations
U.S. United States
VFDs Variable frequency drives
1-- 1 -
CHAPTER 1 : INTRODUCTION
The aim of this chapter is to introduce the research topic to the reader. The chapter will present
context and justification followed by background and motivation for research. Finally, it will
discuss the research purpose and limitations.
1.1 Context and Justification
Global concerns about declining resources and climate change mean that industries must do
their best to use energy as efficiently as possible. The pulp and paper (P & P) industry is one
of the most energy intensive industries in the world and it is vital that an effort is made to help
this sector reduce its energy use. According to Parry (2007) energy efficiency remains the only
option to reduce the threat posed by climate change to the survival of the environment. In
addition, in any industry the top three operating expenses are raw materials, labor and energy.
If one were to relate to manageability of the cost or potential cost savings in each of the above
components, energy would invariably emerge as the top ranker, and thus energy management
function constitutes a strategic area for cost reduction. Energy is a key requirement for most
industries and hence the focus of energy performance will result in both cost reduction and
environment survival. The P & P industry is the fourth largest energy user requiring electricity
and heat needed for pulping, paper and pulp drying, black liquor evaporation and some
intermediate operations. Bunse et al. (2011) suggest that this industry is a strategic sector
capable of creating huge energy savings.
In this study energy efficiency improvement measures were quantified after an energy loss
profile identified their location within the pulping processes. An energy flow model with help
of an energy audit was used to quantify energy supply, generation, conversion and end use
thereby exposing areas of energy losses in the mill. This analysis will serve as a benchmark for
current P & P making operations in South Africa, and as a base case for initiating changes
towards more energy efficient energy utilization in this sector. Questionnaires on barriers and
driving forces to energy efficient adoption by this sector were distributed and results analyzed
to come up with practical and achievable recommendations for energy efficiency opportunities
adoption by this sector.

1-- 2 -
1.2 Background and Motivation for the Study
Energy efficiency is fast becoming recognized as one of the most cost effective ways of
meeting the demands for sustainable development. Energy efficiency can result in significant
reduction in greenhouse gas emissions and pulp mill operating costs. (Sebitosi, 2008). The
International Energy AGENCY (IEA) estimates that two thirds of the desired carbon dioxide
emissions reductions worldwide must come from improved energy efficiency, and the balance
from changes in the mix of energy supply technologies (Taylor et al., 2000); (Taylor, 2008).
According to Govender (2008), an increase in gross domestic product of between 1.5% and 4%
can be achieved if current energy efficiency measures were increased and this would result in
energy savings of between 8% to 15%.
The following paragraphs discuss the motivations for energy efficiency improvement in the P
& P industry in greater detail.
Greenhouse Gas Emission Reduction
The dependence of South Africa on fossil fuels has caused the country to be among the world’s
highest carbon dioxide emitters. According to (Tyler, 2010), South Africa is listed as one of
the largest developing country emitters. In 2000, the national energy intensity of South Africa
stood about 3.3 times the average in Organization for Economic Co-operation and
Development (OECD) countries, despite having half the energy consumption per capita as
OECD countries (Sebitosi, 2008).
Figure 1-1, shows the increasing trend in carbon dioxide emissions of South Africa from 1960
to 2006.

1-- 3 -
Figure 1-1: CO2 Emissions (kilotons) per year for South Africa
Source: (Jaffe and Stavins, 1994b)
Within the energy sector, industry was the major producer of greenhouse gas emissions in
2007, a trend that is projected to continue to 2030. This is shown in Figure 1-2.
Figure 1-2: Future projected baseline up to 2030 for energy sector greenhouse gas emissions in South
Africa
Source: (Erickson et al., 2009)
The dependency of South African energy supply on hydrocarbons as traditional and affordable
supply options, has serious consequences in terms of climate change. The role played by CO2
in global warming is becoming a major concern for energy intensive industries, particularly
due to factors that could impact upon business models such as the introduction of a proposed
1-- 4 -
carbon tax and other regulatory mechanisms which could be introduced in an attempt to reduce
emissions. From a manufacturing company’s point of view, new environmental regulations
with associated costs for CO2 emissions are an important driver for energy efficiency.
Companies that improve their energy efficiency and consequently their carbon footprint can
improve their position to face challenges and costs resulting from CO2 regulations (Bunse et
al., 2011).
SA commitment to reduce greenhouse gas emissions
Historically, commitments to greenhouse gas emissions reductions in South Africa have been
voluntary. South Africa joined the Kyoto Protocol in March 2002 although it is a Non-Annex
1 (developing) country, implying that it does not have to reduce its greenhouse gas emissions
in the first commitment period of 2008 to 2012. At the Copenhagen summit, in 2009, South
Africa committed to reduce its greenhouse gas emissions by 34% by 2020 and 42% by 2025
below its business as usual emissions growth trajectory, contingent on technical support and
funding from developed countries (Tyler, 2010).
Energy security
South Africa has experienced blackouts (2008) and fuel shortages in the past (2005), and this
has highlighted the vulnerability of the economy to energy shortages. The electricity power
crisis of 2008 saw a country capacity shortfall of over 10% (5000 MW), leading to load
shedding by Eskom, the national power utility, to stabilize the national power grid (Sebitosi,
2008). As one of the measures in a strategy for meeting the consumer electricity demand and
counteracting the shortfall in 2008, Eskom responded with introducing demand side
management initiatives. The Energy Master Plan of Liquid Fuels recommended that energy
efficiency is a component of energy security and hence it should be highly promoted across
industrial sectors (Tyler, 2010).
Operational costs reduction
Historically South Africa’s low electricity price and labor cost has contributed towards a
competitive industrial economy. South Africa’s electricity price has been among the cheapest
in the world, partly as a result of its abundant coal reserves and over-investment in generating
capacity in the 1980s. This is less than half the price in the UK (Haw and Hughes, 2007). Low

1-- 5 -
energy prices increase energy intensity by attracting energy intensive industries. Low energy
prices also act as a disincentive to save (Sebitosi, 2008). Like most traditional utilities, the
primary objective of the power utility (Eskom) has been to maximize sales (Sebitosi, 2008).
The price of electricity is set to increase in large increments in the next few years. This is to
cover the new generating capacity required to meet on-going increases in demand as shown in
Figure 1-3.
Figure 1-3: Projected electricity demand by sector for South Africa
Source: (Haw and Hughes, 2007)
Furthermore, fuel consumption in industry is increasing as is shown in the historical and
projected demand from 2001 to 2030 (Figure 1-4).

1-- 6 -
Figure 1-4: Major energy demand per sector for fuel in South Africa
(Haw and Hughes, 2007)
Environmental image
Energy efficiency in manufacturing can be a contributor to reducing the total environmental
impact of a product. Consumers’ purchasing behavior is changing in regards to ‘green’ and
efficient products and services, and more and more consumers would like to purchase ‘green
products’ (BCG, 2009 cited in Bunse et al. (2011).
Industrial energy efficiency can enhance environmental performance by reducing CO2 and
other emissions. In addition, energy efficiency can give manufacturing companies a
competitive advantage by mitigating energy price volatility. Thus, energy efficiency can
enhance company reputation. The following section provides an overview of South African
energy policy and energy efficiency objectives for the country.
1.3 Pulp and Paper Industry
The P & P industry is a diverse industry, consisting of many different and complex processes
depending on the pulp and paper grade produced (e.g. tissue, packaging, writing and chemical
pulp). Some companies like the mill in this study exclusively produce pulp, while others cover
a full production cycle from fibre resources to final paper grades. The industry is very capital
intensive and production technologies are mainly based on traditional principles and readily
available technology (Axelsson et al., 2008). Pulp and paper can be produced from virgin pulp
(derived from wood) or recovered paper.

1-- 7 -
1.3.1 Energy Use in the Pulp and Paper Industry
The P & P industry uses and produces large amounts of energy. Approximately two thirds of
its final energy consumption is fuel that is used to produce heat energy, while the remaining
third is electricity, either from external grid or produced on site (Galitsky, 2009). Unlike other
industrial sectors, the P&P industry also produces energy as a byproduct and currently
generates more than 50% of its own energy needs from biomass residue (Galitsky, 2009). This
industry has invested heavily in combined heat and power generation also known as
cogeneration. The industry has further put major efforts in the improvement of its energy
efficiency.
Energy costs have a large impact on the performance of the P & P companies. Pulp and paper
are commodities that are traded on an international market. In order to stay competitive,
controlling energy costs is key. The National Energy Regulator of South Africa approved a
tariff increase of 24.8% for the year starting 1 April 2010, and subsequent increases of 25.8%
and 25.9% in 2011 and 2012 respectively. This resulted in an increasing energy pricing trend
of 41.5 cents per kWh, 52.30 cents per kWh and 65.85 cents per kWh for 2010-2011, 2011-
2012 and 2012-13 financial years respectively (Thopil and Pouris, 2013). In addition to
electricity price increases, electricity usage has been increasing which is largely driven by the
increasing demand in the industrial sector. Figure 1-4 shows the projected increasing South
African sectoral energy demand from 2001 to 2030, where industry is a key consumer (Haw
and Hughes, 2007).
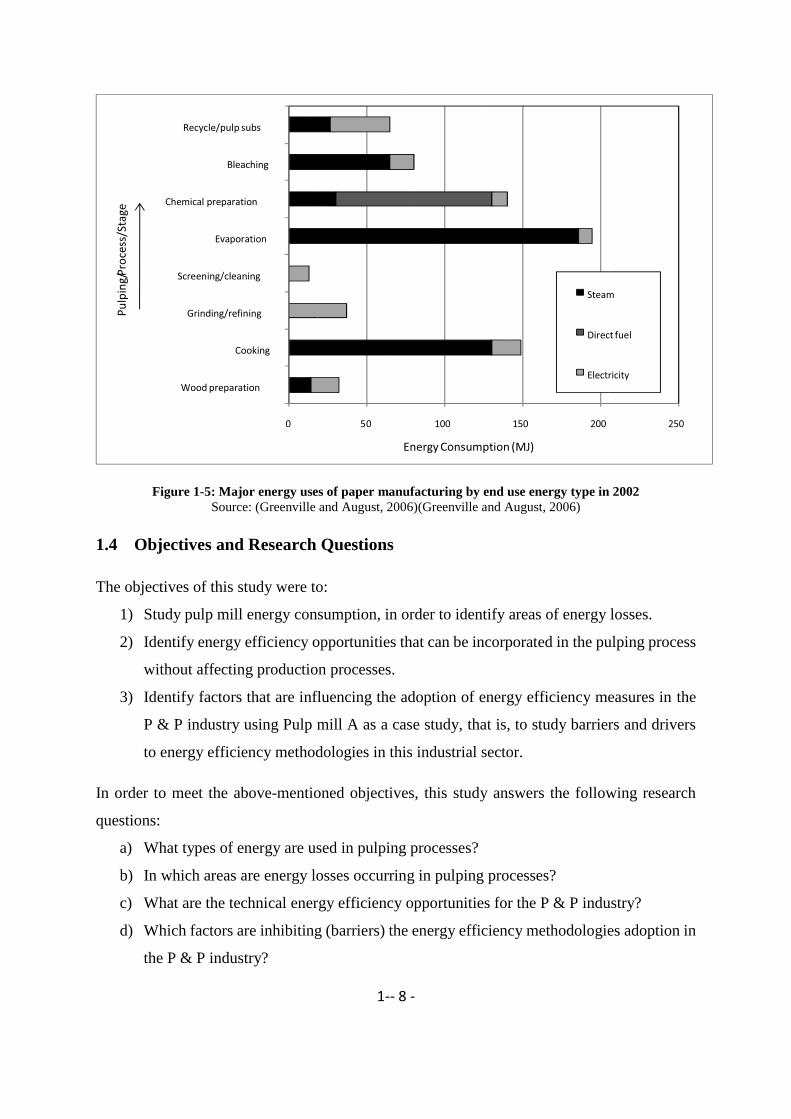
On average, energy costs in the P & P industry are 16% of the production costs and in some
cases up to 30% (Brown et al., 1998), making energy the second largest cost factor after raw
materials, indicating the significant challenges that rising fuel costs bring to the sector. Major
energy uses are shown in Figure 1-5.
1-- 8 -
Figure 1-5: Major energy uses of paper manufacturing by end use energy type in 2002
Source: (Greenville and August, 2006)(Greenville and August, 2006)
1.4 Objectives and Research Questions
The objectives of this study were to:
1) Study pulp mill energy consumption, in order to identify areas of energy losses.
2) Identify energy efficiency opportunities that can be incorporated in the pulping process
without affecting production processes.
3) Identify factors that are influencing the adoption of energy efficiency measures in the
P & P industry using Pulp mill A as a case study, that is, to study barriers and drivers
to energy efficiency methodologies in this industrial sector.
In order to meet the above-mentioned objectives, this study answers the following research
questions:
a) What types of energy are used in pulping processes?
b) In which areas are energy losses occurring in pulping processes?
c) What are the technical energy efficiency opportunities for the P & P industry?
d) Which factors are inhibiting (barriers) the energy efficiency methodologies adoption in
the P & P industry?
Wood preparation
Grinding/refining
Bleaching

1-- 9 -
e) Which factors are driving energy efficiency adoption by the P & P industry?
1.5 Research Limitations
The study was conducted in an organization’s pulp mill; hence it was difficult to collect all the
data required for analysis therefore most of the analysis has been carried out from secondary
data collected from the company records. There have been limitations in obtaining the latest
and current data hence energy consumption analysis is for the year 2014.
Due to company policies and regulations, most organizations do not give all their data due to
piracy and privacy hence some data was not available to us. In some areas taking pictures was
not allowed. We cannot publish all the data and also the name of the organization cannot be
revealed due to their policies. In this dissertation the name of the company remains silent and
only a generic name Mill A is used throughout the research. The area of energy efficiency is
vast and considering the limitations of time and resources, it has been impossible to discuss all
aspects in this study.
1.6 Thesis Layout
The rest chapters of the dissertation are arranged as follows:
Chapter 2 discusses Literature Review
Chapter 3 discusses Energy Efficiency in Pulp and paper Industry
Chapter 4 discusses Theory and Methods employed in this thesis to accomplish the research
Chapter 5 introduces a background to Barriers and drivers to energy efficiency adoption in
Pulp and paper industry. Chapter 6 gives an insight into Energy Management practice
Chapter 7 presents the Energy Analysis of Pulp Mill A, and the opportunities that were
identified after identifying the areas of energy losses within the pulping process.
Results and Discussion of findings from questionnaires are presented in Chapter 8
Chapter 9 discusses the Conclusion and Recommendation

2-- 10 -
CHAPTER 2 : LITERATURE REVIEW
2.1 Introduction
This chapter presents other researchers work on energy efficiency so as to put this dissertation
into context. Research on energy efficiency in the P & P industry are dealt with initially
followed by other related researches on energy efficiency in some energy intensive industries.
2.2 Energy Efficiency Research Work in the Pulp and Paper industry
Many studies have been undertaken that deal with energy conservation and performance
improvements in the P & P industry. Discussion on research work that seeks to study the whole
mill are presented first and thereafter those that analyze energy efficiency.
Research work conducted by the Swedish national research program identified solutions for
closing water loops as being an energy efficient measure. This research wanted to find ways of
minimizing environmental impacts that arise from pulping processes, and based on the research
conclusions, a great potential of excess heat energy can be saved by this method (Kam, 2000).
The Canadian Industry Program for Energy Conservation, conducted a survey and analyzed
the energy cost reduction aspect of energy efficiency improvements in the P & P industry
(Ferguson, 1997). In the USA, the Lawrence Berkeley National Laboratory has conducted
several studies on energy efficiency improvement and CO2 emission reduction opportunities of
different industrial sectors, including the pulp & P industry (Martin et al., 2000) and concluded
that many opportunities for further improvements exist.
As a continuation of the work in The Eco-Cyclic Pulp Mill Program, Wising, Berntsson and
Stuart (2005) analyzed the energy saving potential when reducing water consumption in a pulp
mill (Wising et al., 2005)(Wising et al., 2005. They found that an excess heat potential of 4
GJ/ton of pulp could be obtained if process integration measures were performed within a pulp
mill with low water consumption.
Algehed (2002) analyzed the energy consumption profile of a chemical pulp and its process
integration possibilities. Algahed focused on the evaporation plant and discovered that it is
very economical to use hot water of about 100 ºC in order to replace steam demand.

2-- 11 -
The energy saving potential in integrated P&P mills differs in comparison to market pulp mills
that the studies described above. Axelsson et al. (2008) compared the two kinds of mills
through a model mills study and find that the steam-saving potential in the market pulp mill
was about 16% and would enable either increased electricity production or fuel savings.
Regarding the integrated P&P mill, the energy saving opportunity would be less economically
beneficial than in the market pulp mill in combination with increased electricity production.
However, it would be more beneficial in combination with fuel saving.
In their thesis, Nordman and Berntsson (2006) focused on identification of what amounts of
excess heat exist in a typical chemical pulp mill with low water demand. They found that the
volume of warm and hot water are extensive then compared different ways of using this excess
heat. Process integration in the evaporation plant was compared to selling the heat as district
heating or using a heat pump to upgrade the excess heat for applications within the mill. They
found that process integration in the evaporation plant was the most beneficial. Due to
relatively high investment costs in the study case, the district heating alternative was not
economically viable in comparison to internal use of excess heat. However, regarding CO2
emission reduction, the district heating alternative has a greater potential than using a heat
pump.
Gong (2004) studied exergy loss within the pulp mill through a combination of MIND method
and exergy analysis. Using the case study of a Swedish chemical pulp and board mill the
researcher found that the most exergy loss within the mill was taking place in the recovery
boiler and bark and oil boiler, followed by the digester and evaporation plant. Through
upgrades to the recovery boiler, investing in a new bark and oil boiler and adjustments to the
evaporation plant energy cost, exergy loss and CO2 was reduced. Gong found that it was
beneficial to replace an existing evaporation plant with a new evaporation plant consisting of
a unconventional design in which excess heat was used to replace steam demand according to
suggestions by Bengtsson et al. (2002).
Worrell et al. (2008) presented research on energy use in motor vehicle assembly plants and
summarized the cost saving opportunities. The research was conducted in the United States
where a case study and literature review was used to conduct the research. They discovered
that although energy management teams and programs were in place in vehicle assembly plants
there were still opportunities to minimize energy usage in various processes utilities.

2-- 12 -
Guerrero et al. (2011) presented a case study on how to reduce energy usage in automotive
paint shops through production design, careful selection of repair capacity and reducing the
number of repainted jobs. This would result in significant reduction in energy usage and
material utilization. Using modelling and problem formulation, they stated that it was possible
to reduce the capacity of jobs going through repainting thus resulting in energy savings of up
to 12%. They argued that although increasing repairs may lead to increased costs it was able to
reduce energy usage significantly.
A study of the food processing industry by Muller et al. (2007) presented measures for tracking
energy use in a processing plant using top-down and bottom-up models. Key energy drivers
and energy consumption profiles between different energy users in a plant were developed.
The top-down model identifies the energy consumption profiles between different users in the
factory and also significant energy drivers. Multiple regression models were done and then
used to define independent variables such as production volumes and energy consumption.
Utility bills were the basis for the top-down models while thermodynamic modelling of energy
consumption profiles were the basis for bottom-up model. In that study top-down models were
used to determine fuel and electricity consumption. They find out that the coefficient of
determination of fuel and electricity was 0.94 and 0.872 respectively. They concluded that
energy savings could be achieved by good housekeeping practices only without a need for huge
capital injection.
A study by Olayinka and Oladele (2013) on the existence of energy gaps in two different
industrial sectors found that energy gaps do exist in companies. They exposed the existence of
energy gaps in the energy usage pattern between a food processing and bottling companies in
Nigeria. They used energy audits, onsite study and oral interviews as data collection tools.
Their study showed that among the equipment that uses electricity, electric motors were the
major consumer accounting for 40% to 47% of the electrical energy consumed. It was also
reviewed that none of the companies was utilizing energy efficiently.

2-- 13 -
2.3 Understanding Energy Efficiency
Energy efficiency
Energy efficiency is defined as the ratio of useful outputs to energy inputs for a system, where
the latter may be an individual energy conversion device (e.g., a boiler), a building, an industrial
process, a firm, a sector or an entire economy. Energy efficiency is a measure of energy used
for delivering a given service. Improving energy efficiency means getting more from the
energy that we use all cases, the measure of energy efficiency will depend upon how ‘useful’
is defined and how inputs and outputs are measured (Patterson, 1996). It implies efforts on the
demand side to dampen growth and on the supply side to increase efficiency of generation and
transmission and thus limit the consumption of primary energy. There are different ways to
improve energy efficiency which are can involve new innovation which lead to the equal or
greater output with less energy, also cutting out wasted energy reduces energy needed for
processes while maintaining output.
Key concepts
Energy efficiency has different implications along the chain of conversion from the
exploitation of primary resources to the delivery of energy services a consumer desires.
Conversion efficiency is related to the transformation of primary energy into secondary energy,
as in a power plant. Distribution efficiency is assessed on the delivery of that secondary energy
from point of conversion to the end use e.g. lighting. The ultimate goal lies in the optimization
of the whole system, ensuring that an increased amount of energy services and the associated
human welfare can be produced at from the same amount of energy serves can be produced
from decreasing amount of energy. Efficiency implies supply of the same level of energy
service with lower amount of energy whereas energy conservation implies lower energy
consumption as well as lower level of energy service.
Energy Demand Side Management
It is the planning, implementation and monitoring of utility activities designed to influence
customer use of electricity in ways that will produce desired changes in the utility’s load shape,
that is time pattern and magnitude of utility’s load
2-- 14 -
Energy Supply Side Management
Also referred to as Supply Side Energy efficiency, it is the actions taken to ensure the
generation, transmission and distribution of energy are conducted efficiently. It involves supply
and utilization of energy resources: clean coal technology, fuel substitution, and renewable
energy. It also includes processes like power generation and energy conversion, operational
improvements existing in power plants, upgrades and cogeneration (CHP). Transmission and
distribution of electricity, fuel transportation including liquid and gaseous as well as solid fuels
complete the activities involved in Supply Side Energy management.
Energy Efficiency Gap
This refers to the difference between observed levels of energy efficiency and some theoretical
optimum. Numerous publications claim the existence of an energy gap between potential cost
effective efficiency measures and the levels of efficiency that actually exist, a substantial list
of which can be found in the paper “Categorizing Barriers to Energy Efficiency An
Interdisciplinary Perspective by (Thollander et al., 2013). Essentially, why are energy
efficiency measures with proven cost effectiveness not implemented to larger degree? The
existence of energy gap and energy paradox is often attributed to numerous and well
characterized barriers to energy.
2.4 Potential for Industrial Energy Efficiency Improvement in South Africa Pulp
and paper Industry.
It has increasingly been argued that energy demand and supply are closely related and problems
arising from the supply side can be addressed by adequate measures on the demand side. Along
this line, studies have emerged that compare investments in new power plants to investments
in energy efficient technology, and this goes against traditional view that a growing primary
energy production is a prerequisite for economic growth. This exposes the fact that it is useful
energy that drives economic activity and not primary energy because in most systems only a
fraction of primary energy input is converted to useful energy leaving a huge potential for
energy efficiency hidden in a long sequence of conversion processes. This means improved
energy efficiency will result in useful energy output while at the same time reducing primary
energy input. Nicole (1994) estimated that in order to reach 2% climate stabilisation path, the
2-- 15 -
annual energy related CO2 emissions are required to be reduced by 22 Gt by 2035, whereas
with our current trend it will reach 44 Gt by 2035. This only means a bigger chunk of reduction
will be realised through improved energy efficiency, being the main abatement option being
cost effective in short time interval. In order to meet those targets an accelerated energy
efficiency processes is the key factor. Each sector is therefore required to play its part and make
contributions to this critical agenda. Also new emerging energy efficiency are being developed
and introduced to the market but what will hinder all the efforts are barriers to adoption by
industry and also low data availability for studies to be done.
2.5 Reasons for Companies Not Adopting Energy Efficiency Measures?
Evidence exists that firms often do not adopt energy efficiency technologies despite them being
cost effective This difference between available potential and real implementation is what is
referred as energy gap or no- regret potential (Jaffe and Stavins, 1994b). From company
perspective no regret is the best word to describe their failure to adopt the technologies. In
2009, a survey on Germany service revealed barriers to energy efficiency adoption which were,
lack of staff time, investment, priority setting, information investment deficits and split
incentives (Bunse et al., 2011). More important barriers are competition with alternative
investment opportunities and uncertainties with regard future technology and price
development (Jaffe and Stavins, 1994b). Pulp and paper industry is energy- intensive with
energy consumption accounting for almost 10% production cost but they too do not adopt
energy efficiency technologies rapidly. Non-economic barriers hamper the adoption of cost
effective, energy efficient technologies (Thollander et al., 2013). The main barrier in the
Swedish pulp and paper industry was found to be risk of production disruptions, followed by
hidden costs through production losses and other inconveniences. Lack of time, other priorities
and also lack of capital are other key barriers which were noted. A survey of 46 pulp and paper
producers in Spain showed three major barriers and these are long payback time, high initial
investment and not cost-effective. The theory of innovation gives us a clear picture as to why
there is no diffusion of energy efficiency measures being incorporated into organisation
structures. ‘Rogers 2003’ defines innovation as an “idea, practice or object that is perceived as
new by an individual or other unit of adoption”. He continued to emphasize that “newness” of
an innovation depends on the perception of the adopter. This gives us an understanding on why
energy efficiency are not being adopted regardless of the fact that they are cost saving. Industry

2-- 16 -
can adopt new innovations in process- innovation like energy efficiency measures depending
on how they view or define the new inventions brought about by researches being carried out.
Adoption of short term energy efficiency measures by industry is crucial rather than new
product innovation if we factor the issue of time factor since the world is behind with regard to
implementation of measures to curb global warming

3-- 17 -
CHAPTER 3 : ENERGY EFFICIENCY OPPORTUNITIES FOR THE
PULP AND PAPER INDUSTRY
3.1 Introduction
This chapter discusses the methods and technologies that can be implemented in different
sections of the pulp mill to reduce energy.
3.2 Steam Systems
Steam has many uses in pulp mills. Energy conservation and improvements will result in
substantial energy savings because steam is involved in almost three quarters of the pulping
processes in a mill. Steam is manufactured from boilers of which two types are used in pulp
mills. Conventional power boilers require coal for their firing while recovery boilers are fired
from black liquor which is byproduct of the pulping process itself. Both conventional and
recovery boilers are used to generate steam and electricity for use by the pulp mill (Minchener,
2005).
Cold water feed is pumped into the boilers, then heated at very high pressure to form steam.
Before entering the boiler, water passes through a chemical treatment plant to remove the
embedded impurities, although some remains and will have to be removed by a further process
called blow down. Blow down is conducted periodically in order to keep the impurities in feed
water as minimal as possible.
After generation, the steam is fed into different piping systems and makes its way into several
process systems. The steam transport system consists of pressure reduction valves and steam
traps which are responsible for reducing steam pressure and collection of hot condensate
respectively. Steam condenses as it passes through distribution channels and the condensate
needs to be collected and returned to boilers in order to reduce heat losses. The whole steam
system process flow is shown in Figure 3-1.

3-- 18 -
Figure 3-1: Steam loop
Source: (Bloss et al., 1997)
Most pulp mills generate electricity onsite using turbines. No matter the source or use of steam,
system improvements are always possible although prior steam usage is required for analysis
of the system.
3.2.1 Boiler System Energy Conservation Measures
This section presents boiler conservation methods that are proven and practical for P & P
implementation today. Table 3-1 shows a summary of the energy efficiency opportunities
available for boiler energy optimization. These are described in detail in the sections that
follow.

3-- 19 -
Table 3-1: Summary of energy efficiency measures for boilers
Measure Boiler fuel saved
Payback
period
(years) Other benefits
Improve Process Control 3% 0.6 Reduced emissions
Reduced Flue Gas 2-5% - Cheaper emission controls
Reduced Excess Air 1% improvement for
each 15% less
excess air
-
Improved Insulation 6-26% na Faster warm-up
Boiler Maintenance 10% 0 Reduced emissions
Alternative Fuels Variable - Reduces solid waste stream at the cost
of increased air emissions
Source: Worrell & Galitsky, 2005
Take note that predesigned boiler packages are usually difficult to fine tune to in order to meet
special generation, distribution requirements in a mill (Ganapathy, 1994). A section through a
recovery boiler is shown in Figure 3-2.
Figure 3-2: Schematic view of a recovery boiler of a sulphite pulp mill (Backman et al., 1983)

3-- 20 -
Reduction of excess air. Most boilers are fired with excess air so as to reduce carbon monoxide
formation and also to enhance complete combustion. Too much excess air results in significant
energy losses. Reduction in excess air is observed to have a payback of less than one year
(Galitsky, 2009). Practical methods that have quick returns include installation of various
instruments to measure flue gas, periodic single point mechanism tuning, and general
housekeeping measures such as repairing leaks.
Improved insulation. Research has shown that more new inventions in material sciences have
unveiled boiler material that has better insulation properties, and lower heat. According to
Caffal (1995) savings of 6% to 26 % are possible if insulation is improved.
Boiler maintenance. Boiler maintenance will result in improved boiler operation and hence
reduced energy losses. Substantial savings are anticipated if all boiler auxiliaries are always
functioning properly. Burner and condensate return systems are key to boiler operation and
proper maintenance of these subs-systems reap significant energy savings (Worrell and
Galitsky, 2005). On average, the energy savings associated with improved boiler maintenance
are estimated at 10%. Improved maintenance may also reduce the emission of criteria air
pollutants. Scaling and fouling problems should be periodically checked and corrected (Jago,
1999).
Condensate return. Returning condensate will result in significant reduction in purchased
chemicals for fresh water treatment. This means the mill should make an effort to return most
of its condensate to boilers. Savings of 20% are anticipated for this energy saving measure
(DOE, 2002)
Minimizing boiler blow down. Blow down is conducted to maintain feed water and hence
steam properties. Reduction in boiler blow down yields substantial energy savings according
to Saidur et al. (2010). The best way to keep boiler blow down at optimum levels is to install
an automatic blow down system. This measure has energy savings of about 20% (Xu, 2014).
Blow down steam recovery. Boiler blow down energy recovery is advised because it results in
corrosion reduction and also heat energy loss reduction. This measure is suggested to reap
energy savings and has short payback periods of 12 to 18 months only (Xu, 2014).

3-- 21 -
Flue gas heat recovery. According to Hitchcock (2009) flue gas recovery offers the most
efficient heat recovery options. This heat can have several uses such as pre-heating of feed
water and also for drying purposes.
Burner replacement. Burner replacements yields substantial energy savings since most burners
currently operating in pulp mills are old and very inefficient. Replacing old burners with more
energy efficient modern burners can lead to significant energy savings. Short payback periods
are anticipated for this measure and savings of about 2% may be obtained in a year (Zeitz,
1997a). This is also supported by Xu (2014), when he narrates how a pulp mill managed to
gain significant energy savings after replacing all its burners and repaid its investment in one
year. The table below shows examples of implemented projects to enhance boiler energy
efficiency improvements.
Table 3-2: Implemented energy efficiency opportunities for boiler energy savings
Pulp and paper mill and location Description of opportunity Savings
Appleton paper mill in West Carrolton The mill’s boiler control system
suffered from lack of continuous
monitoring or control of combustion
air. Installation of a control system to
measure, monitor, and control
oxygen and carbon monoxide levels
on its coal fired boilers, given that
these boilers operated near full
capacity reaped the greatest benefits
of improved control
Savings nearly $475 000
in annual energy costs; at
an investment cost of
$200 000, the payback
period was less than six
months
West Linn Paper Company’s Adjusting boiler oxygen trim
controls to lower the oxygen levels
to between 2.5% to 3%, boiler
efficiency improvements
Saved 15 500 MMBtu of
energy per year at a cost
savings of around $118
000
Augusta Newsprint Company’s Augusta, Georgia An existing boiler blow down system
was modified by installing a plate-
and-tube heat exchanger and
associated piping to recover energy
from the mill’s continuous
blowdown stream from the boiler
blow down flash tank.
14 000 MMBtu, with
annual fuel cost savings of
over $30 000
Source: Worrell & Galitsky, 2005
3.2.2 Steam Distribution System Energy Efficiency Measures
Steam distribution channels contribute immensely to the total steam losses experienced by a
pulp mill. Potential energy conservation measures focus on heat loss reduction and heat energy
3-- 22 -
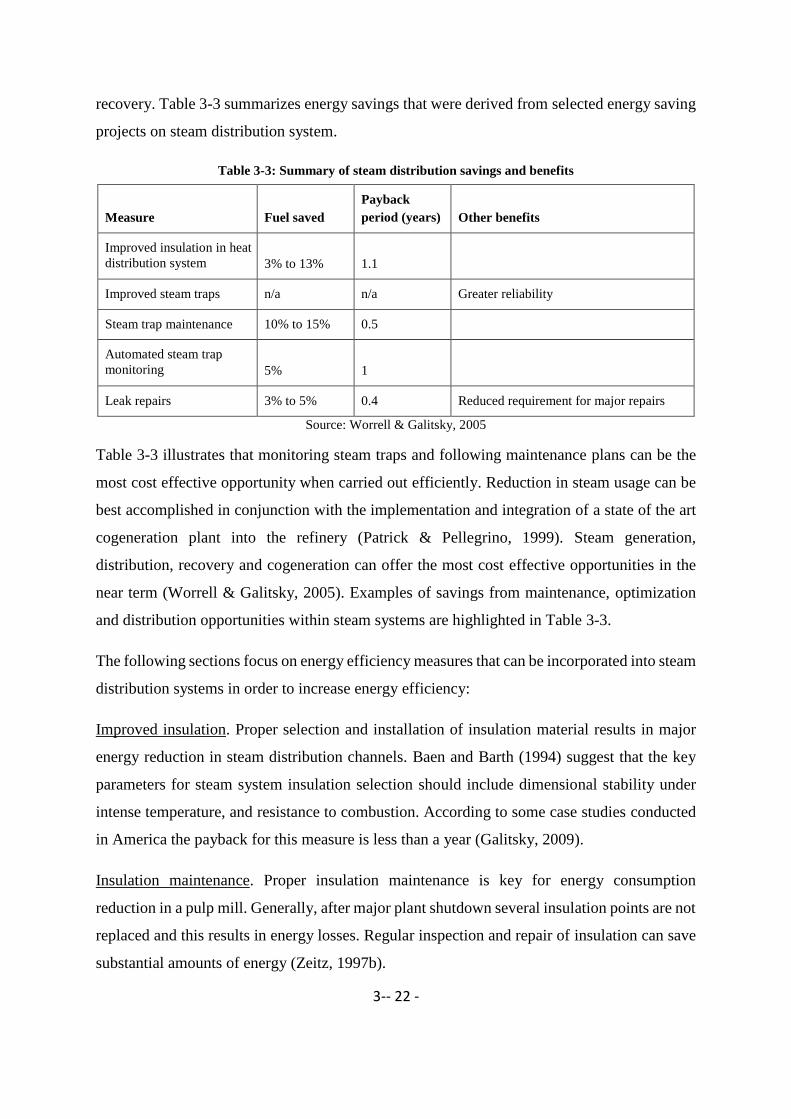
recovery. Table 3-3 summarizes energy savings that were derived from selected energy saving
projects on steam distribution system.
Table 3-3: Summary of steam distribution savings and benefits
Measure Fuel saved
Payback
period (years) Other benefits
Improved insulation in heat
distribution system 3% to 13% 1.1
Improved steam traps n/a n/a Greater reliability
Steam trap maintenance 10% to 15% 0.5
Automated steam trap
monitoring 5% 1
Leak repairs 3% to 5% 0.4 Reduced requirement for major repairs
Source: Worrell & Galitsky, 2005
Table 3-3 illustrates that monitoring steam traps and following maintenance plans can be the
most cost effective opportunity when carried out efficiently. Reduction in steam usage can be
best accomplished in conjunction with the implementation and integration of a state of the art
cogeneration plant into the refinery (Patrick & Pellegrino, 1999). Steam generation,
distribution, recovery and cogeneration can offer the most cost effective opportunities in the
near term (Worrell & Galitsky, 2005). Examples of savings from maintenance, optimization
and distribution opportunities within steam systems are highlighted in Table 3-3.
The following sections focus on energy efficiency measures that can be incorporated into steam
distribution systems in order to increase energy efficiency:
Improved insulation. Proper selection and installation of insulation material results in major
energy reduction in steam distribution channels. Baen and Barth (1994) suggest that the key
parameters for steam system insulation selection should include dimensional stability under
intense temperature, and resistance to combustion. According to some case studies conducted
in America the payback for this measure is less than a year (Galitsky, 2009).
Insulation maintenance. Proper insulation maintenance is key for energy consumption
reduction in a pulp mill. Generally, after major plant shutdown several insulation points are not
replaced and this results in energy losses. Regular inspection and repair of insulation can save
substantial amounts of energy (Zeitz, 1997b).

3-- 23 -
Steam trap improvement. Replacement of old steam traps with new thermostatic steam traps
result in significant energy savings in pulp mills. New thermostatic steam traps are able to
allow condensate passage when temperature of steam is closer to that of saturated steam (within
2°C), and purge condensable gases after each opening. These steam traps are very reliable and
have several applications in pulp (Alesson, 1995).
Steam trap maintenance. A well organized and monitored steam trap checking program yields
significant energy savings with little investments involved. Energy savings from this measure
are estimated to be around 12% (Jones, 1997). A pay back of a few months are suggested by
several case studies (Galitsky, 2009).
Leak repair. Existence of steam leaks pose a huge energy loss in many pulp mills. Repairing
leaks yields significant energy savings. Savings arise from substantial reduction in coal usage
(Challenge, 2002).
Flash steam recovery. Heat losses can be minimized if flash steam is recovered and used for
low grade applications such as feed water heating (Johnston, 1995).
Table 3-4: Implemented energy efficiency opportunities for steam systems
Pulp and paper location Description of opportunity Savings
Boise Cascade mill (USA) Opportunities for repairing steam leaks
around paper machines
Annual fuel and water cost savings of
about $20 000 with a payback of around
one to 1.5 years
Smurfit Kappa (Europe) Changed 25 steam traps to the new type
on a coating battery
Energy costs savings of nearly $200 000
with a payback period of 2.5 months
Georgia-Pacific mill
(Georgia)
Insulated of steam lines and replaced 70
steam traps, which resulted in a 10%
increase in condensate return
Total energy savings amounted to about
63 000 MMBtu at a cost savings of over
$138 000.
Illinois paper mills Installing or improving insulation on
pipes and valves
3 600 MMBtu and over $120 000 per year
Source: Worrell & Galitsky, 2005
3.3 Motor Systems
A systems approach is required when analyzing motor systems if substantial amounts of energy
savings are to be realized. This takes into consideration all pumping system auxiliaries and not
just individual components.

3-- 24 -
Figure 3-3: Major application of electric motors on P&P industry
Source: (Barnish et al., 1997)
The approach includes location of the motor and its identification first, followed by
documentation of the motor specifications. Thereafter proper sizing of the system is done and
information on upgrades undertaken. Finally the energy savings potentials are then pursued
and the system continuously monitored (Tessier et al., 1997a). The following section describes
the opportunities for energy efficiency improvements in motor driven systems:
Maintenance. The main aim of undertaking motor maintenance programs is to increase the life
span of the motor. These maintenance programs are grouped into preventive and predictive.
Preventive maintenance programs are aimed at preventing unanticipated machine downtime
and these are lubrication, load requirements, current in balance and alignment methods.
Predictive maintenance programs are aimed at identifying the time for motor replacement,
before it fails (Barnish et al., 1997). The savings associated with each measure can be very high
reaching 30% of annual motor system energy usage (Alliance, 2008).
Properly sized motors. Oversized motors consume unnecessary energy. Reduction in peak
loads can be used as a base study for reducing motor sizes. Significant energy savings are
anticipated with replacement of oversized motors with appropriate ones (Tessier et al., 1997b).
Variable frequency drives. Variable frequency drives are used to match motor speed to its load
requirements. This results in optimized motor energy usage for specific applications drives.
15 10 5 0 20 25 30 35
Compressed Air
Refrigeration
Material Handling
Miscellaneous
Material Processing
Pumps
3-- 25 -
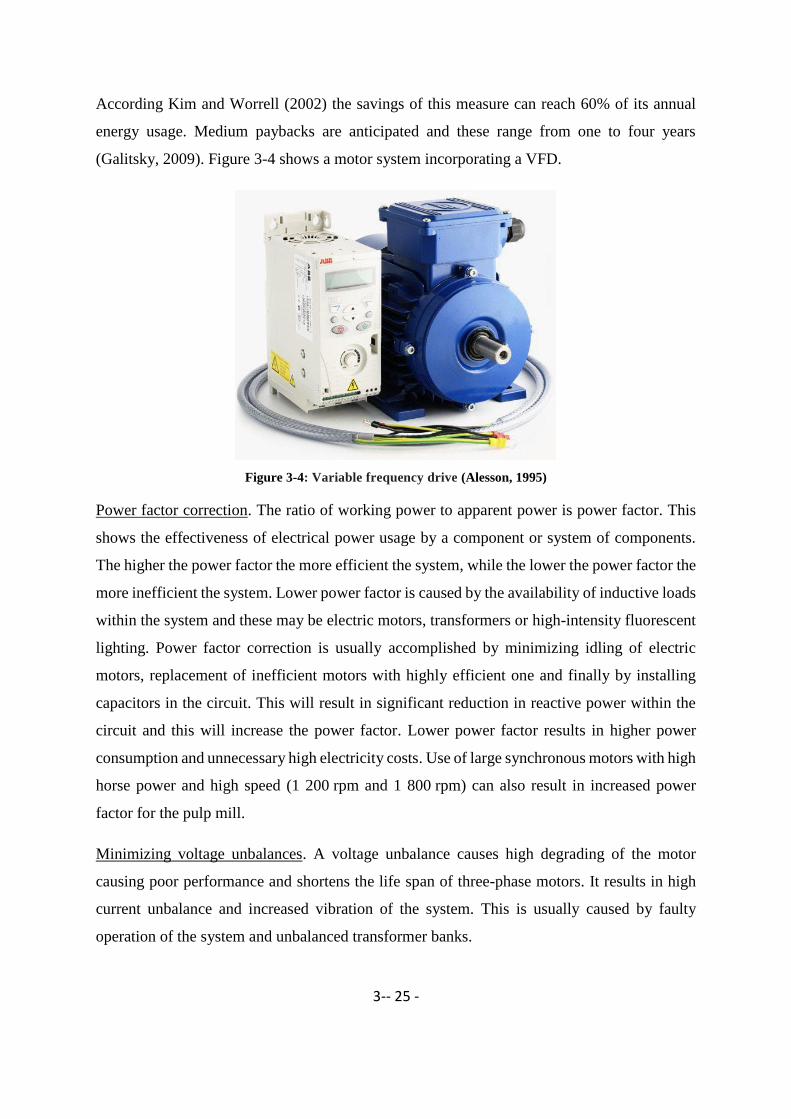
According Kim and Worrell (2002) the savings of this measure can reach 60% of its annual
energy usage. Medium paybacks are anticipated and these range from one to four years
(Galitsky, 2009). Figure 3-4 shows a motor system incorporating a VFD.
Figure 3-4: Variable frequency drive (Alesson, 1995)
Power factor correction. The ratio of working power to apparent power is power factor. This
shows the effectiveness of electrical power usage by a component or system of components.
The higher the power factor the more efficient the system, while the lower the power factor the
more inefficient the system. Lower power factor is caused by the availability of inductive loads
within the system and these may be electric motors, transformers or high-intensity fluorescent
lighting. Power factor correction is usually accomplished by minimizing idling of electric
motors, replacement of inefficient motors with highly efficient one and finally by installing
capacitors in the circuit. This will result in significant reduction in reactive power within the
circuit and this will increase the power factor. Lower power factor results in higher power
consumption and unnecessary high electricity costs. Use of large synchronous motors with high
horse power and high speed (1 200 rpm and 1 800 rpm) can also result in increased power
factor for the pulp mill.
Minimizing voltage unbalances. A voltage unbalance causes high degrading of the motor
causing poor performance and shortens the life span of three-phase motors. It results in high
current unbalance and increased vibration of the system. This is usually caused by faulty
operation of the system and unbalanced transformer banks.

3-- 26 -
3.4 Pumps
Many millions of dollars are being wasted annually in a typical pulp mill through inefficient
pumping systems. Oversized pumps, inappropriate pump controls, and insufficient
maintenance programs result in significant energy losses. To avoid pumping system energy
losses three fundamental strategies are vital, namely, avoiding excess flow rates, avoiding
excess pumping system head, and avoiding operating the system at low efficiency. Pump
loading conditions which mismatch pump design requirements result in substantial amount of
energy loss. The pie chart in Figure 3-5 shows that the life cycle cost of a typical industrial
pump over a 20 year is primarily made up of maintenance and energy costs (Hasanbeigi and
Price, 2012). Depending on the pump application, energy costs may make up about 95% of the
lifetime costs of the pump as shown in Figure 3-5. Hence, the initial choice of a pump system
should be highly dependent on energy cost considerations rather than on initial costs.
Figure 3-5: Life cycle of owning a pump (Hasanbeigi and Price, 2012)
A typical pumping system includes a pump, electric motor, pipes and pump control system.
Reducing pump friction head losses and undertaking pumping system upgrade to ensure that
that the pump is drawn closer to its best operating point results in significant energy savings
(Stepanoff, 1948). Appropriate pump and piping system sizing are other suggested energy
reduction measures with substantial energy savings. Installation of VFD can also direct the
pump system towards its best operating point and this will result in measurable energy savings
as well. Finally, pumping systems are always part of motor systems and thus the general
“systems approach” to energy efficiency described for motors applies to pump systems as well.
An efficient pumping system is shown in Figure 3-6.

3-- 27 -
Figure 3-6: Conventional pumping system (total efficiency = 31%) vs energy efficient pumping system
pumping combining technologies (total efficiency = 72%)
(Alesson, 1995)
Some of the most significant energy efficiency measures applicable to pump system
components and to pump systems as a whole are described below.
Reducing pump demand. Installation of water holding tanks and making efforts to eliminate
bypass valves enhances reduced pump demand. Energy savings associated with this measure
can be around 20% of total annual energy usage (Erickson and Brown, 1999). Holding tanks
are used to eliminate the need to add pump capacity. Elimination of bypass loops results in
significant energy savings of almost 30% of total pumping system annual energy consumption
(Erickson and Brown, 1999).
Controls. Proper pump control system maintenance saves energy. Controls will reduce demand
by shutting off unrequired pumps and or put them on standby until the load increases.
Properly sized pumps. Many pumping systems are designed prior to installation and this results
in many of them turning out to be oversized. Properly sizing pumping systems and replacing
oversized pumps with correctly sized ones is observed to save significant electricity (Erickson

3-- 28 -
and Brown, 1999). This energy saving measure has a payback period of less than a year
(Galitsky et al, 2005).
Variable-speed drives. These will match pumping system speed to load requirements. In times
of reduced flow rates the VFD will in turn reduce the motor- pump system speed and this will
result in substantial energy savings for the pump. Installation of VFDs on pumping systems
enhance better pump system control, wear reduction, improves pump performance and all these
will reduce maintenance costs.
Impeller trimming. This involves the reduction in impeller diameter by machining methods.
Impeller trimming results in reduced energy consumption by the pump. Erickson and Brown
(1999) suggest that impeller trimming should be considered if the pumping system is operating
under the following conditions:
• Existence of open bypass valves.
• Excessive flow conditions evidenced by vibrations and high noise levels.
• Pumps that are running at parameters far from their best efficiency point.
• Existence of many control valves in the system.
Impeller trimming results in substantial savings in pump operating costs if the measure is
adopted by pulp mills (Erickson and Brown, 1999).
Avoiding throttling valves. Availability of throttling valves within a pumping system results in
energy losses. They signify that the system is oversized and cannot accommodate variations in
load demand (Hovstadius et al., 2000). They reduce pump efficiency and are a result of poor
system design. Replacing throttling valves by either impeller trimming and or increased pump
controls can result in substantial energy savings in pumping systems (Erickson and Brown,
1999). Figure 3-7 shows a throttling valve.

3-- 29 -
Figure 3-7: Throttling valve (Alesson, 1995)
Replacement of belt drives with flat belts. Flat belts are more advantageous compared to v-
belts. V-Belts have disadvantage in that they easily slip off and stretch easily and this results
in unnecessary energy consumption by the pumping system. Replacement of v-belts with flat
belts is therefore an energy consumption reduction measure that can involve significant energy
savings. Short payback periods are also anticipated for this measure (Studebaker, 2007).
Proper pipe sizing. Matching pipe size to usage will result in substantial energy savings. Small
piping systems results in unnecessary energy consumption. Typical energy savings from proper
pipe sizing can reach 20% of total annual energy usage for pumping systems (Erickson and
Brown, 1999).
Seals. Improved sealing reduces pump energy consumption immensely since most pump
energy losses are due to sealing leakage (Guide, 2001). The type of seal and also its installation
contributes to the power absorbed by a pump.
Reducing leakage through clearance reduction. Reduction in energy losses associated with
internal leakage is vital for pumping system optimization. Internal leakage is a result of large
clearance inside pumps and these can be rectified by reducing clearance and by using wear
resistant materials for pumps’ internal components (Guide, 2001). Table 3-5 provides some
examples of implemented energy efficiency projects for pumps.
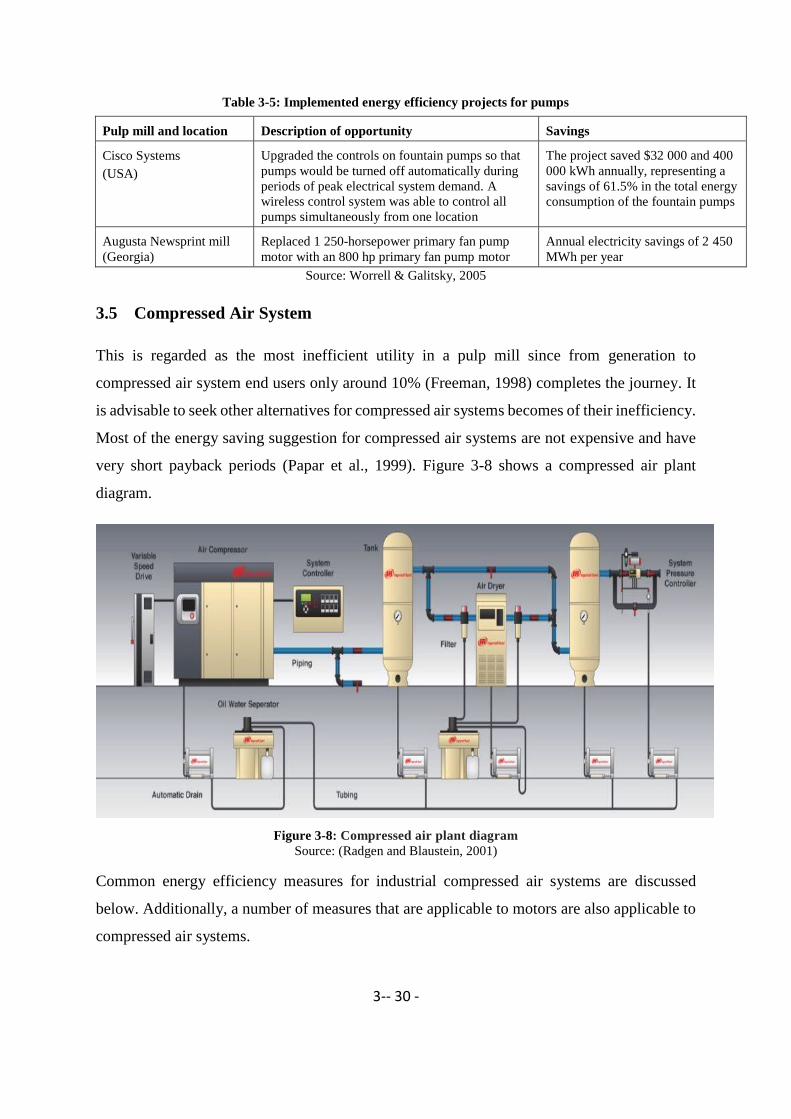
3-- 30 -
Table 3-5: Implemented energy efficiency projects for pumps
Pulp mill and location Description of opportunity Savings
Cisco Systems
(USA)
Upgraded the controls on fountain pumps so that
pumps would be turned off automatically during
periods of peak electrical system demand. A
wireless control system was able to control all
pumps simultaneously from one location
The project saved $32 000 and 400
000 kWh annually, representing a
savings of 61.5% in the total energy
consumption of the fountain pumps
Augusta Newsprint mill
(Georgia)
Replaced 1 250-horsepower primary fan pump
motor with an 800 hp primary fan pump motor
Annual electricity savings of 2 450
MWh per year
Source: Worrell & Galitsky, 2005
3.5 Compressed Air System
This is regarded as the most inefficient utility in a pulp mill since from generation to
compressed air system end users only around 10% (Freeman, 1998) completes the journey. It
is advisable to seek other alternatives for compressed air systems becomes of their inefficiency.
Most of the energy saving suggestion for compressed air systems are not expensive and have
very short payback periods (Papar et al., 1999). Figure 3-8 shows a compressed air plant
diagram.
Figure 3-8: Compressed air plant diagram
Source: (Radgen and Blaustein, 2001)
Common energy efficiency measures for industrial compressed air systems are discussed
below. Additionally, a number of measures that are applicable to motors are also applicable to
compressed air systems.

3-- 31 -
Leak reduction. Reducing leaks will save the mill substantial amounts of energy. Leakage of
air will make the compressor operate harder in order to maintain operating pressure. This will
result in energy losses (Challenge, 2002). About 30% in energy consumption reduction is
anticipated for this measure (Radgen and Blaustein, 2001). Air leaks occur in pipe connections,
valves condensate traps, and through sealants. Use of ultrasonic detection machines will
enhance quick leak identification and hence energy savings.
Turning off unused equipment. Turning off equipment completely if it is not in use will result
in energy savings. This measure can be achieved by installing a solenoid valve within the
system. Other suggestions are to check for air inflows into obsolete equipment that still remain
within the compressed air distribution channels.
Air compressed air system replacement by other alternative sources. Compressed air systems
are very inefficient and substituting them with other efficient alternatives will yield substantial
energy savings (Freeman, 1998). Many options are available for air compressed system
replacement and these are:
• Use of air conditioning fans to cool cabinets instead of vortex tubes which are powered
by compressed air.
• Application of vacuum system instead of venture methods for flowing air in orifices in
order to create a vacuum.
• Using brushes for cleaning instead of compressed air.
• Use of actuators in place of compressed air in driving (Howe and Scales, 1995).
The payback anticipated by this measure is almost one month (Galitsky, 2009).
Improved load management. compressed air system designers must eliminate partial load since
these allow substantial energy losses (Alesson, 1995). Installation of air receivers will ensure
constant supply of compressed air. Upgrading system equipment from one stage to two or three
stage systems will yield significant energy savings (Rand, 2001). The payback associated with
this measure is one year (Galitsky, 2009).
Pressure drop minimization. Pressure drops waste energy and render the system inefficient.
Better maintenance programs that ensure regular checking and replacement of filters and
drying equipment will save the mill substantial amounts of energy. Efforts should be taken to

3-- 32 -
ensure short distance of travel for compressed air design since this results in significant
reduction of energy consumption (Rand, 2001).
Temperature reduction at air inlet. Substantial amounts of energy savings are anticipated by
small inlet air temperature reduction. This is achieved by sucking air from low temperature
zones outside the compressor room. Short to medium payback periods are expected as a result
of this measure (Rand, 2001). Facility layout plays a major role in quantifying the savings from
taking up this energy efficiency opportunity (Radgen and Blaustein, 2001).
Properly sized pipe diameters. Pipe diameters increment will result in pressure losses
minimization and this will result in energy savings for the system. Energy will be saved due to
leakage reduction and energy savings of around 4% are anticipated for this saving measure
(Radgen and Blaustein, 2001).
Heat recovery. Most of energy consumed by a compressor ends up as heat energy and this
results in substantial energy losses. If some of the heat energy can be recovered, energy losses
will be significantly minimized. Heat recoveries reaching about 90% are anticipated by using
this energy saving measure (Parekh, 2000).
Table 3-6: Implemented energy efficiency projects for air compressed system
Refinery and location Description of opportunity Savings
Augusta Newsprint
Company (Georgia)
Consolidated two compressed air systems at its
facility. The project resulted in a more
streamlined system, added storage capacity,
backflow prevention, and the elimination of
unused equipment. Additionally, a number of
leaks were discovered and fixed
Energy savings of more than 1.8
million kWh per year
Source: Worrell & Galitsky, 2005
3.6 Lighting
Energy consumption by lighting equipment is minimal compared to other pulp mill equipment
energy usage. In spite of this, savings associated with lighting components are immense
compared to other equipment energy savings. This is possible due to vast improvements in
energy efficiency in lighting components design. The following measures are suggested for
energy efficiency improvements in pulp mills:

3-- 33 -
Turning off lights when an area is unoccupied. This is the easiest and most efficient energy
saving available for implementation by mill management. Awareness of this measure to all
employees within the plant will aid in improving energy savings realization from this measure.
Short payback periods are anticipated for this opportunity.
Lighting controls. Switching off lights when the area under consideration is not occupied saves
huge amounts of energy. Installation of occupancy sensors is a preferred method required to
accomplish the goal of automatically switching on and off of lights (Galitsky et al., 2005).
Electronic ballasts. These are able to regulate the amount of energy required for startup.
Installation of new energy efficient lighting devices will save the mill significant energy
(Galitsky et al., 2005). Payback periods anticipated for this measure are very short (Cook, 1998,
Eley, 1993). These can automatically switch off when there is a faulty line or when they reach
their end of life.
Replacement of 12 inch tubes with 8 inch tubes. Twelve inch tubes are still being used in many
P & P mills. These consume a lot of energy and have poor efficiency. The maintenance of 12
inch tubes is also very difficult compared with that of 8 inch tubes. Replacement of 12 inch
tubes with 8 inch ones will result in substantial energy savings (Worrell and Galitsky, 2005).
Use of high-intensity fluorescent light. High-intensity fluorescent lights are very efficient and
consume less energy compared to conventional lighting methods (Martin, 2000).
3.7 Bleaching
Energy recovery from bleach plant waste products. Large amounts of heat are contained in
bleach plant effluents and recovery of energy from them can be very beneficial to the plant.
Installation of heat exchangers can enhance significant heat recoveries from bleach plants.
Improved brownstock washing. This method uses four drum washers to spray water to dissolve
solids. Modern washing system should be installed in place of vacuum pressure units which
were previously in operation. Modern washers are more efficient and consume less energy
compared to old ones (Martin et al. 2000). Steam savings from this measure is around 15 kWh
per ton of pulp (Radgen and Blaustein, 2001).

3-- 34 -
Chlorine dioxide (ClO2) heat exchange. Chilling of ClO2 is done to increase its concentration.
If a heat exchanger is installed and ClO2 preheated before entering the mixer significant steam
savings will be observed (Radgen and Blaustein, 2001).
3.8 Chemical Recovery
Lime kiln electrostatic precipitators. Replacing wet scrubbers with state of the art electrostatic
precipitators will result in substantial energy savings (Freeman, 1998). The disadvantage of
wet scrubbers is that they are significant water consumers (Xu, 2014). Saving associated with
this measure is around a 15 000 kWh reduction in energy with about 2% annual energy
reduction (Xu, 2014).
Black liquor solids concentration. This method aims to reduce black liquor solids concentration
before they enter the boiler for burning. The more concentrated the black liquor the more
efficient the steam generating system. This can be achieved by using a submerged tube
concentrator, whereby the black liquor is heated but not evaporated; the liquor will then be
flashed to the concentrator vapor space, causing evaporation (Freeman, 1998). In a tube type
concentrator liquor flow is reversed although the operating principle is similar to that of a
submerged tube concentrator. It does not require final concentration since almost 70% of solids
are produced in one stage.
Optimization of composite tubes for recovery boilers. Boilers have internal tubes for
pressurized water circulation required for steam generation. Composite tubes are manufactured
from carbon steel and suffer from corrosion so need to be replaced by advanced alloy tubes.
This increases boiler efficiency and results in reduction in shutdown scheduling.
Deposition monitoring on recovery boilers. Proper control of recovery boiler surface deposits
increases heat transfer and reduces boiler plant shutdown. Use of infrared detection systems
will allow quick identification of leaks and enables better boiler operation (Jago, 1999). This
will enhance energy consumption by the boiler hence improve energy efficiency.
Quaternary air injection. Many recovery boilers consist of three stages for air injection,
although the third is not utilized very often. The method of ensuring that the boiler utilizes the
third stage will result in significant fouling reduction. This will enhance a reduction in boiler
washing frequency and savings are realized through reduced shutdowns and reheating.

3-- 35 -
According to Petrick and Pellegrino (1999), savings estimated to be about 2 930 kWh at a cost
of $50 000 are realized (Petrick and Pellegrino, 1999).
3.9 Summary
This chapter presented various technologies and methods that can be incorporated into the P &
P industry to reduce energy consumption. Each separate set of equipment was discussed. These
energy efficiency opportunities have been used as base knowledge for recommending energy
saving measures after energy use and loss analysis on Paper Mill A as presented in Chapter 7.

4-- 36 -
CHAPTER 4 : THEORY AND METHODS
4.1 Introduction
This chapter presents the methods and strategies that were applied in this dissertation in order
to answer the research questions that are raised in Chapter 1. Initially the overall system theory
approach is presented followed by tools used to accomplish the case study, namely, energy
auditing tools used to gather data to compute an energy footprint model. The methodology used
to investigate the barriers and drivers for energy efficiency adoption is also presented.
4.2 System Theory
This research was based on a systems approach. Depending on the focus of study each theorist
will have his or her definition. In a complex process such as pulp mill, it is difficult to ensure
that energy savings in one part of the operation do not lead to losses elsewhere. A global energy
use reduction of the mill requires a systemic approach in order to suggest energy efficiency
projects that will not impact other departments negatively. The following section describes the
system in detail and some other concept that were relevant to this study.
4.2.1 Definition of “System”
The systems approach presented in this research is that which Lars Ingelstam uses in his book
about systems thinking (Ingelstam, 2002). In that book Ingelstam describes systems as
consisting of four parts 1) A system consists of components and relations between them; 2) the
set of components and relations are chosen for a reason and constitute a whole; 3) the whole
can be separated from the rest of the world through a system boundary; 4) the rest of the world
constitutes the system surrounding. A key task, according to Ingelstam, is to identify the
relationship between system and surrounding. Ingelstam’s definition is chosen since it is well
suited for P & P applications. Considering the P & P industry which is the main focus of this
thesis, the components involved are only the energy related facilities such as boilers, turbines
etc.; a system boundary is placed between the whole pulp mill and the surroundings. Energy
supply passes into the pulp mill boundary, and as it passes each stage it enters some sub-
boundaries within the mill.
4-- 37 -
4.2.2 System Boundaries
The systems approach definition described by Ingelstam (2002) had been raised previously by
Churchman and Churchman (1968). In their description these authors note that a systems
approach makes it possible to avoid boundaries that could be the result of analyzing separate
units within a system separately. By widening system boundaries it is possible to find synergies
that would not have been possible to see from separate units of the mill or one operator’s
perspective at a time. The benefit of widening system boundaries was for example proved by
Sandberg (2004) in his study of an integrated steel works. In this study effort has been put into
making a holistic analysis of the pulp mill rather than separate parts of the mill.
4.3 Case Study
The overall strategy that is used in this cases is case study. The case study theory presented in
this section is mainly based on Yin’s Case study research – design and method (Yin, 1994),
since this this author provides a thorough description of case studies as research method. This
section will describe how case studies are relevant for technical research, particularly energy
system research, how to achieve trustworthiness, and how to draw general conclusions from
case studies
4.3.1 Case Study as Strategy for Industrial Energy Systems Research
When studying industrial systems, a case study is a common approach. According to Yin
(1994), three conditions decide which research strategy is the most appropriate: a) the type of
questions; b) the extent of control an investigator has over the actual behavioural events; c) the
degree of focus contemporary as opposed to historical events. Typical for the study of industrial
energy systems is that the study objects are large and complex and it would therefore be
impossible to perform controlled experiments. One way of getting around this problem is to
perform computer simulations, but then aspects that can be analyzed are limited to what can be
quantified, mainly technical, physical and economic aspects.
Some of the questions in the industrial energy system are “what”, “where”, “how much” etc.
However, more complex questions such as “how” and “why” are also relevant, and they can
only be answered through case studies. Therefore, the case study is a suitable strategy for
industrial system energy research.

4-- 38 -
Yin’s book on case studies is written for social sciences and could therefore be irrelevant for
technical research. But taking a closer look at the field of energy systems explains why it is
still relevant. The study objects in the energy system research area could be categorized as
“socio-technical”, that is technical and social aspects are integrated. In order to understand one
part, you cannot disregard the other. Besides the technical aspects of energy systems, there are
equally important aspects of government regulations, economy and organization structure etc.
For example, to understand why a turbine was purchased and given a certain capacity you need
to know electricity prices and taxation during year of purchase.
4.3.2 Validity of Case Study
Yin emphasises the importance of case study trustworthiness, and points out four aspects that
are essential in order to achieve this: construct validity, internal validity, external validity and
reliability
Construct validity is to establish correct operational measures for the concept being used, as
opposed to subjective judging at data collection. This is achieved through using multiple
sources of evidence, establishing chains of evidence and letting key informants review draft
versions of the report.
External validity is to establish the domain to which the study can be generalised. If it is
possible to conduct multiple case studies, then external validity can be achieved.
Internal validity is how well the causality between events is established in explanatory or casual
studies. This is achieved through pattern matching, explanation building, addressing rival
explanations and using logic models during data analysis.
Reliability is that another case study, following the same procedures, will achieve the same
results. A protocol that describes the sequence of the method and organizes data in a manner
which enables independent inspection, increases reliability. In this study data collection was
conducted through interviews with staff at the mill then combined with analysis of various data
logs collected from the mill.
Construct validity in this research study was achieved by letting the mill management where
the case study was undertaken review the dissertation draft before submission. Pattern
matching and addressing rival explanations was used to address internal validity. The reliability

4-- 39 -
of the dissertation is established in papers that were written with the same intention as
independent inspectors, i.e. that scientific reviewers should be able to follow the procedures.
4.3.3 Conclusions from Case Studies
Yin states that it is not possible to make generalisations from case studies, since there are no
statistical samples representing a pool (Yin, 1994). But it is possible to develop theories from
case studies, analogous to theory development from experiments. The study questions could
be explanatory but also descriptive. Yin states that even if the case study is descriptive or
explanatory it is important to form a theory. A descriptive theory should include: a) purpose of
description; b) what will make the description complete; and c) what will be the essence of the
description. An explanatory theory should include: a) what will be explored; b) the purpose of
exploration; and c) the criteria for the study to be judged successful.
In this dissertation all three kinds of study questions as stated above are found. The study will
be judged according to energy opportunities uncovered and also conclusions from
questionnaires.
4.4 Energy Auditing
One of the tools that was used for the case study was energy auditing which aims at identifying
the energy flows within a system. The analysis that results from energy auditing of industries
aims at identifying energy saving possibilities and can be performed in several ways. For
example, the division of energy into unit processes (Mohey (2016) and pinch analysis
(Linnhoff and Hindmarsh (1983) are all methods of energy usage analysis.
In this dissertation the energy use at a pulp mill was audited. The purpose was twofold and the
energy auditing method was adapted to each purpose. The first purpose was to collect data
which was then used for building a model of the mill. The second purpose was to find energy
saving opportunities within the mill. A top-down approach was applied in the sense that the
analysis started from a high aggregation level and moved towards a more detailed level when
it was found necessary and possible. The collection of data for the model started on the process
level, meaning greater processes such as cooking and black liquor evaporation. Electricity
steam demand for each process within the mill was obtained from the mill’s own data

4-- 40 -
collection. Further, the specific energy use at days with different production levels was looked
up in the mill’s data collection.
4.5 Analysis of Data Collected from Energy Audit Using Energy Footprint Model
An energy footprint has the following characteristics (Iniyan and Sumathy, 2000): a) the overall
energy footprint model represents the total energy input required to generate heat and power;
b) the energy input is categorized into three components: fossil and biomass fuel, energy
supply, and utility/power plant; c) fossil and biomass fuel input is given as one total input
without showing the type of fuel individually; and d) the energy footprint model provides motor
losses and system losses associated with machine drives, as well as electricity generation and
transmission losses (Ozalp and Hyman, 2006). This best suits pulp mill analysis because all the
mentioned processes do occur in the mill which is the subject of this case study. Footprints
identify where energy is lost due to inefficiencies in equipment and distribution systems, both
inside and outside of the plant boundary. The energy footprints were referenced to and used to
map supply and demand of the mill in this study.
4.6 Barriers and Drivers Investigation Methodology
Figure 4-1 shows the research methodology that was used in this study for investigating barriers
and drivers to energy efficiency adoption. In order to achieve the anticipated goals a literature
review was carried out in the field of barriers and drivers to energy efficiency. This was then
developed into a set of broad research questions. The initial questions were later modified and
updated after carrying out some pilot surveys to check that they suited the goals of getting a
clear perspective of energy efficiency adoption by P & P industry. The questionnaire and
interview questions were then refined and finalized. Ten face-to-face and two telephonic semi-
structured interviews were carried out with representatives in the P & P industry in South
Africa.

4-- 41 -
Figure 4-1: Research methodology flow scheme
The questionnaires were able to extract factors affecting energy efficiency adoption by
industry. The main focus of the questionnaires was on the factors which influence the adoption
of capital and retrofitted projects. However, consideration was also given to the low/no-cost
interventions of maintenance and optimization, often referred to as ‘low hanging fruit’. The
questionnaires were made up of rating questions in an attempt to provide a quantitative
evaluation of those factors that had been addressed in the interviews. Consideration here was
given to:
• Energy efficiency measures’ potential for improvement.
• The overall effect of influences that are involved in channeling energy efficiency
adoption by industry forward.
• Policy and organizational driving forces in the adoption of energy efficient measures
by the P & P industry.
• The influence of barriers to uptake of energy efficiency opportunities.
De Groot et al. (2001) study was used as a basis for formulating the questions relating to the
rating of scores for barriers and drivers. The scores range from 1 (completely insignificant) to
5 (very significant). Prior study of barriers and drivers was used as a basis for rating the scores.
Preliminary Pilot Interviews
Literature Review Research Question:
Define and Refine Research Questions
Barriers &
Drivers
Energy Efficiency
Opportunities
Qualitative
Interview
Quantitative
Questionnaire
Research Instruments:
Questionnaire, Interviews
Collect Data
Data Analysis and Interpretation
Report

4-- 42 -
4.7 Summary
This chapter presented various methods and tools used for collecting data during the research.
The tools are case study, questionnaire, energy audit and energy footprint models. The data
analysis regarding energy use will be presented and discussed in Chapter 7 and for barriers and
drivers to energy efficiency adoption in Chapter 8.
5-- 43 -
CHAPTER 5 : BARRIERS AND DRIVERS FOR ENERGY EFFICIENCY
5.1 Introduction
In this section barriers that inhibit energy efficiency in P & P industries and the driving forces
that are driving energy efficiency adoption are reviewed.
5.2 Background to Barriers and Drivers for Energy Efficiency Adoption
Sorrell (2004) defines a barrier to energy efficiency as “a postulated mechanism that inhibits a
decision or behavior that appears to be both energy and economically efficient”. In order to
expand on this definition in the context of this research, a barrier is hereby referred to as a
factor that negatively impacts an organization’s intention to implement energy efficiency
opportunities. Several studies have identified energy efficiency measures across a diversity of
industries (Hasanbeigi et al., 2010, Worrell et al., 2001). These measures include low-cost or
no-cost options for reducing organic fuel energy usage. Research has shown that the P & P
industry does not adopt energy efficiency measures in spite of them being practical and able to
reduce energy use significantly (Brown, 2001). The difference that arises between energy
efficiency levels achieved and theoretical energy efficiency levels is hereby defined as the
energy efficiency gap (Brown, 2001); (Jaffe and Stavins, 1994a).
Many debates have been undertaken about why energy efficiency measures are not adopted by
industry and as of today many researchers have concluded that industry is not willing to uptake
technologies that can result in substantial energy savings (DeCanio, 1998); (Sanstad and
Howarth, 1994). Two conflicting observations have been noted on the existence of energy
efficiency gaps in industry. One observation takes cognizance of the fact that the majority of
energy managers take cost minimization decisions. This is because many managers prefer
improvements that are cost effective and therefore all projects not implemented are therefore
regarded as being not cost effective. More consideration is hereby taken to view energy saving
measures as being unnecessarily expensive hence are not important as the P & P industry is
economically efficient already. However, the contrary observation exists which is that the P &
P industry is not economically efficient since it does not adopt energy efficiency measures.
These analysts base their observation on the expected level of energy efficiency that can be
5-- 44 -
achieved by this sector. It is hereby concluded that many opportunities are not adopted because
many barriers are still in place and inhibit improvement and these are discussed in detail in the
following sections.
5.3 Barriers to Energy Efficiency in Pulp and Paper Industry
Barriers to energy efficiency in the P & P industry have been identified and summarized in
several studies (De Groot et al., 2001); (DeCanio and Watkins, 1998); (Sardianou, 2008). These
barriers have been categorized into different groups. In this research, barriers to energy
efficiency adoption by P & P industry can be grouped into: i) financial, economic and market
barriers, ii) institutional, organizational and behavioral barriers, iii) technological barriers, and
v) uncertainty barriers.
5.3.1 Financial, Economic and Market Barriers
Financial, economic and market barriers described in this dissertation are discussed below.
Availability of Capital – Competition between energy and maintenance projects for available
capital is a huge barrier to energy efficiency measures adoption in the P & P industry.
Availability of capital has a large impact on capital energy projects. Many energy projects
require training of staff hence it is vital that enough capital is made available for energy
projects. For energy efficiency projects to gain attention for allocation they must be well
justified and the return on investment must be clearly defined (Reddy and Assenza, 2007).
High Hurdle Rates – Corporations often require high internal hurdle rates for investment to be
undertaken, which are set at greater levels than the cost of capital (DeCanio, 1993). Investment
decisions are subject to budget constraints. It is a complex decision to invest in new pulping
processing capacity as the decision is highly dependent on present asset performance and
expectations about the future (Reddy and Assenza, 2007). On the other hand, Hassett and
Metcalf (1993) argue that “what appears to be myopic behavior, i.e. a high discount rate, may
simply reflect an optimal investment strategy in the face of uncertainty”, and therefore the high
hurdle rate is simply a manifestation of future uncertainty. The payback period is a financial
tool that can be used to inform investment decisions and it is generally termed as the time
required to recoup the investment cost through energy savings. Energy consumers generally
insist on relatively short payback periods of approximately two years (Reddy, 1991). Some

5-- 45 -
energy efficiency improvements have a relatively short payback period, however “deep
retrofits” which save the most energy, require a longer time to pay back (Schwab, 2009).
According to Simon (1979), short paybacks required for energy efficiency investments may
represent a rational response to risk.
Competing Investment Priorities – It is common that every organization will encounter
competing investment priorities. Prioritizing energy projects as opposed to maintenance or
process upgrade projects can cause a diversion from the pulp mill core business of producing
pulp. Giving more attention to energy efficiency projects causes production process
unreliability and low capacity growth (Szklo and Schaeffer, 2007). Most companies tend to
focus more on increasing market share of their products and increasing profit margin than on
opting for energy efficiency projects which are viewed as having a small return on investment
(Hassett and Metcalf, 1993). Preference is given to projects that produce new products or those
that increase plant capacity and not to energy saving measures (Ren, 2009).
Economic Trend or Market Situation – An important obstacle for energy efficiency investments
to take place is the external risk of the economic climate or market situation, such as an
economic downturn. If a firm has difficulty raising additional funds through borrowing or share
issues, energy efficient investments may be prevented from going ahead due to lack of available
capital (Simon, 1979). In a stagnating market situation, investment in new technologies may
be overshadowed by maintenance and minor improvements to extend the lifetime of existing
technologies (Simon, 1979).
Delayed Investment Decision – Many organizations delay their investment decisions based on
availability of information regarding return on their expenditure. A firm may also ‘hold’ an
option to invest by waiting for new information that could affect the timing or attractiveness of
the expenditure. This “ability to delay irreversible investment expenditure can profoundly
affect the decision to invest”. The investor holds an option not to invest, prior to making an
investment decision. This option of not investing is valuable because once the investment is
made, the option is lost, as the investment cannot be undone (irreversibility of the investment).
This option then becomes more valuable with increasing uncertainty in future energy costs
(Hassett and Metcalf, 1993).

5-- 46 -
Perceived Cost of Energy Saving Measures – Generally, a higher initial cost is incurred for
higher energy efficiency equipment (Reddy, 1991). There is a perception that these first costs
are too high for energy efficiency measures. Despite the possibility of long term savings, these
high upfront costs can deter investment (Simon, 1979). The decision maker has to decide
whether to minimize upfront costs or minimize energy costs in the future (Reddy, 1991). In
addition, energy saving projects rarely rank equal with projects to capture new markets or
increase production in fast growing economies. The main financial benefits of energy
efficiency investments are focused on energy cost savings, as opposed to visible new
production assets. The slow rate of return of investments and uncertainty about future energy
prices, especially in the short term, can result in higher perceived risk and this risk leads to
more stringent investment criteria associated with projects (Sardianou, 2008).
Transaction Costs – Small incremental opportunities in energy efficiency can lead to big
savings, although as opposed to one large investment, these actions have transaction costs (Ren,
2009). Collecting relevant information and researching new technology uses valuable time and
resources, therefore many industries may prefer to focus financial and human capital on other
investment priorities (Simon, 1979). These transaction costs are often omitted in cost
evaluations without justification. They mostly comprise information costs such as search costs,
data collection costs, negotiating and monitoring costs. These costs depend on the
organizational set-up and the routines for making and implementing decisions. Transaction
costs are sometimes confused with hidden costs although in the true sense, transaction costs
are a subset of hidden costs (Ostertag, 1999). Hidden costs are generally referred to in energy
economics literature as any costs which are not conventionally included within engineering
economic models (Sorrell, 2004). The various types of neglected or ‘hidden’ costs can include
‘production’ type costs such as the cost of possible production disruption or the embedded cost
of specialist personnel for installation or maintenance due to energy efficiency measures
(Ostertag, 1999).
Lack of Specialized Knowledge – According to Tonn and Martin (2000) and De Groot et al.
(2001) the lack of knowledge by decision makers is one of the main causes of market failure
to implement energy efficiency opportunities. The inability to account for the economic
benefits of energy efficiency improvements is an additional information challenge and

5-- 47 -
adequate management techniques, tools and procedures are often lacking within companies
(Worrell and Price, 2001).
Lack of Credibility and Trust – Many energy usually users adopt the most credible information
available to them (Reddy, 1991); (Rohdin et al., 2007). Information providers for energy
efficiency should be well informed and honest (Sorrell, 2004). It is common that some
information providers such as energy services companies may be distrusted by many firms due
to lack of industrial sector specific knowledge required to offer such services in order to give
accurate energy consumption estimates (Brown et al., 1998).
Split Incentives – According to Brown et al. (1998), if actors cannot appropriate the benefits
of an investment, energy efficiency opportunities are likely to be forgone. An example which
is given is the lack of incentive to improve energy efficiency by individual departments within
an organization if they are not accountable for their energy use. In addition, within businesses,
operating and capital budgeting are often handled separately in the accounting and budgeting
process. There may be split incentives or disconnect between the party who makes the initial
investment or procurement decisions and the party who pays the on-going operating costs.
Therefore, projects may be rejected in the capital budget even though they provide investment-
grade returns to the operating budget (Brown et al., 1998). This fundamental contradiction in
incentives can lead to inheritance of inefficient equipment (Reddy, 1991).
Furthermore, according to DeCanio (1993), the interests of managers and shareholders may
not always coincide. Managers are induced to act in a manner as consistent as possible with
the interest of the shareholders of the corporation, through the organizational design. Due to
this principal problem many profitable investments might not be undertaken (Statman and
Sepe, 1984).
Short Term Thinking and Planning of Owners – Underinvestment in energy saving
technologies has been frequently claimed to stem from short-sightedness of management. This
short-termism is considered to manifest in very short payback periods required of investments
(DeCanio, 1993). Often short-run earnings, earnings per share or sales growth are rewarded,
and may encourage management to forego investment in the maximization of long-run value
of the firm (Pinches, 1982). In addition, investment in human capital for energy conservation
expertise i.e. retraining, will be low if the compensation and prestige of the managers

5-- 48 -
responsible for energy use (facilities personnel) are less than the rewards for other positions
(DeCanio, 1993).
Energy Management Not Core Business Activity – The behavior of individuals within the
industrial firm affects the decision making process for investment decisions. Investment in
energy efficiency improvement is thus linked to managerial attitudes towards energy
conservation. With this in mind, there is a common view that energy efficiency is often
overlooked by management because it is not a core business activity, thus it is not worth much
attention (Sardianou, 2008).
Bureaucratic Procedures Aimed at Garnering Government Incentives – Most organizations in
the P & P industry do not undertake energy efficiency investments if they are not government
funded (Brown et al., 1998). It is common that some organizational policy in the P & P industry
may prevent government from offering financial support for energy efficiency measures
(Sardianou, 2008)
5.3.2 Technological Barriers
Technical Risks – Common technologies are generally preferred rather than new energy
efficiency practices due to reliability and operational risks (Reddy and Assenza, 2007).
Business decision makers are more likely to initiate energy efficiency adoption rather than
engineering decision makers who should be involved due to the technical risks involved
(Brown et al., 1998). Lengthy field testing of new technologies, slower diffusion of technology
and more stringent investment criteria all impact negatively on energy efficiency adoption
(Reddy and Assenza, 2007).
Technology Fitting into Process – It has been difficult to incorporate new technology into
existing pulp mills (Zilahy, 2004). Process designs of existing processes makes it difficult to
retrofit new technologies due to space limitations. Hence engineering decision makers tend to
prefer installation of ‘already known’ process equipment as opposed to new technology with
high savings returns.
Resistance to Replacing Existing Machinery – The resistance to replace existing machinery is
an important obstacle to energy efficiency improvement (De Groot et al., 2001). The long life
time of energy intensive industrial equipment can hamper replacements for new technology

5-- 49 -
(Worrell et al., 2001). In many cases, equipment is be used as long as their functioning can be
preserved by regular maintenance (Zilahy, 2004). When a company invests in a new
technology, it takes into account the depreciation costs of the existing machine that is not fully
depreciated. This influences the payback period of the new technology as these costs for early
depreciation need to be added to the operating costs of the new technology
Loss of Flexibility in Process – Small technology modifications in pulp mills can result in
major process upgrades and performance. In spite of that, the uncertainty that goes with
integrating new technologies with old ones due to fear of losing flexibility in processing is a
huge barrier to energy efficiency adoption (Reddy and Assenza, 2007). The integration process
may manifest in the process becoming more complex and very inflexible.
Uncertainty in Energy Price – Energy efficiency decisions involve the analysis of future energy
prices and potential energy savings. Understanding the potential for future savings can be
difficult as the variation and unpredictability of future prices are significant areas of
uncertainty. Energy prices, and therefore the returns from an investment (avoided energy
costs), are subject to fluctuations. This uncertainty seems to be a particularly important barrier
in the short term (Velthuijsen, 1995). More stringent investment criteria are often the result of
higher perceived risk from these uncertainties (Worrell et al., 2001). Investors tend to avoid
investments by playing it safe, leading them to postpone the decision during times of economic
instability when uncertainties are aggravated. (Hassett and Metcalf, 1993)suggest that the slow
diffusion of new energy technologies may be the result of rational cost minimizing behavior in
the light of uncertain future conservation savings, rather than the result of consumer/investor
ignorance.
Uncertainty Related to Environmental Regulations – Uncertainty regarding environmental
regulation poses a huge barrier to energy efficiency adoption in P & P industry (De Groot et
al., 2001).
Uncertainty about Future Technologies – Fears that future technologies will be significantly
better or cheaper can be a rational reason for decision makers to delay an investment in energy
efficient technology. Delaying an investment means short term energy savings may be
foregone. But due to the irreversibility of an investment, a firm waiting to install better
technology options in the future may benefit in the long run (Van Soest and Bulte, 2001).
5-- 50 -
5.4 Drivers for Energy Efficiency Improvement
In addition to the development of a wide-scale support infrastructure, deploying energy
efficiency also requires the investment of capital (Dutta and Mia, 2010). Drivers for energy
efficiency improvement include:
Decrease in Technology Price Levels – The price of a technology is an important factor in the
penetration of energy efficient technologies into the market. Competition can lead to a decrease
in the cost of a technology (Reddy and Assenza, 2007).
Increase in Energy Prices – According to Reddy and Assenza (2007) a continuous and
predictable increase in energy prices affects purchasing and investment decisions for energy
efficient equipment, where the direct cost savings in energy bills through reduced energy
consumption is a motivation to adopt energy efficient equipment (Reddy and Assenza, 2007).
Awareness – This is regarded as a key driver to energy efficiency since the flow of information
created by awareness activities like campaigns and advertisements is rapid (Reddy and
Assenza, 2007).
Technology Appeal – Non-economic motivators, such as the impression that energy efficient
equipment gives, is a factor worth considering. Technologies ‘smartness’, such as that it looks
‘appealing’, ‘fashionable’, and ‘modern’, can be a dominating factor in high-income groups,
where technology appeal is a major driving factor (Reddy and Assenza, 2007).
Non-Energy Benefits – From an end-user perspective, non-energy benefits can also motivate
energy efficiency. These can be direct or indirect economic benefits such as from i) downsizing
or elimination of equipment, ii) labor and time savings, or iii) increased reliability, convenience
and productivity (Reddy and Assenza, 2007).
Environmental Regulations – The impact of environmental regulation is a key driver for energy
efficiency since it allows companies to formulate a clear framework to monitor energy
consumption due to charges involved in violating them. These regulations are a key driver of
internal environmental costs which make energy saving investments very attractive (Reddy and
Assenza, 2007).

5-- 51 -
Values and Culture – The values and culture shown by an organization is a combination of
different individual values and culture. Top management values and culture have the greatest
impact on the overall picture portrayed by an organization (Simon, 1979).
Credibility and Trust – This is key on the part of consultants in communicating energy saving
suggestions to organization since the more credible you are the more your information is
adopted and implemented.
5.5 Summary
This chapter has presented a summary of barriers and drivers related to the adoption of energy
saving measures. This information formed the basis for development of the questionnaire used
in this study. The questionnaire can be found in Appendix A on page 103.

6-- 52 -
CHAPTER 6 : ENERGY MANAGEMENT
6.1 What Is Energy Management?
Energy management is defined as the judicious and effective use of energy to maximize profits,
minimize costs, and enhance competitive positions (Capehart et al., 1982).
Another comprehensive definition is: “the strategy of adjusting and optimizing energy, using
systems and procedures, so as to reduce energy requirement per unit output while holding
constant or reducing total costs of producing the output of the system” (Anderson and Newell,
2004).
The objective of energy management is to achieve and maintain optimum energy procurement
and utilization throughout the organization and:
• To minimize energy costs/waste without affecting production and quality.
• To minimize environmental effects.
According to Lackner and Holanek (2007) energy management refers to structural attention to
energy with the primary objective of continuously reducing energy consumption and
maintaining the achieved improvements. It ensures that an organization continually passes
through the cycle of making policy, planning actions, implementing actions and checking
results, based on which policy is made. This cycle makes continuous improvement possible as
reflected below in Figure 6-1 which illustrates the modified Deming’s circle by Lackner and
Holanek.

6-- 53 -
Figure 6-1: Deming's circle
(Lackner and Holanek, 2007)
The implementation of an energy management system is not objective in itself. What matters
is the results of the system. Whether an energy management system works is dependent on the
willingness of the (relevant) organization to manage energy consumption and energy costs. The
willingness needs to find expression in their deeds whatever their main reasons are: controlling
costs, environmental considerations, legal requirements, social agreements and image.
Organizations seeing the financial returns from superior energy management continuously
strive to improve their energy performance. Their success is based on regularly assessing
energy performance and implementing steps to increase energy efficiency. No matter the size
or type of organization the common element of successful energy management is commitment.
Organizations make a commitment to allocate staff and funding to achieve continuous
improvement. Changing how energy is managed by implementing an organization-wide energy
management program is one of the most successful and cost effective ways to bring about
energy efficiency improvement (McKane and Price, 2007).
6.2 Energy Management Practices
Dusi and Schultz (2012) suggest that clear and measurable energy efficiency targets is a major
tool to kick start energy management programs. It should also be noted that an organization
should be always aware of its energy efficiency improvement potential (Antunes et al., 2014).
Furthermore, achievable target setting must be well documented and a policy be prepared and
communicated in order to make the whole organization aware of the policy (Antunes et al.,
2014); (Ates and Durakbasa, 2012). According to Antunes et al. (2014) “the energy policy must
6-- 54 -
provide a clear definition of energy objectives and targets, to ensure sufficient resources and
the commitment to maintain an energy strategy”. This requires training of staff, communicating
and performing regular reviews, among other activities. In addition to that the energy policy
should provide guidance to the organization in procurement of energy related equipment,
services and resources (Antunes et al, 2014).
Another important practice is to create an action plan or energy strategy for energy
management (Antunes et al., 2014); (Dusi and Schultz, 2012). After setting an energy policy
an action plan is created for defining how to achieve the proposed goals and prioritizing and
assigning action plans to employees, including responsibilities, time and budgets (Antunes et
al., 2014). A long time strategy is also required for practising successful energy management
(Thollander and Ottosson, 2010). According to Thollander and Ottosson (2010), the existence
and duration of a long term energy strategy in energy management is especially important for
industrial companies. Reducing energy use and energy costs could be one of the many goals
included in the strategy (Thollander and Ottosson, 2010). Achieving the set goals of energy
management requires careful planning and thorough implementation. Creating an action plan
and or energy strategy may help in reaching these goals. In regard to implementation of action
plans there are various practices that need to be taken into account. One of the most essential
practices is metering the energy consumption of main processes (Antunes et al., 2014); (Ates
and Durakbasa, 2012) and identifying the main consumers of energy in the organization.
Naturally one of the minimum requirements is to implement energy efficiency projects
according to the targets set (Ates and Durakbasa, 2012).
Other important energy management practices are setting payback criteria for energy efficiency
investments, careful allocation of the company’s energy efficiency investments costs and
screening of various information sources for energy efficient technologies (Thollander and
Ottosson, 2010). Finally, Dusi and Schultz (2012) suggest that energy management requires
benchmarking, audits, reporting and communication. An organization should check and take
corrective action when needed, review and improve the system continually. According to
Antunes et al. (2014) the management is responsible for reviewing all implemented measures.
In regard to personnel, it is essential to have addressed dedicated team or individuals in charge
of energy management in an organization (Antunes et al., 2014); (Dusi and Schultz, 2012). The
responsibilities regarding energy management should be clearly determined within the

6-- 55 -
organization (Kannan and Boie, 2003). Ates and Durakbasa (2012) suggest that having an
official energy manager is necessary for energy management. Many scientists argue that one
of the required energy management practices is to ensure management commitment (Antunes
et al., 2014); (Thollander and Ottosson, 2010). According to Thollander and Ottosson (2010)
successful energy management practices requires commitment from senior management. The
most important practice in any organization seem to include setting energy saving goals or
targets, creating an energy policy, establishing an action plan, metering energy consumption
defining the main energy users, ensuring management commitment and addressing a team
responsible for energy management.
6.3 Energy Teams
Commitment to energy management success requires formation of an energy team. This is the
major step that is undertaken to energy efficiency strategies that are discussed and policy
formulation drafted. The energy team’s main responsibilities are to enhance regular
monitoring, evaluation and organization of the energy management program. Other duties of
the energy team may include employee training and recognition and reporting on energy
performance to management (Thollander and Ottosson, 2010).
The roles and responsibilities of each member of the energy team should be clearly defined in
order to enhance smooth undertaking of duties involved. Top management should also
recognize the energy team’s responsibilities as part of their core business roles. This requires
the delegation of one member from the senior management to be involved in supporting the
energy team and reporting their progress and addressing their concerns at corporate level.
Representation of each business unit in the energy team is key in ensuring a diversity of views.
Normal budget allocation will also be a major step in allowing the smooth flow of energy
projects as opposed to special budget allocation during the year.
Before launching the energy management team, it is vital that several strategic meetings are
organized aimed at discussing potential energy efficiency projects and reporting methods.
Energy surveys should be conducted throughout the pulp mill so that the energy team has a
clear picture of energy consumption of the mill. This will enhance easy identification of
projects and aid in monitoring and energy tracking mechanisms for the whole mill, providing
a perspective on overall energy consumption in the mill.
6-- 56 -
It is vital that monitoring and evaluation tools are discussed prior to energy program launching.
Reporting progress garnered from energy programs and transfer of the knowledge gained from
energy surveys should be discussed during meetings held before launching the program to
reduce the problems that might evolve as the energy management programs is underway.
Companies needs to hold energy fairs and generate awareness of energy efficiency programs
in order to educate the whole organization of its energy policy, objectives and targets. Most
organizations should aim to have their own best practice database and benchmark targets for
comparing their past and present performance against set goals.
6.4 Summary
This chapter has discussed the energy management program, its definition, practice and the
importance of energy teams. It is vital that an energy management is implemented in an
organization and following the methods discussed above this can easily achieved.

7-- 57 -
CHAPTER 7 : ENERGY ANALYSIS OF PULP MILL A
7.1 Introduction
This chapter discusses the pulping processes for Pulp Mill A, energy use and loss analysis and
energy saving opportunities identified during the case study. The main objective of the case
study was to help identify areas where energy is being lost and recommend possible energy
saving suggestions that can be incorporated into real world operations. This chapter answers
the following questions:
a) Where is energy used in a typical P & P mill?
b) Where is energy lost in a typical P & P mill?
c) Which technical opportunities are available for energy savings in P & P mills and where
do they lie?
7.2 Case Study of Energy Consumption and Loss Analysis
7.2.1 Audit Approach
The energy audit was characterized by a walk-through survey to understand the pulp mill
processes and also to understand the equipment that is used in the mill. During that initial
survey, preliminary identification of the energy conservation opportunities was done. Many of
energy conservation opportunities were identified and a qualitative screening analysis was
performed to identify energy efficiency opportunities that had significant energy saving
potential, which warranted further study. Focusing on those opportunities that had better energy
saving potential was done afterwards. During the data analysis all data collected were cross-
checked and where necessary engineering judgement was applied. The level of engineering
detail varied according to each energy efficiency opportunity identified, with less detail
required on simple inexpensive energy efficiency measure and more detail on capital intensive
retrofitting measures.
7.2.2 Plant Description
The mill under study is situated 50 km south of the port of Durban in South Africa. It has
become one of the largest mills of its sort in the world. Today it is the single largest

7-- 58 -
manufacturer of chemical cellulose with a capacity to produce approximately 800 000 tons of
pulp per year, most of which is sold to Europe, America and Asia. It is also renowned for being
the first company to produce high grade dissolving pulp from Eucalyptus trees. The process
flow diagram is shown in Figure 7-1.
Figure 7-1: Process flow diagram for Pulp Mill A
As can be seen in Figure 7-1, wood is firstly debarked and then chipped. The wood chips are
mixed with water and enter the digester to remove the hemicellulose and lignin through
solubilization. The solubilization occurs at a temperature of approximately 160 ℃ with sulphur
dioxide in combination with either magnesium oxide (Mg-O) or calcium oxide (Ca-O).
Currently, the facility has three digestion lines, two of which use magnesium oxide as the
solubilization agent while the third utilizes calcium oxide. The digester product slurry is then
washed and separated into the pulp, which is bleached and rolled into sheets, and diluted SSL,
which contains lignosulphonates (water-soluble lignin), sugars and organic acids and phenolic
compounds. The SSL from the magnesium oxide lines is processed for the recovery of energy
(steam and power) and pulping chemicals. The SSL is concentrated in a multi-effect evaporator
prior to combustion of the resulting syrup in a recovery boiler, which recovers magnesium

7-- 59 -
oxide and sulphur dioxide for the digestion process The energy generated from the combustion
of SSL is often not sufficient to satisfy the energy demands of the mill itself, and an additional
fuel source such as bark, field biomass residues (collected and processed into hog fuel) or coal
is needed. The spent SSL from the calcium oxide digestion at Pulp Mill A is split into two
streams, one of which is sent to a neighboring lignosulphonates recovery plant, and the second
is discharged as effluent.
7.3 Findings from Observations
7.3.1 Instrumentation
It was noted during the audit that the mill is not well instrumented. Inadequate instruments are
hindering smooth production and energy consumption monitoring. This might be attributed to
the original design of the mill hence more detailed survey is needed to find ways of improving
pulp mill instrumentation, that is, valves, transmitters’ controllers and actuators availability at
strategic measuring points.
7.3.2 Management and Organization
The audit identified that the engineering department does not have energy management
textbooks. No energy related technical information documentation is available at the mill and
this affects the smooth flow of activities since no engineer can perform at their best without
adequate technical referencing. The recommended corrective measure will be to purchase
energy related textbooks for use by the engineering department staff.
It was also noted that most engineering personnel have narrow defined responsibilities. This
works well if the primary focus of keeping production equipment operating at peak is to be
achieved but makes them lack in general energy management skills. Competent energy experts
should have an integrated outlook of the mill in order to accomplish their job well.
Overspecialisation in an energy professional can result in energy efficiency opportunities being
missed. By periodically rotating positions the staff can develop a better background and a more
comprehensive and integrated outlook of the plant.
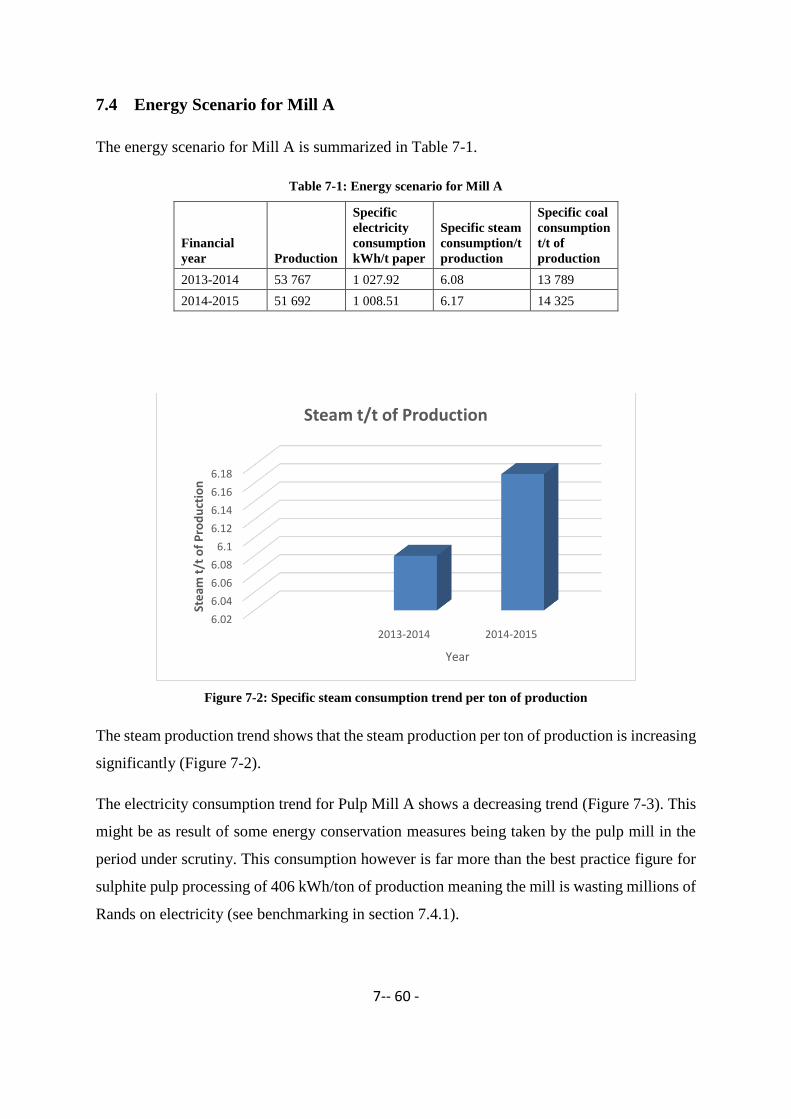
7-- 60 -
7.4 Energy Scenario for Mill A
The energy scenario for Mill A is summarized in Table 7-1.
Table 7-1: Energy scenario for Mill A
Financial
year Production
Specific
electricity
consumption
kWh/t paper
Specific steam
consumption/t
production
Specific coal
consumption
t/t of
production
2013-2014 53 767 1 027.92 6.08 13 789
2014-2015 51 692 1 008.51 6.17 14 325
Figure 7-2: Specific steam consumption trend per ton of production
The steam production trend shows that the steam production per ton of production is increasing
significantly (Figure 7-2).
The electricity consumption trend for Pulp Mill A shows a decreasing trend (Figure 7-3). This
might be as result of some energy conservation measures being taken by the pulp mill in the
period under scrutiny. This consumption however is far more than the best practice figure for
sulphite pulp processing of 406 kWh/ton of production meaning the mill is wasting millions of
Rands on electricity (see benchmarking in section 7.4.1).
6.02
6.04
6.06
6.08
6.1
6.12
6.14
6.16
6.18
2013-2014 2014-2015
Ste
am t
/t o
f P
rod
uct
ion
Year
Steam t/t of Production

7-- 61 -
Figure 7-3: Specific electricity consumption per ton of production
The coal consumption trend for Pulp Mill A from 2013 to 2015 is shown in Figure 7-4. It is
clear from the figure that specific coal consumption was increasing per ton of pulp produced.
This might be an indication that there is energy efficiency improvement potential within the
coal fired generation units.
Figure 7-4: Specific coal consumption trend
7.4.1 Benchmarking Comparison
Benchmarking is fundamental for comparative analysis. It is usually undertaken to compare
production costs of various mills, mill uptime, energy consumption profiles or other critical
energy parameters. Benchmarking is always conducted against mills of a similar type
995
1000
1005
1010
1015
1020
1025
1030
2013-2014 2014-2015
kWh
/t o
f P
rod
uct
ion
Year
Electricty kWh/t of Production
13400
13600
13800
14000
14200
14400
2013-2014 2014-2015
Ste
am t
/t o
f P
rod
uct
ion
Year
Specific Coal Consumption Trend

7-- 62 -
producing essentially the same product. Gap analysis will reveal the difference between mills
of same age and design criteria. Benchmarking should be the first step a mill should undertake
in order to get a clear picture of its operations. Benchmarking enables mill management to get
a relative performance comparison of their mill with similar mills or models that represent
norms of best practice performance. Further, benchmarking is also useful in energy efficiency
studies in providing the necessary direction in search of energy efficiency opportunities.
However, for it to be relevant, section wise benchmarking must be carried out, and energy type
e.g. steam, electricity quantified and compared accordingly.
The specific electricity consumption of Mill A for 2014 is 1 027 kWh/Ton of pulp. It is evident
from Table 7-2 that Pulp Mill A’s electricity consumption is higher compared to the norms set
by best practice. It is evident that Pulp Mill A consumes 152% more electricity compared to
the norms set by best practice. In order to improve the specific consumption of electricity there
has to be continuous effort to find energy conservation opportunities and to implement those
opportunities and optimization of the process.
A plant-wide breakdown of specific equipment can be done in order to get a clear picture of
the electricity consumption pattern.
Table 7-2: Specific energy consumption of best practice (BP) and Pulp Mill A
Specific consumption Sulphite pulp Grade Index
BP value Mill A MILL A / BP
Electricity (kWh/t of
production) 406 1027 2.52
Steam (t/t of production) 8.01 6.08 0.75
7.5 Analysis of Mill A Energy Losses Methodology
7.5.1 Step 1: Questionnaire
A questionnaire was designed and handed out in order to retrieve the data required to analyze
the pulp mill energy profile. Information required was on energy inputs into the plant boundary,
black liquor used, electricity sales and sectional equipment energy consumption. The
questionnaires were well answered and all the data required was captured. Complete data that
was available was for the year 2014.

7-- 63 -
7.5.2 Step 2: Total Energy Supply, 513 082 GJ/M
Energy supply is the sum of fuel consumption, purchased electricity, steam, biomass, and black
liquor or by-product fuels. After analyzing the data obtained for 2014, the energy supply was
24 145 511 kWh/M transforming to 86 924 GJ/M of electricity, 13 789 tons/M of coal
equivalent to 382 782.64 GJ/M, 159 tons/M of High Fuel Oil (HFO) equivalent to 6 758
GJ/M, 3 449.67 tons/M of sulphur representing 32 185 GJ/M, 75 117 litres/M of diesel
equivalent to 2 961 GJ/M, 3 886 litres/M of petrol equivalent to 147 GJ/M and 51.94 𝒎𝟑/M
of LPG equivalent to 1 325 GJ/M. This means 513 082 GJ/M of energy went into the mill in
2014 as shown in Table 7-3.
Table 7-3: Energy supply for 2014
7.5.3 Step 3:. Central Energy Generation/ Utilities 1 281 098 GJ/M
This value includes energy supply plus the black liquor that came from mill, represented by
renewable energy on the flow diagram. (Figure 7-5). Onsite power generated refers to the
energy that was produced onsite by a coal fired system or from recovery of black liquor.
(513 082 GJ/M) + (768 016 GJ/M) = 1 281 098 GJ/M
Renewable energy to boiler was composed of black liquor which was about 246 414 GJ/M
from MGO1 and 521 602 GJ/M from MGO2 giving a total of 768 016 GJ/M.
Steam plant energy was composed of 100 464 tons/M from coal fired boiler, 217 968 tons/M
from recovery boilers and 8 420 tons/M from sulphur boilers making a total of 326 852 tons/M
of steam equivalent to 882 500 GJ/M.
Energy source Units/M
Figures for
2014
Conversion
factors
Converting to
GJ/M %
Coal Tons 13789 27.76 382 782 74.6
Electricity kWh 24 145 511 0.0036 86 924 16.94
Sulphur Tons 3 450 9.328 32 185 6.27
HFO Tons 159 42.5 6 758 1.32
Diesel Litres 75 117 0.88x44.8/1000 2 961 0.58
Petrol Litres 3 886 0.8 X 27.3 147 0.03
LPG 𝑀3 51.94 25.5 1 325 0.26
Total 513 082 100

7-- 64 -
Loss in Boilers and Electricity, 194 400 GJ/M
This is quantified by first determining the total energy that was supplied to boilers then subtract
onsite generation, steam plant energy and electricity sales figures from it.
(Fuel to Boilers) – (Steam Plant Energy) – (Power Generated) – (Electricity sales)
(1 189 742 GJ/M) – (882 500 GJ/M) – (112 042 GJ/M) – (800 GJ/M) = 194 400 GJ/M.
Direct fuel Supply, 4 432 GJ/M
(Central Energy Generation) – (Steam Plant Energy) – (Power Generation) – (Utility Power
Plant) – (Losses to Boilers) – (Electricity Sales).
(1 281 098 GJ/M) – (882 500 GJ/M) - (112 042 GJ/M) – (86 924 GJ/M) – (194 400 GJ/M) –
(800 GJ) = 4 432 GJ/M.
7.5.4 Step 4: Energy Distribution, 1 086 098 GJ/M
This quantifies energy that was supplied to the system processes. It is quantified by taking off
losses in boiler and electricity generation from the Central Energy Generation figure.
(Central Energy Generation) – (Losses in boilers and electricity generation) – (Electricity
sales).
(1 281 098 GJ/M) – (194 400 GJ/M) – (800 GJ/M) = 1 086 098 GJ/M.
Distribution Losses, 270 852 GJ/M
These losses occur in energy distribution channels like valves, steam traps, pipes and electrical
transmission lines. The losses are quantified based on some rough estimates based on P & P
industry operation experience. The losses range from 5% to 40% although in this report a figure
of 30% for steam distribution, 3% for fuel transmission ad 3% for electricity transmission is
used in the calculations. Take note that losses in steam pipes and straps have been reported to
be as high as 20% to 40% (Hooper and Gillette, 2002).
Calculations of Distribution Losses are as follows:
Steam Pipes: (Steam Plant Energy)*30%
(882 500) *0.3 = 264 750 GJ/M

7-- 65 -
Fuel Pipes: (Direct Fuel Supply) *3%
(4 432) *0.03 = 133 GJ/M
Electricity Lines: (Utility Power + Power Generation)*3%
(198 966) *0.03 = 5 969 GJ/M
Total Transmission Losses 264 750 GJ/M + 133 GJ+ 5 969 GJ/M = 270 852 GJ/M.
7.5.5 Step 5: Energy Conversion, 815 446 GJ/M
This value is quantified by subtracting distribution losses, energy to facilities and export energy
from energy distribution. It represents the energy that goes into process systems, including
process heating, motor driven equipment and process equipment.
(Energy Distribution) – (Distribution Losses) – (Non-Process Energy/ Facilities)
(1 086 698 GJ/M) – (27 082 GJ/M) – (400 GJ/M) = 815 446 GJ/M.
Total energy conversion equipment losses = process heating losses + cooling system losses +
electrochemical losses + other losses.
(62 643 GJ/M) + (31 862 GJ/M) + (5 831 GJ/M) + (1 554 GJ/M) = 102 890 GJ/M
Total machine drive losses = pump losses + fan losses + compressed air losses + refrigeration
+ other drive losses (see Table 7-4).
(18 592 GJ/M) + (9 013 GJ/M) + (29 216 GJ/M) + (125 GJ/M) + (2 345GJ) + (1 475) + (500
GJ/M) = 62 265 GJ/M
Total equipment losses = total energy conversion losses + total machine drive losses
102 890 GJ/M + 62 265 GJ/M = 163 155 GJ/M
Table 7-4: Other energy conversion losses
Other energy
conversion losses
Energy
use
System
loss
Energy
loss
Assumption based on
operation experience
Process heating 417 617 0.15 62 643 (15% rough estimate)
Electrochemical
system 31 816 0.15 31 862 (15% rough estimate)
Cooling systems 58 312 0.1 5 831 (15% rough estimate)
Onsite transport 3 108 0.5 1 554
(50% assuming gasoline
and diesel engines)

7-- 66 -
Table 7-5: Analysis of machine drive losses
7.5.6 Step 6: Process Energy Use, 622 291 GJ/M
The process energy use is estimated by subtracting energy losses due to equipment inefficiency
from energy conversion system to process energy use system.
Process Energy Use = energy conversion – total equipment losses = 622 291 GJ/M
From the above analysis identification of areas where energy was being lost and also areas with
potential energy saving opportunities were noted (Figure 7-5).
Figure 7-5: Pulp Mill A, energy flow profile for 2014
Machine drives Energy Use GJ/M System loss Energy loss GJ/M
Pumps 46 480 40% 18 592
Fans 22 533 40% 9 013
Compressed air 36 520 80% 29 216
Refrigeration 2 500 5% 125
Material handling 46 890 5% 2 345
Material processing 16 386 90% 1 475
Others 10 000 5% 500
Total losses 181 309 61 265

7-- 67 -
Energy use and loss profile was analyzed in this chapter. Primary energy which includes
purchased fuels and electricity, renewable fuels and energy losses associated with onsite power
generation and energy supply streams are analyzed.
7.6 Energy Loss Analysis
The energy use and loss of Mill A was analyzed in this section and the analysis and results are
described below. Primary energy which includes purchased coal, purchased electricity, HFO,
sulphur, diesel petrol and LPG provided a perspective on the total energy use associated with
P & P production. The primary energy inputs are shown in Figure 7-6.
According to Figure 7-6, almost 75% of energy used is contributed by coal purchased for
boilers, with purchased fuel following at 17% (approximate). Sulphur purchased for the liquor
plant occupies the third spot with a contribution of about 6% (approximate). Diesel, petrol, and
low pressure gas contribute very small energy supply percentages with a combined percentage
of 1%. (approximate).
Figure 7-6: Energy Supply Percentages
Energy use distribution profile
According to the energy flow methodology described in section 7-4, the primary energy use is
listed in Table 7-6. The primary energy use shows that boiler and electricity generation
accounted for a significant portion of primary energy supplied to Pulp Mill A. According to
17%
75%
1%6% 1%
0%
0
ENERGY SUPPLY 2014
Electricity Coal HFO Sulphur Diesel Petrol LPG
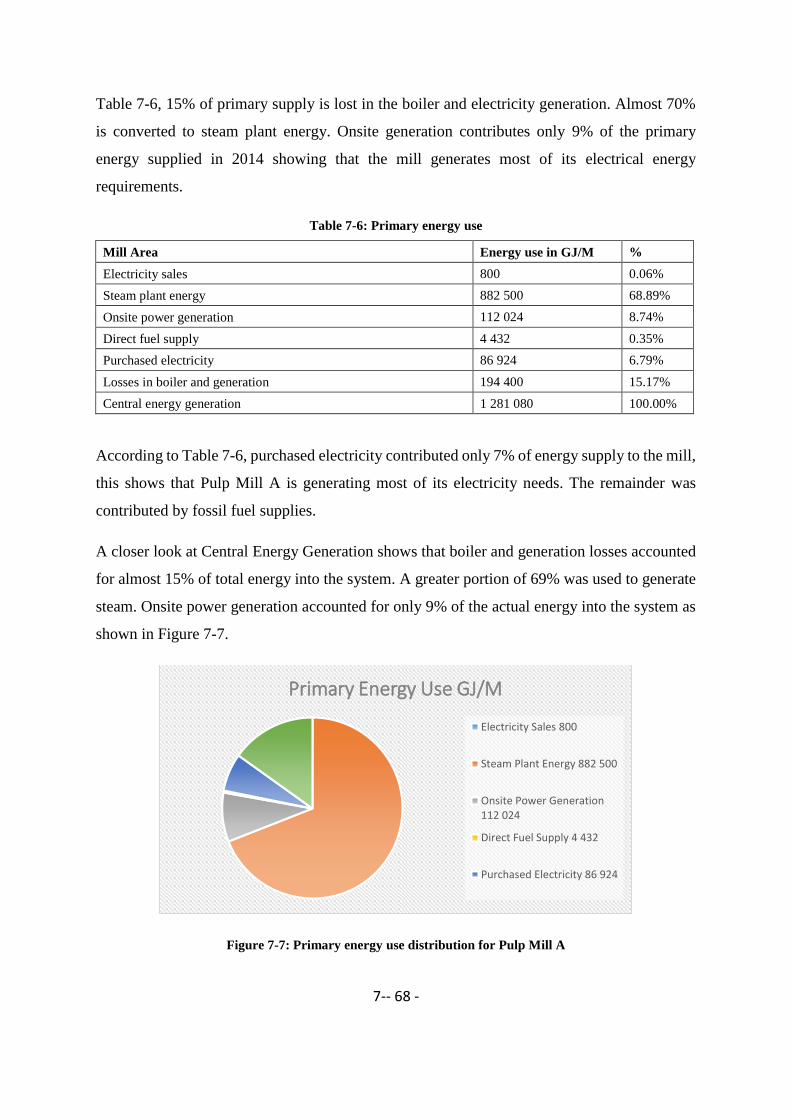
7-- 68 -
Table 7-6, 15% of primary supply is lost in the boiler and electricity generation. Almost 70%
is converted to steam plant energy. Onsite generation contributes only 9% of the primary
energy supplied in 2014 showing that the mill generates most of its electrical energy
requirements.
Table 7-6: Primary energy use
Mill Area Energy use in GJ/M %
Electricity sales 800 0.06%
Steam plant energy 882 500 68.89%
Onsite power generation 112 024 8.74%
Direct fuel supply 4 432 0.35%
Purchased electricity 86 924 6.79%
Losses in boiler and generation 194 400 15.17%
Central energy generation 1 281 080 100.00%
According to Table 7-6, purchased electricity contributed only 7% of energy supply to the mill,
this shows that Pulp Mill A is generating most of its electricity needs. The remainder was
contributed by fossil fuel supplies.
A closer look at Central Energy Generation shows that boiler and generation losses accounted
for almost 15% of total energy into the system. A greater portion of 69% was used to generate
steam. Onsite power generation accounted for only 9% of the actual energy into the system as
shown in Figure 7-7.
Figure 7-7: Primary energy use distribution for Pulp Mill A
Primary Energy Use GJ/M
Electricity Sales 800
Steam Plant Energy 882 500
Onsite Power Generation112 024
Direct Fuel Supply 4 432
Purchased Electricity 86 924

7-- 69 -
Analysis of energy losses
Analysis of the energy losses as described in Table 7-7 reveals that most energy losses are
occurring in energy distribution channels. This is followed by equipment inefficiency energy
losses and lastly boiler and generation losses. The total energy losses amounted to 629 207
GJ/M. As determined from energy flow analysis, the general energy flow and losses are
illustrated in Figure 7-8. Energy distribution losses accounted for an energy loss of 43%, boiler
and generation losses 31 % and Equipment inefficiency 26 %.
Table 7-7: Onsite energy loss profile
Mill Area
Energy Losses
GJ/M %
Boiler and generation losses 194 400 0.31
Energy distribution losses 270 852 0.43
Equipment inefficiency losses 163 155 0.26
Total losses 629 207 100
As shown in Table 7-7, almost half of the losses are occurring in distribution of energy. Most
of the losses are caused by inefficient stream traps, energy transfer losses and energy leaks.
Figure 7-8: Analysis of energy losses
31%
43%
26%
SUMMARY OF ENERGY LOSSES
Boiler and Generation Losses Energy Distribution Losses Machine Drive Losses

7-- 70 -
7.7 Energy Conservation Opportunities
1) Boilers and electricity power generation losses: Use heat stored in wet scrubbers to pre-
heat boiler feed water and stop pre-heating boiler feed water using low pressure steam
when turbines are not being used. Increase electricity production by decreasing low
pressure steam network operating pressure. Other conservation measures such as
aiming to reduce excess oxygen level to 4% to 6% at the coal fired boilers and
installation of a flash tank at the coal fired boilers blowdown and inject that steam to
the low pressure network are also recommended. Review blowdown strategy on coal
fired boiler and try to reduce it.
2) Losses in energy distribution channels: Repair leaking steam pipes and broken steam
traps on site. Manage steam venting better, by either using steam pipes, deaerator tanks,
or demineralized water tanks as steam accumulators/sinks. Energy consumption and
production costs would be reduced by insulating steam pipes properly.
a) Install a small heat exchanger to extract heat from the deaerator vent, and use
it to pre-heat feed to the deaerator.
b) Steam traps: regular steam trap testing weekly to monthly for high pressure
(above 10 bars), monthly to quarterly for medium (2 bars to 10 bars) and
annually for pressures below 2 bars are recommended.
c) Start using distillation columns to produce methanol from foul condensate.
3) Equipment inefficiency:
a) Dryer: Heat recovery from the dryer since is the highest energy consumer in
the pulp mill.
b) Fan, pump and motor: Installation of VFDs on motors, properly sized motors,
avoidance of throttling valves, properly sized pumps and pipes and trim
impellers.
c) Air compressor system: Turning off unnecessary compressed air, air inlet
temperature reduction and pressure drop minimization are recommended
corrective measures.

7-- 71 -
7.8 Energy Saving Evaluation
Based on the data derived from the energy survey, several energy conservation measures were
identified. In order to screen and finalize those that had significant saving potential to the mill
utility (electricity and water), consumption and cost baseline for 2014 was used. The figures
below provide an impetus for discovering energy conservation opportunity. Tables 7-8 and 7-
9 show the consumption figures and cost for year 2014.
Table 7-8: Summary of utilities consumption figures for 2014
Consumption Unit Quantity
Coal t/t of production 1.75
Steam t/t of production 6.08
Water M3/t of production 124
Power kWh/t of production 1027.92
Table 7-9: Summary of utilities costs
Consumption Unit Rands
Steam T 112
Water M3 2
Power kWh 1.25
The criteria used to evaluate the cost effectiveness of the savings was the payback method. The
payback method was preferred because it shows the number of years it will take a measure to
pay for itself using the stream of savings. It is also very prevalent and easy to calculate.
According to the energy loss analysis, the opportunities identified are shown in Table 7-10.

7-- 72 -
Table 7-10: Evaluation of saving potential
Mill area
Saving
justification
Energy
reduction
GJ/M
Investment
cost Rands
Cost of
saving
Payback
period
(months)
1) Use heat stored in wet
scrubber to pre-heat boiler feed
water
Savings
generated by
reduced use of
coal
13 024 70 000 420 000 2.4
2) Aim to reduce excess oxygen
level to 4% to 6% at the coal
fired boilers. Currently boilers
operate at 8% to 12% excess
oxygen to avoid problems with
overheating grate shafts. E.g.,
install water cooled shafts
Savings
generated by
reduced use of
coal
23 154 93 000 550 000 2.0
3) Ensure monetization of excess
black liquor. Currently, when
there is too much black liquor to
burn it immediately, it is sent to
waste water. Install storage
tanks, so that it can be burned
later
Increased black
liquor for steam
production
571 13 000 22 000 7.1
4) Upgrading of
screening/cleaning and
bleaching equipment
N/A 64 614 82 000 430 000 2.3
TOTALS 175 722 258 000 1 422 000 13.8
7.9 Other Identified Energy Efficiency Opportunities
7.9.1 Substitution of V-Belts with Flat Belts in Chipper Drives
During the energy audit it was noted that v-belt driven electric motors are being used at Pulp
Mill A for chipper drives. V-belts have a major disadvantage in that the system results in
continuous absorption of useful power adding to unnecessary operation costs for the mill. It is
therefore recommended to replace v-belts with flat belts in chipper drives. Flat belts are
recommended in that they are more efficient due to increased gripping method. Furthermore,
v-belts wedging action causes significant energy losses due to its engagement with the pulley
as it is pulled in and out. Flat belts save energy as they require less energy to go around a pulley,
as opposed to v-belts which result in significant wear due to different pitch-circle diameter.
The energy saving of this measure would result in about 5% to 15% savings (Table 7-11).

7-- 73 -
Table 7-11: Operation data for chipper with potential energy saving at Mill A
Equipment
Load
in Kw
Operating
hours a year
Annual power
consumption
Annual savings (5% of
consumption)
Annual
savings in
Rands
Chipper 1 350 8 500 2 975 000 148 750 185 937.5
Chipper 2 350 8 500 2 975 000 148 750 185 937.5
Chipper A 630 8 500 5 355 000 267 750 334 687.5
Chipper B 630 8 500 5 355 000 267 750 334 687.5
Total
savings 1 041 250
Investment, savings and payback of the energy conservation opportunity is shown in Table 7-
12.
Table 7-12: Investment savings and payback in Rands
Category Amount (Rands)
Cost of savings per annum (A) 1 041 250
Investment amount (B) 1 120 000
Payback (B/A X 12) months 13
7.9.2 Installation of VFD on Recycle Pump to Tower 3
During the survey it was noted that the recycle pump was throttled by 75% at its discharge end.
This pump is driven by a 90 kW motor, and the current drawn by the motor was found to be
125 amps (80 kW). It is hereby recommended to install a VFD to this motor. Installation of a
VFD will result in proper regulation of the speed of the motor hence reduction in power drawn
by this system. This energy saving measure will result in reduction of power consumption by
almost 30% of the installed capacity rating and this will save 30 kW per hour.
Table 7-13: Investment savings and payback in Rands
Category Amount (Rands)
Cost of savings (A) (30kW X 8500 X 1.25/kWh) 318 750
Investment amount (B) 53 445
Payback (B/A X 12) months 2.01

7-- 74 -
7.9.3 Boiler 4 FD Fan Change of Material Design
Boiler 4 FD Fan has a designed motor rating of 160 kW running on a v-belt. During the audit
it was noted that the running load was 90 kW. The fan blades were also discovered to be made
from cast iron which is heavy resulting in high torque being experienced at the driving system.
It is therefore advised to replace the existing cast iron fan blades with fibre reinforced plastic
ones. Fibre reinforced plastic blades are versatile and easy to manufacture and condition to
meet different fan designs. In addition, fibre reinforced blades do not corrode easily as
compared to cast iron ones hence have a longer life span. Considering the operating parameters
of the fan, power saving of 20% to 40% can be achieved. Using a figure of 20% energy
consumption reduction, power saving of about 18 kWh will be observed. By changing the
existing boiler fan with an fibre reinforced one 15 300 kWh will be saved with and an
investment of R45 000 Table 7-12 below, considering 8 500 hours of operation per year.
Table 7-14: Investment savings and payback in Rands
Category Amount
Cost savings per annum (A) (15 300 kWh X X1.25/kWh) R191 250
Investment amount (B) R45 000
Payback (B/A X 12) months 2.82
7.9.4 Chlorine Plant Hot Water Pump Replacement
During the energy audit it was observed that there are two hot water pumps which are being
driven by 37 kW motors running continuously at the cooling tower of the chlorine dioxide
plant. Instead of using two pumps, one pump can be sufficient for the requirements of the
system if it is an energy efficient pump with a motor rating of 55 kW. It was observed that at
the moment the two pumps are drawing 34.7 kW power each. This energy saving measure
would result in significant energy savings as shown in Table 7-15.
An amount of 118 800 kWh power per annum can be saved if the two motors are replaced by
one 55 kW motor.
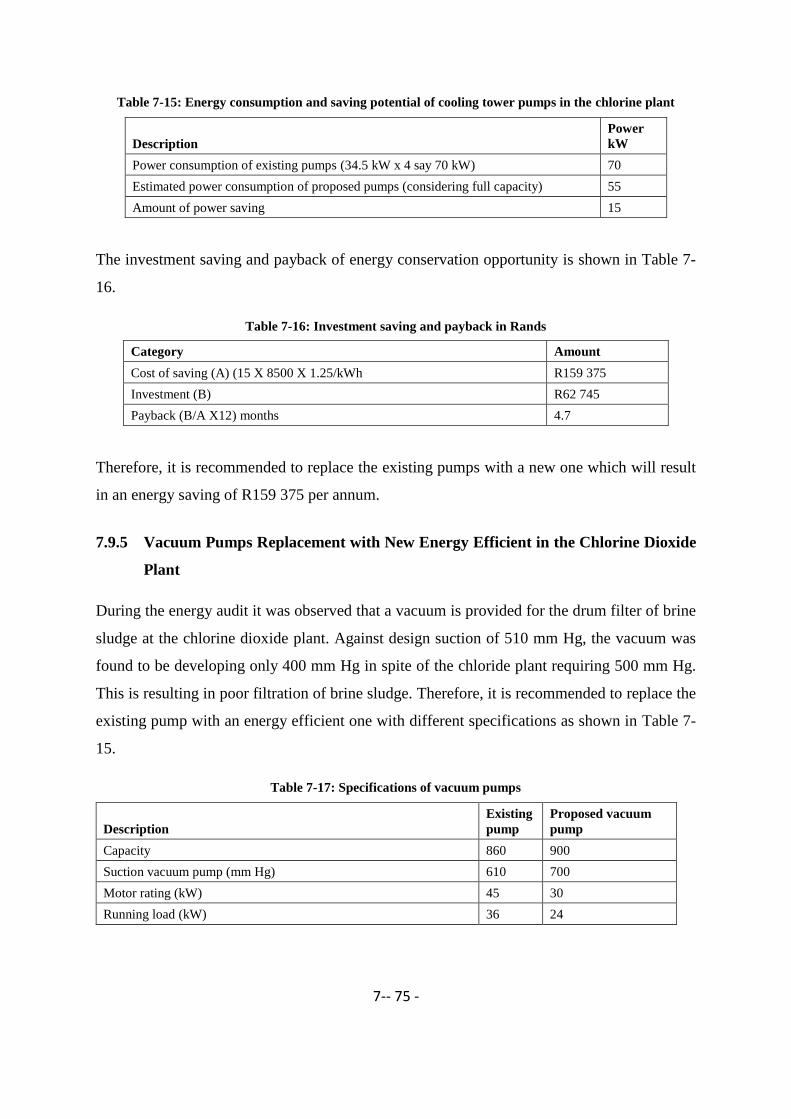
7-- 75 -
Table 7-15: Energy consumption and saving potential of cooling tower pumps in the chlorine plant
Description
Power
kW
Power consumption of existing pumps (34.5 kW x 4 say 70 kW) 70
Estimated power consumption of proposed pumps (considering full capacity) 55
Amount of power saving 15
The investment saving and payback of energy conservation opportunity is shown in Table 7-
16.
Table 7-16: Investment saving and payback in Rands
Category Amount
Cost of saving (A) (15 X 8500 X 1.25/kWh R159 375
Investment (B) R62 745
Payback (B/A X12) months 4.7
Therefore, it is recommended to replace the existing pumps with a new one which will result
in an energy saving of R159 375 per annum.
7.9.5 Vacuum Pumps Replacement with New Energy Efficient in the Chlorine Dioxide
Plant
During the energy audit it was observed that a vacuum is provided for the drum filter of brine
sludge at the chlorine dioxide plant. Against design suction of 510 mm Hg, the vacuum was
found to be developing only 400 mm Hg in spite of the chloride plant requiring 500 mm Hg.
This is resulting in poor filtration of brine sludge. Therefore, it is recommended to replace the
existing pump with an energy efficient one with different specifications as shown in Table 7-
15.
Table 7-17: Specifications of vacuum pumps
Description
Existing
pump
Proposed vacuum
pump
Capacity 860 900
Suction vacuum pump (mm Hg) 610 700
Motor rating (kW) 45 30
Running load (kW) 36 24

7-- 76 -
This measure will result in the mill saving 12 kW per hour resulting in a saving of R60 000 per
annum considering 12 hours of operation for 330 days of operation per annum. In addition,
filtration of the brine will improve significantly.
Investment, savings and payback of the energy conservation opportunity is shown in Table 7-
16.
Table 7-18: Investment saving and payback in Rands
Category Amount
Cost of saving (A)(800 X 8500 XR1.25/kWh) R51 000
Investment R34 450
Payback (B/A X12) months 7.4
7.9.6 Installation of a Metallic Gate for Easy Movement of Wood in the Water Channel
It was noted that wood logs are transported to chipper belt conveyors through a diverted water
channel. Near each conveyor, the water channel bifurcates for feeding each chipper. The log
flow to each chipper is controlled by adjusting the jack ladder operating speed. The logs then
move onto the five splitters that separate the logs out, so that they approach the chipper one by
one. Belt conveyors move the logs towards the chippers. During loading at chipper 3 the water
channel is blocked by a sheet, but due to diversion of water both channels logs do not move
freely and get jammed at this point resulting in idle running of chippers. Installation of moving
guide gate will result in free movements of the logs.
The proposed gate in the flumes of the chippers in Pulp Mill A is shown in Figure 7-9.
Figure 7-9: Metallic movable Gate

7-- 77 -
Fixing the metallic plate will result in unidirectional flow of water in the channel. As a result,
there will be no interruption on the movement of wood logs in the water channel which will
result in reduction of idle running hours of chippers.
Investment savings and payback of the energy conservation opportunity are shown in Table 7-
19.
Table 7-19: Investment savings and payback in Rands
Category Amount
Cost of saving (A)(400 X 330 X 1.25/kWh R185 625
Investment (B) R75 000
Payback (B/A X12) months 4.8
By adopting this measure and fixing a guide gate in the water channel, the running hours of
chippers may be reduced to 32 hours as opposed to the existing 35 hours resulting in an energy
saving of 450 kWh per day amounting to R185 625 per annum considering 330 days of
operation in year with an investment of R75 000 only with a payback of 4.8 months
7.10 Summary of Energy Conservation Opportunities
The cost savings and investment of energy conservation opportunities are summarized in Table
7-20. An amount of R3 429 250 can be saved per annum by investing R1 718 640. By
implementing energy saving proposals the mill can significantly reduce consumption of
electricity and steam.
Table 7-20: Summary of the cost savings and investment opportunities
Total Savings per
annum Investment Amount
R3 429 250 R1 718 640
7.11 Other Unquantified Identified Projects
• Repair leaking steam pipes and broken steam traps on site. Properly maintaining
steam traps. Saving justification: steam saved.
• Insulate steam pipes properly. Un-insulated pipes lead to radiative losses and higher
steam consumption. Saving justification: steam saved.

7-- 78 -
• Form an interdepartmental group that will work on increasing condensate
recovery. Currently only 30% of condensate is recovered, e.g., ensure infrastructure in
place to recover condensate saving justification. Save on energy contained in
condensate.
• Manage steam venting better, by either using steam pipes, deaerator tanks, or
demineralized water tank as steam accumulators/sinks. Currently on average 6
ton/hr of steam is vented due too rapid swings in steam demand. Aim to be able to
absorb these steam swings in the steam network, or use cold water tanks as steam sinks
so as to lose no energy. Energy saving justification: reduced use of coal.
• Start using distillation column to produce methanol from foul condensate. A
distillation column is already installed on site, but not used. It can produce methanol
that can be burned in recovery boilers.
• Switch off one aerator. Demand for condensate recovery is 300 tons/hr while installed
capacity was noted to be 450 tons/hr. Each aerator has 2 ton/hr condensate lost due to
plume venting. Running with one less aerator and rotating them weekly to avoid
corrosion will yield significant savings in low pressure steam and reduced coal usage
7.12 Summary
The findings have revealed that energy losses are indeed occurring in the plant, and there are
possible savings that can be achieved by following some structured processes as outlined
above. In this limited period of one year, a total of energy savings worth over 3 million Rands
were identified and could be retrofitted into existing processes without affecting production
output. It is clear that identifying energy losses and taking steps to eliminate these energy losses
has economic and environmental benefits.

8-- 79 -
CHAPTER 8 : RESULTS AND DISCUSSIONS FROM
QUESTIONNIARES ON BARRIERS AND DRIVERS TO ENERGY
EFFICIENCY
8.1 Results from Questionnaires
Results from questionnaires are analyzed in this section. A scaling of 1 for completely
insignificant up to 5 for very significant was used for rating the barriers to energy efficiency
adoption in P & P industry.
8.1.1 Analysis Results of Financial, Economic and Market Barriers
Figure 8-1 presents the results from the questionnaire given to respondents in the P & P
industry.
Figure 8-1: Results of financial, economic and market barriers
1 1.5 2 2.5 3 3.5 4 4.5 5
Cost of identifying opportunities, analyzing cost Effectiveness
Cost of possible production disruption
High transaction costs
Cost of acquiring information and incorporating new Technologies greater than expected saving on energy
bil
Existence of more promising investment opportunities
Increased perceived cost of energy saving measures
Economic trend or market situation
Specific installation costs
Slow rate of return on the investments
Energy costs are sufficiently important
Average Score

8-- 80 -
Figure 8-1 shows that the importance of energy costs was the largest barrier under the financial,
economic and market barriers category, scoring a figure of 4. 58 and a standard error of 0.19.
The slow rate of return from energy efficiency projects was also a significant barrier with a
score of 4.08. Specific installation costs was also noted as a significant inhibitor to energy
efficiency adoption in the P & P industry with a score of 4 although it showed weak agreement
of the respondents’ answers demonstrated by a standard error of 0.35.
The barrier of economic trends and market situation showed a score rating of 3.92. The survey
results revealed that the existence of promising investment opportunities, cost of acquiring
energy efficient technology and high transaction costs showed significance ratings between
3.17 and 3.08. The cost of identifying opportunities was the most insignificant barrier scoring
only 2.5.
8.1.2 Analysis of Results of Institutional, Organizational and Behavioral Barriers
Figure 8-2 presents the results of the ratings of technological barriers on the uptake of energy
efficient technologies.

8-- 81 -
Figure 8-2: Results of institutional, organizational and behavioral barriers
The largest barrier in this category is the focus on daily production problems, having an average
rating of 3.92. Other significant barriers that were noted include short term planning by
investors and bureaucratic procedures in order to acquire government incentives, scoring 3.25
and 3.18 respectively.
High standard errors of 0.46, 0.42, and 0.41 respectively for the above mentioned barriers
shows that there was a huge variation in terms of how the employees view these barriers.
8.1.3 Analysis of Results of Technological Barriers
Figure 8-3 shows the significance of technological barriers to adoption of energy efficiency
measures in P & P industry.

8-- 82 -
Figure 8-3: Results of technological barriers
Figure 8-3 shows that technology fitting into process was the most significant technology
barrier with a score of 3.5. Since most pulp mills are very old the inclusion of present day
technology into running systems is becoming difficult as evidenced in this result.
Following some previous reviews, the issue pertaining to limited space for pulp mills was a
major concern. This is supported by a significance figure of almost 3.17 and a standard error
of 0.44. Technical risk barrier also has a standard error of 0.44. Technical risk issues are major
concern when it comes to technology implementation in industry although they are well catered
for during project development brainstorming sessions.
8.1.4 Analysis of Results of Uncertainty
Figure 8-4 presents the significance of the uncertainty barriers to the adoption of energy
efficiency measures by the P & P industry.
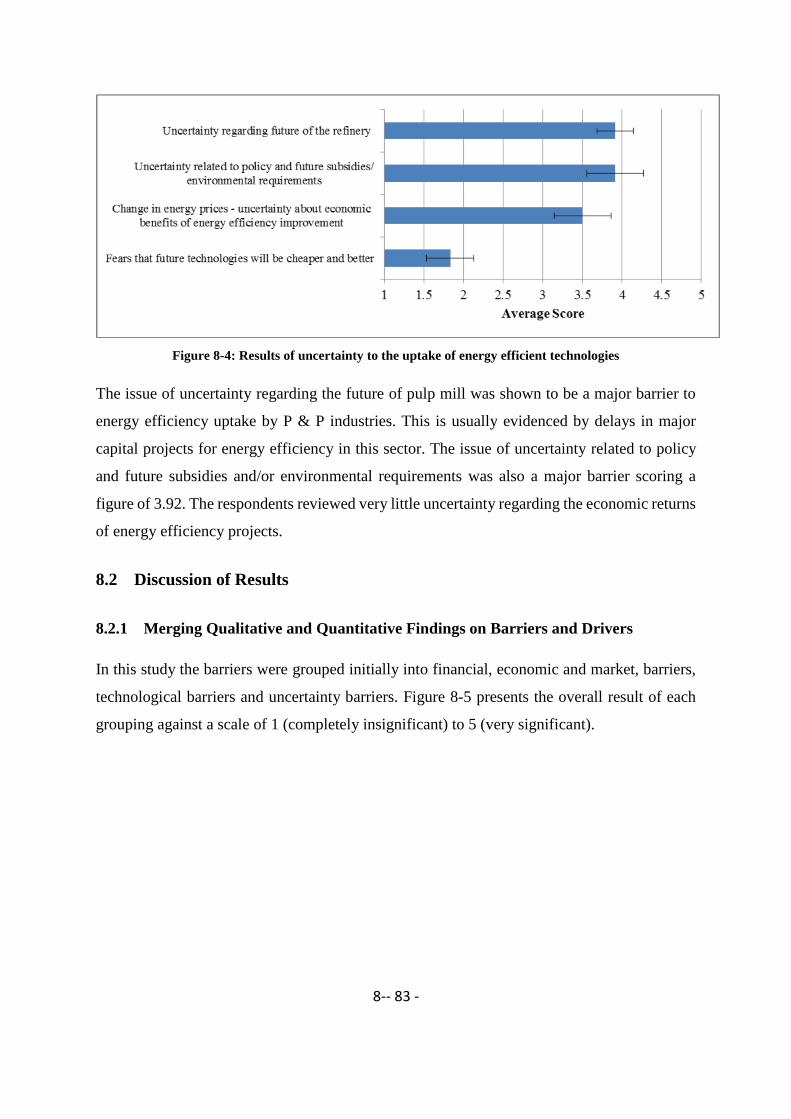
8-- 83 -
Figure 8-4: Results of uncertainty to the uptake of energy efficient technologies
The issue of uncertainty regarding the future of pulp mill was shown to be a major barrier to
energy efficiency uptake by P & P industries. This is usually evidenced by delays in major
capital projects for energy efficiency in this sector. The issue of uncertainty related to policy
and future subsidies and/or environmental requirements was also a major barrier scoring a
figure of 3.92. The respondents reviewed very little uncertainty regarding the economic returns
of energy efficiency projects.
8.2 Discussion of Results
8.2.1 Merging Qualitative and Quantitative Findings on Barriers and Drivers
In this study the barriers were grouped initially into financial, economic and market, barriers,
technological barriers and uncertainty barriers. Figure 8-5 presents the overall result of each
grouping against a scale of 1 (completely insignificant) to 5 (very significant).
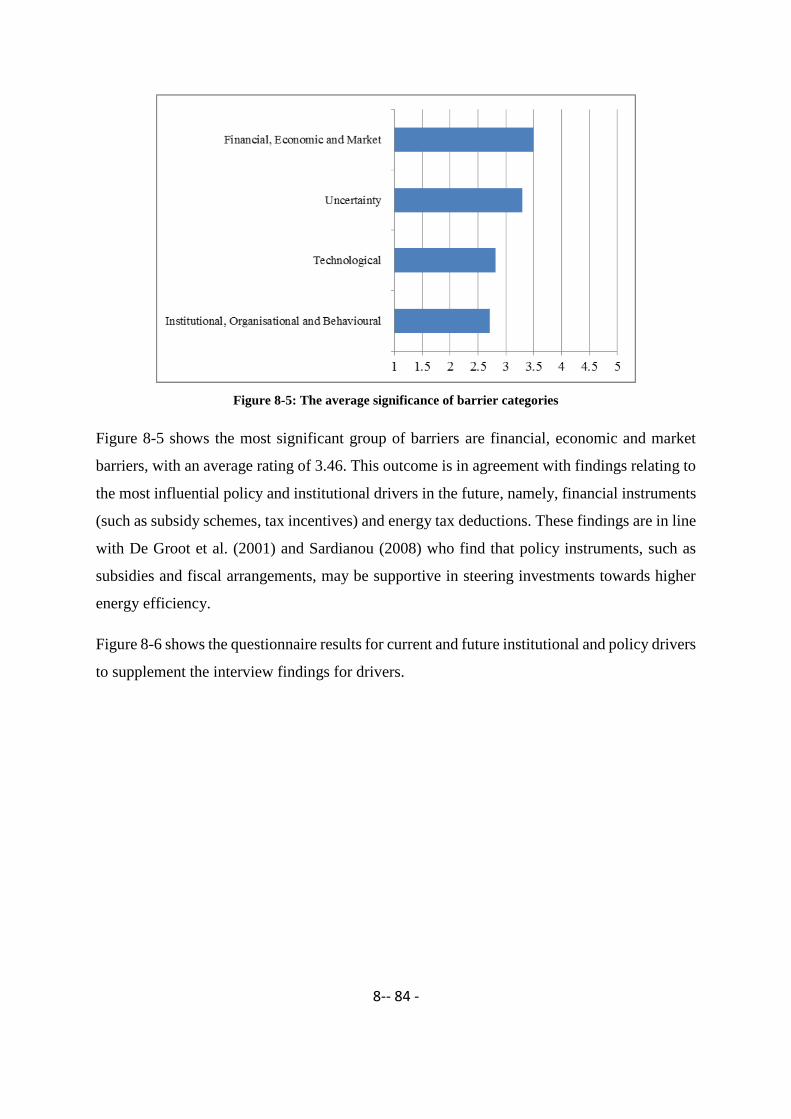
8-- 84 -
Figure 8-5: The average significance of barrier categories
Figure 8-5 shows the most significant group of barriers are financial, economic and market
barriers, with an average rating of 3.46. This outcome is in agreement with findings relating to
the most influential policy and institutional drivers in the future, namely, financial instruments
(such as subsidy schemes, tax incentives) and energy tax deductions. These findings are in line
with De Groot et al. (2001) and Sardianou (2008) who find that policy instruments, such as
subsidies and fiscal arrangements, may be supportive in steering investments towards higher
energy efficiency.
Figure 8-6 shows the questionnaire results for current and future institutional and policy drivers
to supplement the interview findings for drivers.

8-- 85 -
Figure 8-6: Results of policy and institutional instruments on the adoption of energy efficient measures
The most significant institutional and policy driver currently was training/information. The
interviews indicated that information gathering involved dealings with pulping industry experts
by means of, for example, belonging to technology alliances or having an agreement with a
technical design house. Sardianou (2008) highlights the existence of energy efficiency
knowledge among energy intensive firms compared to small and medium sized enterprises.
This is firmly supported by the results of this study in that the information for energy efficiency
improvement opportunities is available for pulp mills. Closely following the financial,
economic and market barriers category is the category of uncertainty, with an average
significance rating of 3.29.
The uncertainty regarding the future of pulp mills impacts negatively on energy capital energy
efficiency investments. In addition, energy prices are hampering uptake of energy projects
because of the uncertainty that surrounds this aspect. This finding is in line with that of Ren
(2009) who found two areas with the highest uncertainty, being, firstly, the costs and supply of
energy or feedstock and, secondly, the prospects of economic growth and market demand.
Furthermore, pertaining to South Africa, other uncertainty factors are energy policy
framework, environmental regulations and government energy incentives
In summary, the results of this study show that government policy framework on energy and
financial incentives for energy efficiency would be a key driver for energy efficiency adoption
by all industrial sectors. This was also found by Hepbasli and Ozalp (2003) in their study in

8-- 86 -
Turkey, who concluded that government support is key in enhancing an energy efficient
industry and society. This also reveals that finance can be both a barrier and driver for energy
efficiency uptake by industry.
8.2.2 Specific Barriers and Drivers to Energy Efficiency Adoption
A general analysis of the above results shows that some barriers are more significant than
others. A more detailed look at the barriers gives rise to a better view of what can be done to
overcome them. The section below details the most significant barriers unveiled by this study.
8.2.3 Results of Most Significant Barriers
Table 8-1 summarizes the results of the barriers which were found to be most significant in this
research.
Table 8-1: Most significant barriers to the adoption of energy efficient technologies
Significant Individual Barriers Average
Standard
Error
Energy costs are sufficiently important 4.58 0.19
Slow rate of return of the investments 4.08 0.31
Specific installation costs 4.00 0.35
Uncertainty regarding future of the pulp and paper mills 3.92 0.23
Focus on daily production problems 3.92 0.26
Economic trend or market situation 3.92 0.29
Uncertainty related to policy and future subsidies/ environmental requirements 3.92 0.36
Increased perceived cost of energy saving measures 3.75 0.28
Technology fitting into process 3.50 0.29
Change in energy prices - uncertainty about economic benefits of energy
efficiency improvement 3.50 0.36
The table above shows that the three most important barriers to the uptake of energy efficient
technology by the P & P industry are the financial, economic and market barriers are:
Energy Costs Are Sufficiently Important – This is the most significant barrier from the study.
For pulp mills, energy costs are between 20% to 40% of operating costs, and therefore a major
business expense and therefore driver for energy improvement.
8-- 87 -
Slow Rate of Return on Investments – Results suggest that energy projects are viewed as being
slow in terms of returns from the investment involved when compared with other
engineering/production projects
Specific Installation Costs – The specific costs of installing technologies is a noteworthy barrier
and these add to high upfront costs which companies must provide for energy efficiency
projects.
The following barriers are equivalent in significance to the uptake of energy efficient
technologies:
Economic Trend or Market Situation – The state of economic affairs impose a large effect on
availability of funds required for energy efficiency projects.
Focus on Daily Production Problems – More resources are channeled to production issues
leaving less staff available to implement energy projects. This has an impact in energy
efficiency penetration because it receives little attention as compared to other core business
activities.
Uncertainty Future Regarding Pulp Mills – Older mills are posing a hindrance to capital energy
projects implementations in pulp mills. This is also affected by global market performance
since most of the products for this sector are exported
Uncertainty Related to Strategy Environmental Requirements – although more strides have
been taken to put environmental regulations in place more still needs to be done since this issue
is posing a barrier to energy efficiency adoption. Availability of incentives might be a
possibility to counter this barrier.
The following barriers decrease in order of significance to the adoption of energy efficient
technologies:
Technology Fitting into Process – Most pulp mills are old hence retrofitting energy projects
into existing system is proving to be difficult. Most of pulping equipment is also obsolete and
this makes it even harder to incorporate newer technologies into existing mills.

8-- 88 -
Increased Perceived Cost of Energy Saving Measures – This barrier was noted to be very
significant due the management perception that energy efficiency measures are slow in
returning investment costs when compared with other projects.
Change in Energy Prices – The uncertainty associated with energy prices poses a huge
hindrance to energy efficiency adoption by the P & P industry. Industrialists take note of energy
price fluctuations before they start involving themselves with capital energy projects. In line
with the results obtained from this research, Sardianou (2008) echoes the same sentiments
when he concludes that price changes have a huge impact on the state of energy affairs within
an organization. Sardianou’s (2008) research points out that staff allocation for energy projects
and monitoring is minimal hence most organizations find it difficult to keep track of their
energy consumption pattern. This results in most organizations being affected by small energy
adjustments, which is why most organizations are very skeptical when it comes to allocation
of funding for projects which means that energy efficiency becomes the least funded section
due to energy price instability.
According to Ren (2009), organizations have a perception that reliance on already proven mill
configurations and operation control are a better option compared to benefits arising from
energy savings. It has also been noted that many organizations share the view that energy
efficiency retrofits will render the process flow more complex and difficult to operate.
According (Ren, 2009), plant disruptions are anticipated when new and old units are integrated.
Ren (2009) shares the view that new capacity projects receive greater priority compared to
energy efficiency projects due to their high internal rate of return portions. He went to support
his sentiments by indicating that those projects yield better efficiency figures as opposed to
energy projects which contribute slowly towards system efficiency.
8.2.4 Significant Drivers
The major driving forces uncovered by this research were organizational policy and corporate
support. These two drivers showed high rating scores of 4.75 and 4.42 respectively. This is in
line with the Sardianou (2008) who states that senior management support is the pillar for
energy management system success. Employee commitment to energy management is also
required in order to complete the puzzle required for successful energy program

8-- 89 -
implementation. Ren (2009) suggests that senior management involvement in energy
management issues is vital for its survival in any organization.
This same sentiments is echoed by Reddy and Assenza (2007) when they discuss a decrease in
the cost of technology as being a key factor in the introduction of energy efficient technologies
into new markets. Furthermore, Ren (2009) suggests that the key driver for improving existing
processes is cost savings which results in a reduction in process energy use per ton of product.
Business earnings before income tax, a key indicator of performance, are increased directly by
the reduction of energy costs (Ren, 2009). Finally, the key findings of this research highlight
that a prominent difference occurs between the current and future significance of instruments
to adopting energy efficient measures. Respondents view the stimulus of strategy and
institutional instruments as motivators to increase overall energy efficiency in the future,
compared to the current situation. This outlook can be assumed to be influenced by the
increasing trend of regulatory requirements in South Africa in recent years.
9-- 90 -
CHAPTER 9 : CONCLUSIONS AND RECOMMENDATIONS
This work has analyzed the energy consumption of a major energy consuming pulp mill and
the factors that influence energy efficiency adoption by the P & P industry using the pulp mill
as a case study. The main objectives of the research was to identify areas of energy losses in
pulping processes and from the results a total of 629 207 GJ/M of energy losses were
experienced by the mill in the trading year 2014-2015. These losses occurred in energy
distribution channels, boilers and electricity generation units and due to equipment
inefficiency. The energy loss profile was then used to identify energy saving measures that can
be taken to reduce the energy losses without affecting the pulping processes. A total of 10
projects were identified and their savings and investment quantified. In order to identify the
losses an energy audit was carried out on a pulp mill. The data collected from the audit was
used to formulate energy flow profile of the pulp mill. The energy flow profile help to identify
energy losses occurring inside a system boundary such as a pulp mill. Some of the
recommended corrective measures that were suggested for boiler and generation energy losses
included the use of heat stored in wet scrubbers to pre-heat boiler feed water, reduction of pre-
heating boiler feed water using low pressure steam when turbines are not being used, and
increasing electricity production by reducing low pressure steam network operating pressure.
Measures suggested to reduce electricity distribution losses include repairing of leaking steam
pipes and broken steam traps on site, proper management of steam venting by either using
steam pipes, deaerator tanks, or demineralized water tank as steam accumulators/sinks.
Suggestions to curb equipment energy losses include installation of VFD on electric motors,
proper sizing of pumps and its piping system. The main aim of this study was to identify areas
where energy is being lost during P & P production at Mill A. The research study managed to
achieve this and has recommended corrective measures that are practical and feasible.
An investigation into factors influencing energy efficiency adoption found that there are many
barriers to energy efficiency adoption by the P & P industry. Major barriers identified by the
research were “energy costs are sufficiently important” and slow rate of return of investment
in energy efficiency projects. Other noted barriers were capital availability, staff shortage for
energy projects and uncertainty regarding the future of pulp mills. Key drivers to energy
efficiency that were unveiled are government policy and corporate support. The understanding
9-- 91 -
of barriers to energy efficiency adoption allows better understanding of factors affecting
industry and this initiates more detailed analysis which will enhance efforts to reduce energy
consumption and green gas emissions.
9.1 RECOMMENDATIONS
• Traditional housekeeping management was identified as an important way for the mill
to save energy, specifically active programs to monitor and prevent motors being left
open, and repairing steam leaks and compressed air leaks.
• Present instrumentation at the mill should be repaired, particularly automatic steam
controls, and steam and electricity flow meters should be installed, particularly steam.
Instrumentation maintenance programs should begin. It is important that the plant have
the necessary skills to repair and maintain the instrumentation.
• The procurement team must include energy efficiency criteria in their ordering of
equipment. This must be accompanied by additional training for procurement personnel
on energy efficiency; this can be accomplished easily if external vendors are allowed
to undertake some lectures on their products. This should be also occur with respect to
contractors to verify their level of knowledge in terms of energy efficiency.
• Production and energy data are being reported at different time intervals, they need to
be correlated to gain a clear picture of production vs energy ratio.
• In order for management to gain more ideas, employees must be requested to send their
ideas for energy saving to a central location where they will be screened and captured.
This will also instill confidence in employees as they will feel valued.
After studying barriers and drivers to energy efficiency adoption, the overall recommendations
for industry and government suggested by this research are for government to put aside funding
for energy efficiency initiatives and energy auditing, more senior management involvement in
energy efficiency initiatives, and more energy efficiency awareness for organizations so that
all employees become aware. The researcher also recommends sector specific energy surveys
so that every organization best understands its energy profile pattern.
The research concludes that pulp mill energy efficiency analysis can significantly help a P &
P plant to improve its energy efficiency and reduce its CO2 emissions with knowledge of areas
of energy losses.
9-- 92 -
REFERENCES
ALESSON, T. 1995. All steam traps are not equal. Hydrocarbon Processing, 74(8): 123-128.
ALGEHED, J. 2002. Energy efficient evaporation in future kraft pulp mills. Chalmers University of
Technology, Göteborg.
ANDERSON, S. T. & NEWELL, R. G. 2004. Information programs for technology adoption: the case
of energy-efficiency audits. Resource and Energy Economics, 26(1): 27-50.
ANTUNES, P., CARREIRA, P. & DA SILVA, M. M. 2014. Towards an energy management maturity
model. Energy Policy, 73: 803-814.
ATES, S. A. & DURAKBASA, N. M. 2012. Evaluation of corporate energy management practices of
energy intensive industries in Turkey. Energy, 45(1): 81-91.
AXELSSON, E., OLSSON, M. R. & BERNTSSON, T. 2008. Opportunities for process-integrated
evaporation in a hardwood pulp mill and comparison with a softwood model mill study.
Applied Thermal Engineering, 28(16): 2100-2107.
BACKMAN, R., HUPA, M. & HYOTY, P. 1983. Corrosion due to acidic sulphates in sulphate and
sodium sulphite recovery boilers. Pulp & Paper Industry Corrosion Problems, 4: 76-81.
BAEN, P. R. & BARTH, R. 1994. Insulate heat tracing systems correctly. Chemical Engineering
Progress, 90: 9.
BARNISH, T. J., MULLER, M. R. & KASTEN, D. J. 1997. Motor maintenance: a survey of
techniques and results. Conference: 1997 ACEEE Summer Study on Energy Efficiency in
Industry, Saratoga Springs, NY (US), 07/08/1997--07/11/1997
BENGTSSON, C., KARLSSON, M., BERNTSSON, T. & SÖDERSTRÖM, M. 2002. Co-ordination
of pinch technology and the MIND method—applied to a Swedish board mill. Applied Thermal
Engineering, 22(2): 133-144.
BLOSS, D., BOCKWINKEL, R. & RIVERS, N. 1997. Capturing energy savings with steam traps.
ACEEE summer study on energy efficiency in industry: Proceedings, refereed papers, and
summary monographs.

9-- 93 -
BROWN, M. A. 2001. Market failures and barriers as a basis for clean energy policies. Energy Policy,
29(14): 1197-1207.
BROWN, M. A., LEVINE, M. D., ROMM, J. P., ROSENFELD, A. H. & KOOMEY, J. G. 1998.
Engineering-economic studies of energy technologies to reduce greenhouse gas emissions:
opportunities and challenges. Annual Review of Energy and the Environment, 23: 287-385.
BUNSE, K., VODICKA, M., SCHÖNSLEBEN, P., BRÜLHART, M. & ERNST, F. O. 2011.
Integrating energy efficiency performance in production management–gap analysis between
industrial needs and scientific literature. Journal of Cleaner Production, 19: 667-679.
CAFFAL, C. 1995. Energy management in industry. Centre for the Analysis and Dissemination of
Demonstrated Energy Technologies (CADDET). Analysis Series, 17.
CAPEHART, B. L., MUTH, E. J. & STORIN, M. O. 1982. Minimizing residential electrical energy
costs using microcomputer energy management systems. Computers & Industrial Engineering,
6: 261-269.
CHALLENGE, C. A. 2002. Guidelines for selecting a compressed air system service provider and
levels of analysis of compressed air systems.
CHURCHMAN, C. W. & CHURCHMAN, C. W. 1968. Challenge to reason, McGraw-Hill New
York.
COMPRESSED AIR CHALLENGE. 2002. Guidelines for selecting a compressed air system service
provider and levels of analysis of compressed air systems. Available at
http://www.compressedairchallenge.org.
COOK, B. 1998. High efficiency lighting in industry and commercial buildings. Power Engineering
Journal, 12(5): 197-206.
DE GROOT, H. L., VERHOEF, E. T. & NIJKAMP, P. 2001. Energy saving by firms: decision-
making, barriers and policies. Energy Economics, 23(6): 717-740.
DECANIO, S. J. 1993. Barriers within firms to energy-efficient investments. Energy Policy, 21(9):
906-914.

9-- 94 -
DECANIO, S. J. 1998. The efficiency paradox: bureaucratic and organizational barriers to profitable
energy-saving investments. Energy policy, 26(5): 441-454.
DECANIO, S. J. & WATKINS, W. E. 1998. Investment in energy efficiency: do the characteristics of
firms matter? Review of Economics and Statistics, 80(1): 95-107.
Department of Energy (DOE), United States. 2001. Pump life cycle costs: a guide to LCC Analysis for
Pumping Systems. Washington, DC: Office of Industrial Technologies, Energy Efficiency and
Renewable Energy, DOE, in collaboration with the Hydraulic Institute (Parsippany, N.J.) and
Europump (Brussels, Belgium).
Department of Energy (DOE), United States. 2002. Steam system opportunity assessment for the pulp
and paper, chemical manufacturing, and petroleum refining industries – main report.
Washington, DC: US Department of Energy.
DUSI, B. & SCHULTZ, R. 2012. Energy management and efficiency—a systems approach. 2012
IEEE-IAS/PCA, 54th Cement Industry Technical Conference. IEEE, 1-8.
DUTTA, S. & MIA, I. 2010. The global information technology report 2009–2010. World Economic
Forum and INSEAD, SRO-Kundig, Geneva, Switzerland.
ELEY, C. 1993. Advanced lightning guidelines: 1993: final report. Washington, D.C: U.S.
Department of Energy.
ERICKSON, D. & BROWN, C. 1999. Operating experience with a gasification pilot project. Tappi
Journal, 82(9): 48-50.
ERICKSON, P., HEAPS, C. & LAZARUS, M. 2009. Greenhouse gas mitigation in developing
countries-promising options in China, Mexico, India, Brazil, South Africa, and South Korea.
SEI US Working Paper, WP-US0903.
FERGUSON, K. H. 1997. TMP technologies focus on reducing energy use. Pulp and paper. 71(6):
99-102
FREEMAN, M. 1998. Lockwood-post directory database of the pulp, paper and allied trades. San
Francisco, CA: Miller Freeman. Inc.
9-- 95 -
GALITSKY, C. 2009. Guidebook for using the tool BEST cement: benchmarking and energy savings
tool for the cement industry. Berkeley, CA: Lawrence Berkeley National Laboratory.
GALITSKY, C., WORRELL, E., RADSPIELER, A., HEALY, P. & ZECHIEL, S. 2005. BEST Winery
guidebook: benchmarking and energy and water savings tool for the wine industry. Berkeley,
CA: Lawrence Berkeley National Laboratory.
GANAPATHY, V. 1994. Understand steam generator performance. Chemical Engineering Progress,
90(12): 42-48.
GONG, M. 2004. Using exergy and optimization models to improve industrial energy systems towards
sustainability. Doctoral thesis, Linköping University, Sweden
GOVENDER, S. 2008. Energy saving mechanisms in the mining industry: a case study of switching
off non-essential power. Master’s dissertation, University of Stellenbosch.
GUERRERO, C. A., WANG, J., LI, J., ARINEZ, J., BILLER, S., HUANG, N. & XIAO, G. 2011.
Production system design to achieve energy savings in an automotive paint shop. International
Journal of Production Research, 49(22): 6769-6785.
HASANBEIGI, A. & PRICE, L. 2012. A review of energy use and energy efficiency technologies for
the textile industry. Renewable and Sustainable Energy Reviews, 16(16): 3648-3665.
HASANBEIGI, A., PRICE, L., LU, H. & LAN, W. 2010. Analysis of energy-efficiency opportunities
for the cement industry in Shandong Province, China: A case study of 16 cement plants.
Energy, 35(8): 3461-3473.
HASSETT, K. A. & METCALF, G. E. 1993. Energy conservation investment: Do consumers discount
the future correctly? Energy Policy, 21(6): 710-716.
HAW, M. & HUGHES, A. 2007. Clean energy and development for South Africa: background data.
Cape Town: Energy Research Centre, University of Cape Town.
HEPBASLI, A. & OZALP, N. 2003. Development of energy efficiency and management
implementation in the Turkish industrial sector. Energy Conversion and Management, 44(2):
231-249.

9-- 96 -
HITCHCOCK, R. K. 2009. From local to global: perceptions and realities of environmental change
among Kalahari San: Walnut Creek, CA: Left Coast Press.
HOOPER, F. & GILLETTE, R. 2002. Steam trap performance assessment. How efficient is your steam
distribution system. Richland, WA: Pacific Northwest National Laboratory.
HOVSTADIUS, G., ERICKSON, R. & TUTTEROW, V. 2000. Pumping system life cycle costs: an
overlooked opportunity? Pump Lines, 10-12.
HOWE, B. & SCALES, B. 1995. Assessing processes for compressed air efficiency. E-Source Tech
Update. November.
INGELSTAM, L. 2002. Systems: to reflect over society and technology. Stockholm:
Energimyndighetens Forlag.
INGERSOLL RAND 2001. Air solutions group—compressed air systems energy reduction basics.
Annandale, NJ: Ingersoll-Rand.
INIYAN, S. & SUMATHY, K. 2000. An optimal renewable energy model for various end-uses.
Energy, 25(6): 563-575.
Jacobs Engineering and Institute of Paper Science and Technology. 2006. Pulp and paper industry
energy bandwidth study. Report for the American Institute of Chemical Engineers, U.S.
Department of Energy (DOE). Project Number 16CX8700, August 2006. Available from:
www.energy.gov/sites/prod/files/2013/11/f4/doe_bandwidth.pdf.
JAFFE, A. B. & STAVINS, R. N. 1994a. The energy-efficiency gap. What does it mean? Energy
Policy, 22(10): 804-810.
JAGO, P. B. 1999. The Canadian Industry Program for Energy Conservation (CIPEC): The dynamics
of a 24 year partnership between government and industry. Ottawa, Canada: Office of Energy
Efficiency Natural Resources Canada.
JOHNSTON, B. 1995. 5 Ways to greener steam. Chemical Engineer, 594: 24-7.
JONES, T. 1997. Steam partnership: improving steam system efficiency through marketplace
partnerships. Washington, DC: Alliance to Save Energy.

9-- 97 -
KAM. 2000. Eco-cyclic Pulp Mill. Final report Kam1 1996-1999.Report A32. Stockholm: STFI.
KANNAN, R. & BOIE, W. 2003. Energy management practices in SME––case study of a bakery in
Germany. Energy Conversion and Management, 44(6): 945-959.
KIM, Y. & WORRELL, E. 2002. International comparison of CO2 emission trends in the iron and
steel industry. Energy Policy, 30(10): 827-838.
KOWALCZYK, I. 2013. Barriers to the expansion of electrical cogeneration by the wood products
industry in the United States. Journal of Sustainable Forestry, 32(1-2): 159-174.
LACKNER, P. & HOLANEK, N. 2007. Step by step guidance for the implementation of energy
management. Vienna: Österreichische Energieagentur–Austrian Energy Agency.
LINNHOFF, B. & HINDMARSH, E. 1983. The pinch design method for heat exchanger networks.
Chemical Engineering Science, 38(5): 745-763.
MARTIN, N., ANGLANI, N., EINSTEIN, D., KHRUSHCH, M., WORRELL, E. & PRICE, L. 2000.
Opportunities to improve energy efficiency and reduce greenhouse gas emissions in the US
pulp and paper industry. Berkeley, CA: Lawrence Berkeley National Laboratory.
MARTIN, R. C. 2000. Design principles and design patterns. Available at:
http://www.cvc.uab.es/shared/teach/a21291/temes/object_oriented_design/materials_adiciona
ls/principles_and_patterns.pdf.
MCKANE, A. PRICE, L & DE LA RUE DU CAN, S. 2007. Policies for promoting industrial energy
efficiency in developing countries and transition economies. Berkeley, CA: Lawrence Berkeley
National Laboratory.
MINCHENER, A. J. 2005. Coal gasification for advanced power generation. Fuel, 84(17): 2222-2235.
MOHEY, G. 2016. Energy efficiency opportunities in a pulp drying machine. Master’s dissertation,
University of Gävle, Gävle, Sweden.
MULLER, D. C., MARECHAL, F. M., WOLEWINSKI, T. & ROUX, P. J. 2007. An energy
management method for the food industry. Applied Thermal Engineering, 27: 2677-2686.
9-- 98 -
NORDMAN, R. & BERNTSSON, T. 2006. Design of Kraft pulp mill hot and warm water systems—
A new method that maximizes excess heat. Applied Thermal Engineering, 26(4): 363-373.
OLAYINKA, O. S. & OLADELE, A. T. 2013. Energy Audit of manufacturing and processing
industries in Nigeria: a case study of food processing industry and distillation & bottling
company. American Journal of Energy Research, 1(3): 36-44.
OSTERTAG, K. Transaction costs of raising energy efficiency. IEA International Workshop on
Technologies to Reduce Greenhouse Gas Emissions: Engineering-Economic Analyses of
Conserved Energy and Carbon. Washington, DC, 1999.
OZALP, N. & HYMAN, B. 2006. Energy end-use model of paper manufacturing in the US. Applied
Thermal Engineering, 26(5-6): 540-548.
PAPAR, R., SZADY, A., HUFFER, W., MARTIN, V. & MCKANE, A. 1999. Increasing energy
efficiency of mine ventilation systems. Berkeley, CA: Lawrence Berkeley National Laboratory,
University of California, Tech. Rep.
PAREKH, P. S. 2000. Investment-Grade Compressed Air System Audit, Analysis, and Upgrade in a
Pulp and Paper Mill. 22nd Annual Industrial Energy Technology Conference in Houston, Texas,
USA.
PARRY, M. L. 2007. Climate change 2007-impacts, adaptation and vulnerability: Working group II
contribution to the fourth assessment report of the IPCC. Cambridge: Cambridge University
Press.
PETRICK, M. & PELLEGRINO, J. 1999. The potential for reducing energy utilization in the refining
industry. Lemont, IL: Argonne National Laboratory.
PINCHES, G. E. 1982. Myopia, capital budgeting and decision making. Financial Management, 1(3):
6-19.
RADGEN, P. & BLAUSTEIN, E. 2001. Compressed air systems in the European Union. Energy,
emissions, savings potential and policy actions. Stuttgard: Log X.
REDDY, A. K. 1991. Barriers to improvements in energy efficiency. Energy Policy, 19(1): 953-961.
9-- 99 -
REDDY, B. S. & ASSENZA, G. 2007. Barriers and drivers to energy efficiency. WP2007-003. IGIDR
Working Paper Series.
REN, T. 2009. Barriers and drivers for process innovation in the petrochemical industry: a case study.
Journal of Engineering and Technology Management, 26: 285-304.
ROHDIN, P., THOLLANDER, P. & SOLDING, P. 2007. Barriers to and drivers for energy efficiency
in the Swedish foundry industry. Energy Policy, 35(1), 672-677.
SAIDUR, R., RAHIM, N. & HASANUZZAMAN, M. 2010. A review on compressed-air energy use
and energy savings. Renewable and Sustainable Energy Reviews, 14(4): 1135-1153.
SANDBERG, P. 2004. Optimisation and co-operative perspectives on industrial energy systems.
Linköping: Linköpings Universitet.
SANSTAD, A. H. & HOWARTH, R. B. 1994. ‘Normal’ markets, market imperfections and energy
efficiency. Energy policy, 22(1): 811-818.
SARDIANOU, E. 2008. Barriers to industrial energy efficiency investments in Greece. Journal of
Cleaner Production, 16(13): 1416-1423.
SCHWAB, K. The global competitiveness report 2009-2010. 2009. Geneva: World Economic Forum.
SEBITOSI, A. 2008. Energy efficiency, security of supply and the environment in South Africa:
Moving beyond the strategy documents. Energy, 33(11): 1591-1596.
SIMON, H. A. 1979. Rational decision making in business organizations. The American Economic
Review, 69(4): 493-513.
SORRELL, S. 2004. The economics of energy efficiency. Cheltenham: Edward Elgar Publishing.
STATMAN, M. & SEPE, J. F. 1984. Managerial incentive plans and the use of the payback method.
Journal of Business Finance & Accounting, 11: 61-65.
STEPANOFF, A. J. 1948. Centrifugal and axial flow pumps: theory, design, and application. New
York, NY: Wiley.
STUDEBAKER, P. 2007. Best Practice Award Winners. Plant services. Available at:
http://www.plantservices.com/articles/2007/040/.
9-- 100 -
SZKLO, A. & SCHAEFFER, R. 2007. Fuel specification, energy consumption and CO 2 emission in
oil refineries. Energy, 32(7): 1075-1092.
TAYLOR, A., GRANGE, T. & GOUS, G. 2000. Modern advanced control pays back rapidly: Special
report: Process control and information systems. Hydrocarbon Processing, 79(9): 47-50.
TAYLOR, R. P. 2008. Financing energy efficiency: lessons from Brazil, China, India, and beyond,
Washington, DC: World Bank Publications.
TESSIER, P., BRODERICK, G., DESROCHERS, C. & BUSSIERE, S. 1997a. Industrial
implementation of motor load and freeness control of Chemi-mechanical pulp refiners. Tappi
Journal, 80(12): 135-141.
TESSIER, P., BRODERICK, G., DESROCHERS, C. & BUSSIERE, S. 1997b. Motor Load and
Freeness Control of Chemi-mechanical Pulp Refining: Industrial Results. European Control
Conference. Available at: http://nsuworks.nova.edu/cps_facpresentations/2817.
THOLLANDER, P. & OTTOSSON, M. 2010. Energy management practices in Swedish energy-
intensive industries. Journal of Cleaner Production, 18(12): 1125-1133.
THOPIL, G. A. & POURIS, A. 2013. International positioning of South African electricity prices and
commodity differentiated pricing. South African Journal of Science, 109(7-8): 1-5.
TONN, B. & MARTIN, M. 2000. Industrial energy efficiency decision making. Energy Policy, 28(12):
831-843.
TYLER, E. 2010. Aligning South African energy and climate change mitigation policy. Climate
Policy, 10(5): 575-588.
VAN SOEST, D. P. & BULTE, E. H. 2001. Does the energy-efficiency paradox exist? Technological
progress and uncertainty. Environmental and Resource Economics, 18(1): 101-112.
VELTHUIJSEN, J. W. 1995. Determinants of investment in energy conservation. Doctoral thesis,
Amsterdam School of Economics Research Institute, Amsterdam, Netherlands.
WISING, U., BERNTSSON, T. & STUART, P. 2005. The potential for energy savings when reducing
the water consumption in a Kraft Pulp Mill. Applied Thermal Engineering, 25: 1057-1066.

9-- 101 -
WORRELL, E. & GALITSKY, C. 2005. Energy efficiency improvement and cost saving opportunities
for petroleum refineries. Berkeley, CA: Lawrence Berkeley National Laboratory.
WORRELL, E., GALITSKY, C. & PRICE, L. 2008. Energy efficiency improvement opportunities for
the cement industry. Berkeley, CA: Lawrence Berkeley National Laboratory.
WORRELL, E. & PRICE, L. 2001. Policy scenarios for energy efficiency improvement in industry.
Energy Policy, 29(14): 1223-1241.
WORRELL, E., PRICE, L. & MARTIN, N. 2001. Energy efficiency and carbon dioxide emissions
reduction opportunities in the US iron and steel sector. Energy, 26(5): 513-536.
XU, T. 2014. Bottom-up Representation of Industrial Energy Efficiency Technologies in Integrated
Assessment Models for the US Pulp and Paper Sector. Berkeley, CA: Lawrence Berkeley
National Laboratory.
YIN, R. 1994. Case study research: design and methods. Beverly Hills. CA: Sage publishing.
ZEITZ, R. A. (Ed). 1997. Energy efficiency handbook. Burke, VA: Council of Industrial Boiler
Owners.
ZILAHY, G. 2004. Organisational factors determining the implementation of cleaner production
measures in the corporate sector. Journal of Cleaner Production, 12(4): 311-319.

9-- 102 -
APPENDICES
APPENDIX A
Results from questionnaires
Table A1: The Significance of Drivers for Energy Efficiency Projects
Drivers for Energy Efficiency Projects Average Std Error
Corporate support 4.75 0.13
Organizational energy policy/ strategic energy objectives 4.42 0.26
Awareness and knowledge - from information sources such
as conferences, visiting other pulp mills etc. 3.50 0.23
Team/group motivating a project 3.42 0.19
Awareness and knowledge- from training 3.25 0.25
Vendors offering/ providing solutions 3.25 0.25
Individual motivating a project 2.50 0.23
Table A2: The Significance of Financial, Economic and Market Barriers
FINANCIAL, ECONOMIC AND MARKET Average Std Error
Energy costs are sufficiently important 4.58 0.19
Slow rate of return of the investments 4.08 0.31
Specific installation costs 4.00 0.35
Economic trend or market situation 3.92 0.29
Increased perceived cost of energy saving measures 3.75 0.28
Existence of more promising investment opportunities 3.17 0.30
Cost of acquiring information and incorporating new technologies
greater than expected saving on energy bill 3.17 0.39
High transaction costs 3.00 0.41
Cost of possible production disruption 2.75 0.39
Cost of identifying opportunities, analyzing cost effectiveness 2.50 0.26

9-- 103 -
Table A3: The Significance of Organizational and Behavioral Barriers on the Uptake
of Energy Efficient Technologies
ORGANISATIONAL AND BEHAVIOURAL Average Std Error
Focus on daily production problems 3.92 0.26
Short term thinking and planning of owners 3.25 0.35
Bureaucratic procedures to get governmental financial support 3.18 0.46
Lean organization 2.83 0.32
Resistance to technology adoption- technology can only be
implemented after end of life of existing equipment 2.83 0.32
Energy management - not core business activity 2.67 0.41
Lack of technical skill 2.58 0.38
Poor information quality regarding energy efficiency opportunities 2.50 0.29
Lack of staff awareness 2.42 0.42
Long decision chains 2.25 0.22
Cost of staff replacement, retraining 2.17 0.21
Conflict of interest 2.00 0.35
Table A4: The Significance of Technological Barriers
TECHNOLOGICAL Average Std Error
Technology fitting into process 3.50 0.29
Limited space 3.17 0.44
Irreversibility of technological change 2.67 0.38
Fear of losing flexibility in process 2.67 0.38
Technical risks 2.58 0.43
Resistance to replacing existing machinery 2.33 0.36
Table A5: The Significance of Uncertainty to the Uptake of Energy Efficient
Technologies
UNCERTAINTY Average Std Error
Uncertainty regarding future of the refinery 3.92 0.23
Uncertainty related to policy and future subsidies/ environmental
requirements 3.92 0.36
Change in energy prices - uncertainty about economic benefits of
energy efficiency improvement 3.50 0.36
Fears that future technologies will be cheaper and better 1.83 0.30

9-- 104 -
Raw Data
Barriers
Respondent
Ratings
Energy costs are sufficiently important 5 5 5 4 5 5 4 5 4 5 3 5
Increased perceived cost of energy 3 5 5 4 3 4 2 4 4 5 3 3
High transaction costs 2 5 4 3 1 1 2 4 4 3 2 5
Slow rate of return of investments 5 5 5 3 5 5 3 3 2 4 4 5
Existence of more promising investment opportunities 4 5 2 2 3 4 2 2 3 4 3 4
Long Decision chains 3 2 3 2 3 2 1 2 3 3 2 1
Lack of technical skill 2 3 5 1 1 3 1 4 4 2 3 2
Short term thinking and planning of owners 3 3 2 2 4 3 1 5 4 5 4 3
Technical risks 4 2 5 2 1 1 1 4 2 2 2 5
Resistance to replacing existing machinery 4 2 3 1 3 2 1 5 2 1 2 2
Irreversibility of technological change 4 5 3 3 3 1 1 4 2 3 2 1
Focus on daily production problems 4 5 4 4 3 3 2 4 4 5 5 4
Cost of staff replacement, retraining 2 3 2 2 1 2 2 1 3 3 3 2
Fears that future technologies will be cheaper and better 3 3 2 1 1 2 1 4 1 1 2 1
Uncertainty related to policy and future
subsidies/environmental requirements 5 5 5 2 5 4 4 4 2 4 5 2
Conflict of interest within the company 4 1 2 1 1 4 1 3 3 1 1 2
Cost of possible production disruption 5 2 2 2 4 2 1 5 2 4 2 2
Bureaucratic procedures to get governmental financial
support 4 3 4 1 1 1 3 5 4 4 5 -
Resistance to technology adoption- technology can only be
implemented after end of life existing equipment 4 4 2 2 3 3 1 5 3 2 3 2
Lean organisation 3 4 3 2 2 3 1 5 4 2 3 2
Energy management not core business activity 1 3 4 3 1 3 1 4 5 2 4 1
Specific installation costs 4 5 5 4 4 5 1 5 4 5 3 3
Economic trend or market situation 4 5 4 2 4 3 3 5 3 5 5 4
Cost of acquiring information and incorporating
technologies greater than expected saving on energy bill 2 2 5 2 5 3 2 5 2 2 4 4
Cost of identifying opportunities, analysing cost
effectiveness 2 4 2 1 1 3 2 3 3 3 3 3
Lack of staff awareness 1 3 2 1 1 1 4 3 5 1 4 3

9-- 105 -
Poor information quality regarding energy efficiency
opportunities 3 4 3 2 2 2 2 3 4 1 3 1
Fear of losing flexibility in the process 3 2 5 2 3 1 3 4 3 1 4 1
Technology fitting into process 4 5 5 3 4 2 2 4 3 4 3 3
Limited space 2 5 5 2 3 2 1 4 4 5 4 1
Uncertainty regarding future of the pulp mill 3 5 3 4 5 4 3 5 4 4 3 4
Change in energy prices- uncertainty about economic
benefits of energy efficiency improvement 5 5 3 3 2 2 5 4 3 5 3 2
Opportunities
Respondents
Ratings
Maintenance best practices 30 30 50 80 20 35 80 20 50 10 50
Individual behaviour change-
operational excellence 30 40 80 70 10 30 100 20 65 15 60
Organisational culture change 20 10 80 90 30 30 100 10 65 30 60
Optimisation 50 10 50 80 30 35 70 30 80 10 30
Utilities and cross cutting
opportunities eg pumps, fans,
motors 20 10 50 80 15 30 100 30 90 20 60
Process specific opportunities 30 30 50 90 15 25 100 50 50 20 20
Current
Respondent Ratings
Regulation
Energy performance standards for
industrial technologies 2 1 3 1 2 1 1 1 3 2
Mandatory targets for Demand Side
Management 1 3 3 2 2 1 2 2 4 3
Labelling of industrial technologies 1 3 3 1 1 3 1 1 2 2
Financial
Financial instruments such as subsidy
schemes, tax incentives 2 1 5 2 1 1 1 1 2 1
Energy tax deductions 2 1 5 2 1 1 1 1 2 1
Information
Training/Information/Knowledge
transfer 3 4 2 3 3 1 3 3 5 3
Energy Audits 4 3 2 3 3 1 2 3 3 2
Voluntary Agreements
Voluntary agreements to improve
energy efficiency 2 1 2 - 2 2 3 1 5 3

9-- 106 -
Future
Regulation
Energy performance standards for
industrial technologies 3 3 5 3 3 3 5 3 5 5
Mandatory targets for Demand Side
Management 3 3 4 4 4 2 4 3 5 4
Labelling of industrial technologies 2 5 5 4 1 4 4 4 4 4
Financial
Financial instruments such as subsidy
schemes, tax incentives 5 5 5 5 3 3 5 4 5 3
Energy tax deductions 5 5 5 4 3 3 5 4 5 3
Information
Training/Information/Knowledge
transfer 4 4 3 4 4 2 4 5 5 5
Energy Audits 4 3 3 5 4 2 4 5 5 5
Voluntary Agreements
Voluntary agreements to improve
energy efficiency 3 1 3 - 3 3 4 2 5 3
Questionnaire
Please rate the relative importance of identified factors towards the adoption of readily
available energy efficient technologies.
(complete insignificance 1 - very significant 5)
Energy costs are sufficiently important
Increased perceived cost of energy saving measures
High transaction costs
Slow rate of return of the investments
Existence of more promising investment opportunities
Long decision chains
Lack of technical skill
Short term thinking and planning of owners
Technical risks
Resistance to replacing existing machinery
Irreversibility of technological change
Focus on daily production problems
Cost of staff replacement, retraining
Fears that future technologies will be cheaper and better

9-- 107 -
Uncertainty related to policy and future subsidies/ environmental requirements
Conflict of interest within the company
Cost of possible production disruption
Bureaucratic procedures to get governmental financial support
Resistance to technology adoption- technology can only be implemented after end of
life of existing equipment
Lean organization
Energy management not core business activity
Specific installation costs
Economic trend or market situation
Cost of acquiring information and incorporating new technologies greater than
expected saving on energy bill
Cost of identifying opportunities, analyzing cost effectiveness
Lack of staff awareness
Poor information quality regarding energy efficiency opportunities
Fear of losing flexibility in process
Technology fitting into process
Limited space
Uncertainty regarding future of the refinery
Change in energy prices - uncertainty about economic benefits of energy efficiency
improvement
Comments:
______________________________________________________________________
Please rate the significance of the following on the uptake of energy efficiency projects.
(1 complete insignificance - 5 very significant)
Corporate support
Organizational energy policy/strategic energy objectives
Awareness and knowledge – from training
Awareness and knowledge -from information sources such as
conferences, visiting other pulp mills etc.
Individual motivating a project
Team/group motivating a project
Vendors offering/providing solutions

9-- 108 -
Comments and or/other: _______________________________________________
Please rate the potential for improvement in the following: (%)
Maintenance best practices
Individual behavior change- operational excellence
Organizational culture change
Optimization
Utilities and Cross cutting opportunities – eg pumps, fans,
motors
Process specific opportunities
Comments and or/other: _______________________________________________
(0% being operations excellence and no room for improvement. 50% meaning we can improve
by 50% on current situation) Column does not have to add up to 100%.
Please rate the relative influence of listed policy instruments to the adoption of readily
available energy efficient technologies.
(complete insignificance 1 - very significant 5)
Policy instruments
Rating
Current Future
Regulation
Energy performance standards for
industrial technologies
Mandatory targets for Demand Side
Management (DSM)
Labelling of industrial technologies *
Financial
Financial instruments such as subsidy
schemes, tax incentives
Energy tax deductions
Information
Training/Information/Knowledge
transfer