energy efficient video transmission over a wireless link
TRANSCRIPT
IEEE Transactions on Vehicular Technology VT_2007_00627
1
Energy Efficient Video Transmission over a
Wireless Link
Ye Li, Martin Reisslein, Senior Member, IEEE, Chaitali Chakrabarti, Senior Member, IEEE
Abstract—Energy minimization is an important design goal in wireless video transmission. We examine how the RF energy and the analog circuit energy, which account for a large part of the energy consumption for wireless video transmission, can be controlled with physical layer parameters, such as modulation level, bit rate, BER, and MAI, as well as link layer specifications, such as the buffer status as well as idle and active time. Building on these insights, we develop three energy efficient video transmission schemes for the single user system, namely, Frame by Frame transmission, GOP by GOP transmission, and Client Buffer Related Energy-efficient Video Transmission (CBEVT). Our simulations indicate that up to 85% energy-saving is achievable in the RF front-end by use of the CBEVT algorithm. We also present an energy efficient optimal smoothing algorithm for reducing the RF front-end energy consumption as well as the peak data rate. For the CDMA based multi-user system, we propose an RF front-end energy model under the perfect power control assumption. We find the signal-to-interference-noise ratio (SINR) for the entire system that minimizes the total energy consumption. We propose the Multi-User Based Energy efficient Video Transmission (MBEVT) algorithm, which can achieve up to 38% energy-saving for a 6-user CDMA system with an independent 16MB buffer for every uplink.
Index Terms—Energy efficiency, RF front-end, wireless video
I. INTRODUCTION ireless multimedia services, which are growing in popularity, pose several challenges, including
overcoming bandwidth variations and limited battery lifetime. While the next-generation wireless technologies promise more reliable communication and higher bandwidth, the problem of high energy consumption during video transmission is largely unresolved. In this paper, we develop wireless video transmission schemes that ensure the timely delivery of the video frames while saving energy.
Manuscript received August 31, 2007, revised Feb. 2, 2008 and May 2, 2008. This work was supported in part by grant NSF CSR-EHS 0615135 and NSF No. Career ANI-0133252.
Ye Li was with the Dept. of Electrical Engineering, Arizona State University, Tempe, AZ; he is now with the Institute of Biomedical and Health Engineering, Shenzhen Institutes of Advanced Technology; Chinese Academy of Sciences, (e-mail: [email protected] )
Martin Reisslein and Chaitali Chakrabarti are with the Dept. of Electrical Engineering, Arizona State University, Tempe, AZ 85287-5706, e-mail: {reisslein, chaitali}@asu.edu.
For the design of energy efficient wireless video transmission schemes, the cause of the energy consumption needs to be better understood. For instance, the circuit energy in the radio frequency (RF) front-end1 can no longer be ignored. Consider the IEEE 802.11b wireless LAN card based on Intersil’s PRISM II chipset that consumes about 110mW for the medium access control (MAC) processor, 170mW for the digital base-band electronics, 240mW for the analog electronics, and 600mW for the power amplifier (PA) [1]. Thus, about 75% of the total power is dissipated in the RF front-end circuit! In order to accurately evaluate the RF front-end energy consumption, we build on our RF front-end energy model work [2] [3], and tie the physical layer (PHY) parameters, such as bit error rate (BER), modulation level, bandwidth, bit rate, and multiple access interference (MAI), to the RF circuit energy consumption. Our video transmission schemes adjust these physical layer parameters to minimize the RF energy consumption.
The low power wireless video transmission schemes must also consider the video streaming QoS constraints. Our schemes explicitly consider video streaming parameters, such as the client/receiver buffer status, the permissible stream start-up delay, the varying video bit rates (encoded frame sizes), and the video frame playout deadlines to ensure the timely delivery of the video frames. Until now, there has not been much work on low power video transmission. Kim and Kim [8] propose a power-distortion optimized coding mode selection scheme for variable-bit-rate (VBR) video over time-varying channels to minimize the transmit power subject to distortion constraints. The target BER of a video packet is variable and is determined by the importance of the packet. They also propose an optimum power management scheme over slowly-varying Rayleigh-fading channels [9]. Lu, Erkip, and Wang [7] present a Reed-Solomon (RS) channel encoder power model, a block-based H.263 encoder power model, and a distortion model. They jointly optimize the transmission energy, the code rate of the channel encoder, and the source encoder for minimum power consumption in cellular networks. They further minimize the transmission power consumption over WLANs by finding the optimal PHY and MAC parameters [10]. A two-step fast algorithm to reduce the
1 We define the RF front-end as the building blocks after (and including) the
Digital-to-Analog Converter (DAC) in the transmitter and the blocks before (and including) the Analog-to-Digital Converter (ADC) in the receiver.
W

IEEE Transactions on Vehicular Technology VT_2007_00627
2
computation burden in the base station for a multi-user environment has also been developed [11]. Zhang, Ji, and Zhu [12] propose a power-minimized bit-allocation scheme jointly considering the processing power for source coding and channel coding, as well as the transmission power. The total bits are allocated between source and channel coders to minimize the total power consumption, according to the wireless channel conditions and video quality requirement. For high quality video stream transmission, the peak data rate may exceed the nominal bandwidth over wireless links. In [13], Luna et al. propose a joint source coding and data rate adaptation method to minimize the transmission power under delay and quality constraints. Salehi, Zhang, and Kurose present an effective algorithm which achieves the largest possible reduction in the rate variability with a given buffer size [14]. However, their work ignores the energy consumption. In [15], Pollin et al. propose cross-layer resource allocation method for multi-user scenario and evaluate the performance using MPEG-4 video traces. Yeh et al. [16] examine energy saving mechanisms, in particular, the impact of timer settings, in two major wireless standards.
One of the key limitations of existing works on low power video delivery is that they focus on transmission energy but ignore or over-simplify the effect of the RF front-end circuit energy. The RF front-end, however, consumes more dissipated energy than radiated energy because of the low efficiency of a class A power amplifier (PA), especially for communication over small or medium distances. In this paper, we develop new energy efficient video transmission schemes that are based on an accurate system-level energy model for the RF front-end [2] [3].
Our approach to designing energy efficient video transmission schemes relies largely on adapting the modulation level, while considering the related physical layer parameters, such as bit rate, bandwidth, signal-to-noise ratio (SNR), and MAI, to reduce RF energy consumption. Related MAC layer parameters, such as the idle time and the active time of the transmitter, are also optimized for the lowest transceiver energy consumption. We schedule the data rate according to the buffer occupancy (data link layer) and the MPEG stream frame specifications (application layer). Although source video coding also contributes to the energy consumption [7], we do not consider its effect in this paper. Our focus is on the energy-efficient transmission of pre-encoded video.
We develop several low power video transmission schemes for a single user wireless system. The Frame by Frame scheme and the GOP (group of pictures) by GOP scheme transmit at the optimal data rate for every frame or GOP and thereby save energy. The Client Buffer Related Energy efficient Video Transmission (CBEVT) algorithm considers the effect of both the client buffer occupancy and the video delay constraint and is shown to have the highest RF energy savings. The modified optimal smoothing algorithm is an extension of [14] that can reduce both the RF energy consumption and the peak data rate. Finally, we develop an RF front-end energy model for the code division multiple access (CDMA) based multi-user system and propose a Multi-User Based Energy efficient Video Transmission (MBEVT)
algorithm. In this algorithm, the entire system energy consumption is minimized by considering the number of active users, the client buffer sizes, and the delays. The performance of these schemes is evaluated using 30-minute MPEG-4 encodings with a range of bit rates.
The remainder of this paper is organized as follows. Section 2 describes the dominant power parameters for every RF component in the wireless transceiver, and the operation modes for the RF transceiver. Section 2 also describes the notion of an optimal modulation level b, and the parameters that affect it. The four low power video transmission schemes for the single user system are proposed in Section 3 and their energy performance is evaluated. Section 4 describes the improved RF front-end energy model for the multi-user environment, the MBEVT algorithm, and its energy performance. Section 5 summarizes the paper.
II. POWER MODEL AND OPERATION MODES FOR THE TRANSCEIVER
We consider a full-duplex transceiver for a CDMA based wireless device in Wi-Fi networks. The receiver and the transmitter work independently. During communication, the transmitter delivers a video stream to the base station via the uplink while the receiver gets the feedback and state information from base station via the downlink. Uplink and downlink work at different data rates and at different modulation levels.
Fig.1 Block diagram of the transmitter analog signal chain
Fig.2 Block diagram of the receiver analog signal chain
A. Transceiver Building Blocks In order to minimize the total energy consumption for video
transmission, it is essential to consider the energy consumption of the RF front-end. We use the standard wireless transmitter and receiver model from [4] as described in Fig. 1 and Fig. 2, respectively. The main components of the analog signal chain of the transmitter are DAC, reconstruction filter, mixer, power amplifier (PA), and RF filter. Similarly, the main components of the receiver signal chain are RF band select filter, LNA, downconversion mixers, baseband amplifier, baseband & anti-aliasing filter, ADC, and RF synthesizer.
B. Power Model of the RF Front-End We employ the power models of [2] [3] for each of the
components in the analog signal chain of a transmitter/receiver. These models have been derived by considering the dominant

IEEE Transactions on Vehicular Technology VT_2007_00627
3
power parameters, such as signal bandwidth, signal center frequency, signal peak-to-average ratio (PAR), modulation level, signal-to-noise ratio (SNR), and the gains.
Table 1 [2] summarizes the effects of the different parameters that contribute to the power consumption of the different RF front-end components. For instance, the power consumption of a Class A PA is a function of PAR, distance d, number of bits per symbol b, and symbol error rate SER. Table 1 also lists the exemplary power consumption of the different RF components in active mode.
Table 1. RF power consumption for different blocks in the RF front-end of a transceiver from [2].
Components Power Model Parameters
Transmit Mode
Idle/Receive Mode
PA PAR, d, b, SER, Rs
126.5 mW 0 mW
Mixer K,NF� 21 mW 21 mW
Freq. Syn. refLOc FF ,,ω 67.5 mW 67.5 mW
LNA A, NF 0 mW 20 mW
ADC PAR, SQNR, f 0 mW 5.85 mW
DAC PAR, SQNR, OSR 15.4 mW 0 mW
Filter f, SNR 2.5 mW 2.5 mW
Baseband Amplifier
B, � BAα 0 mW 5 mW
Ref. System Vdd, Iref 0.5 mW 0.5 mW
Total N/A 233.4 mW 122.35 mW PAR is the peak-to-average ratio; SNR is the signal-to-noise ratio; SER is the symbol error rate; d is the transmission distance; Rs is the signal symbol rate; b is the modulation level (number of bits per symbol); K is the gain of the mixer; NF is the noise figure; ��c is the center frequency of the VCO; FLO is the frequency of the local oscillator; Fref is the reference frequency; A is the gain of the LNA; SQNR is the signal-to-quantization noise ratio of the ADC and DAC; f is the signal frequency of the ADC; OSR is the over-sampling ratio of the DAC; B is the bandwidth of the baseband amplifier; �BA is the gain of baseband amplifier; Vdd is the DC voltage; Iref is the reference current. Pout_rms=13 dBm. We used PAR=5 dB, d=10 m, b=4 for calculating the exemplary PA transmit mode power in the table.
C. Operation Modes of the RF Transceiver In video transmission, the transceiver works in the following
four modes: (1). Transmit: The transmitter is fully on. The transmitter
modulates the data and sends it through the antenna. (2). Receive: The receiver is fully on. The receiver detects,
demodulates, and passes packets to the base-band processor.
(3). Idle: Most blocks in the transmit signal chain are turned off while the receiver is still on. The base-band processor is partially on.
(4). Transient mode: The transmitter switches from idle mode to transmit mode, and vice versa.
We ignore the sleep mode since the transceiver is hardly turned off during video transmission. The total energy
consumption in the RF front-end is given by the sum of the energy consumption in the four modes.
transienttransientidleidlereceivereceivetransmittransmittotal TPTPTPTPE +++= (1) In many state-of-the art analog and RF circuits, digital calibration, and speed-up modes are used to quickly bring the front-end to a fully operational mode, making the transient energy consumption negligible. Furthermore, since the idle power consumption in the RF front-end circuit is almost the same as that in the receive mode
transienttransientTP
receiveP[2], we
approximate idleP ≈ . Since the entire RF circuit, or parts of the RF circuit are turned on in the transmit, receive, and idle modes, these three modes constitute the active mode, i.e., idlereceivetransmitactive TTTT ++= . However, for a full-duplex system, the receive mode time covers the transmit mode time. Hence, T idlereceiveactive TT += and Equation (1) can be simplified to
activereceivetransmittransmitreceivetransmittotal TPTPEEE += + = (2) The transmit mode energy consumption Etransmit can be further divided into (i) signal transmission energy (radiated energy), which is delivered to the antenna, and (ii) dissipated energy which is the energy consumed by the electronic circuits. Since the transmission energy is delivered by the PA, PPA includes both radiated energy and dissipated energy [4] [5].
transmiDACfilterFSmixPAtransmit TPPPPPE )( +++ + t= ,
where PPA, Pmix, PFS, Pfilter, and PDAC are the power consumption of the PA, mixer, frequency synthesizer, analog filters, and DAC, respectively. In Section 3, we discuss the transmit energy consumption in detail.
In the receive mode,
activADCBAfilterFSmixLNAreceive TPPPPPPE )( ++++ + e= ,
where PLNA, PBA, and PADC are the power consumption of the LNA, base-band amplifier, and ADC, respectively. According to Table 1, most of the dominant power parameters in the receive signal chain, such as the operation frequency, the peak bandwidth and the gain, cannot be adjusted during communication. Therefore, we consider the total power consumption in the receive mode as a constant, and the energy consumption only as a function of the active time.
D. Energy Consumption in Transmit Mode As illustrated in Table 1, the dominant power parameters for
the mixer, frequency synthesizer, DAC, and analog filters are typically fixed; we consider a common scenario where the total power consumption of these blocks is fixed at 107 mW. Although the DAC is a PAR related component and thus the power consumption is related to the modulation level, the power variation in the DAC is comparatively small. Hence, we consider the DAC power consumption as a constant. However, the power consumption of the PA depends on adjustable parameters such as d, PAR, Rs, and b, allowing us to select these parameters so as to minimize the transmission energy.
Consider M-QAM modulation and denote s
bit Rb ⋅=
1T ,
where Rs is the symbol rate in Hz. Then, the active energy

IEEE Transactions on Vehicular Technology VT_2007_00627
4
consumption per bit for the RF front-end is for all modulation levels b given by [2]
),(2
1141
1)12(31610107
21
21
02
223
α
λπ
bPARBERbQ
bN
KGGLd
RbE
b
b
trsbit
⎟⎟
⎠
⎞
⎜⎜
⎝
⎛⎟⎟⎠
⎞⎜⎜⎝
⎛⋅⎟
⎠⎞
⎜⎝⎛ −
⋅−+⋅×
=
−−
−
. (3)
where the first term sRb ⋅
× −310107 is the energy of all components
except the PA, and the second term is the energy consumption of the PA. Q-1 is the inverse of the function
∫∞
−=x
y dyexQ 2/2
21)(π
. PAR is a function of the modulation
level b and is also affected by the pulse shaping roll-off factor α , which we fix to 0.25. From [2] [3], we have
offrollCb
b
PARPARPAR −⋅⋅+
−⋅=
)12(
)12(32
2 , (4)
where PARc and PARroll-off are the peak-to-average ratio of the carrier and the peak-to-average ratio related to the roll-off factorα . For a sine wave carrier, PARc=1.4.
In the remaining part of this section, we consider the system to have fixed bandwidth and fixed symbol rate, which is very common in current wireless systems.
Table 2 System parameter values for Wi-Fi application considered in determining the optimal modulation level b
Rs=1MHz Gr=1 Gt=1 L=0.8 fc=2.5GHz λ=0.12m
25.0=α K=0.5 N0/2=10-16W/Hz BER=10-3
I0_DAC=10μA SQNRADC=50dB
SQNRDAC=60dB OSRDAC=4
E. Optimal Modulation Level in a Fixed Bandwidth System In this section, we determine the optimal modulation level
that minimizes the energy consumption per bit for fixed bandwidth systems. In order to find the optimal modulation
level b, we need to find the value of b for which 0=db
dEbit .
Finding the derivative of (3) is not straightforward and therefore we make use of 4th order regression to approximate the second term in (3). Further, we set the BER and the other system parameters as listed in Table 2 and establish a relationship between b, Rs, and d.
( )2878.681092.633804.291513.54008.0
31610107
234
02
223
+−+−
×⋅⋅+⋅×
= −
−
bbbb
PARPARNKGGLd
RbE Coffroll
trsbit λ
π
31 10107 −×=C
. (5)
Let and 122
02
2 10269.33
16 −− ×=⋅⋅⋅⋅⋅
=KGG
PARPARNLC
tr
coffroll
λπ
. Then 0=db
dEbit
implies
01092.637608.584539.156032.1 22
12345 =⋅⋅
−−+−dCR
Cbbbbs
(6)
Solving (6) for b gives the optimal b which is a function of d. While the optimal b is also affected by the parameters Rs, N0, λ , α , Gr, and Gt, these are typically fixed or have negligible effect on b, and are considered constant in this analysis.
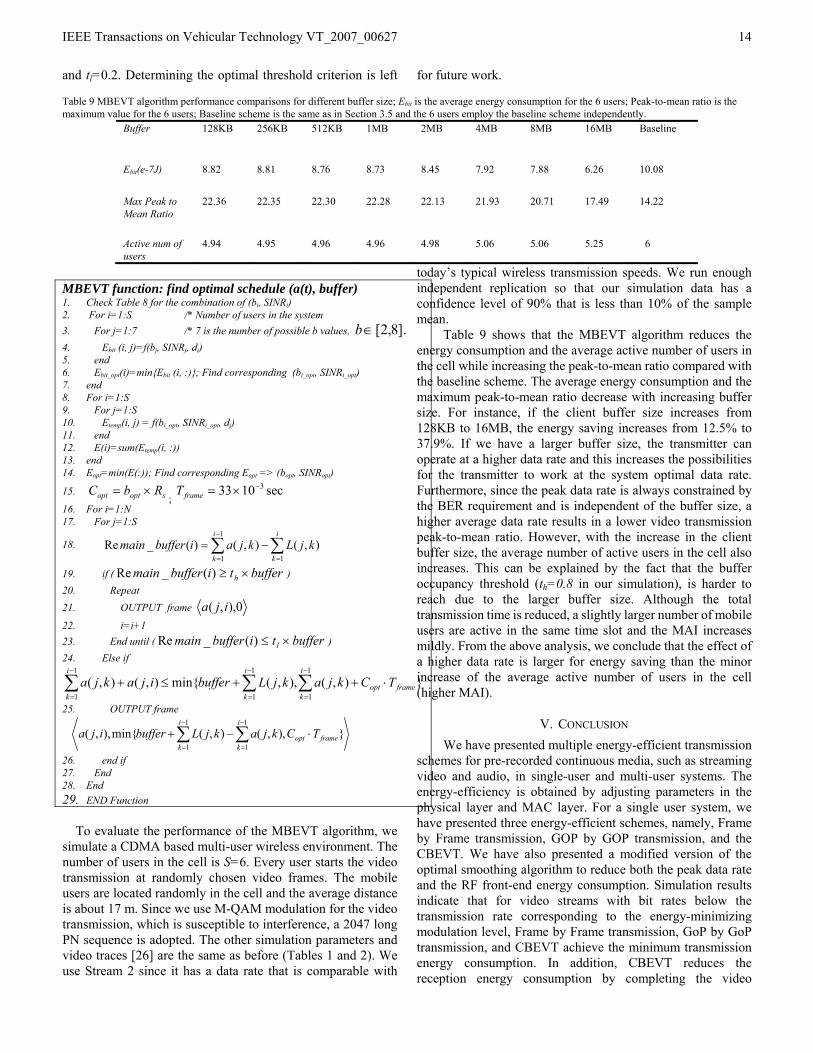
Fig. 3 describes the effect of the modulation level b on Ebit for different values of the distance d. We observe that for every d there is a modulation level b for which Ebit is minimal, referred to as bopt. For instance, for d=1m, bopt =8 and for d=6m, bopt =5. When b is less than bopt, the RF front-end energy consumption reduces with the increase of b. This is because for small b, the energy consumption of other RF front-end components, except the PA (first item in (5)), are dominant. For b larger than bopt, the energy consumed in the PA (second item in (5)) is dominant and the RF front-end energy increases with b. (If we plotted the modulation level for values above 8, the curve for d=1m would show the same tendency as other curves.) For larger b, the signal is more susceptible to interference and higher PA radiated power is necessary to maintain the BER. A similar trend can also be seen in [2]. In typical wireless environments, modulation levels b of 8 and above are impractical and we therefore focus on the energy performance in the range from 1 to 8. For a fixed d, the observed Ebit trends are similar to those in [5] [18]. When the transmission distance is low, [5] [18] show that Ebit decreases as b increases for small b, and then increases for larger b.
1 2 3 4 5 6 7 8
10-7
Number of bits per symbol (b=logM)
Ener
gy p
er b
it (J
)
d = 1md = 6md = 10md = 15md = 25m
Fig.3 RF front-end active energy per bit vs modulation level b with different distance d; PAR=5 dB, BER=10-3.
Fig. 3 also shows that the value of bopt decreases as d increases. Since energy consumption of the PA is d-sensitive, larger d means higher energy consumption of the PA, which compensates for the path loss of the signal and maintains the BER, resulting in smaller bopt .
III. ENERGY EFFICIENT VIDEO TRANSMISSION FOR SINGLE USER COMMUNICATION SYSTEM
We consider variable bit rate (VBR) encoded video streams, where the frame size (in bits) is variable, and the frame period is typically fixed. In this paper, we use a typical frame period of 33 ms. We propose four adaptive video transmission

IEEE Transactions on Vehicular Technology VT_2007_00627
5
schemes: Frame by Frame transmission, GOP (group of pictures) by GOP transmission, Client Buffer Related Energy efficient Video Transmission (CBEVT), and an energy efficient optimal smoothing scheme. Consistent with typically rare mobility when watching videos in Wi-Fi networks, we consider a slow fading channel in which the attenuation factor is constant over the duration of a frame or GOP. Although the optimal modulation level bopt changes only infrequently for the considered largely stationary Wi-Fi video scenario, our algorithms, in principle, require that the parameters affecting the optimal modulation level, including the distance and channel condition, are updated frequently enough such that the currently valid optimal modulation level is available when our transmission schemes make decisions on the modulation level used for the transmission of a video frame (or GoP), that is, every video frame period (or GoP). The basic idea of our adaptive transmission schemes is to adjust the modulation level b (and correspondingly the data transmission rate) for every video frame (or GOP) to save energy. Thus, our transmission schemes require that the wireless system can change the modulation level every video frame period (or GoP). Most current wireless systems, such as WCDMA and 802.11, can easily meet these update frequency requirements. We also require that the underlying optimal modulation level rarely changes while the transmission of a given video frame (or GoP) is ongoing, as is reasonable for video reception in Wi-Fi networks with rare mobility. (Slight channel variations during an ongoing frame transmission could be compensated by automatic gain control.)
We compare the performance of our adaptive transmission schemes with respect to a baseline transmission scheme, which transmits the video frames without any adjustment. Baseline transmission uses 16-QAM modulation and transmits each frame with the fixed modulation level b = 4, which is large enough to transmit the largest video frame within one video frame period of 33 ms (For smaller frames, the transmitter finishes the transmission before the end of the video frame period and then idles until the end of the video frame period). We evaluate the performance of our schemes for different data rates, client (receiver) buffer sizes, and start-up delays.
We set the BER to 10-3 and suppose that non-adaptive forward error control (FEC) can correct this level of bit error such that there is no frame loss. (Note that the FEC is only one of many functions carried out in the digital baseband processor, which consumes significantly less power than the RF front-end [1]. Hence, the power consumption for FEC can be considered a small constant and is ignored in this work.)
In this section, we consider a single ongoing video stream transmission. Multiple simultaneously ongoing video stream transmissions in a wireless CDMA system are considered in Section 4. For wireless TDMA systems that need to support multiple stream transmissions in a given frequency band, the transmissions for the different ongoing video streams need to be separated in time. Real-time transmissions schemes, e.g., [19]-[22], can achieve this transmission time separation and ensure that the video packets are delivered with minimal delay. Such real-time schemes can be combined with the single-stream energy-saving transmission schemes developed in this section; evaluations of the combinations of the
energy-saving transmission schemes with the real-time transmission schemes are beyond the scope of this paper and are an interesting direction for future work.
Knowing the client buffer capacity, the transmitter keeps track of the client buffer occupancy through tracking its transmissions and the sizes of the video frames retrieved from the buffer for playout according to the fixed, known playout schedule of the pre-encoded video. In a system with frame loss on the wireless link, an ACK/NAK mechanism would be necessary so that the transmitter can track the successfully received video frames. Also, note that in a system with frame loss, for the fixed BER, which we achieve by adjusting the modulation level and the transmission power, the frame loss and retransmission rates are constant for different modulation levels, allowing us to ignore the re-transmission energy consumption.
A. Frame by Frame Transmission A given frame is transmitted within one frame period. Let
breq be the required modulation level to transmit the frame in one frame period. If breq is smaller than bopt, we choose bopt as the modulation level; if breq is larger than bopt, we use breq. When bopt is chosen for low power transmission, the data rate increases and the frame is transmitted in a shorter time, i.e., within less than the 33 ms frame period. After the transmission, the transmitter goes to idle mode for the remainder of the frame period and only the receiver is in operation.
B. GoP by GoP Transmission In an MPEG video stream, several frames make up one GOP.
In this work, we assume 12 frames make up one GOP. We can treat one GOP as a large frame and transmit it with a lower energy. Suppose that for frame n, Tn, ln, and bn are the time duration, frame size (in bit), and modulation level. Also, let e(Tn) denote the energy consumption for frame n; E(bn) is the energy consumption for frame n with modulation level bn. Let Rb and Rs denote the bit rate and the symbol rate, respectively. The optimization constraints and the objective function can be stated as:
Constraints: (1) T1+T2+T3+…+T12 <= T (pre-set deadline=396ms)
(2) sn
n
b
nnbitn Rb
lRl
lTT⋅
==×=
Objective Function: . ⎟⎠⎞
⎜⎝⎛∑
=
12
1}{)(min
iiT
Tei
From the first two constraints, we have
sn n
n RTbl
⋅≤∑=
12
1.
The objective function can be restated as
. ⎟⎠⎞
⎜⎝⎛=⎟
⎠⎞
⎜⎝⎛ ∑∑
==
12
1}{
12
1}{)(min)(min
nnbi
iTbETe
ni
Using the RF energy model given in (5), we define
sRCP 1= , and 2
2 dCM ⋅=

IEEE Transactions on Vehicular Technology VT_2007_00627
6
29.6811.6338.2915.54.0)( 234 +−+−= bbbbbf . Then, (5) can be expressed as
)(bfMbPEbit ×+= .
Hence, the objective function is
∑=
⎟⎟⎠
⎞⎜⎜⎝
⎛××+×
12
1}{)(min
nnn
n
n
blbfM
bl
Pn
, s.t. sn n
n RTbl
⋅≤∑=
12
1 . (7)
The corresponding Lagrangian is
)()(12
1
12
1s
n n
n
nnn
n
n RTbllbfM
blPy ⋅−⋅+⎟⎟
⎠
⎞⎜⎜⎝
⎛××+×= ∑∑
==
μ
0≥
where μ is the Lagrange multiplier. For a local minimum, the first order necessary condition is
0)( 2'
2 =−×+−=∂∂
nn
nn bbfM
bP
by μ (8)
There are two possibilities:
(1) The constraint is inactive, i.e., sn nb
l⋅
=
12
1
n RT<∑
and 0=μ : This maps to solving a problem without
constraints. Equation (8) reduces to 0)( =nbf
which can be expressed as
/2 ×+−n
MbP
011.6376.5845.156. 2345 =−−+−1MPbbbb nnnn . (9)
While the 5th order equation has 5 roots, there is only one real root which is the optimal modulation level bopt. Note that bopt is a function of d, since P/M is a function of d. We list some typical d values and the corresponding real roots in Table 3. Table 3 Optimal modulation levels bopt for different transmission distance d.
d (m) bopt
3 6 10 4 15 3 25 2
(2) The constraint is active, i.e., sn n
n RTbl
⋅=∑=
12
1
⎟⎠⎞
⎜⎝⎛ ⋅⋅+⋅⋅ ∑
=
12
1}{)(
nnnsb
lbfMRTPn
: The objective
function (7) becomes
min .
The first order necessary condition is 0)( 2
/ =−×n
n bbfM μ n=1,2,….,12
011.6376.5845.156.1 2345 =−−+−M
bbbb nnnnμ . (10)
In (10), is positive and monotonically increases with integer b for any b>1. Since
)(/2nn bfb ×
μ and M are positive, (10)
has only one real root. The optimal modulation levels are thus
the same for all n, ands
nn
n RT
lb
⋅=
∑=
12
1* .
The final modulation level bn* can be calculated as
follows. We first check whether ∑ , if it is true,
bn*=bopt; if not,
=
⋅<12
1ns
opt
n RTbl
s
nn
n RT
l
⋅=
∑=
12
1*b .■
From the above analysis, we find that transmitting all the frames in one GOP with the same modulation level b is most energy efficient. The GOP by GOP scheme is summarized below: GOP by GOP Transmission:
1. Choose bopt for distance d according to (9); 2. Check whether
sn opt
n RTbl
⋅<∑=
12
1
.
If true, bn*=bopt until 12 frames of GoP are transmitted, then
idle transmitter for remainder of GoP period
Else, s
nn
n RT
l
⋅=
∑=
12
1*b for all n.
3. End.
C. CBEVT Algorithm Frame by frame and GOP by GOP transmission do not
consider the effect of the client (receiver) buffer size and client buffer occupancy. However, in practical systems, the client buffer occupancy is one of the most important factors to help ensure good communication quality. For example, if the client buffer overflows, the lost frames have to be unnecessarily re-transmitted, thereby increasing the network load. On the other hand, in case of buffer starvation, frames are lost for uninterrupted playback and the video must be suspended. In this section, we present the Client Buffer Related Energy efficient Video Transmission (CBEVT) scheme to avoid the client buffer from overflowing or starving while saving energy. Algorithm Parameter Definition: N : Number of frames in the video. P : Start-up delay in frame periods (time slots). Buffer: Client buffer capacity to store unplayed video frames. L(t) : Size of frame in time slot t in bits, t=1, 2,…N. D(t) : Cumulative amount of data (in bits) consumed by the
client over [1,t]: . ∑=
t
iiL
1)(
∑=
t
iia
1)(
soptopt RbC
a(t) : Amount of data (in bits) transmitted by the transmitter during time slot t. A(t) : Cumulative amount of data transmitted over [1,t]:
.
B(t) : Maximum cumulative data that can be received over [1,t], without buffer overflow.
Copt: Transmission rate minimizing RF energy per bit. ×= , where Rs is the symbol rate.

IEEE Transactions on Vehicular Technology VT_2007_00627
7
Fig. 4 illustrates the variation in the amount of data in the client buffer over multiple time slots. The difference between B(t) and D(t) is the client buffer size. The cumulative data transmitted A(t) must be more than D(t) but less than B(t) to ensure that the client buffer neither overflows nor starves. In every time slot, we can adjust a(t) for energy minimization. Since , there is a range of allowable modulation levels b. Using Fig. 3, we can select the value of b in this allowable range corresponding to the minimum Ebit. For example, if the start-up delay is P (
frames TRbta ××=)(
1≥P ) time slots, the cumulative data transmitted by the end of the Pth time slot, A(P), should be larger than the size of the first frame L(1), but smaller than the client buffer size, i.e., BufferPAL ≤≤)1( )( . In this range, we can choose the optimal A(P) so as to minimize the energy consumption.
Fig. 4 Illustration of the video data being received and consumed by the client
By the end of the (P+1)th time slot, the transmitted data A(P)+a(P+1) should be more than the sum of the first two frames, but smaller than the sum of the buffer size and the first frame, i.e., )1()1()()2()1( LBufferPaPALL +≤++≤+ . When solving this inequality, A(P) can be viewed as a constant since it has already been determined by the energy minimization for the previous P time slots, and we can adjust a(P+1) for the lowest energy consumption.
More generally, at the end of the (P+k)th time slot, A(P), a(P+1), a(P+2)…, a(P+k-1) are treated as constants and a(P+k) is adjusted to minimize the energy consumption. That is, , (11) ∑∑
=
+
=+≤++−+≤
k
i
k
iiLBufferkPakPAiL
1
1
1)()()1()(
from which, we find that a(P+k)=0 can satisfy the inequality if , where temp is a constant. Although
temp=0 satisfies the inequality, to avoid unexpected frame loss, we can set temp equal to the sum of several frame sizes to have a safety buffer of prefetched frames that allows continuous playback during wireless outages.
tempiLkPAk
i≥−−+ ∑
+
=
1
1)()1(
On the other hand, if , then
frameopt
k
iTCkPAiLBuffer ×+−+≤+ ∑
=)1()(
1
frameopt TCkPa + ≤ ×)(
33=frame opt
≥=
∑=
≤P
iLia
1)1()(
and the corresponding modulation level is smaller than the optimal bopt, which is not energy efficient. Thus, if the transmitter is idle in this time slot but transmits video with bopt in the next time slot, the energy consumption can be reduced. Based on this insight, we propose the CBEVT algorithm specified on the preceding page. CBEVT has superior performance compared to frame by frame and the GOP by GOP transmission. It not only has lower energy consumption, but also reduces the peak data rate.
CBEVT Function: find optimal schedule (a(t), Buffer, P) 1. sec10 3−×T ; sopt RbC ×= ; temp = constant; /*
0temp
2. a(1:P) frameopt TC × /* P is the start-up delay
3. IF /* video transmission during start-up
delay 4. a(1:P)
PL )(= 1
=
P
iBuffera
1)
5. END IF
6. IF ∑ ≥i(
7. ⎥⎦⎥
⎢⎣⎢=
frameopt TCBufferfloorNum
Numbuffer ×
×
8. a(Num+1) frameopt TC ×−= ; a(Num+2:P)=0;
9. END IF 10. k=0 11. Repeat /* video transmission begin at (P+k)th time slot 12. k=k+1
13. IF ∑ + i( ∑∑=
−+
=
+
=
≤×+≤k
iframeopt
kP
i
k
iLBufferTCiaiL
1
1
1
1
1))()(
14. OUTPUT frameoptCka( ),
∑∑=
−+
=
×+1
1
1
1))(
k
iframeopt
kP
iiLTCia15. ELSE IF
+
< (
16. OUTPUT frame
frame
kPk
i
T
aiLka
))((),(
11
1∑
−+
=
+
=
−
frame
kP
i
k
i
k
iiaiLBufferiL +<+≤ ∑∑∑
−+
==
+
=
1
11
1
1)()()(
iiak
i
kP
i≥− ∑∑
+
=
−+
=
1
1
1
1)(
ii )(
1∑
17. ELSE (opt TC × )
18. IF tempL )(
19. OUTPUT frame 0),(k a
20. ELSE OUTPUT frame
frame
kPk
i
T
iiLBufferka
))((),(
1
1∑
−+
=
+i
a )(1
∑=
−
21. END IF 22. END IF 23. UNTIL k=N 24. END Function
Given the client buffer size, bit rate, and video delay
constraint, we next show that the CBEVT algorithm is most energy efficient. In the CBEVT algorithm, if a(P+k) is smaller

IEEE Transactions on Vehicular Technology VT_2007_00627
8
than the optimal data rate , and there is a sufficient number of video frames in the client buffer to continue video playback for (temp+1) time slots, we set a(P+k)=0 and idle the transmitter for one or more time slots until the following video frames can be delivered at the optimal data rate. The question is: can we guarantee that the frames will be delivered at the optimal data rate even after the idling?
soptopt RbC ×=
Inequality (11) shows that the optimal data rate is related to the client buffer size. We proceed to find the necessary client buffer size which guarantees that the transmitter can work at the optimal data rate after idling. Suppose that at the (P+k)th time
slot, both the constraints (i) and (ii)
are satisfied. Then,
we can set a(P+k)=0. Thus,
tempiLkPAk
i≥−−+ ∑
+
=
1
1)()1(
frameopt TC ×+)k
ikPAiLbuffer −+≤+ ∑
=
1()(1
frameopt
k
i
k
iTCkPAiLbufferkPAiL ×+−+≤+≤+−+≤ ∑∑
=
+
=
)1()(0)1()(1
1
1
. (12)
At the next time slot (P+k+1), if the constraints and
(Here A(P+k)=A(P+k-1), since a(P+k)=0.) are still true, we can set a(P+k+1)=0. This step can be repeated until the constraints are violated. Let us assume that the two constraints are violated at the (P+k+n)th ( ) time slot. If the transmission data rate at the (P+k+n)th time slot is not the optimal rate Copt, we have one of the two cases:
tempiLkPAk
i≥−+ ∑
+
=
2
1)()( frameopt
k
iTCkPAiLbuffer ×++≤+ ∑
+
=
)()(1
1
1≥n
Case 1: The amount of consumed data is larger than the
amount of data transmitted with the optimal rate Copt, i.e.,
∑++
=
1
1)(
nk
iiL
∑++
=
≤×+−++1
1)()1(
nk
iframeopt iLTCnkPA . (13)
Since a(P+k)= a(P+k+1)=…=a(P+k+n-1)=0, we have frameopt TCkPA ×++= )(
∑=
+≥k
iiLbuffer
1)(...
)1( +++×+< nkLTCtemp frameopt
p=0) the maximum frame size, this case can be
e that our CBEVT
s e energy performance of the optimal smoothing algorithm.
inition: B(t) : )}(,)1(n{ NDbuffertD
frameoptframeopt TCnkPATCnkPA =×+−++=×+−++ ...)2()1(
∑+
=
≥+≥×+−+=nk
iframeopt iLbufferTCkPA
1)()1(
∑∑++
=
+
=
≤+1
11)()(
nk
i
nk
iiLiLbuffer
)1( ++≤ nkLbuffer
∑+
=
+≥×+−++nk
iframeopt iLbufferTCnkPA
1)()1(
iLnkPAnk
i−−++ ∑
++
=
1
1()1(
nkPA −++ )1(
. Combined with inequality (13), we
have . So,
. (14) We thus conclude that if inequality (13) holds, then (14) holds. Thus, if we set the client buffer size larger than the maximum frame size, this case can be avoided. Case 2: The client buffer is overflowing if the transmission data rate is the optimal rate, i.e.
(15)
Here, the constraint must be
false, else a(P+k+n)=0. So, ,
which implies
temp≥)
iLnk
i< ∑
++
=
1
1( temp+)
∑∑∑+
=
++
=
+
=
−×++<−×+−++≤nk
iframeopt
nk
i
nk
iframeopt iLTCtempiLiLTCnkPAbuffer
1
1
11)()()()1(
Thus, buffer .
(16) We thus conclude that if inequality (15) holds, then (16) also holds. Thus, if the client buffer size is larger than two times with (temavoided. From the analysis of the two cases, we see that if the client buffer size is larger than twice the maximum frame size, then the data can be transmitted with the optimal modulation level bopt while avoiding starvation and buffer overflow. Since transmission at the optimal modulation level corresponds to the minimal energy consumption, we concludalgorithm minimizes energy consumption.
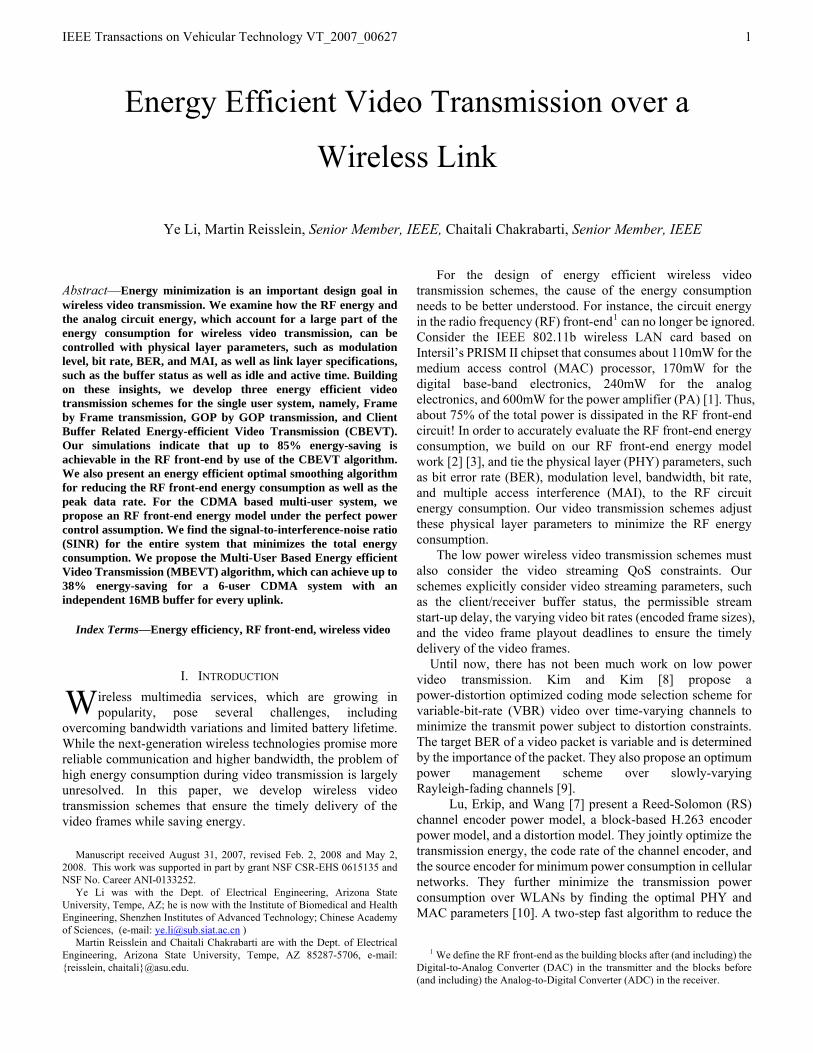
D. Energy Efficient Optimal Smoothing Algorithm Although the CBEVT algorithm is guaranteed to be energy
efficient, it has a relatively high peak data rate and requires a large buffer. This may be unsuitable in narrow band communication systems with small client buffers. To reduce the peak bandwidth, the optimal smoothing algorithm has been proposed in [14]. The optimal smoothing algorithm reduces the peak data rate in video transmission and avoids the overflow and starvation in the client buffer. In this section, we propose an energy efficient optimal smoothing algorithm which improveth Algorithm Parameter Def
In this algorithm: mi)(tB +−
Cmax: M interval [t , t2],
Cmin: M interval [t1,t2],
tB : Went buffer
t buffer
r, L(t), D(t), a(t), A(t),
ensures that the rate change is as small as po
=for t=2,…, N, B(1)=Buffer. aximum transmission rate over a given 1without overflowing the client buffer. inimum transmission rate over a givenwithout starvation of the client buffer. hen the transmitter sends at rate Cmax over time interval [t1, t2], tB is the latest time when the clibecomes full for initial buffer occupancy q. hen the transmitter sends at rate Cmin over time interval [t1, t2], tD is the latest time when the clien
tD : W
becomes empty for initial buffer occupancy q. The other parameters, such as N, Buffeand Copt are the same as in Section 3.3. The optimal smoothing algorithm in [14] relies on two insights: first, since CBR (constant bit rate) transmission is as smooth as possible, the smoothing algorithm must make the CBR transmission segments as long as possible; second, if the client buffer is close to overflowing or starvation, the transmission rate (Cmax and Cmin) must be changed as early as possible, which
ssible. Now if the energy consumption is also considered in the
optimal smoothing algorithm, then we select the data rate in the range of [Cmin, Cmax], which minimizes the energy consumption. From Fig. 3, we find that if Copt is between Cmax and Cmin, the video segment can be transmitted at Copt resulting in the minimum RF energy; if Copt is larger than Cmax, the video
IEEE Transactions on Vehicular Technology VT_2007_00627
9
n is minimized while e buffer neither overflows nor starves.
Energy orithm: Function:
q=0; Cmax=Buffer, tB=1, Cmin=L(1), tD=1
1* += ee t
4. IF
segment has to be transmitted at Cmax to avoid client buffer overflow; if Copt is smaller than Cmin, the video segment transmission rate is Cmin to avoid client buffer starvation. This ensures that the total energy consumptioth
efficient optimal smoothing algfind optimal schedule (a(t), Buffer)
1. ts=0, te=1,2. Repeat
3. Set t
se
se
ttqtDtD
C−
+−< *
*
max))(()(
, end segment at tB:
T segment
5. IF minmax CCC opt ≥≥
6. OUTPU opts CtBt ,−
UT segm
7. ELSE IF minmax optimalCCC ≥≥
8. OUTP ent m,Ctt sB − in
UT segment
9. ELSE ( maxopt ≥≥ ) minCCC
10. OUTP max,Ctt sB −
11. END IF 12. Start ne , te= tB+1, q=B(tB) – D(tB) w segment at t : t = t
13. ELSE IF
B S B
se
se
ttqtDtB
C−
+−> *
*
min))(()(
, OR , end
:
UT segm t
Nte =*
segment at tD
14. IF minmax CCC opt ≥≥
15. OUTP en optsD Ctt ,−
UT segm
16. ELSE IF CC ≥ minmax optC≥
17. OUTP ent min,Ctt sD −
UT segment
18. ELSE ( minmaxCCopt ≥ ) C≥
19. OUTP max,Ctt sD −
20. END IF 21. Start new segment at tB: ts= tD, te= tD+1, q=0
x, tB, Cmin and tD over [tS, te]
27 END Function.
22. ELSE
23. Set *ee tt =
24. END IF 25. ma
26. UNTIL tS=N Compute C
. The energy efficient optimal smoothing algorithm considers
the effect of the transmitter energy consumption, the peak data rate, the client buffer status, and the queuing delay. It is a comprehensive energy efficient algorithm.
Table 4 Characteri e d ulstics of th video use in the sim ation.
Stream 1 Stream 2 Stream 3 Stream 4 I-P-B Quant. Scale 30-30-30 0 4 04 06-08-1 04-04-0 04-04-Peak-to-Mean Ratio 8.42 14.22 11.7 4.78 Mean Bit Rate (Mbps) 0.0588 0.1231 0.2696 4
1.7498 3.156 8.0 1.67
Peak Bit Rate (Mbps) 0.4951
E. Performance Comparison In the section, we compare Baseline transmission, Frame by
Frame transmission (Section 3.1), GOP by GOP transmission
(Section 3.2), the CBEVT algorithm (Section 3.3), the Smoothing algorithm (Section 3.4), and the Energy efficient optimal smoothing algorithm (Section 3.4) with respect to the data rate peak-to-mean ratio, standard deviation of the data rate, receiving energy per bit, transmission energy per bit, and total energy consumption per bit. We simulate the transmission schemes with three 30-minute VBR MPEG-4 QCIF format encodings from the movie Terminator 1 and one CIF encoding from the movie Jurrassic Park I. The video streams with a range of bit rates are available at http://trace.eas.asu.edu and their properties are summarized in Table 4. The system parameters are the same as Table 2. We run many independent replications of each simulation with random start points in the video streams until the 99% confidence level is less than 10% of th
tions are achieved by further increasing the receiver buffer.
e corresponding sample mean. In the simulations reported in Tables 5 and 6, we compare
the performance for Streams 2 and 4 for different buffer sizes for a start-up delay of P = 2 frames. From simulations with different P we found that increasing P slightly reduces the peak-to-mean ratio and standard deviation, while not significantly changing the energy performance from the results reported in the following for P = 2. Table 5 shows that the CBEVT algorithm achieves the best performance with energy savings of up to 51% compared to the baseline transmission for Stream 2 when the buffer size is 16 MB, and from Table 6 we observe energy savings up to 85% for Stream 4 with a buffer size of 64 MB. We also see that the CBEVT energy performance improves with increasing buffer size. More specifically, we observe from Table 5 that for a stream with a low bit rate (relative to Copt=2Mbps), for a small buffer, the energy saving comes mainly from the transmission energy component, while for large buffer sizes, the savings comes mainly from the receiving energy component. For instance, when the buffer size is 128KB, 92% of the energy saving comes from the transmission component and only 7.8% from the receiving component. When the buffer size increases to 16MB, the transmission savings component, which stays constant for growing buffer sizes, is 9.2% and the receiving component is 91%. These observations can be explained by two main facts. First, the considered common client buffers are sufficiently large to allow the transmission of essentially all video frames of the low bit rate stream at the optimal data rate Copt according to inequality (11). Second, since Copt=2Mbps is larger than the average bit rate of Stream 2, transmission at Copt prefetches video frames into the receiver buffer until it is completely filled and the left inequality in (11) is violated. The larger the receiver buffer capacity, the sooner all frames of the 30-min video stream can be prefetched, i.e., the shorter the active time. Hence, a large buffer reduces, the receive energy consumption in the transceiver by completing the transmission of the entire video in less time. Further increases in the buffer size will further reduce the receive energy consumption. When the receive buffer can hold essentially the entire video, then no further receive energy reduc

IEEE Transactions on Vehicular Technology VT_2007_00627
10
Table 5 Performance comparison for different video transmission schemes for Stream 2 with different client buffer size; distance is 25m, start-up delay is P = 2 time slots. Confidence level is 99%.
Stream 2 Peak to Mean Ratio
Std Dev of Data Rate
Receiving Energy per Bit (J)
Transmission Energy per Bit (J)
Total Energy per Bit (J)
Buffer Size = 128 KB
Baseline 14.22 1.33 9.10e-7 1.4e-7 1.05e-6 Frame by Frame 14.92 14.88 9.10e-7 1.0e-7 1.01e-6 GOP by GOP 14.92 14.80 9.10e-7 0.90e-7 1.00e-6 Smoothing 2.74 0.27 9.10e-7 1.3e-7 1.04e-6 En. eff. opt. sm. 2.76 0.28 9.10e-7 1.2e-7 1.03e-6 CBEVT 14.81 3.72 9.06e-7 0.93e-7 9.99e-7
Buffer Size = 512 KB
Smoothing 1.28 0.15 9.10e-7 1.3e-7 1.03e-6 En.. eff. opt. sm. 1.31 0.18 9.10e-7 1.2e-7 1.03e-6 CBEVT 14.64 3.65 8.91e-7 0.92e-7 9.83e-7
Buffer Size = 2 MB
Smoothing 1.12 0.11 9.10e-7 1.3e-7 1.04e-6 En.. eff. opt. sm. 1.13 0.11 9.10e-7 1.2e-7 1.03e-6 CBEVT 13.74 3.41 8.38e-7 0.90e-7 9.28e-7
Buffer Size = 4 MB
Smoothing 1.05 0.11 9.10e-7 1.3e-7 1.03e-6 En.. eff. opt. sm. 1.05 0.11 9.10e-7 1.2e-7 1.03e-6 CBEVT 12.48 3.07 7.61e-7 0.90e-7 8.51e-7
Buffer Size = 16 MB
Smoothing 1.02 0.10 9.10e-7 1.3e-7 1.04e-6 En.. eff. opt. sm. 1.03 0.11 9.10e-7 1.2e-7 1.03e-6 CBEVT 7.01 1.64 4.20e-7 0.90e-7 5.11e-7
Table 6 Performance comparison for different video transmission schemes for Stream 4 with different client buffer size; distance is 25m, start-up delay is P = 2 time slots. Confidence level is 99%.
Stream 4 Peak to Mean Ratio
Std Dev of Data Rate
Receiving Energy per Bit (J)
Transmission Energy per Bit (J)
Total Energy per Bit (J)
Buffer Size = 512 KB
Baseline 4.78 0.96 7.21e-8 9.38e-7 1.01e-6 Frame by Frame 4.78 1.28 7.21e-8 2.17e-7 2.89e-7 GOP by GOP 4.73 0.95 7.21e-8 1.47e-7 2.19e-7 Smoothing 4.62 0.48 7.21e-8 1.53e-7 2.25e-7 En.. eff. opt. sm. 4.62 0.50 7.21e-8 1.50e-7 2.22e-7 CBEVT 4.72 0.73 7.20e-8 1.41e-7 2.13e-7
Buffer Size = 2 MB
Smoothing 4.15 0.39 7.21e-8 1.26e-7 1.98e-7 En.. eff. opt. sm. 4.15 0.40 7.21e-8 1.24e-7 1.96e-7 CBEVT 4.70 0.65 7.17e-8 1.19e-7 1.91e-7
Buffer Size = 4 MB
Smoothing 3.51 0.29 7.21e-8 1.12e-7 1.84e-7
En.. eff. opt. sm. 3.51 0.30 7.21e-8 1.11e-7 1.83e-7
CBEVT 4.66 0.54 7.11e-8 1.09e-7 1.80e-7 Buffer Size = 16 MB
Smoothing 2.13 0.09 7.21e-8 1.01e-7 1.73e-7
En.. eff. opt. sm. 2.13 0.10 7.21e-8 1.00e-7 1.72e-7
CBEVT 3.43 0.32 6.96e-8 9.24e-8 1.62e-7
Buffer Size = 32 MB
Smoothing 1.84 0.10 7.21e-8 9.89e-8 1.71e-7
En.. eff. opt. sm. 1.84 0.10 7.21e-8 9.69e-8 1.69e-7
CBEVT 2.67 0.25 6.51e-8 9.24e-8 1.58e-7
Buffer Size = 64 MB
Smoothing 1.37 0.07 7.21e-8 9.69e-8 1.69e-7
En.. eff. opt. sm. 1.37 0.08 7.21e-8 9.59e-8 1.68e-7 CBEVT 1.02 0.22 6.16e-8 9.24e-8 1.54e-7
Turning to the higher bit rate Stream 4, we observe from
Table 6 that for small buffer sizes, the energy savings are mainly due to reduced transmission energy. With growing buffer size, the transmission energy further decreases while the reception energy also decreases. For this higher bit rate stream, larger buffers allow more transmissions at Copt.; resulting in the drop of the transmission energy to 9.24e-8 J
per bit for a 16 MB buffer. Further increases in the buffer size do not result in further transmission energy reductions since essentially all transmissions are at Copt for the 16 MB buffer. On the other hand, the reception energy continues to drop for increasing buffer sizes as larger buffer sizes decrease instances of stalling.

IEEE Transactions on Vehicular Technology VT_2007_00627
11
Table 7 Performance comparisons for different video streams with 16 MB client buffer; distance is 25m, start-up delay is P = 2 time slots. Confidence level is 99%.
Buffer Size = 16 MB Peak to Mean Ratio
Std Dev of Data Rate
Receiving Energy per Bit (J)
Transmission Energy per Bit (J)
Total Energy per Bit (J)
Stream 1
Baseline 8.42 0.70 1.98e-6 1.4e-7 2.12e-6
Frame by Frame 32.46 32.44 1.98e-6 0.90e-7 2.07e-6 GOP by GOP 32.46 32.44 1.98e-6 0.90e-7 2.07e-6 Smoothing 1.55 0.07 1.98e-6 1.3e-7 2.11e-6 En. eff. opt. sm. 1.57 0.08 1.98e-6 1.1e-7 2.09e-6 CBEVT 1.00 0.08 6.11e-8 0.90e-7 1.51 e-7
Stream 2
Baseline 14.22 1.33 9.10e-7 1.4e-7 1.05e-6 Frame by Frame 14.92 14.88 9.10e-7 1.0e-7 1.01e-6 GOP by GOP 14.92 14.80 9.10e-7 0.90e-7 1.00e-6 Smoothing 1.02 0.10 9.10e-7 1.3e-7 1.04e-6 En. eff. opt. sm. 1.03 0.11 9.10e-7 1.2e-7 1.03e-6 CBEVT 7.01 1.64 4.20e-7 0.90e-7 5.11e-7
Stream 3
Baseline 11.7 0.95 4.10e-7 1.39e-7 5.49e-7 Frame by Frame 10.08 6.64 4.10e-7 0.93e-7 5.03e-7 GOP by GOP 6.72 6.64 4.10e-7 0.92e-7 5.02e-7 Smoothing 1.44 0.11 4.10e-7 1.04e-6 5.41e-7 En. eff. opt. sm. 1.45 0.12 4.10e-7 1.01e-6 5.38e-7 CBEVT 4.99 1.65 3.04e-7 0.90e-7 3.93e-7
Stream 4
Baseline 4.78 0.96 7.21e-8 9.38e-7 1.01e-6 Frame by Frame 4.78 1.28 7.21e-8 2.17e-7 2.89e-7 GOP by GOP 4.73 0.95 7.21e-8 1.47e-7 2.19e-7 Smoothing 2.13 0.09 7.21e-8 1.01e-7 1.73e-7 En. eff. opt. sm. 2.13 0.10 7.21e-8 1.00e-7 1.72e-7 CBEVT 3.43 0.32 6.96e-8 9.24e-8 1.62e-7
The original optimal smoothing algorithm [14] has the
best performance in terms of reducing the video peak-to-mean ratio and standard deviation of the transmission rates. However, its energy saving performance is poor (less than 1%) for the lower bit rate stream, while it gives good energy performance for the higher bit rate stream. This is because the smoothing algorithm [14] was designed to minimize bit rate variations around the average bit rate. If the average bit rate is far from Copt , transmissions according to the smoothed rates require high energy (e.g., for Stream 2), while energy is saved if the average rate is close to Copt (e.g., for Stream 4). The energy efficient optimal smoothing algorithm achieves a mild improvement in energy performance (saves about 2%) over optimal smoothing by minimizing the transmission energy while achieving essentially the same rate smoothing as optimal smoothing.
For Stream 2, we observe from Table 5 that Frame by Frame and GoP by GoP transmission save around 4% energy compared with the baseline transmission but have high peak-to-mean ratios, which are only slightly smaller for GOP by GOP transmission. Note that for Stream 2 with peak rate below Copt , Frame by Frame and GOP by GOP transmission accelerate the data rate to Copt , thereby increasing the peak-to-mean ratio and standard deviation of the transmission rate compared to the baseline transmission. Since all frame data is transmitted at the optimal data rate, the transmission energies of Frame by Frame, GoP by GoP, and CBEVT transmission are, within the statistical reliability of the simulation, the same. However, Frame by Frame and GoP by GoP transmission have
the same receiving energy as baseline transmission. Note that in Tables 5 and 6, we report results for Baseline, Frame by Frame, and GOP by GOP transmission only for the smallest buffer sizes which are large enough to accommodate the maximum GOP size, which is about 81 KB for Stream 2 and 391 KB for Stream 4.
For the higher rate Stream 4, we observe from Table 6 that Frame by Frame and GoP by GoP transmission significantly reduce the transmission energy compared to baseline transmission, but they do not achieve the low transmission energies that the smoothing schemes and CBEVT reach for large buffers. The transmission energy savings of Frame by Frame and GoP by GoP transmission come from speeding up the transmission of frames smaller than Copt x Tframe so they are transmitted at Copt within less than one frame period, and analogously for GoPs. Frames that are larger than Copt x Tframe are transmitted at a rate higher than Copt to complete transmission within one frame period. These higher rate transmissions are to a large degree avoided by the smoothing and CBVET schemes.
Next, we evaluate the effect of different data rates by considering the four representative video streams. The simulation results are shown in Table 7. We observe that with increasing data rate (from Stream 1 to Stream 4), the total RF energy consumption per bit decreases. More specifically, we observe significant drops in the receiving energy for all transmission strategies, including baseline transmission. The reason for this decreasing receive energy consumption with higher stream bit rates is that within approximately the same

IEEE Transactions on Vehicular Technology VT_2007_00627
12
active time, more bits are received, resulting in a lower receiving energy per bit.
The CBEVT algorithm has superior energy performance for all four streams. The peak-to- mean ratio of CBEVT for Stream 1 is equal to 1. This is because the client buffer is large enough to hold the entire video and thus all the frames are transmitted continuously at the optimal data rate Copt. With increasing video data rate, the peak-to-mean ratio of GOP by GOP transmission decreases more compared to Frame by Frame transmission. For example, for Stream 3, GOP by GOP transmission reduces the peak-to-mean ratio by 42.6% while Frame by Frame transmission reduces it by about 13.9%. This is because the GOP by GOP scheme considers 12 frames as a unit and the large frame sizes (high data rates) are balanced by the small frames in the same GOP.
IV. ENERGY EFFICIENT VIDEO TRANSMISSION FOR CDMA BASED MUTI-USER SYSTEM
In this section, we first describe an improved RF front-end energy model which considers multiple-access interference (MAI). Then, we propose the multi-user based energy efficient video transmission algorithm (MBEVT) and evaluate its energy and quality performance. We consider a single cell of a CDMA based multi-user wireless system with perfect power control, orthogonal PN sequences for the different users, and M-QAM modulation; as these are likely characteristics of future metropolitan-scale Wi-Fi networks.
A. RF front-End Energy Model in Multi-User Systems In the single user system considered in the previous section,
the transmitter energy consumption is evaluated for a constant BER of 10-3. Thus, the communication quality is fixed. If the channel Gaussian noise power is constant in one time slot, the detected power Pdetected must be changed with the modulation level b to maintain the BER. Thus, in the single user system, the SNR varies with the modulation level b. However, in CDMA based multi-user systems with perfect power control, the power control ensures that the signal to interference noise ratio (SINR) for every wireless uplink is the same. (Here the signal suffers from interference due to both Gaussian noise and MAI.) Consequently, the BERs vary with the modulation level b and the method derived for the single user system cannot be directly used in multi-user systems. Thus, the transmitter energy model must be adjusted for the multi-user system with fixed SINR. Recall that the SINR is defined as
MAIW
ected
NANPASINR
⋅+⋅
= det ,
where A is the attenuation factor, which is constant during a frame time in the slow fading channel, Nw ~ (0, N0/2) is the Gaussian noise in the AWGN channel, and NMAI ~
(0, )4
1(2
1 α−⋅
⋅−
aveEPN
S ) is the multiple-access interference which
is typically approximated by a Gaussian distribution [23] [24]. Here, S is the number of users in the cell, PN is the length of the pseudo noise sequence, Eave is the average signal energy per symbol, and α is the roll-off factor of the raised cosine pulse-shaping filter. After the signal passes through the pulse
shaping filter, the bandwidth increases to
)1(21 α+⋅⋅= sRBW [25]. For perfect power control, the
power level of every user is equal. Thus,
)1()4
1(2
1)4
1(1det0
det
0
det
ααα+⋅−⋅
⋅−
⋅+⋅
⋅=
⋅−⋅−
⋅+⋅
⋅=
ected
ected
ave
ected
PPN
SABWN
PA
BWEPNSABWN
PASINR (17)
Hence,
)1)(25.01()1(2)1(2 0
det αα⋅ ⋅⋅⋅⋅ α
+−⋅⋅⋅−−⋅⋅=
SINRASPNARNPNSINRP s
ected+
. From the equations above, the transmitter energy consumption for a single bit is given by:
)(16101071)( det2
223
bPARPRbKGG
LdRbRb
PPE ectedstrss
RFPAbit ⋅⋅⋅⋅
⋅⋅⋅+
⋅×
=⋅
⋅+=−
λπ
)12(
)12(3))1)(25.01()1(2(
)1(32101072
2
20
223
+
−⋅⋅
+−⋅⋅−−⋅⋅⋅⋅⋅
+⋅⋅⋅⋅⋅⋅⋅⋅⋅+
⋅×
= −−
b
b
tr
offrollC
s SINRSPNAbKGGNPNSINRPARPARLd
Rb ααλ
απ
(18)
2 3 4 5 6 7
10x 10-8
81
2
3
4
5
6
7
8
9
Number of bits per symbol (b=logM)
Ene
rgy
per b
it (J
)SINR = 5dBSINR = 10dBSINR = 15dBSINR = 18dBSINR = 20dB
Fig. 5 Energy per bit for different modulation level b under different SINR: Number of users is S=15, d=3 m.
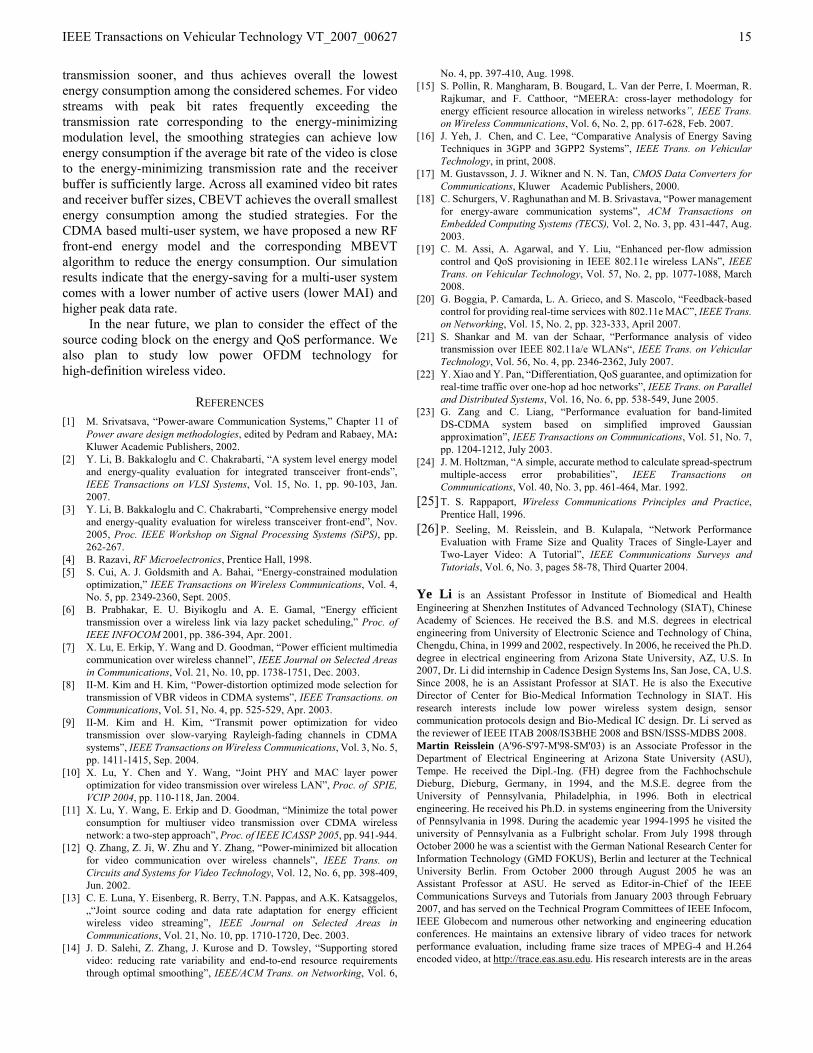
The relation between energy per bit and modulation level b for a given SINR is illustrated in Fig. 5. For a given SINR, the energy per bit decreases as the modulation level b increases. Thus, for low power video transmission, a high data rate (large modulation level) is preferred. Reducing the SINR in the single cell system is also a good way to decrease the transmitter energy consumption. While Fig. 5 shows the relation when the distance d = 3 m, the trend is similar for other values of d. Note that the trend is different in Fig.3. This is because the BER is a variable in Fig. 5 (compared to constant BER in Fig. 3) and the SINR is a constant. For the same SINR, a higher modulation level results in lower energy consumption per bit.
B. SINR and BER in a Multi-User System In a CDMA based multi-user communication system, the
BER is not constant since the modulation level is adaptive and the data rate is scalable. However, the BER value must be smaller than a pre-set threshold to guarantee that forward error control can correct the errors and avoid the re-transmission of

IEEE Transactions on Vehicular Technology VT_2007_00627
13
video frames. In this section, we assume that the BER must be equal or smaller than 10-3, i.e.,
3
210
)12(3
2
114 −≤⎟⎟⎠
⎞⎜⎜⎝
⎛
−⋅
⋅⎟⎟⎠
⎞⎜⎜⎝
⎛−⋅= bb
SINRQb
BER . (19)
From (19) [25], we can generate the curves for BER vs modulation level b for different SINR, as shown in Fig. 6. Once the BER constraint is known, we can use Fig. 5 and Fig. 6 to determine the optimal combination of (b, SINR) corresponding to the lowest transmission energy. For example, if the BER constraint is 10-3, from Fig. 6, the (b, SINR) combinations that satisfy the BER requirement are (2, 10dB), (2, 15dB), (2, 18dB), (2, 20dB), (3, 15dB), (3, 18dB), (3, 20dB), (4, 18dB), (4, 20dB), and (5, 20dB). For those combinations, we use Fig. 5 to find that the combination (4, 18dB) is the most energy efficient configuration when the distance is d = 3 m.
The above method can be generalized for finding the most energy efficient combination of (b, SINR) for a given distance d. We first utilize (19) with the BER threshold 10-3 to obtain
2
31
21 10
211
41)12(
31
⎟⎟
⎠
⎞
⎜⎜
⎝
⎛
⎟⎟⎠
⎞⎜⎜⎝
⎛⋅⋅⎟
⎠⎞
⎜⎝⎛ −⋅−≥ −
−− bQSINR
bb (20)
From (20), we can generate Table 8 which shows the value of the minimum SINR for a given modulation level b. Intuitively, as the modulation level of the transmitter increases (the data rate increases), the receiver is more sensitive to the channel noise and the MAI. So the minimum SINR must increase to maintain the required BER. This has also been graphically shown in Fig. 6. The combinations of (b, SINR) in Table 8 are the candidates for the optimal configuration. Note that the optimal combination of (b, SINR) varies with the distance d.
2 3 4 5 6 7 810-6
10-5
10-4
10-3
10-2
10-1
Number of bits per symbol (b=logM)
Bit E
rror R
ate
SINR = 5dBSINR = 10dBSINR = 15dBSINR = 18dBSINR = 20dB
Fig. 6 Bit error rate for different modulation level b under different SINR; Number of users in the cell is 15.
In order to find the configuration with minimum Ebit for given d, we compute Ebit for every combination of (b, SINR) (in Table 8) using (18) and choose the configuration with the minimum Ebit. In a multi-user scenario, every user in the cell is likely to be
at a different distance from the base station. However, perfect power control in the CDMA system ensures that the SINR in every link is always kept the same. Since the optimal
combination of (b, SINR) for every user varies with the distance, the optimal combination of (b, SINR) for the entire cell must be evaluated and chosen from all the possible (b, SINR) combinations. We determine the optimal combination of (b, SINR) for the cell as the minimum sum of Ebit over all users.
Suppose S is the number of users in the cell and (bopt_i, SINRopt_i) is the optimal combination for user i (i= 1,2,…,S) with distance di. Define Ei,j as the energy consumption of user j if the operating parameters are (bopt_i, SINRopt_i). Then the optimal combination of (bopt, SINRopt) for the entire system corresponds to . ∑
=
S
jjii
E1
, )(min
Table 8 Minimum SINR for different modulation levels b, . 310−≤BER
b
2
3
4
5
6
7
8
SINR(dB)
9.8
13.4
16.5
19.6
22.5
25.5
28.4
C. Multi-User Based Energy Efficient Video Transmission (MBEVT) Algorithm
From Sections 4.1 and 4.2, we find that once the optimal SINR is determined in the CDMA system, a higher modulation level b (higher data rate) results in lower transmitter energy consumption. Furthermore, with a higher data rate, the video transmission finishes earlier, resulting in the transceiver staying in the sleep mode and thereby saving energy. However, the transmission data rate must be considered along with the buffer occupancy in the client and the BER threshold. If the data rate (modulation level) is too high, the client buffer may overflow and the BER may exceed the threshold.
If the number of the active users in the cell is smaller, the MAI is smaller and, thus, the transmission power needed to maintain the pre-set SINR is lower. If the client buffer has enough frames to continue playback for the following time slots, the transmitter can be suspended until the client buffer occupancy drops. As a result, the number of active users (or MAI) in the cell decreases, and the energy consumed by the active transmitters also decreases.
Next, we develop the MBEVT algorithm which strives to reduce the energy consumption by transmitting at a high data rate and putting the transmitter into an idle mode, thereby reducing the number of active users. The basic idea of the algorithm is that the video frames are transmitted at the maximum possible data rate (modulation level b) that satisfies the BER constraint and the buffer starvation and overflow
constraints . Here, we
set the start-up delay to P = 1 time slot and all the parameter definitions are the same as before. We consider the following threshold policy: if the amount of data in the client buffer reaches th of its capacity, the transmitter suspends until the client buffer occupancy is less than tl of the buffer capacity. The thresholds (th, tl) can be adjusted according to the client buffer size. For the numerical examples in this paper, we set th=0.8
∑∑∑−
=
−
==
+≤+≤1
1
1
11)()()()(
k
i
k
i
k
iiLbufferkaiaiL
IEEE Transactions on Vehicular Technology VT_2007_00627
14
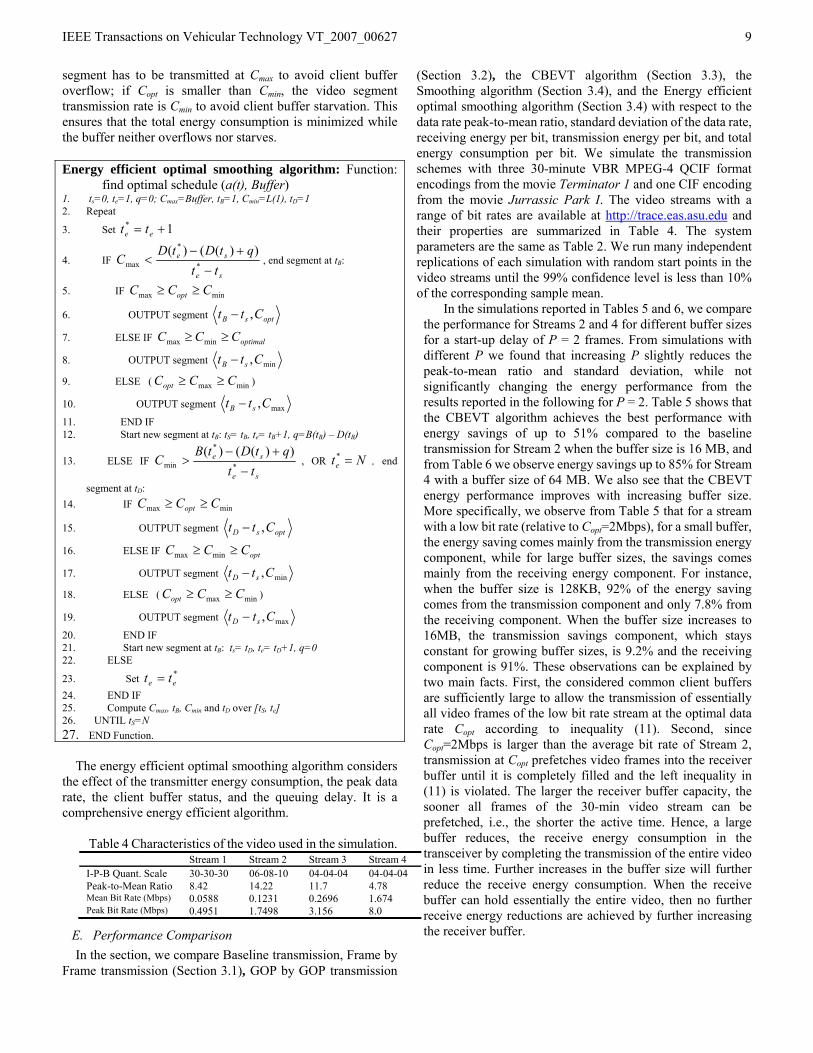
and tl=0.2. Determining the optimal threshold criterion is left for future work. Table 9 MBEVT algorithm performance comparisons for different buffer size; Ebit is the average energy consumption for the 6 users; Peak-to-mean ratio is the maximum value for the 6 users; Baseline scheme is the same as in Section 3.5 and the 6 users employ the baseline scheme independently.
Buffer 128KB 256KB 512KB 1MB 2MB 4MB 8MB 16MB Baseline
Ebit(e-7J) 8.82 8.81 8.76 8.73 8.45 7.92 7.88 6.26 10.08 Max Peak to Mean Ratio
22.36 22.35 22.30 22.28 22.13 21.93 20.71 17.49 14.22
Active num of users
4.94 4.95 4.96 4.96 4.98 5.06 5.06 5.25 6
MBEVT function: find optimal schedule (a(t), buffer) 1. Check Table 8 for the combination of (bi, SINRi) 2. For i=1:S /* Number of users in the system 3. For j=1:7 /* 7 is the number of possible b values, ].2 8,[∈b 4. Ebit (i, j)=f(bj, SINRj, di) 5. end 6. Ebit_opt(i)=min{Ebit (i, :)}; Find corresponding (bi_opt, SINRi_opt) 7. end 8. For i=1:S 9. For j=1:S 10. Etemp(i, j) = f(bi_opt, SINRi_opt, dj) 11. end 12. E(i)=sum(Etemp(i, :)) 13. end 14. Eopt=min(E(:)); Find corresponding Eopt => (bopt, SINRopt)
15. sopt ×;
3−× opt RbC = sec1033=frameT
∑=
−
=
−=k
i
kkjai
1
1
1),()(
16. For i=1:N 17. For j=1:S
18. ∑i
kjL ),( buffer_mainRe
19. if ( buffert ) ibuffermain h ×≥)(_Re20. Repeat 21. OUTPUT frame 0),,( ija
22. i=i+1 23. End until ( buffertl × ) ibuffermain ≤)(_Re
),(,),(1
1
1
1frameopt
i
k
i
kTCkjakjL ⋅+∑∑
−
=
−
=
24. Else if
} min{),(),(1
1
i
kbufferijakja +≤+∑
−
=
25. OUTPUT frame
},),(),(min{),,(1
1
1
1frameopt
i
k
i
kTCkjakjLbufferija ⋅−+ ∑∑
−
=
−
=
26. end if 27. End 28. End 29. END Function
To evaluate the performance of the MBEVT algorithm, we simulate a CDMA based multi-user wireless environment. The number of users in the cell is S=6. Every user starts the video transmission at randomly chosen video frames. The mobile users are located randomly in the cell and the average distance is about 17 m. Since we use M-QAM modulation for the video transmission, which is susceptible to interference, a 2047 long PN sequence is adopted. The other simulation parameters and video traces [26] are the same as before (Tables 1 and 2). We use Stream 2 since it has a data rate that is comparable with
today’s typical wireless transmission speeds. We run enough independent replication so that our simulation data has a confidence level of 90% that is less than 10% of the sample mean.
Table 9 shows that the MBEVT algorithm reduces the energy consumption and the average active number of users in the cell while increasing the peak-to-mean ratio compared with the baseline scheme. The average energy consumption and the maximum peak-to-mean ratio decrease with increasing buffer size. For instance, if the client buffer size increases from 128KB to 16MB, the energy saving increases from 12.5% to 37.9%. If we have a larger buffer size, the transmitter can operate at a higher data rate and this increases the possibilities for the transmitter to work at the system optimal data rate. Furthermore, since the peak data rate is always constrained by the BER requirement and is independent of the buffer size, a higher average data rate results in a lower video transmission peak-to-mean ratio. However, with the increase in the client buffer size, the average number of active users in the cell also increases. This can be explained by the fact that the buffer occupancy threshold (th=0.8 in our simulation), is harder to reach due to the larger buffer size. Although the total transmission time is reduced, a slightly larger number of mobile users are active in the same time slot and the MAI increases mildly. From the above analysis, we conclude that the effect of a higher data rate is larger for energy saving than the minor increase of the average active number of users in the cell (higher MAI).
V. CONCLUSION We have presented multiple energy-efficient transmission
schemes for pre-recorded continuous media, such as streaming video and audio, in single-user and multi-user systems. The energy-efficiency is obtained by adjusting parameters in the physical layer and MAC layer. For a single user system, we have presented three energy-efficient schemes, namely, Frame by Frame transmission, GOP by GOP transmission, and the CBEVT. We have also presented a modified version of the optimal smoothing algorithm to reduce both the peak data rate and the RF front-end energy consumption. Simulation results indicate that for video streams with bit rates below the transmission rate corresponding to the energy-minimizing modulation level, Frame by Frame transmission, GoP by GoP transmission, and CBEVT achieve the minimum transmission energy consumption. In addition, CBEVT reduces the reception energy consumption by completing the video
IEEE Transactions on Vehicular Technology VT_2007_00627
15
transmission sooner, and thus achieves overall the lowest energy consumption among the considered schemes. For video streams with peak bit rates frequently exceeding the transmission rate corresponding to the energy-minimizing modulation level, the smoothing strategies can achieve low energy consumption if the average bit rate of the video is close to the energy-minimizing transmission rate and the receiver buffer is sufficiently large. Across all examined video bit rates and receiver buffer sizes, CBEVT achieves the overall smallest energy consumption among the studied strategies. For the CDMA based multi-user system, we have proposed a new RF front-end energy model and the corresponding MBEVT algorithm to reduce the energy consumption. Our simulation results indicate that the energy-saving for a multi-user system comes with a lower number of active users (lower MAI) and higher peak data rate.
In the near future, we plan to consider the effect of the source coding block on the energy and QoS performance. We also plan to study low power OFDM technology for high-definition wireless video.
REFERENCES [1] M. Srivatsava, “Power-aware Communication Systems,” Chapter 11 of
Power aware design methodologies, edited by Pedram and Rabaey, MA: Kluwer Academic Publishers, 2002.
[2] Y. Li, B. Bakkaloglu and C. Chakrabarti, “A system level energy model and energy-quality evaluation for integrated transceiver front-ends”, IEEE Transactions on VLSI Systems, Vol. 15, No. 1, pp. 90-103, Jan. 2007.
[3] Y. Li, B. Bakkaloglu and C. Chakrabarti, “Comprehensive energy model and energy-quality evaluation for wireless transceiver front-end”, Nov. 2005, Proc. IEEE Workshop on Signal Processing Systems (SiPS), pp. 262-267.
[4] B. Razavi, RF Microelectronics, Prentice Hall, 1998. [5] S. Cui, A. J. Goldsmith and A. Bahai, “Energy-constrained modulation
optimization,” IEEE Transactions on Wireless Communications, Vol. 4, No. 5, pp. 2349-2360, Sept. 2005.
[6] B. Prabhakar, E. U. Biyikoglu and A. E. Gamal, “Energy efficient transmission over a wireless link via lazy packet scheduling,” Proc. of IEEE INFOCOM 2001, pp. 386-394, Apr. 2001.
[7] X. Lu, E. Erkip, Y. Wang and D. Goodman, “Power efficient multimedia communication over wireless channel”, IEEE Journal on Selected Areas in Communications, Vol. 21, No. 10, pp. 1738-1751, Dec. 2003.
[8] II-M. Kim and H. Kim, “Power-distortion optimized mode selection for transmission of VBR videos in CDMA systems”, IEEE Transactions. on Communications, Vol. 51, No. 4, pp. 525-529, Apr. 2003.
[9] II-M. Kim and H. Kim, “Transmit power optimization for video transmission over slow-varying Rayleigh-fading channels in CDMA systems”, IEEE Transactions on Wireless Communications, Vol. 3, No. 5, pp. 1411-1415, Sep. 2004.
[10] X. Lu, Y. Chen and Y. Wang, “Joint PHY and MAC layer power optimization for video transmission over wireless LAN”, Proc. of SPIE, VCIP 2004, pp. 110-118, Jan. 2004.
[11] X. Lu, Y. Wang, E. Erkip and D. Goodman, “Minimize the total power consumption for multiuser video transmission over CDMA wireless network: a two-step approach”, Proc. of IEEE ICASSP 2005, pp. 941-944.
[12] Q. Zhang, Z. Ji, W. Zhu and Y. Zhang, “Power-minimized bit allocation for video communication over wireless channels”, IEEE Trans. on Circuits and Systems for Video Technology, Vol. 12, No. 6, pp. 398-409, Jun. 2002.
[13] C. E. Luna, Y. Eisenberg, R. Berry, T.N. Pappas, and A.K. Katsaggelos, „“Joint source coding and data rate adaptation for energy efficient wireless video streaming”, IEEE Journal on Selected Areas in Communications, Vol. 21, No. 10, pp. 1710-1720, Dec. 2003.
[14] J. D. Salehi, Z. Zhang, J. Kurose and D. Towsley, “Supporting stored video: reducing rate variability and end-to-end resource requirements through optimal smoothing”, IEEE/ACM Trans. on Networking, Vol. 6,
No. 4, pp. 397-410, Aug. 1998. [15] S. Pollin, R. Mangharam, B. Bougard, L. Van der Perre, I. Moerman, R.
Rajkumar, and F. Catthoor, “MEERA: cross-layer methodology for energy efficient resource allocation in wireless networks”, IEEE Trans. on Wireless Communications, Vol. 6, No. 2, pp. 617-628, Feb. 2007.
[16] J. Yeh, J. Chen, and C. Lee, “Comparative Analysis of Energy Saving Techniques in 3GPP and 3GPP2 Systems”, IEEE Trans. on Vehicular Technology, in print, 2008.
[17] M. Gustavsson, J. J. Wikner and N. N. Tan, CMOS Data Converters for Communications, Kluwer Academic Publishers, 2000.
[18] C. Schurgers, V. Raghunathan and M. B. Srivastava, “Power management for energy-aware communication systems”, ACM Transactions on Embedded Computing Systems (TECS), Vol. 2, No. 3, pp. 431-447, Aug. 2003.
[19] C. M. Assi, A. Agarwal, and Y. Liu, “Enhanced per-flow admission control and QoS provisioning in IEEE 802.11e wireless LANs”, IEEE Trans. on Vehicular Technology, Vol. 57, No. 2, pp. 1077-1088, March 2008.
[20] G. Boggia, P. Camarda, L. A. Grieco, and S. Mascolo, “Feedback-based control for providing real-time services with 802.11e MAC”, IEEE Trans. on Networking, Vol. 15, No. 2, pp. 323-333, April 2007.
[21] S. Shankar and M. van der Schaar, “Performance analysis of video transmission over IEEE 802.11a/e WLANs“, IEEE Trans. on Vehicular Technology, Vol. 56, No. 4, pp. 2346-2362, July 2007.
[22] Y. Xiao and Y. Pan, “Differentiation, QoS guarantee, and optimization for real-time traffic over one-hop ad hoc networks”, IEEE Trans. on Parallel and Distributed Systems, Vol. 16, No. 6, pp. 538-549, June 2005.
[23] G. Zang and C. Liang, “Performance evaluation for band-limited DS-CDMA system based on simplified improved Gaussian approximation”, IEEE Transactions on Communications, Vol. 51, No. 7, pp. 1204-1212, July 2003.
[24] J. M. Holtzman, “A simple, accurate method to calculate spread-spectrum multiple-access error probabilities”, IEEE Transactions on Communications, Vol. 40, No. 3, pp. 461-464, Mar. 1992.
[25] T. S. Rappaport, Wireless Communications Principles and Practice, Prentice Hall, 1996.
[26] P. Seeling, M. Reisslein, and B. Kulapala, “Network Performance Evaluation with Frame Size and Quality Traces of Single-Layer and Two-Layer Video: A Tutorial”, IEEE Communications Surveys and Tutorials, Vol. 6, No. 3, pages 58-78, Third Quarter 2004.
Ye Li is an Assistant Professor in Institute of Biomedical and Health Engineering at Shenzhen Institutes of Advanced Technology (SIAT), Chinese Academy of Sciences. He received the B.S. and M.S. degrees in electrical engineering from University of Electronic Science and Technology of China, Chengdu, China, in 1999 and 2002, respectively. In 2006, he received the Ph.D. degree in electrical engineering from Arizona State University, AZ, U.S. In 2007, Dr. Li did internship in Cadence Design Systems Ins, San Jose, CA, U.S. Since 2008, he is an Assistant Professor at SIAT. He is also the Executive Director of Center for Bio-Medical Information Technology in SIAT. His research interests include low power wireless system design, sensor communication protocols design and Bio-Medical IC design. Dr. Li served as the reviewer of IEEE ITAB 2008/IS3BHE 2008 and BSN/ISSS-MDBS 2008. Martin Reisslein (A'96-S'97-M'98-SM'03) is an Associate Professor in the Department of Electrical Engineering at Arizona State University (ASU), Tempe. He received the Dipl.-Ing. (FH) degree from the Fachhochschule Dieburg, Dieburg, Germany, in 1994, and the M.S.E. degree from the University of Pennsylvania, Philadelphia, in 1996. Both in electrical engineering. He received his Ph.D. in systems engineering from the University of Pennsylvania in 1998. During the academic year 1994-1995 he visited the university of Pennsylvania as a Fulbright scholar. From July 1998 through October 2000 he was a scientist with the German National Research Center for Information Technology (GMD FOKUS), Berlin and lecturer at the Technical University Berlin. From October 2000 through August 2005 he was an Assistant Professor at ASU. He served as Editor-in-Chief of the IEEE Communications Surveys and Tutorials from January 2003 through February 2007, and has served on the Technical Program Committees of IEEE Infocom, IEEE Globecom and numerous other networking and engineering education conferences. He maintains an extensive library of video traces for network performance evaluation, including frame size traces of MPEG-4 and H.264 encoded video, at http://trace.eas.asu.edu. His research interests are in the areas

IEEE Transactions on Vehicular Technology VT_2007_00627
16
of Internet Quality of Service, video traffic characterization, wireless networking, optical networking, and engineering education. Chaitali Chakrabarti (SM'02) received the B.Tech. degree in electronics and electrical communication engineering from the Indian Institute of Technology, Kharagpur, India, in 1984, and the Ph.D. degree in electrical engineering from the University of Maryland, College Park, in 1990. She is a Professor in the Department of Electrical Engineering, Arizona State University (ASU), Tempe. Her research interests include the areas of low power embedded systems design including memory optimization and compilation, VLSI architectures and algorithms for signal processing, image processing, and communications, and algorithm-architecture codesign.
Dr. Chakrabarti is a recipient of the Research Initiation Award from the National Science Foundation in 1993, a Best Teacher Award from the College of Engineering and Applied Sciences from ASU in 1994, and the Outstanding Educator Award from the IEEE Phoenix Section in 2001. She has served on the program committees of ICASSP, ISCAS, SIPS, HPCA, ISLPED, and DAC. She is an Associate Editor of the IEEE Transactions on VLSI Systems (2007- ) and the Journal of VLSI Signal Processing Systems (1999- ). She served as the Associate Editor of the IEEE Transactions on Signal Processing (1999-2004) and the TC Chair of the sub-committee on Design and Implementation of Signal Processing Systems, IEEE Signal Processing Society (2006-2007).