energy evaluation and optimal design of semi-transparent ... · chinese design standard for energy...
TRANSCRIPT

Energy Evaluation and Optimal Design of
Semi-transparent Photovoltaic Façade for
Office Buildings in Central China
Shen Xu
A thesis submitted to University of Sheffield in partial fulfilment of the
requirements for the degree of Doctor of Philosophy
School of Architecture
University of Sheffield
May 2014

– i –
Abstract
In recent years, interest in building integrated photovoltaic (BIPV) has
increased considerably. This thesis aims to evaluate the energy performance of
semi-transparent photovoltaic façade for office buildings in central China and to
propose optimal design based on the evaluation.
In this study, an experimental room was set up in Wuhan, which is typical city
of central China in climate. Then, the calculation models for energy evaluation of
PV façades are developed and validated based on field experiments. The
architectural models were developed with a series of generic office rooms. Finally,
the architectural models and validated models were incorporated into the
simulations with Energy Plus for energy evaluation of semi-transparent PV façade.
Energy evaluations based on the PV generated electricity were performed in
four cities of China. The results show that with the varieties of cities and building
orientations, building forms, and materials and arrangements of PV modules, there
was a distinct difference in annual power generation of PV façades.
Energy evaluations based on the overall energy consumption were performed
for two types of the PV façades in Wuhan. The impacts of the properties of PV
glazing and the architecture factors on the overall energy of semi-transparent PV
façades was addressed. For example, in large window-to-wall ratio (WWR) office
rooms, mono-crystalline semi-transparent PV of high PV coverage ratio (PVR)
could be energy efficient. Therefore, use of optimal PVR and WWR based on the
combination of room depth and orientation can achieve overall energy consumption
saving.
In addition, the suitability of optimal PVR/WWR strategies for PV façades in
different architectural conditions was investigated with the consideration of
Chinese Design Standard for Energy Efficiency of Public Buildings. The
mono-crystalline semi-transparent PV could only achieve a better overall energy
performance in the cases of small WWR and small depth room meanwhile
amorphous-silicon fail to achieve a better overall energy performance in all cases.

– ii –
Acknowledgements
It is my pleasure to thank the many people who made my thesis possible.
First, I offer my sincerest gratitude to my chief-supervisor, Prof. Jian Kang,
who has supported my PhD research project with his enthusiasm, inspiration and
knowledge, along with his significant efforts to explain things clearly, simply and
patiently. Without his expert guidance, continuous encouragement and constructive
ideas, my work and knowledge would not be complete. I have learned a lot from
Prof. Jian Kang, not only about the research, but also about fruitful and stimulating
discussions and debates about our common interest.
I would like to express my profound thanks to Prof. Steve Sharples, who
served as first supervisor during my first year of PhD study, for his patient and
gradual instruction on how to perform research. His wisdom opened my eyes and
decreased my ignorance.
I also appreciate the School of Architecture, University of Sheffield for
providing me with departmental scholarship of a fee waiver. Without this financial
support, it would not have been possible to complete my PhD study. The grant
from the National Natural Science Fund of China (Project No. 51008136) for the
project is also acknowledged.
I would also like to thank Prof. Steve Fotios and Dr. Hasim Altan for their
advice in my upgrade assessment. This thesis would not be possible without help
from members of the School of Architecture, University of Sheffield, for example,
Ms. Rebecca Gray, Dr. Jiangtao Du, Dr. Lei Yu, Dr. Hui Xie, Dr. Yang Li, Bo
Wang, Yiying Hao, Jie He, Ming Yang, Xi Wang, Xiang Ren, Bin Guo, etc. I am
deeply grateful to them.
Many thanks are expressed to Wuhan Lingyun Building Decorative
Engineering Company Ltd. and Mr. Zhongming Hu, Mr. Pingxun Pan and Mr. Fei
Pei. Without their support, the construction of experimental room would not have
been possible.
Special thanks are extended to Prof. Baofeng Li, Prof. Zhangcai Long, Prof.
Zhuang Yu, Prof. Zukang Lei, Dr. Yunpeng Hu, Dr. Wei He, Dr. Da Yan, Dr.

– iii –
Yufeng Zhang and Dr. Xinping Zhou for their constant encouragement and
valuable advices throughout my graduate studies. I have learned a great deal from
them. Their insightful suggestions made my work more thorough.
Thanks are also due to Wei Liao, Bingjie Lin, Bingchen Han, Liming Zhang,
Hao Guo, Kui Zhang, Siwei Liu, Ziqi Gui, Cong Yao, Xuan Che, Weipeng Zheng
and Yuanzhi Lv for their assistance in experimental work. The results of this thesis
rely on the data collected the from experimental room in Wuhan, China. Their help
on setting up the experimental room and data collection was essential to the
completion of the project.
In particular, my heartfelt gratitude is given to my wife, Jing Huang, and our
lovely son, Yiqing Xu, for their understanding, immense help and encouragement. I
am also very grateful to my father, my parent-in-law and other family members.
This thesis is dedicated to them as a gift for the efforts we have gone through all
together over the years. I personally have fulfilled my dream and am grateful to my
family for their support.

– iv –
List of Abbreviations
AC Air conditioning
AM Air mass
BAPV Building attached photovoltaic
BIPV Building integrated photovoltaic
CSWD Chinese Standard Weather Data
DC Direct current
EVA Ethylene-vinyl acetate copolymer
HC Heating and cooling
NOCT Normal operating cell temperature
PV Photovoltaic
PVR PV coverage ratio
STC Standard test conditions
TRY Test Reference Year
TMY Typical Meteorological Year
WWR Window-to-wall ratio

– v –
List of Important Symbols
Symbols Description
Pd DC electrical power of PV generation (W)
EPV DC electrical energy of PV generation (kWh/m2)
A aperture surface area of PV cell (m2)
t time (hour)
G solar irradiance (W/m2)
Gh horizontal total irradiance (W/m2)
Gb horizontal beam irradiance (W/m2)
Gd horizontal diffuse irradiance (W/m2)
Gi total irradiance on inclined surface (W/m2)
Gb,i beam irradiance on inclined surface (W/m2)
Gr,i reflected irradiance on inclined surface (W/m2)
Gd,i diffuse irradiance on inclined surface (W/m2)
Go hourly extraterrestrial irradiation on a horizontal surface
Rb ratio of beam irradiance on inclined surface to horizontal
beam irradiance (dimensionless)
αs solar elevation (rad)
β inclination angle of the surface (rad)
γi azimuth angle of the inclined surface (rad)
γs azimuth angle of the sun (rad)
δ declination of the sun (rad)
θi angle of incidence on the surface (rad)
θz solar zenith angle (rad)
υ local latitude (rad)
ω hour angle (rad)
n day (d)
AI anisotropy index in the Hay model (dimensionless)
f modulating function in the Reindl model (dimensionless)
Isc solar constant (W/m2)
ρ average ground reflectance (dimensionless)

– vi –
η PV cell/module conversion efficiency (dimensionless)
η0 PV cell/module conversion efficiency under STC
(dimensionless)
η(Tc) PV cell/module conversion efficiency under Tc
(dimensionless)
βC temperature coefficient(K-1)
T temperature (K)
Tc PV cell/module operating temperature (K)
Ta ambient temperature (K)
NOCT Normal operating cell temperature (°C)
E annual overall energy consumption of the building room with
the semi-transparent PV façades (kWh/m2)
P instant power of the PV panel (W/m2)
αi solar absorptance of layer i (dimensionless)
Ti temperature of boundary i (dimensionless)
Tout outdoor temperature (K)
Tin indoor temperature (K)
hout,c convective heat transfer coefficients for the outside surface
(dimensionless)
hin,c convective heat transfer coefficients for the inside surface
(dimensionless)
hout outside heat transfer coefficient (dimensionless)
hin inside heat transfer coefficient (dimensionless)
emissivity of the front glass (dimensionless)
σ Stefan–Boltzmann constant
τ total solar transmittance of semi-transparent PV
(dimensionless)
τi solar transmittance of layer i (dimensionless)
λi the heat conductivity of layer i (W/mK)
λsc heat conductivity of the solar cell layer (W/mK)

– vii –
λEVA heat conductivity of EVA layer (W/mK)
di thickness of layer i (m)
N inward-flowing fraction of the absorbed radiation
α solar absorptance (dimensionless)
τ‘ visible transmittance of the semi-transparent PV glazing
(dimensionless)
τ‘i visible transmittance of layer i (dimensionless)
U U-factor, overall heat transfer coefficient (W/m2K)
SHGC solar heat gain coefficient (dimensionless)
SC Shading coefficient (dimensionless)

– viii –
Table of Contents
Abstract ......................................................................................................................... i
List of Abbreviations .................................................................................................. iv
List of Important Symbols .......................................................................................... v
Table of Contents ...................................................................................................... viii
List of Tables ............................................................................................................. xiii
List of Figures ........................................................................................................... xvi
Chapter 1 Introduction ............................................................................................... 1
1.1. Research background ............................................................................... 2
1.2. Research aim and objectives` ................................................................... 4
1.3. Methodologies and approaches ................................................................ 5
1.4. Organisation of the thesis ......................................................................... 7
Chapter 2 Literature review ..................................................................................... 10
2.1. Photovoltaic technology and its development in China .......................... 11
2.1.1. Solar photovoltaic technology .......................................................... 11
2.1.2. Development of photovoltaic applications in China ....................... 12
2.2. Building façades and overall building energy performance ................... 16
2.2.1. Impacts of different factors of façades on energy consumption ..... 16
2.2.2. Daylighting performance................................................................. 18
2.2.3. Thermal performance: U-value and SHGC ..................................... 19
2.3. Semi-transparent PV façades and its impact on building energy
performance ............................................................................................ 19
2.3.1. Mono-crystalline silicon semi-transparent PV ................................ 20
2.3.2. Amorphous-silicon semi-transparent PV ........................................ 22
2.4. Tools and computational software .......................................................... 23
2.4.1. Assistant tools and software for the optimal design of a PV
system ................................................................................................... 23
2.4.2. Computation simulation tools for energy performance simulations 25
2.5. Conclusions ............................................................................................ 28

– ix –
Chapter 3 Experimental room set-up and field measurement .............................. 30
3.1. The motivation of experimental room set-up ......................................... 31
3.1.1. Review of previous experimental room .......................................... 31
3.1.2. General considerations on experimental room and measurement ... 35
3.2. Experimental room set-up ...................................................................... 36
3.2.1. Layout of the experimental room .................................................... 36
3.2.2. Properties of the PV glazings .......................................................... 39
3.3. Measurement equipment and arrangements ........................................... 41
3.3.1. Measurement equipment ................................................................. 41
3.3.2. Arrangements of the temperature measurement.............................. 42
3.3.3. Arrangements of the solar irradiance measurements ...................... 43
3.3.4. Arrangements of the PV output power measurements .................... 45
3.3.5. Arrangements of the daylighting illuminance measurements ......... 45
3.3.6. Other arrangements ......................................................................... 46
3.4. General measurements in the field experiments .................................... 48
3.4.1. Solar irradiance measurements........................................................ 48
3.4.2. PV generation power and PV temperature measurements .............. 52
3.4.3. Daylighting illuminance measurements .......................................... 55
3.5. Conclusions ............................................................................................ 57
Chapter 4 Climate, solar irradiance and estimation of annual power
generation of PV façades in China ........................................................................... 58
4.1. Climate and solar irradiance ................................................................... 59
4.1.1. Thermal climate zones and solar climate zones in China ............... 59
4.1.2. Typical year weather database in China .......................................... 61
4.1.3. Thermal climate and solar climate in Wuhan .................................. 62
4.2. Calculation methods for annual power generation of PV façades ......... 68
4.2.1. Solar irradiance on the inclined surface .......................................... 68
4.2.2. PV generation power based on the operating temperature .............. 72
4.2.3. Validation on calculation methods .................................................. 74
4.3. Parametric studies on the annual power generation of the PV façades
in China ..................................................................................................... 77
4.3.1. Effects on the location and orientation ............................................ 77

– x –
4.3.2. Effects on the building form ............................................................ 80
4.3.3. Effects on the PV material and PV module arrangements .............. 81
4.4. Conclusions ............................................................................................ 84
Chapter 5 Calculation methods and architectural models for energy
evaluation of semi-transparent PV façades............................................................. 85
5.1. Introduction ............................................................................................ 86
5.2. Calculation methods of semi-transparent PV glazing ............................ 87
5.2.1. PV power generation model ............................................................ 88
5.2.2. Thermal calculation model .............................................................. 91
5.2.3. Daylighting calculation method ...................................................... 97
5.3. Architectural models .............................................................................. 98
5.4. Models of baseline buildings for comparison ...................................... 102
5.5. Conclusions .......................................................................................... 105
Chapter 6 Evaluation on energy performance of office buildings with
mono-crystalline semi-transparent PV façades .................................................... 106
6.1. Introduction .......................................................................................... 108
6.2. Parametric analyses of the overall energy performance of
mono-crystalline semi-transparent PV façades........................................ 110
6.2.1. Effects on the PV electricity generation ......................................... 110
6.2.2. Effects on the daylight and the lighting electricity consumption ... 112
6.2.3. Effects on the heating and cooling electricity consumption........... 118
6.2.4. Effects on the overall energy consumption ................................... 126
6.3. Optimal PVR according to the overall energy performance ................ 130
6.4. Energy saving of mono-crystalline semi-transparent PV glazing
compared to three traditional glazings .................................................... 133
6.4.1 Energy savings in small WWR cases ............................................ 136
6.4.2 Energy savings in large WWR cases ............................................. 140
6.5. Conclusions .......................................................................................... 143
Chapter 7 Evaluation on energy performance of office buildings with
amorphous-silicon semi-transparent PV façades ................................................. 146
7.1. Introduction .......................................................................................... 147

– xi –
7.2. Parametric analyses of the overall energy performance of
amorphous-silicon semi-transparent PV façades .................................... 148
7.2.1. Effects on the PV electricity generation ........................................ 148
7.2.2. Effects on the daylight and the lighting energy consumption ....... 149
7.2.3. Effects on the heating and cooling electricity consumption.......... 151
7.2.4. Effects on the overall energy consumption ................................... 152
7.3. Optimal WWR according to the overall energy performance .............. 155
7.4. Energy saving of amorphous-silicon semi-transparent PV glazing
compared to three traditional glazings .................................................... 156
7.4.1 Energy savings in small WWR cases ............................................ 157
7.4.2 Energy savings in large WWR cases ............................................. 161
7.5. Conclusions .......................................................................................... 164
Chapter 8 Other implications of semi-transparent PV façades in office
buildings ................................................................................................................... 167
8.1 Introduction .......................................................................................... 168
8.2 Effects of other architectural factors on overall energy performance of
semi-transparent PV ................................................................................ 169
8.2.1. Effects of different room height .................................................... 169
8.2.2. Effects of different window height ................................................ 170
8.2.3. Effects of different room width ..................................................... 171
8.3. Suitability of optimal PVR/WWR for semi-transparent PV on office
building façades ...................................................................................... 172
8.3.1 Introduction ................................................................................... 172
8.3.2 Mono-crystalline semi-transparent PV façades ............................. 173
8.3.3 Amorphous-silicon semi-transparent PV façades ......................... 179
8.4. Environmental benefit of the semi-transparent PV façades ................. 182
8.5. Conclusions .......................................................................................... 184
Chapter 9 Main contributions and Future work .................................................. 186
9.1. Main contributions ...................................................................................... 187
9.2. Limitations and future work ........................................................................ 191
Papers Arising from This Thesis ............................................................................ 195

– xii –
References ................................................................................................................ 196
Appendix A: The images of experimental room set-up and experimental
process ....................................................................................................................... 211
Appendix B: Optimal PV cell coverage ratio for semi-transparent
photovoltaics on office building façades in central China ................................... 218

– xiii –
List of Tables
Table name Page
Table 2.1 PV material and efficiency 12
Table 2.2 Annual installation and production of photovoltaic in China 13
Table 2.3 Government-supported policies of PV released from 2012
to 2013
14
Table 2.4 PV projects supported by the Golden Sun Demonstration
Program
15
Table 2.5 Breakdown of the cumulative PV installations in 2010 15
Table 2.6 BIPV projects supported by the Golden Sun Demonstration
Program
16
Table 2.7 WWR and annual lighting electricity consumption of
several types of buildings
17
Table 2.8 Tools and their features for the optimal design of PV
systems
24
Table 2.9 Building simulation software packages 26
Table 3.1 Descriptions of the experimental room 38
Table 3.2 Descriptions of the four PV glazings considered in the
study
39
Table 3.3 Descriptions of measurement equipment 42
Table 3.4 Specifications of the TBQ-2 pyranometer 45
Table 3.5 Specifications of the TES-1339R luxmeter 46
Table 3.6 Parameters of four PV glazings 54
Table 4.1 Latitudes of four Chinese cities 65
Table 4.2 Longitude and latitude of five worldwide cities 67
Table 5.1 Properties of individual layers of the mono-crystalline
semi-transparent PV
91
Table 5.2 Properties of each individual layer of the
amorphous-silicon semi-transparent PV
94
Table 5.3 Thermal and optical properties of the building envelope 101

– xiv –
layers
Table 5.4 Hourly schedules of office rooms 101
Table 5.5 Requirements for the envelope properties of
energy-efficient office buildings
104
Table 6.1 Optimal PVR in different combinations of room depth and
WWR in the southern orientation
130
Table 6.2 Electricity saving using optimal PVR compared to most
disadvantaged PVR
131
Table 6.3 Optimal PVR of different combinations of orientation and
room depth
132
Table 6.4 Optimal PVR of different combinations of orientation and
WWR
133
Table 6.5 Properties of three traditional glazings 134
Table 7.1 Optimal WWR in different room depth in south orientation 156
Table 7.2 Deviation by optimal WWR compared to most
disadvantaged WWR
156
Table 8.1 Overall electricity consumption of office rooms with
mono-crystalline semi-transparent PV for each optimal
PVR
173
Table 8.2 Overall electricity consumption of office rooms of baseline
building A for each combination of room depth and WWR
174
Table 8.3 Overall electricity consumption of office rooms of baseline
building B for each combination of room depth and WWR
175
Table 8.4 Energy saving with mono-crystalline semi-transparent PV
compared to baseline building A for each combination of
room depth and WWR combinations
176
Table 8.5 Energy saving with mono-crystalline semi-transparent PV
compared to baseline building B for each combination of
room depth and WWR
177
Table 8.6 Economic saving with mono-crystalline semi-transparent
PV compared to baseline building A for each combination
of room depth and WWR
178

– xv –
Table 8.7 Economic saving from mono-crystalline semi-transparent
PV compared to baseline buildings B for each combination
of room depth and WWR
179
Table 8.8 Overall electricity consumption of office rooms with
amorphous-silicon semi-transparent PV with optimal
WWR for each room depth cases
180
Table 8.9 Energy saving with amorphous-silicon semi-transparent PV
compared to baseline buildings A and B in different room
depth cases
180
Table 8.10 Economic saving of mono-crystalline semi-transparent PV
compared to baseline buildings A and B of rooms with
optimal WWR for different room depth
181
Table 8.11 Emission reduction each year using mono-crystalline
semi-transparent PV compared to baseline building A
183
Table 8.12 Emission reduction each year using amorphous-silicon
semi-transparent PV compared to baseline building A
183

– xvi –
List of Figures
Figure name Page
Figure 1.1 Methodologies structure 5
Figure 2.1 Image of mono-crystalline semi-transparent PV glazing 21
Figure 2.2 Image of amorphous-silicon semi-transparent PV glazing 22
Figure 3.1 Section of MoWiTT 32
Figure 3.2 Image of MoWiTT 32
Figure 3.3 Image of the PASLINK test cell for the SOLVENT
window
34
Figure 3.4 Layout of the experimental room 37
Figure 3.5 Image of the experimental room 38
Figure 3.6 Arrangement of the temperature measurement points 43
Figure 3.7 Arrangement of the solar irradiance measurement points 43
Figure 3.8 Image of the group of pyranometers on the experimental
room roof
44
Figure 3.9 Arrangement of the illuminance measurement points 45
Figure 3.10 Image of the building orientation calibration process 47
Figure 3.11 Orientations analysis by GIS devices 47
Figure 3.12 Measurement of total solar irradiance of various
orientations
50
Figure 3.13 Measurements of solar horizontal total irradiance and
diffuse irradiance
51
Figure 3.14 Measurements of solar irradiance and PV generation
power
53
Figure 3.15 The PV efficiency and the PV temperature 54
Figure 3.16 Measurements of daylighting illuminance 56
Figure 4.1 Thermal climate zones of China 60
Figure 4.2 Solar climate zones of China 61
Figure 4.3 Daily average, maximum and minimum temperatures of
Wuhan
64

– xvii –
Figure 4.4 Monthly average temperatures of four Chinese cities 66
Figure 4.5 Monthly average temperatures of five worldwide cities 67
Figure 4.6 Monthly solar irradiance in Wuhan 68
Figure 4.7 Validation of the solar irradiance calculation under sunny
conditions
74
Figure 4.8 Validation of the solar irradiance calculation under
cloudy conditions
75
Figure 4.9 Validation on calculation method of PV operating
temperature
76
Figure 4.10 Validation of the calculation method of the PV generation
power based on the PV operating temperature
77
Figure 4.11 Annual power generation of the PV façades of every
orientation in four cities of China
78
Figure 4.12 Monthly power generation of the PV façades in Beijing
and Wuhan
79
Figure 4.13 Annual power generation of the PV façades in three
building forms
81
Figure 4.14 Illustration of four arrangements for the PV façades 83
Figure 4.15 Annual power generation of the PV façades in four
arrangements
83
Figure 5.1 Computation models for energy plus to compared with
field experiment room
89
Figure 5.2 Validation of the power generation of the
mono-crystalline semi-transparent PV
90
Figure 5.3 Validation of the power generation of the
amorphous-silicon semi-transparent PV
90
Figure 5.4 Schematic illustration of the mono-crystalline
semi-transparent PV
92
Figure 5.5 Schematic illustration of the amorphous-silicon
semi-transparent PV
94
Figure 5.6 Comparison of the measured and the calculated
inside-surface temperatures for the mono-crystalline
95

– xviii –
semi-transparent PV glazing
Figure 5.7 Comparison of measured and the calculated
inside-surface temperatures for the amorphous-silicon
semi-transparent PV glazing
95
Figure 5.8 Illustrations of the generic office rooms 99
Figure 5.9 Illustrations of the variations in (a) room depth, (b)
WWR, and (c) PVR
100
Figure 6.1 Solar cell temperature and its conversion efficiency
in different PVR cases
111
Figure 6.2 Indoor daylight illuminance of different PVR
in different room depth cases
113
Figure 6.3 Lighting electricity consumption of different PVR
in different room depth cases
114
Figure 6.4 Indoor daylight illuminance of different PVR
in different WWR cases
115
Figure 6.5 Lighting electricity consumption of different PVR
in different WWR cases
115
Figure 6.6 Deducted lighting electricity consumption with PV
electricity yield deduction in different room depth cases
116
Figure 6.7 Deducted lighting electricity consumption with PV
electricity yield deduction in different WWR cases
117
Figure 6.8 Monthly heat gain and heat loss through clear window
glass (WWR=0.35) in the Wuhan
119
Figure 6.9 Heat gain and heat loss through mono-crystalline
semi-transparent PV glazing in a 4m-depth room
(WWR=0.2)
120
Figure 6.10 Combined value of heat gain and heat loss (heat gain
minus heat loss)
121
Figure 6.11 Heat gain and heat loss through mono-crystalline
semi-transparent PV glazing with a fixed PVR of 40%
(WWR=0.2)
121
Figure 6.12 Heating and cooling electricity consumption of different 122

– xix –
PVR in different room depth cases at a fixed WWR of
0.35
Figure 6.13 Heating and cooling electricity consumption of different
PVR in different WWR cases 123
Figure 6.14 Deducted heating and cooling electricity consumption
with the PV electricity yield deduction in different room
depth cases
124
Figure 6.15 Deducted heating and cooling consumption with a PV
electricity yield deduction in different WWR cases 125
Figure 6.16 Overall energy consumption of large WWR rooms in two
cases of room depth (a) 6 m and (b) 12 m 128
Figure 6.17 Overall energy consumption of small WWR rooms in two
cases of room depth (a) 6 m and (b) 12 m 129
Figure 6.18 Mono-crystalline PV glazing and three traditional
glazings 135
Figure 6.19 Illustration of small WWR cases and large WWR cases 135
Figure 6.20 Daylight illuminance of different glazings at WWR of 0.3 136
Figure 6.21 Lighting electricity consumption of different glazings at
WWR of 0.3 137
Figure 6.22 Heating and cooling electricity consumption of different
glazings at WWR of 0.3 138
Figure 6.23 Overall energy consumption of different glazings at
WWR of 0.3 139
Figure 6.24 Daylight illuminance of different glazings at WWR of 0.6 140
Figure 6.25 Lighting electricity consumption of different glazings at
WWR of 0.6 141
Figure 6.26 26 Heating and cooling electricity consumption of
different glazings at WWR of 0.6 142
Figure 6.27 Overall energy consumption of different glazings at
WWR of 0.6 142
Figure 7.1 PV power generation of different WWR in different room
depth cases 148

– xx –
Figure 7.2 Indoor daylight illuminance of different WWR in
different room depth cases 149
Figure 7.3 Lighting energy consumption of different WWR in
different room depth cases 150
Figure 7.4 Heating and cooling electricity consumption of different
WWR in different room depth cases 151
Figure 7.5 Overall energy consumption of different WWR in
different room depth cases 153
Figure 7.6 Overall energy consumption of different WWR in cases
of room depth (a) 6 m and (b) 12 m 155
Figure 7.7 Amorphous-silicon PV glazing and three traditional
glazings 157
Figure 7.8 Daylight illuminance of different glazings at WWR of 0.3 158
Figure 7.9 Lighting electricity consumption of different glazings at
WWR of 0.3 158
Figure 7.10 Heating and cooling electricity consumption of different
glazings at WWR of 0.3 159
Figure 7.11 Overall energy consumption of different glazings at
WWR of 0.3 160
Figure 7.12 Daylight illuminance of different glazings at WWR of 0.6 162
Figure 7.13 Lighting electricity consumption of different glazings at
WWR of 0.6 162
Figure 7.14 Heating and cooling electricity consumption of different
glazings at WWR of 0.6 163
Figure 7.15 Overall energy consumption of different glazings at
WWR of 0.6 163
Figure 8.1 Overall energy consumption for different room heights 170
Figure 8.2 Overall energy consumption for different window heights 171
Figure 8.3 Overall energy consumption for different room widths 172

Chapter 1
– 1 –
Chapter 1 Introduction

Chapter 1
– 2 –
1.1. Research background
Global awareness of energy use and its environmental implications has been
raised in the recent report by the Inter-governmental Panel on Climate Change
(IPCC) (Solomon et al., 2007). Because economic expansion requires energy
consumption, rapid economic growth is accompanied by rapidly increasing energy
consumption in China since the policy of ―Reforming and Opening‖ was adopted
by the Chinese government in 1978 (Zhang, 1995). In general, industry,
transportation and buildings are the three primary sectors of energy demand.
According to the International Energy Agency, commercial and residential
buildings account for 30.9% of the total end-use energy consumption in China
(Birol, 2010). With further development of the economy and improvements in the
living standards of people, the proportion of buildings in the total energy
consumption will continue to increase; buildings are estimated to account for 35%
of the total energy consumption in China by 2020 (Yao et al., 2005). The only way
to alleviate the ever-growing building energy demand in China is to implement a
building energy efficiency policy and to promote advanced technologies and proper
building design strategies for energy efficient buildings (Xie et al., 2011;Hong,
2009).
Photovoltaic (PV) has been regarded as one of the best ways to harness the
renewable energy for buildings (Parida et al., 2011). Solar power is converted to
direct current electricity by PV materials, such as monocrystalline silicon,
polycrystalline silicon, amorphous-siliconcadmium telluride, and copper indium
gallium. (Petter Jelle et al., 2012). The crystalline silicon PV and the
amorphous-silicon PV are commonly used in the market. The advantage of the
crystalline silicon cell is that the practical efficiency is high, and the disadvantage
is the large amount of energy consumed in production and the high cost, while the
advantage and disadvantage of amorphous-silicon is the opposite to those of
crystalline silicon. (Goetzberger and Hebing, 2000). Building integrated
photovoltaic (BIPV) are photovoltaic materials that are used to replace
conventional building materials in parts of the building envelopes, such as the
roofs, skylights or façades. Due to the Chinese government‘s incentive policies, the
application of solar PV modules has developed rapidly, and a significant number of

Chapter 1
– 3 –
BIPV demonstration buildings have been built since 2009 (Xie et al., 2011). In
particular, BIPV technology is becoming widely used in parts of the façades of
modern buildings (Roberts and Guariento, 2009 ; Weller et al., 2010 ; Zhang et al.,
2012 ; Taleb and Pitts, 2009). Office buildings are particularly suitable for BIPV
technology, as office buildings consume energy primarily in daytime, which is
when the PV system collects and converts solar energy into electricity; thus, the
effort and cost associated with energy storage can be avoided (Lam et al., 2003).
Such PV façades are being used increasingly in the designs of office buildings in
China (Peng et al., 2011). Accordingly, the development of an optimal PV façade
design for architects, constructers, and installers is becoming increasingly urgent.
The results of extensive studies on the evaluation of the power generation of
BIPV modules indicated that the solar irradiance and PV module temperature
should be considered as the most important factors because they affect both the
electrical efficiency and the output of the BIPV system. Moreover, the energy
evaluation of semi-transparent PV on an office façade should be regarded in view
of the overall energy rather than only the electricity produced by the PV system.
Semi-transparent PV modules not only generate electricity but also introduce
daylight, which can reduce artificial lighting energy consumption during the
daytime (Li et al., 2009). Conversely, semi-transparent PV modules reduce the heat
gain in a building by blocking the incoming solar radiation due to absorption in the
PV cells (Fung and Yang, 2008), which increases heating demand indoors in winter
but reduces the cooling demand in summer. The researchers suggested that the
properties of PV material and the different combinations of architectural factors
have a profound impact on the overall energy consumption of semi-transparent PV
façade buildings, particularly through their effects on PV electricity generation,
lighting, heating and cooling.
Moreover, the climate is the key factor for building energy evaluation as well
as the overall energy-saving effects of semi-transparent PV systems. In Brazil, the
use of a semi-transparent PV window has been shown to save up to 43% of the
energy consumption (Leite Didoné and Wanger, 2013). In addition, 55% energy
savings were achieved in Japan (compared to a single-glazed window) with a solar
cell transmittance of 40% and window-to-wall ratio (WWR) of 50% (Miyazaki et

Chapter 1
– 4 –
al., 2005), and energy savings in the range of 16.7–41.3% were achieved in
Singapore for a WWR range of 70–100% (Ng et al., 2013). Other previous studies
(Lu and Law, 2013; Olivieri et al., 2014) have also demonstrated the importance of
considering climatic conditions in the investigation of semi-transparent PV window
applications.
In brief, it is an urgent task to promote the optimal design and usage of PV
applications, especially BIPV systems, in China. Studies of semi-transparent PV
façades must be further performed in terms of the overall energy performance
under the local conditions of central China. Related calculation methods and
models must be developed to allow for a wider range of studies of semi-transparent
PV façades under different architectural conditions and different PV coverage ratio
(PVR). Such work would provide a solid foundation for the further development of
research and applications of semi-transparent PV façades in China.
1.2. Research aim and objectives`
The general aim of this research is to evaluate the energy performance of
semi-transparent photovoltaic façade for office buildings in central China and
to propose optimal design based on the evaluation.
The major research objectives include the following:
(1) To establish an experimental room with semi-transparent PV façade under
the real climate conditions and to develop the experimental methodology of
the measurement and calibration for collecting effective data. (Chapter 3)
(2) To estimate the annual power generation of the PV façades in the
representative cities of China. (Chapter 4)
(3) To evaluate the overall energy performance of two type of
semi-transparent PV façades for office buildings in Wuhan, China.
(Chapter 5-Chapter 7)
(4) To develop an optimizing design approach for semi-transparent PV façade
by the use of optimal PVR/WWR. (Chapter 5-Chapter 7)
(5) To investigate the suitability of optimal PVR/WWR strategies in different
architectural conditions. (Chapter 8)

Chapter 1
– 5 –
1.3. Methodologies and approaches
Experimental room setup
Measurement equipment and calibration
Solar irradinance
(beam and
diffuse, different
orientation )
Ambient
temperature
and other
weather data
Generation
power of PV
facade
(MPPT)
Temperature
of PV facade
Indoors
illuminance
Data collection and record
Solar irradiance
on inclined
surface model
PV generation power
based on operating
temperature model
PV
generation
power model
Heat
balance
model
Daylighting
calculation
Typical year
weather data in
China
Typical year
weather data in
Wuhan
Generic office room models in EnergyPlus
Different
architecture
factors
Overall energy performance evaluation of
semi-transparent PV façade
Optimal PVR and WWR of semi-transparent
PV façade according to overall energy
performance
Estimation of annual power
generation of PV façade in China
Semi-transparent PV facade
The suitability of optimal PVR / WWR
strategies of semi-transparent PV façades
Chapter 3
Chapter 4
Chapter 5
Chapter 6 for mono-
crystalline PV
Chapter 7 for
amorphous silicon PV
Chapter 8
Experiment and
measurement
Calculation model
and validation
Simualtion and
mathematical
analysis
Figure 1.1 Methodologies structure
This study is a comprehensive research program involving the methodologies
of experiment and field measurements, calculation models development and
validation, simulation and mathematical analysis. Field measurements are
performed in the first stage to investigate the electrical, thermal, optical
characteristics of different semi-transparent PV glazings. At the same time,
calculation models and methods are constructed to predict the energy performance

Chapter 1
– 6 –
of these glazing under the prevailing weather conditions. These models are
validated against the measured data to confirm the accuracy. Subsequently, the
validated PV models and typical office buildings models are incorporated into the
building simulation program to evaluate the overall energy consumption. Finally,
the results of evaluation are used to define the optimal design for this region.
Figure 1.1 shows the methodologies structure.
(1) Experiment and field measurement
The goal of the experimental study performed in this work is to achieve more
accurate data regarding the properties of semi-transparent PV glazings. The
experimental room containing two inner and separate chambers was set up on the
roof of a building in Wuhan. The building component such as PV glazing could be
fixed on the south vertical façade of the experiment room. The methodology of
measurement and calibration was developed to achieve vital data of the
environmental parameters and the parameters related to PV façades. A board range
of data including temperature, solar irradiance, illuminance and PV generation
power was measured and recorded systemically in a long period for more than one
year. In addition, the PV façades parameters achieved from the field experiment in
this study were compared with the previous literature of other researchers.
(2) Calculation models development and validation
Firstly, the measured data were applied to develop calculation models of
determining the solar irradiance on inclined surface and PV generation power
based on operating temperature. Both of the validated models are indispensable to
estimate the annual power generation of PV façades.
Secondly, the measured data were applied to develop PV power generation
model, thermal model and daylighting calculation method for both
mono-crystalline and amorphous-silicon semi-transparent PV façades.
Thirdly, architectural models were developed to provide a series of generic
office rooms for overall energy evaluation of semi-transparent PV façades. The

Chapter 1
– 7 –
generic office rooms were set to allow control of three variables, the room depth,
WWR and orientation, and were fixed on other necessary settings including
building envelop materials, running schedule of people and equipment etc.
(3) Simulation and mathematical analysis
With validated calculation models and typical year weather data, the annual
power generation of PV façade were calculated in several representative cities of
China. The mathematical analysis were carried out on the effects of location and
orientation, effects of building forms, effects of PV material and PV
arrangements.
With the calculation methods, architectural models and typical year weather
data, the overall energy consumption evaluations were carried out in the research
for two semi-transparent PV façades in Wuhan, a representative city of central
China in climate. In addition, the suitability of optimal PVR / WWR strategies for
PV façades under different architectural conditions was investigated with the
consideration of Chinese Design Standard for Energy Efficiency of Public
Buildings.
1.4. Organisation of the thesis
This thesis consists of nine chapters. A brief description of each chapter is
outlined as follows.
Chapter 1 is an introductory chapter that describes the background information
related to the research topic, and outlines the content of this thesis. The research
aim and the objectives of this research are introduced in this chapter. The
investigation methodologies and approaches are also presented.
Chapter 2 reviews the past work in the existing literature relevant to the current
research. The important discoveries and conclusions by previous studies have been
acknowledged and considered thoroughly. In addition, the research gaps are
identified in this chapter.
Chapter 3 presents the experimental study of semi-transparent PV façades on the
rooftop of the building in Wuhan, China. The set-up of experimental room, with
semi-transparent PV façades, the data measurements and data quality control

Chapter 1
– 8 –
methods, is described. The general measured results in the different weather
conditions are presented using graphical approaches.
Chapter 4 presents the climate, solar irradiance and their relevance of power
generation of PV façade. The calculation methods of solar irradiance on inclined
surface and PV generation power based on operating temperature are explained and
are validated with recorded data from the experimental room. Employed with the
validated calculation methods and the typical year weather data of CSWD, the
parametric studies are carried out on estimation of the annual power generation of
PV façades in China.
Chapter 5 presents the calculation models and methods developed for both
mono-crystalline silicon PV façades and amorphous-silicon semi-transparent PV
façades, which includes the PV power generation model, the heat balance model
and the daylighting calculation method. The measured data obtained from the field
experiments are presented to compare with the simulated results as validation in
this chapter.
Chapter 6 presents the evaluation of the energy performance of mono-crystalline
semi-transparent PV façades. A discussion of the parametric analysis of the
overall energy performance and a comparison analysis between mono-crystalline
semi-transparent PV glazings and traditional glazings is conducted. The optimal
strategy by PVR for mono-crystalline semi-transparent PV façades and its impact is
proposed and discussed in this chapter.
Chapter 7 presents the evaluation of the energy performance of amorphous-silicon
semi-transparent PV façades. A discussion of the parametric analysis of the overall
energy performance and a comparison analysis between amorphous-silicon
semi-transparent PV glazings and traditional glazings is conducted. The optimal
strategy by WWR for amorphous-silicon semi-transparent PV façades and its
impact is proposed and discussed in this chapter.
Chapter 8 presents other implications of semi-transparent PV façades in office
buildings. The effects of other architectural factors on overall energy performance
when semi-transparent PV façades are used are discussed. The suitability of the
optimal PVR/WWR strategies in different architectural conditions is investigated.

Chapter 1
– 9 –
Environmental performance of the semi-transparent PV façades based on the
carbon reduction by the amount of CO2 and polluted emission including SO2, NO
and carbonaceous dust are presented in this chapter.
Chapter 9 summaries the main contribution of this thesis, states its limitations, and
provides the suggestions for further investigation.

Chapter 2
– 10 –
Chapter 2 Literature review

Chapter 2
– 11 –
In Chapter 1, research objectives and methodologies have been identified and
discussed. To further support the research ideas, the profound literature review is
essential. In this chapter, contributed studies and knowledge related to the research
objectives and methodology were reviewed in terms of four categories:
photovoltaic technology and its development in China (Section 2.1), building
façades and overall building energy performance (Section 2.2), semi-transparent
PV façades and its impact on building energy performance (Section 2.3), tools and
computation software (Section 2.4). Important discoveries and conclusions by these
previous studies have been acknowledged and considered as an important basis for
the formation of this study.
2.1.Photovoltaic technology and its development in China
2.1.1. Solar photovoltaic technology
Photovoltaic technology is known as a method to generate electrical power by
solar cells, converting energy from solar energy to a flow of electrons. The
continuous flow of electrons produces electrical power and is the basis of all types
of PV applications (Gevorkian, 2007).
The most commonly used materials for photovoltaic devices include
mono-crystalline silicon (Wawer et al., 2011; Sastry et al., 2010; Huld et al., 2011),
poly-crystalline silicon (Becker et al., 2013), amorphous-silicon (Gracin et al.,
2013; Rozario et al., 2014), cadmium telluride, and copper indium gallium.
(Gevorkian, 2007). Each material exhibits different practical efficiency and prime
cost. (Table 2.1) (Goetzberger and Hebing, 2000). The advantage of the crystalline
silicon cell is that the practical efficiency is high, and the disadvantage is the large
amount of energy consumed in production and the high cost, while the advantage
and disadvantage of amorphous-silicon is the opposite to those of crystalline
silicon.
The amount of electrical power generated by a solar PV device is continuously
changing with the changes of the environmental factors (Alonso-Abella et al.,
2014). Therefore, the use of Maximum Power Point Tracking (MPPT) techniques
are required to maintain each cell the PV array‘s operating point at its MPP. Many
MPPT techniques have been proposed in the literature, e.g., the Perturb and

Chapter 2
– 12 –
Observe (P&O) methods (Hua and Shen,1998), the Constant Voltage (CV) method
(Yu et al., 2004), the Incremental Conductance (IC) methods (Hussein et al.,1995),
the Artificial Neural Network method (Sun et al., 2002), the Fuzzy Logic method
(Kotta et al., 2006). These techniques vary in many aspects, including simplicity,
convergence speed, hardware implementation, sensors required, cost, range of
effectiveness and the need for parameterisation. The P&O, CV and IC techniques
are the most widely used. Considering the different types of solar insolation and
solar irradiance variations, the three MPPT techniques are compared by using the
Matlab tool Simulink (Li et al., 2007). The P&O method is adopted in many BIPV
projects for its advantage of highly efficient tracking results and economic
feasibility. These studies have been reviewed to ensure the accuracy of the
measurements of PV power generation in field studies, which is further discussed
in chapter 3.
Table 2.1 PV material and efficiency
Cells
material
Module
efficiency
Area need
for 1KWp Costs
Efficiency
impacted
by
temperature
Sensitivity
with solar
direct
radiation
Mono-cry
stalline
silicon
12%~15% 7 m2~9m2
High Great High Poly-cryst
alline
silicon
11%~14% 7.5 m2~10 m2
Amorpho-
silicon 6%~8% 14 m2~20 m2
Low Small Low CIS
material 8%~12% 9 m2~11 m2
CdTe
material 7%~10% 12 m2~17 m2
2.1.2. Development of photovoltaic applications in China
The development of solar photovoltaic has become a very interesting and
attracting topic in China in recent years. The demand and industry of solar

Chapter 2
– 13 –
photovoltaic technology grows in a rapid speed after 2006. To demonstrate such
development, the annual production and installation of photovoltaic modules are
presented in Table 2.2 (Li and Wang, 2007 ; Chen, 2012 ; OFweek Research,
2012 ; Xu, 2012). Both the installation and production exhibited rapid growth;
however, compared to the amount of production, the domestic installation in China
is significantly lagging. China has great advantages in terms of field-tested,
adequate, and relatively low priced PV products. These advantages provide great
opportunities for the development of solar PV applications, including building
integrated photovoltaic systems, in the future.
Table 2.2 Annual installation and production of photovoltaic in China
Unit:
MWp
Year
2004 2005 2006 2007 2008 2009 2010 2011
Installation 10 8 10 20 40 160 500 2200
Production 50 200 400 1088 2600 4011 10500 21000
Meanwhile, in recent years, to address China‘s enormous energy consumption
needs, the Chinese government mandated the implementation of all types of
sustainable energy resources. Solar energy is one important part of this plan. Just in
two years from 2012 to 2013, nine solar PV related policies that support the
development of solar photovoltaic projects were released, as presented in Table 2.3
(NDRC, 2011 ; NDRC, 2013 ; NEA, 2012a ; NEA, 2013). These massive
government-supported policies promote the development of solar photovoltaic
technology in many aspects of research and development, including the solar PV
manufacturing industry, distributed solar power implementation, BIPV projects,
grid connection of solar PV projects, etc.
With the advantages from both the market and government supports,
increasing numbers of solar PV projects are emerging in China. Table 2.4 presents
the PV projects supported by the program known as the Golden Sun Demonstration
Program, which was initiated by the Ministry of Science and Technology (MOST)
and the National Energy Administration (NEA) (Xu et al., 2011 ; Lv, 2012).

Chapter 2
– 14 –
Increasing numbers of projects are being approved and supported by this program,
and they serve as the demonstration projects to further promote the development of
solar PV power usage in China.
Table 2.3 Government-supported policies of PV released from 2012 to 2013
Issuing time Issuing
agency
Document title
January 2012 State
Council
Five Year Plan for Renewable Energy
Development
July 2012 NEA 12th Five Year Plan for Solar Energy
Development
September
2012
NEA Notice on Application for Scaling Up
Demonstration Zones for Distributed Solar
Power
September
2012
NEA Notice on Application for Scaling Up
Demonstration Zones for Distributed Solar
Power
November
2012
State Grid Opinions on Providing Good Services to the
Grid Connection of Distributed PV Power
Generation (Provisional)
July 2013 State
Council
Opinions on Promoting the Healthy
Development of Photovoltaic Industry
August 2013 NDRC Notice on Promoting the Healthy
Development of Solar PV Industry through
Price Leverage
August 2013 NEA Notice on the Construction of Scaling Up
Demonstration Zones for Distributed Solar
Power
August 2013 NDRC Provisional Management Measures for
Distributed Power
Note:NEA: National Energy Administration
NDRC: National Development and Reform Commission

Chapter 2
– 15 –
Table 2.4 PV projects supported by the Golden Sun Demonstration Program
Phase Year Approved projects
Approved
capacity
(MW)
Ⅰ 2009 98 201
Ⅱ 2010 50 272
Ⅲ 2011 140 690
Ⅳ 2012 167 1709
Total 455 2872
Table 2.5 Breakdown of the cumulative PV installations in 2010
Category Amount
(MWp)
Change
(compared
to 2009)
Share
(%)
Change
(compared
to 2009)
Rural electrification 75 +29% 9.4 - 9.9%
Communication and
industry
42
+5
5.3
- 8.0%
PV products 40 +0% 5.0 + 0%
BIPV/BAPV 256 +250% 32.0 +7.6%
Large scale PV stations 387 +335% 48.4 +19.2%
Total 800 +167% 100 0%
Among all of the solar PV projects in China, BIPV and BAPV (building
attached photovoltaic) projects comprise a large fraction of them (Li and Wang,
2007; Chen, 2012; OFweek Research, 2012; Xu, 2012). Table 2.5 presents the
breakdown of the cumulative PV installations in 2010, with BIPV and BAPV
comprising 32% of the total installations. More than 256 MWp of solar PV
capacity were installed in one year, which increased by 250% compared to that in
2009. The market share of BIPV/BAPV increased from 24.4% to 32.0%, indicating
the rapid development of PV usage in buildings. Table 2.6 presents the BIPV
projects supported by the Golden Sun Demonstration Program. The increase in

Chapter 2
– 16 –
BIPV projects in the program also increased significantly. However, most of these
BIPV/BAPV projects are installed with PV panels on the roof area. The
implementations of PV façades in buildings are still at the very beginning stage,
with few implementations in practice. The need for research and development of
PV façades in China is urgent, especially because of the significant demand for
BIPV and the lack of relevant field experiments and research studies.
Table 2.6 BIPV projects supported by the Golden Sun Demonstration Program
Phase Year Approved projects
Approved
capacity
(MW)
Ⅰ 2009 111 91
Ⅱ 2010 99 90.2
Ⅲ 2011 106 120
Ⅳ 2012 _ 250
Total _ 551.2
2.2. Building façades and overall building energy performance
The PV façade, as one type of building façade, has an impact on energy
performance that shares some similarities with the other types of buildings façades.
The studies of the impact of façades (windows and walls) on building energy
performance have been widely performed in the past decades, and a review of these
studies is an important basis for the research of the impact of PV façades on
building energy performance.
2.2.1. Impacts of different factors of façades on energy consumption
The configurations and layouts of façades have a profound impact on the
energy performance. The WWR (window-to-wall ratio) has been identified as one
of the most important factors among all of the façade configurations. S. Saridar
(Saridar and Elkadi, 2002) performed a research study in which several buildings in
Eastern Mediterranean are examined to discover the impact of WWR of façade on
energy consumption. Table 2.7 presents the WWR of three building façades of

Chapter 2
– 17 –
architectures built in different periods of time. The differences between the cases
are obvious in terms of energy performance by the different WWR.
Table 2.7 WWR and annual lighting electricity consumption of several types of
buildings
Date of
construction
WWR Annual
electricity
consumption
(Kwh/m2)
South Wall North Wall East/West
Wall
1978 0.72 0.87 0.63 3.26
1982 0.25 0.25 0.08 30.52
1994 0.58 0.58 0.58 7.63
1997 1 0 0.44 20.37
Furthermore, other factors, such as building orientation, climate, glazing type,
and fixed exterior shading, are also identified in terms of the relationship between
the façades and the building energy performance, such as annual energy use and
peak cooling loads, and these factors have been thoroughly analysed in a number of
studies conducted over the past several decades. The impact of the selection of
design strategies, including glazing type and fixed exterior shading, on energy use
and peak loads is assessed through a series of parametric studies in the book
Window Systems for High-Performance Buildings (Carmody et al., 2004). The
effect of the façade on energy use is also a consistent thread in the book
ClimateSkin (Hausladen et al., 2008) and is a major element in the book,
PlusMinus 20°/40° Latitude (Hindrichs and Daniels, 2007). The premise of the
latter book is that most of the global population lives in the region from 20° north
to 40° south latitude, and therefore, this is a region on which design teams and
manufacturers should focus attention for building performance. A majority of
sources on this topic stress the potential of the building envelope in reducing
energy use through the use of daylighting, solar heat gain control strategies, natural
ventilation, and integration with HVAC and lighting systems.
To date, a number of studies (Jaber and Ajib, 2011; Serra et al., 2010; Jin and
Overend, 2014; Ghadimi et al., 2013; Goia et al., 2014; Infield et al., 2006; Han et

Chapter 2
– 18 –
al., 2013; Infield et al., 2006; Charron and Athienitis, 2006) have been conducted
on energy saving buildings using climate-sensitive windows and façade
technologies, including double façade skin, advanced shading and PV façades. A
study (Jaber and Ajib, 2011) investigated different effects of the U-value, SHGC
(solar heat gain coefficient), orientation, and size of the windows on the annual
heating and cooling energy demand. Three different climate zones with four
glazings: single glazed, double glazed L, double glazed H and triple glazed. The
study indicated that 20-24% of the energy use can be saved by a well-optimised
glazed window according to different climates of Amman, Aqaba and Berlin.
From all of the above-mentioned studies, the two most important aspects
identified among the different branches of these studies are daylighting
performance and thermal performance (heating and cooling). These aspects are
particularly important in office buildings because they are mainly operating during
the daytime. The daylight and thermal demand is largely affected by building
façades.
2.2.2. Daylighting performance
Daylighting provides the visual and pleasant indoor environment for people in
office rooms as a natural lighting source. The colour rendering index of daylighting
is the best in all lighting sources and thus it is a high quality source of light.
Daylighting is achieved by the light passing through building façades (window
glazing or any semi-transparent material).
In Hong Kong, Li and Lam (Li et al., 2010) measured the illuminance on
façades and investigated the energy savings from the use of daylighting for
different façades (windows). A study of the effect of building envelope on the
daylighting efficiency in an office building was performed by Boyano (Boyano et
al., 2013), the results led to the conclusion that lighting plays a significant role in
energy use. Different reports suggested that reducing the WWR can lead to a better
energy performance, but simultaneously reduces the daylighting efficiency
(Poirazis et al., 2008; Motuziene et al., 2010; Susorova et al., 2013). Motuziene and
Joudis (Motuziene et al., 2010) analysed the office buildings in Lithuania and
suggested that with 20–40% of the optimal WWR, the energy performance

Chapter 2
– 19 –
remained the best. However, such low WWR would have problems meeting the
daylighting requirements.
2.2.3. Thermal performance: U-value and SHGC
In terms of the thermal performance of building glazing façades, a large
amount of studies in the past decades have identified the following as the two most
important and significant values: U-value and SHGC.
The U-value can be referred to as an ‗overall heat transfer coefficient‘ that
measures how well parts of a building transfer heat, i.e., the higher is the U value,
the worse is the thermal performance of the building envelope. A low U value
usually indicates high levels of insulation. The U-value is useful because it is a way
of predicting the composite behaviour of an entire building element rather than
relying on the properties of individual materials (Brennan, 2014). In addition,
U-values are important because they form the basis of any energy or carbon
reduction standard. In practice, nearly every external building element must comply
with thermal standards that are expressed as a maximum U-value. Knowledge of
the U-values at an early stage in the design process avoids subsequent expensive
re-working in a project. The U-value allows the designer to test the feasibility of
their project at an early stage to ensure it is appropriate for the purpose and will
comply with the regulatory frameworks.
The SHGC is the fraction of incident solar radiation admitted through a
window, both directly transmitted and absorbed and subsequently released inward.
SHGC is expressed as a number between 0 and 1. The lower a window's solar heat
gain coefficient, the less solar heat it transmits. The nationally recognised rating
method by the National Fenestration Rating Council (NFRC) is for the whole
window, including the effects of the frame. Alternately, the centre-of-glass SHGC
is sometimes referenced, which describes the effect of the glazing alone. Whole
window SHGC is lower than glass-only SHGC, and the value of whole window
SHGC is generally below 0.8 (RIBA, 2014).
2.3. Semi-transparent PV façades and its impact on building energy
performance

Chapter 2
– 20 –
In recent years, it appears that interest in energy conservation and renewable
energy application in buildings has greatly increased, as evidenced by building
integrated photovoltaic (BIPV) technology becoming widely used as part of the
façade in modern buildings (Roberts and Guariento, 2009; Weller et al., 2010).
Semi-transparent solar PV façades, different from conventional solar PV modules,
have PV cells incorporated into glazing materials (Lim et al., 2013). In addition to
generating electricity, semi-transparent PV façades allow daylighting and reduce
heat gain in buildings due to the blocking of some of the solar radiation by the PV
cells; such semi-transparent PV façades are anticipated to be widely used as
façades in office buildings.
Semi-transparent PV is beneficial to energy savings in buildings because it not
only generates electricity but also introduces daylight, which can reduce the
artificial lighting energy consumption(Li et al., 2009). In addition, semi-transparent
PV reduces the heat gain by blocking the solar radiation with the PV cells, which
will increase the heating demand of the inner space in winter but reduce cooling
demand in summer (Lu and Law, 2013). These impacts above are contradictory in
terms of overall energy conservation, and studies suggest that the answer lies in the
balance of the penetration of daylight and the solar heat gain.
Semi-transparent PV façades can be achieved by different PV materials.
Mono-crystalline silicon and amorphous-silicon are the two most commonly used
materials for semi-transparent PV glazings. These two PV technologies are
different in many ways, including PV electricity generation efficiency, thermal
characteristics, transparency and the integration in glazings. As a result, their
impacts on energy performance are also different.
2.3.1. Mono-crystalline silicon semi-transparent PV
For mono-crystalline semi-transparent PV glazing, the mono-crystalline solar
cells on the laminate are spaced so that the partial light filters through the PV
module and illuminates the indoor space (Figure 2.1). Light effects from these
panels lead to an ever changing pattern of shading in the building itself. The indoor
rooms remain shaded, yet not constrained. Adding layers of glass to the base unit
of a semi-transparent PV glass module can offer thermal insulation (Roberts and

Chapter 2
– 21 –
Guariento, 2009). For mono-crystalline semi-transparent PV glazing, the PVR (PV
coverage ratio) largely controls the transparency of the PV glazing and is thus a
very important parameter.
Figure 2.1 Image of mono-crystalline semi-transparent PV glazing
The PVR determines the solar transmittance of mono-crystalline
semi-transparent PV façades and appears to be an important factor in terms of
window and façade design of BIPV because it controls the amount of solar
radiation through the building envelope, which has an impact on the energy
consumption of the lighting, cooling and heating systems (Vartiainen, 2010;
Miyazaki, 2005; Yun et al., 2007; Nalanie Mithraratne, 2014; Jiang et al., 2008).
Vartiainen (Vartiainen, 2001) found that the façade layout of different proportions
of PV cells and window glazing area will have a significant impact on the overall
benefits on lighting energy savings. Miyazaki (Miyazaki, 2005) found that energy
consumption was minimised with the solar cell transmittance of 40% and a
window-to-wall ratio (WWR) of 50%. Yun et al. (Yun et al., 2007) explored the
overall energy performance of limited combinations of the window ratio and room
depth in a ventilated photovoltaic façade. The above-mentioned studies and other
related studies (Nalanie Mithraratne, 2014; Jiang et al., 2008) indicate that an
optimal PVR exists and should be investigated thoroughly as an important part of

Chapter 2
– 22 –
the design approach in terms of maximising the benefit of the use of a PV system
on the overall energy performance.
Different climate environments would result in different overall energy
savings due to the optimisation of the PVR used on PV façades. In Brazil,
semi-transparent windows save as much as 43% of the energy consumption (Yun et
al., 2007), while in Japan, 55% of the overall energy is saved using a solar cell
transmittance of 40% compared to a normal glazing façade (Wong et al., 2008). In
Singapore, energy savings of 16.7% to 41.3% can be achieved using
mono-crystalline semi-transparent PV façades (Leite Didoné and Wagner, 2013).
Other studies (Ng et al., 2013; Lu and Law, 2013) also suggest that it is important
to consider the impact of the urban and climate environment on the design of
mono-crystalline semi-transparent PV façades.
2.3.2. Amorphous-silicon semi-transparent PV
Different from mono-crystalline semi-transparent PV glazings because the
layer of the amorphous-silicon PV cell is so thin or is laser grooved to enable light
to pass through, filtered light is transmitted through thin-film amorphous-silicon
semi-transparent PV glazings instead of the shadowed light of the mono-crystalline
semi-transparent PV glazings. Semi-transparent thin-film PV modules are
especially appropriate for use as PV façades (Figure 2.2).
Figure 2.2 Image of amorphous-silicon semi-transparent PV glazing

Chapter 2
– 23 –
Studies of amorphous-crystalline semi-transparent PV glazings are relatively
limited. Evelise Leite Didoné (Leite Didoné and Wagner, 2013) investigated the
potential of energy saving and electricity generation of semi-transparent PV
glazings (amorphous-silicon included) of office buildings in Brazil. The study
indicated that it is possible to reduce the energy consumption for artificial lighting
and AC and furthermore to generate energy using amorphous-silicon
semi-transparent photovoltaic panels in windows. The study also provided a
comparison between semi-transparent PV glazing and Low-E glazing, which
proved that Low-E glazing has a better energy performance. Poh Khai Ng (Ng et
al., 2013) performed an energy analysis of semi-transparent PV glazings (several
amorphous-silicon models included) in Singapore. The study revealed the potential
to use amorphous-silicon semi-transparent PV glazings for all orientations in
tropical countries including Singapore. This study specifically indicated that
optimising the WWR with different design strategies is necessary to achieve the
highest electricity benefit for semi-transparent PV glazings (amorphous-silicon
included). In terms of field experimental research, L. Olivieri (Olivieri et al., 2014)
investigated four amorphous semi-transparent PV modules of different
transmittances in Madrid. The study found that the solar protection and insulating
properties of amorphous-silicon semi-transparent PV modules are lower than those
achieved by a reference glazing, whose characteristics are in accordance with the
Spanish Technical Building Code. The electricity conversion efficiency is found to
be minimally affected by the transmittance of amorphous semi-transparent PV
glazings.
2.4.Tools and computational software
2.4.1. Assistant tools and software for the optimal design of a PV system
A large number of assistant tools and software have been developed in recent
years to provide the necessary information for designers and engineers in designing
and simulating PV systems. These tools can be categorised into four types (Norton
et al., 2011):

Chapter 2
– 24 –
Table 2.8 Tools and their features for the optimal design of PV systems
PV f-Chart
For design and analysis PV systems. Predicts monthly
performance of PV system with array efficiency calculated
by cell temperature. Provides long period performance by
weather data.
PVWATTS Simulates PV electricity generation of grid-connected PV
system with internet access (USA only)
PVSYST
Simulation based on database of meteorological and
inbuilt geographical. Using 3D CAD facility for
visualisation. Losses are considered such as wiring losses,
temperature losses, reflection losses etc. Capable of
modelling grid-connected system of different inverters
and load profiles with measured data.
PVSOL
Used for optimization and design of PV systems. Provides
a database of a large PV and inverter manufacturers.
Defined component specifications by users are accepted.
Capable of different PV surface inclinations and
orientations. Performs
SOLCEL-II
Predict PV electricity generation by hourly values such as
normal radiation, air temperature, inplane insolation and
wind speed etc. Simulates hourly performance of PV
system by employing MPPT, voltage regulator and
temperature co-efficiency etc.
TRNSYS
Provides PV system simulation as sequential modular
program. Individual components (empirical or analytical)
can be adopted to perform different simulation needed.
PVFORM
Designed for standalone and grid-connected applications
with inputs such as insolation, air temperature, wind speed
etc. MPPT is also considered in this program with partial
load efficiency.

Chapter 2
– 25 –
(1) Pre-feasibility tools: These tools are used for determining the suitability of
BIPV systems for particular projects. In these tools, BIPV applications are
examined through PV electricity generation and the life cycle cost.
(2) Sizing tools: These tools are used for optimising the size of different parts
of a BIPV system. The determination is based on the purpose and life cycle
cost of the analysed system.
(3) Simulation tools: These tools are used for simulating the detailed
behaviours and performance of a PV system in a given situation.
Information is provided regarding the financial and environmental features
of the analysed PV system.
(4) Open-architecture research tools: These tools are used for adding new
components or modifying existing components into main programs.
To further illustrate the tools and computational software that are most
commonly used for the optimal design of a PV system, several tools and their
features are described in Table 2.8 (Klein and Beckman, 1993; Marion and
Anderberg, 2000; Mermoud, 1995; Hoover, 1980; Klein et al., 1979; Menicucci
and Fernandez, 1989).
2.4.2. Computation simulation tools for energy performance simulations
The energy requirements of a building depend not only on the individual
performance of the envelope components (walls, windows and roofs) and HVAC
and lighting systems but also on their overall performance as an integrated system
within the unique building. For a large commercial building, the complex and
dynamic interactions occurring in the building with its environment and its systems
and plants must be modelled and simulated for analysis. The modelling technique
available to architects, engineers and building managers concerned with energy
conservation is simulation of the building energy use. Energy simulation is a
valuable tool for architects and engineers to evaluate building energy consumption
before the building is built. Alternative designs or materials can immediately be
evaluated to determine how much they affect the annual energy consumption.
Through parametric analyses, professionals can extend their design concepts to

Chapter 2
– 26 –
incorporate new technologies and innovations, thus creating opportunities for
increased energy savings.
Over the decades, a large number of energy simulation programs have been
developed. Some of the more popular simulation packages and their information
are listed below (Hong et al., 2000).
Table 2.9 Building simulation software packages
Program Developer organizations Website
DOE-2 Lawrence Berkeley Laboratory,
USA
(http://eande.lbl.gov/BTP/simul
ations/DOE2.html)
BLAST University of Illinois, USA
ESP University of Strathclyde, UK http://www.strath.ac.uk/D
epartments/ESRU/ESP-r.h
tm)
TRNSYS University of Wisconsin, USA (http://sel.me.wisc.edu/trn
sys/
DEST Tsinghua University, P.R. China http://www.dest.com.cn/
EnergyPlus Department of Energy, USA
http://apps1.eere.energy.g
ov/buildings/energyplus/
Among all of the tools above, EnergyPlus is the one used most often in recent
years. EnergyPlus is a popular building energy simulation program that builds on
the strengths of BLAST and DOE-2. EnergyPlus was written in Fortran 90 with a
structured, modular code that is easy to maintain, update, and extend. The
EnergyPlus source code is open for inspection and is understandable, which
enables developers around the world to develop new modules algorithmic or
interfaces in EnergyPlus.

Chapter 2
– 27 –
Modelling the performance of a building with EnergyPlus enables building
professionals to optimise the building design to use less energy and water. Each
version of EnergyPlus is tested extensively before release. EnergyPlus models
heating, cooling, lighting, ventilation, other energy flows, and water use.
EnergyPlus includes many innovative simulation capabilities: time-steps less than
an hour, modular systems and plant integrated with heat balance-based zone
simulation, multi-zone air flow, thermal comfort, water use, natural ventilation, and
photovoltaic systems (Crawley et al., 2001). In terms of the EnergyPlus structure, it
has three basic components: simulation manager, a heat and mass balance
simulation module, and a building systems simulation module. The simulation
manager controls the entire simulation process. The heat balance calculations are
based on IBLAST, a research version of BLAST with integrated HVAC systems
and building loads simulation. Many studies (Tabares-Velasco et al., 2012;
Andolsun et al., 2011; Rempel et al., 2013; Mateus et al., 2014) have validated
many aspects of the EnergyPlus simulation capabilities, including thermal
calculation, daylighting simulations, and ventilation simulation, with measured
data. The validations provided in the mentioned studies and references have
shown that Energy Plus is relatively reliable in general conditions. In terms of
particular studies of BIPV((Leite Didoné and Wagner, 2013; Ng et al., 2013;
Miyazaki et al., 2005; Wong et al.,2008), Energy Plus has also been used widely as
it provides an excellent access to architecture modelling tools like SketchUP,
which is very useful for architects to create the needed architecture models for
simulations. The use of Energy Plus in BIPV studies seems to indicate the
reliability of its results. However, in a given simulation condition, different settings
of the boundary conditions could lead to a slightly varied result and such limitation
should be carefully considered, which however could be solved by carried out more
validation tests of the results under the exact boundary conditions of the needed
simulation conditions.However, no simulation tool, not even EnergyPlus, exists
that provides the calculation models for semi-transparent PV glazings. Special
modification based on existing tools is required for simulation of the overall energy
performance of semi-transparent PV glazings.

Chapter 2
– 28 –
2.5. Conclusions
In this chapter, contributed studies and knowledge were reviewed in terms of
four categories. Important discoveries and conclusions by previous studies were
acknowledged and considered thoroughly, which enabled several conclusions to be
made:
(1) BIPV is in great demand and has a promising future in China, with the
significant advantages of the production market and government policy.
(2) Building façades have been recognised to have multiple significant
impacts on the overall energy performance, including daylighting and
heating and cooling electricity consumption. Parameters such as WWR,
Room depth, U-value, and SHGC significantly impact the overall energy
performance. Many studies have been performed to develop strategies to
optimise the parameters to achieving a better energy performance.
(3) Studies of the two main types of semi-transparent PV glazings primarily
focus on the impact of transmittance/PVR/WWR on energy performance.
Different strategies related to optimal transmittance have been made to
achieve a better energy performance.
(4) There are varied computational tools specifically designed for the
installation of PV systems on building roofs. In terms of computational
simulation tools, EnergyPlus is capable of simulating overall energy
performance and is acknowledged as reliable and is often applied in
academic studies.
However, few studies to date have attempted a comprehensive determination
of the optimal PVR/WWR for semi-transparent PV technology using different
combinations of architectural factors, such as room depth, WWR and orientation.
Accordingly, no general trends have been defined regarding variations in optimal
PVR. Such knowledge will play a crucial role in future optimal design approaches
for semi-transparent PV façades; as a result, improvements in the understanding of
the variation in PVR are urgently required. In particular, previous studies providing
accurate assessments of the overall energy performance of semi-transparent PV
façades in China are extremely limited, and few relevant experiments have been

Chapter 2
– 29 –
conducted under the climatic conditions similar to those in central China. Studies
conducted under real climatic conditions are necessary because several studies
investigating semi-transparent PV in different climate zones have produced
different results.

Chapter 3
– 30 –
Chapter 3 Experimental room set-up and
field measurement

Chapter 3
– 31 –
The determination of performance for semi-transparent PV façade requires the
tests are conducted in the outdoor environment. The experimental room allow the
semi-transparent PV glazing to be tested in realistic, but controlled, conditions.
This is important for achieving the electrical, thermal and optical characteristics of
the PV glazings.
The aim of this chapter is to demonstrate the experimental study involved a
series of field measurements using an experimental room with the semi-transparent
PV façades in realistic climate conditions of Wuhan, China. In Section 3.1, the
experimental rooms for studying building components used by previous researchers
are reviewed, and the knowledge and experience gained from such experimental
rooms are introduced. Next, the experimental methodology in our research is
presented in Section 3.2 and Section 3.3, with the descriptions of layout of the
experimental room, the parameters of the PV modules used in the test, and the
measurement equipment and arrangements. Finally, the general field measurement
results are presented in Section 3.4.
3.1. The motivation of experimental room set-up
3.1.1. Review of previous experimental room
To provide high-quality test environments for evaluating the energy
performance of building components under realistic climate conditions, some
experimental rooms were constructed by previous researchers over the past
decades. During the testing of a broad range of building components, the
experimental procedures and measurement techniques have been developed and
improved gradually. The two important cases of experimental rooms are described
and the successful methodologies on the use of these experimental rooms are
summarised in subsequent paragraphs.
(1) MoWiTT for thermal performance of windows
Klems (1984) constructed and calibrated an experimental room called
MoWiTT (Mobile Window Thermal Test) at Lawrence Berkeley Laboratory in the
U.S. The U-value and G-value of the building components, the two characteristic
parameters of the thermal and solar-optical transmittance, were determined using
careful measurements under realistic field conditions in MoWiTT (Klems, 1988a;

Chapter 3
– 32 –
Klems and Keller, 1987). Consisting of dual, guarded, room-sized calorimeters in a
mobile structure, the MoWiTT is capable of simultaneously exposing two
fenestration samples, each experiencing a room-like interior environment, to
ambient outdoor weather conditions and of measuring the net heat flow through
each fenestration with good accuracy.
Figure 3.1 Section of MoWiTT
Figure 3.2 Image of MoWiTT

Chapter 3
– 33 –
MoWiTT was also applied to the validation work of a glazing simulation
package, WINDOW. The experimental results from MoWiTT and the simulation
results from WINDOW exhibited good agreement in the studies of Klems (Klems,
1988a; Klems, 1988b).
(2) PASLINK test cell
Funded by the European Commission research projects, the PASLINK test
cells that can provide high-quality test environments were established to quantify
the performance of a passive solar building. All types of building components,
including advanced glazed components, window components, synergy façade, air
supply window, conservatory, shading elements, ventilated roof, hybrid PV
ventilated façades, façade heating system and solar collectors, had been tested in
the experiment room of PASLINK (Strachan and Vandaele, 2008).
Many European laboratories, such as the Belgian Building Research Institute
at Limelette, Belgium, the Building Research Establishment in East Kilbride,
Scotland, the Fraunhofer Institute, Germany and Pilkington in Lathom, England
established experimental rooms.
One example of the PASLINK test cell was constructed in Porto, Portugal, to
investigate the energy performance of the SOLVENT window under local climate
conditions. The test cell was equipped with a so-called pseudo-adiabatic shell
(PAS), which limits the heat loss through the floor, roof and walls to a very low
and precisely quantifiable value. A large amount of environmental parameters were
recorded systematically, which included global and diffuse solar radiation, outdoor
air temperature, relative humidity, wind speed and direction. The PASLINK test
cell is equipped with instrumentation to measure parameters related to the
SOLVENT window, including glazing temperature at each glazing surface, air
temperature in the open air channel, velocity of the air at the centre of the air gap,
and air temperature at various points inside the test cell. The tests were performed
in both summer and winter. Each configuration of the SOLVENT window was
monitored for at least one week, with each week including at least two days with a
clear sky. During the monitoring period, the test room temperature was maintained
at 23.5±0.5 ℃ by a heating and cooling system (Lea and Maldonado, 2008).

Chapter 3
– 34 –
With the data collected in the experiment room, the models of the SOLVENT
window were developed to evaluate the energy savings in the applications of
innovative building components to realistic buildings.
Figure 3.3 Image of the PASLINK test cell for the SOLVENT window
(3) Summary of the experimental room
Although the construction and development of an experimental room is
expensive and time-consuming, such work has its unique advantages. The
experimental room provides an evaluation of the visual appearance and the
detection of building details, such as thermal bridges. The availability of an
experimental room established in different climate zones allows the performance of
building components to be verified under local climate conditions.
From the construction and development of an experimental room by
previous researchers, the general methodology of the experimental procedures
and analysis techniques are summarised as follows: (Strachan, 2008)

Chapter 3
– 35 –
First, the suitable size of the building component is designed to fit in the
experimental room.
Second, field experiments record the relevant data for the evaluation of the
building component.
Third,key parameters and indicators of building components acquired from
the experiments are used to develop simulation models.
Fourth, careful validation is performed to confirm the accuracy of the
calculation models with the measurement results.
Finally, the validated models of building components are incorporated into
simulation programs to investigate full-scale building energy performance in the
climate of interest.
3.1.2. General considerations on experimental room and measurement
In this study, to evaluate the performance of semi-transparent PV façades in
actual Wuhan weather conditions, an experimental room was installed on the roof
of a 5-storey building in Wuhan (29°58‘N, 113°53‘E). The field measurement data
were collected to develop and validate the mathematical models of
semi-transparent PV façades, which are presented in the later chapter. For the
above purpose, general considerations on the experimental room and the
measurements performed are listed below.
(1) The experimental room should be located in a location free from shading in
Wuhan.
(2) The PV glazing should be fixed on the south façade of the experimental
room.
(3) There should be two equivalent units in the experimental room so that the
performance of two PV glazings on the façade can be recorded for a
comparative study.
(4) To investigate the energy performance of the two units with PV façades,
each unit should be designed as a separate chamber.

Chapter 3
– 36 –
(5) The experiment should be conducted for a long period, i.e., greater than 12
months, and the field-measured data should be systematically recorded in a
proper interval time.
(6) To acquire the essential parameters pertaining to the electrical, thermal and
optical characteristics of the PV glazings, data from field measurements
should include temperature, illuminance, PV generating electricity and solar
radiance, among other parameters.
(7) The requisite methods should be taken to guarantee the necessary precision
and accuracy in the measurements.
The details regarding the experimental room set-up and the field measurements
are described below.
3.2. Experimental room set-up
3.2.1. Layout of the experimental room
An experimental room containing two inner and separate chambers to
determine the PV glazing performance for two glazings simultaneously was set up
on a flat roof of the building in the campus of Huazhong University of Science and
Technology. There are no nearby buildings and trees in the south of the
experimental room; therefore, the tests were not influenced by shading. The
experimental room had a length, width, and height of 4.65 m, 3.4 m, and 3.6 m,
respectively, and was constructed using mineral wool board with a thickness of 12
mm as the thermal insulation of the walls. The experimental room contained two
inner chambers sharing a guarded room, each of which included a window that was
1.1 m long and 1.3 m high on the southern vertical façade. The windows were
designed as a changeable system by which different types of glazing components
could be fixed on the window. The plan, section and photo of the experimental
room are shown in Figure 3.4 to Figure 3.6. A detailed description of the
experimental room is presented in Table 3.1.
The author of the thesis is the prime investigator of the experimental study.
The author designed the layout of experimental room, set the experimental
schedule and organized all kinds of tasks in the experiment. The workers from

Chapter 3
– 37 –
Wuhan Lingyun Building Decorative Engineering Company Ltd. built up the
experimental room. Some students of Huazhong university of Science and
Technology installed the glazing on the facade and collected the measured data
during the experimental period.
(a)
(b)
Figure 3.4 Layout of the experimental room
(a) Plan, (b) Section

Chapter 3
– 38 –
Figure 3.5 Image of the experimental room
Table 3.1 Descriptions of the experimental room
Dimensions of the
experimental room
4.65m×3.4m×3.6m
(length×depth×height(from front))
Dimensions of the inner
room 1.34m×2.4m×3.0m (length×depth×height)
Dimension of the window 1.1m×1.3m (length×height)
Window area 1.43m2
Wall material Mineral wool board (thermal insulating
material) thickness: 12mm
Construction structure Steel
Special design Break the heat bridge
Inner room temperature
control ―GREE‖ air-conditioning, power: 1.25W

Chapter 3
– 39 –
3.2.2. Properties of the PV glazings
Four types of PV glazing modules were studied in the test. They are fixed on
the window one-by-one for different test groups for their performance comparison
against each other. The properties of the PV glazing modules, which were provided
by the respective manufacturer company, are listed below. Three of the PV
glazings are semi-transparent, and the fourth PV glazing is opaque. To ensure the
airtightness between the PV glazing and the widow frame, every time when the PV
glass got replaced, a cover plate together with full-length rubber seals on each edge
is used, by which it is considered as airtight state. Both the Two inner chambers are
preceded with the same method to ensure the same identity of the two rooms.
Table 3.2 Descriptions of the four PV glazings considered in the study
PV glazing code PV-1 PV-2
PV glazing type Monocrystalline semi-transparent PV
Dimensions 1.1m×1.3m(length×height)
Layers of the
glazing
(external to
internal)
6mm super white tempered glass (low iron tempered
glass)-EVA- monocrystalline solar cells-EVA-6mm
semi-tempered glass
Dimensions of
the solar cells
Number: 6×6
(series×parallel)
Size: 156mm×156mm
Number: 6×6
(series×parallel)
Size: 125mm×125mm
Solar cell area 0.8761m2 0.5625 m
2
Solar cell ratio
of the PV
glazing
61.3% 39.3%
Reference output
power 140W 95W
Operating
voltage 18.45V 18.74V
Operating 7.588A 5.069A

Chapter 3
– 40 –
current
Open circuit
voltage 21.23V 21.97V
Short circuit
current 8.793A 5.765A
Picture
Effective
transmittance
(visible light)
35% 60%
Manufacturer CSG Holding Co., Ltd. (China)
Weight 44.5kg
Total thickness 12mm
PV glazing code PV-3 PV-4
PV glazing type Amorphous-silicon
semi-transparent PV
Amorphous-silicon opaque
PV
Dimensions 1.1m×1.3m(length×height)
Layers of the
glazing
(external to
internal)
6 mm super white tempered
glass (low iron tempered
glass)-EVA- Amorphous
-silicon thin film-EVA-6
mm semi-tempered glass
6 mm super white
tempered glass (low iron
tempered glass)-EVA-
Amorphous-silicon thin
film-EVA-6 mm opaque
glass
Dimensions of
the solar cells 1.1m×1.3m(length×height)

Chapter 3
– 41 –
Soar cell area /
Solar cell ratio
of PV glazing /
Reference output
power 75W 150W
Picture
Effective
transmittance
(visible light)
20% 0%
Manufacturer CSG Holding Co., Ltd. (China)
Weight 44.5kg
Total thickness 12mm
3.3. Measurement equipment and arrangements
3.3.1. Measurement equipment
The field experiment was conducted 24 h a day from June 2012 to August 2013.
The equipment included a thermocouple, luxmeter, pyranometer, and power
recorder used to collect the series of data of temperature, illuminance, solar
irradiance, and PV output power, respectively. All of the above data were acquired
by a data logger with the interval of 1 minute all throughout the experimental
period and were sent to the computer nearby for storage. General data describing
the weather conditions were recorded at hourly intervals using the Davis Vantage
Pro 2 weather station. All of the pieces of measurement equipment are listed in
Table 3.3.

Chapter 3
– 42 –
Table 3.3 Descriptions of measurement equipment
Device Specification and
Manufacturer Measurements
Pyranometer Jinzhou Sunshine ,
TBQ-2,China
Horizontal and vertical
total solar irradiance
Luxmeter TES , TES-1339R ,
Chinese Taiwan
Indoor and outdoor
illuminance
Thermocouple T type thermocouple,
China
Glazing surface and air
temperature
Power recorder Agilent, 34972A,
USA
PV output current and
voltage
Data logger Agilent, 34972A,
USA Data acquisition
Weather station Davis, Vantage Pro
2,USA
Ambient temperature,
barometric pressure,
humidity, wind
velocity- and direction.
3.3.2. Arrangements of the temperature measurement
A total of 12 T-type thermocouples were used to measure the temperature on both
the inside surface and the outside surface of the PV glazing and the ambient
temperature of the inner room, the guarded room and the outside of the
experimental room. All of the thermocouples were connected to a Data Acquisition
apparatus, Agilent 34972A, made in the USA. The simultaneous temperature data
were captured once per minute and were sent to a computer through a network
cable. These thermocouples were calibrated by placing them together with a
standard mercury thermometer (with precision of 0.1°C) into a thermostatic water
bath of temperature ranging from 0 °C to 100 °C. Through this calibration, the
accuracy of the thermocouples was improved to ±0.1 °C, which meets the test
requirements. The arrangement of the temperature measurement points is presented
in Figure 3.6. To avoid the unnecessary solar heat gain from solar radiation on the

Chapter 3
– 43 –
thermocouple of the outer surface, a small opaque aluminum foil is used to block
the solar radiation and prevents it from heating up the thermocouple. Since the
touch point of thermocouple is very small, it is considered that the opaque
aluminium could effciently avoid the unnecessary solar heat for the thermocouple
while it barely affects the heat transfer process and the temperature of the PV glass.
Figure 3.6 Arrangement of the temperature measurement points
3.3.3. Arrangements of the solar irradiance measurements
Figure 3.7 Arrangement of the solar irradiance measurement points

Chapter 3
– 44 –
TBQ-2 pyranometers with an accuracy of ±5% manufactured by Jinzhou
Sunshine, China, were installed on each of the east, south, west and north facing
façades and were used to measure the global solar irradiance on the four vertical
planes. Two pyranometers were installed on the flat roof of the experimental room
as a group. One pyranometer was used to measure the global solar irradiance on
horizontal plane, and the other pyranometer nearby, which was fitted with a
shadow ring to block the direct sun, was used to measure the diffuse solar
irradiance on the horizontal plane. The ring has a polar axis design requiring
adjustment for solar declination every few days. The pyranometers were connected
to the Agilent 34972A apparatus, and the exact solar irradiance data were
calculated using the measured voltage sent from the pyranometers to the Agilent
34972A and the sensitivity of each pyranometer. The data were recorded at the
interval of 1 minute and sent to the computer for storage-. The pyranometer device
was calibrated by the manufacturer before performing the experiments, and the
sensitivity of each pyranometer was labelled on the instrument. The arrangement of
the solar irradiance measure points is presented in Figure 3.7, and an image of the
group of pyranometers on the horizontal roof is shown in Figure 3.8. The
specifications of the pyranometer are presented in Table 3.4.
Figure 3.8 Image of the group of pyranometers on the experimental room roof

Chapter 3
– 45 –
Table 3.4 Specifications of the TBQ-2 pyranometer
Specification TBQ-2
Sensitivity 7-14μV/( W/m-2)
Wavelength range 0.3-3.0μm
Accuracy of measurement ±5%
Measurement range 0-2000W/m-2
Response time 30 sec (99%)
Weight 2.5kg
3.3.4. Arrangements of the PV output power measurements
Because the maximum of the PV output power varies according to the solar
irradiance, the maximum power point is changing constantly under real weather
conditions. The maximum power, determined by the optimal voltage multiplied by
the corresponding current, is the point determined by the MPPT. In this test, MPPT
systems were used to track the maximum power point of PV panel through the
control of the Perturb and Observe (P&O) algorithm, by which the MPPT system
could attain high accuracy. The Agilent 34972A instrument collected the voltage
and current of each PV glazing every minute throughout the test period.
3.3.5. Arrangements of the daylighting illuminance measurements
Figure 3.9 Arrangement of the illuminance measurement points

Chapter 3
– 46 –
Table 3.5 Specifications of the TES-1339R luxmeter
Specification TES-1339R
Measurement range 4 efficient digit reading(99.99lx,
999.9lx, 9999lx, 99990lx, 999900lx)
Accuracy of measurement ±3%
Temperature characteristic ±0.1%/°C
Sampling rate 5 times/sec
Weight 320g
Likewise, the arrangement of the illuminance measurement points is presented
in Figure 3.9. The measurements of illuminance are obtained by luxmeters
(TES-1339R) manufactured and calibrated by TES Electrical Electronic Corp.,
Taiwan, China. The two luxmeters were fixed in the centre of the inner chamber
and at a height of 0.75 m, which is as high as a work desk in a general office, to
record the indoor illuminance. Another luxmeter was installed in a glass box on the
roof of the experimental room to determine the outdoor illuminance. The three
luxmeters were connected to a computer directly through an RS232 cable. The
artificial lighting sources were switched off during the daily tests, and the
illuminance data by luxmeter were recorded once per minute. The inner wall and
ceiling of the chamber were in the colour of creamy white and the floor was in the
colour of grey, resembling a typical office environment. The specifications of the
luxmeter are presented in Table 3.5.
3.3.6. Other arrangements

Chapter 3
– 47 –
Figure 3.10 Image of the building orientation calibration process
Figure 3.11 Orientations analysis by GIS devices
Using the GIS devices, the orientation of the y-axis of the building where the
experimental room is located is 5° east of due north. Thus, we moved the
orientation of the experimental room to 5° west of due north with respect to the
y-axis of the building, making the orientation of experimental room due south. The
processes in the calibration of the orientation of the building are shown in Figure
3.10 and Figure 3.11.

Chapter 3
– 48 –
3.4. General measurements in the field experiments
The field experiment was conducted 24 h a day from June 2012 to October
2013. In the entire period, four types of PV glazings were individually installed on
the southern façade of the experimental room. The general measurements in the
field experiments are presented below. In a year of continuous experimental
measurements, both mono-crystalline silicon PV glazing and the amorphous-silicon
PV glazing were tested on the south wall with more than two-week period for each
of the four seasons, including sunny and cloudy days.
3.4.1. Solar irradiance measurements
The total irradiance of the horizontal surface and the vertical surface of the
eastern, southern, western and northern orientations were recorded every minute for
the period of more than one year. In addition, the horizontal diffuse irradiance was
also collected at the same time. The measurements of four sunny days of spring,
summer, autumn and winter were selected to present the general tendency and
characteristics of solar irradiance in different directions in Wuhan. As shown in
Figure 3.12, the southern vertical total solar irradiance is as much as half of the
horizontal total solar irradiance in 2013/4/17, a sunny day in spring, and is as much
as one-third of the horizontal total solar irradiance in 2012/7/24, a sunny day in
summer. However, the southern vertical total solar irradiance is slightly larger than
the horizontal total solar irradiance in 2012/11/11, a sunny day in autumn, and that
in 2013/1/13, a sunny day in winter. The maximum solar irradiance at noon
reached approximately 300 W/m2, 200 W/m
2, 700 W/m
2 and 600 W/m
2 on the
sunny day in spring, summer, autumn and winter, respectively. These results
implied that solar energy for the southern façade in autumn and winter should be
studied for better utilisation.
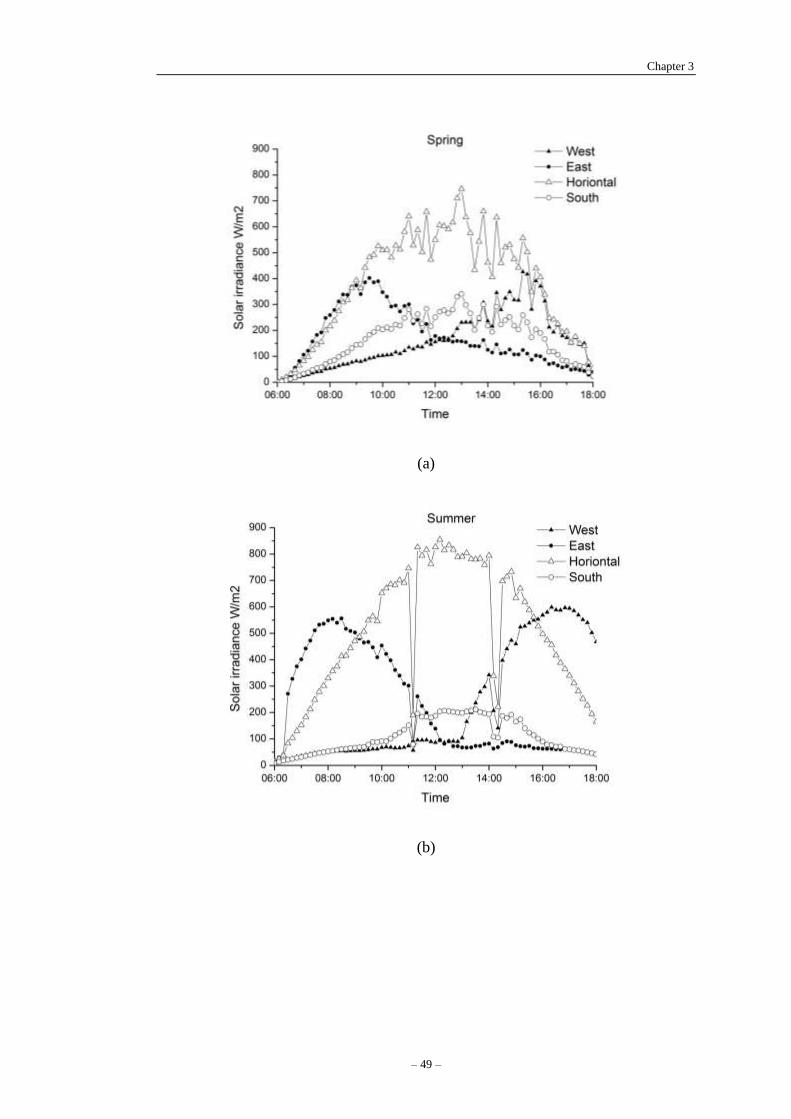
Chapter 3
– 49 –
(a)
(b)

Chapter 3
– 50 –
(c)
(d)
Figure 3.12 Measurement of total solar irradiance of various orientations
(a) data from 2013/4/17, a sunny day in spring; (b) data from 2012/7/24, a sunny
day in summer; (c) data from 2012/11/11, a sunny day in autumn; (d) data from
2013/1/13, a sunny day in winter.

Chapter 3
– 51 –
(a)
(b)
Figure 3.13 Measurements of solar horizontal total irradiance and diffuse irradiance
(a) data from 2013/8/7, a sunny day; (b) data from 2013/9/10, a cloudy day

Chapter 3
– 52 –
The daily horizontal total solar radiance and the horizontal diffuse irradiance
are plotted in Figure 3.13. On a sunny day, the diffuse solar irradiance accounted
for a small part of the total solar irradiance. On a cloudy day, the diffuse solar
irradiance was generally equal to the total solar irradiance. The measurements of
the horizontal total solar radiance and the horizontal diffuse irradiance were applied
to the validation studies in Section 4.3.3.
3.4.2. PV generation power and PV temperature measurements
Figure 3.14 shows the records from 2013/4/17, one day selected randomly in
the experimental period, when the mono-crystalline semi-transparent PV glazing,
denoted PV-2, and the amorphous-silicon semi-transparent PV glazing, denoted
PV-3, were installed on the façades of both rooms for comparison. The daily solar
irradiance on southern vertical façade and the generation power of both
semi-transparent PV glazings are plotted in Figure 3.14 (a), which reveals the
identical tendency of the three curves. Figure 3.14 (b) reveals that the PV
generation power had a linear dependence with the solar irradiance on the PV
module.
(a)

Chapter 3
– 53 –
(b)
Figure 3.14 Measurements of solar irradiance and PV generation power
Figure 3.15 shows the measurement of the PV temperature and the calculation
of the PV conversion efficiency from the measurement of the PV generation and
solar irradiance. According to the measurement data, the equations that indicate the
correlation of PV generation power and solar irradiance and the correlation of PV
efficiency and PV temperature will be discussed in the Section 4.2.2. The data of
figure 3.15 is from the measurements of August 4, 2012.
(a)

Chapter 3
– 54 –
(b)
Figure 3.15 The PV efficiency and the PV temperature
Table 3.6 Parameters of four PV glazings
PV
coding Type of PV module
PV conversion
efficiency (STC)
Temperature
coefficient
PV-1
mono-crystalline
semi-transparent PV modules
(60% coverage of PV cells)
14.7% 0.69%
PV-2
mono-crystalline
semi-transparent PV modules
(40% coverage of PV cells)
14.0% 0.72%
PV-3 amorphous-silicon opaque PV
modules 7.8% 0.23%
PV-4 amorphous-silicon
semi-transparent PV modules 4.9% 0.21%

Chapter 3
– 55 –
(PV electricity generation coefficient is calculated by the average value from the
data recorded from eight random days (two from each season))
Four types of PV glazings were successively installed on the southern façade
in the experimental period; based on these measurements, the parameters of the PV
properties for the four types of PV glazing were calculated, as presented in Table
3.6. Temperature coefficients obtained by previous researcher were 0.59% for
crystalline-silicon PV and 0.16% for amorphous-silicon PV (Wong et al., 2005).
This parameters obtained from the field experiment in this study agree reasonably
well with the results of previous research work.
3.4.3. Daylighting illuminance measurements
Daylighting can be introduced to an indoor room by using a semi-transparent
PV façade. The illuminance on the horizontal surface of the indoor room with a
mono-crystalline semi-transparent PV façade and the illuminance on the outdoor
horizontal surface are plotted in Figure 3.16 (data from 2013/10/24). Figure 3.16
(a) shows the generally identical tendency for the outdoor and the indoor
illuminance values;Each point on the figure represents both indoor (as Y-axis) and
outdoor (as X-axis) luminance level. The linear dependence of the indoor
illuminance and the outdoor illuminance can be observed in Figure 3.16 (b).

Chapter 3
– 56 –
(a)
(b)
Figure 3.16 Measurements of daylighting illuminance

Chapter 3
– 57 –
3.5. Conclusions
To evaluate the energy performance of PV façades in the realistic local
climate, the experimental room with two inner and separate chambers was set up on
the flat rooftop of a building in Wuhan. Several types of PV glazing were
successively installed on the southern vertical façade of the experimental room for
field measurements. In addition, the methodology of measurement and calibration
was developed to achieve the vital data. The experiment room was equipped with
instrumentations to record a broad range of data for over a year, including
temperature, solar irradiance, illuminance and PV generation power. The collected
data were used to validate the calculation models of PV façades in the Chapter 4
and Chapter 5.
With smart design, skillful construction, durable measurement and careful
calibration in the experimental room, the systemically measured and recorded data
of environmental parameters and the parameters that are related to PV façades was
verified to be effective and valid. The PV façades parameters achieved from the
field experiment in this study agree reasonably well with the results of previous
works of other researchers. In addition, the establishment of the experimental room
can be considered an achievement in this study because not only it provided
high-quality data in the realistic local climate but also the experimental procedures
and measurement techniques were developed and gained in the process.

Chapter 4
– 58 –
Chapter 4 Climate, solar irradiance and
estimation of annual power generation
of PV façades in China

Chapter 4
– 59 –
Building energy consumption, as well as the generated electrical energy of
BIPV façades, is related to the climate and solar irradiance, which vary from
location to location and from year to year. This chapter commences by discussing
the climate and solar irradiance and their relevance to the power generation of PV
façades, and then estimates the annual power generation of PV façade with
validated models and typical year weather database in China.
In Section 4.1, the thermal climate zones and the solar climate zones in China
are described. After the introduction of the Chinese Standard Weather Data
(CSWD) that is the widely used for the typical year weather data in mainland
China, the thermal climate and solar climate of Wuhan are presented using the
CSWD. In Section 4.2, the calculation methods of solar irradiance on an inclined
surface and PV generation power based on operating temperature are explained.
The recorded data from the experimental room are used to validate the calculation
methods. The measured results and calculated results exhibited a good agreement
in the validation study. In Section 4.3, along with the validated calculation methods
and the typical year weather data of the CSWD, parametric studies are performed
on the estimation of the annual power generation of PV façades in China.
4.1. Climate and solar irradiance
4.1.1. Thermal climate zones and solar climate zones in China
Building design and energy use in the built environment are directly related to
the local climate, and the specific electrical power yields via feasible application
with PV façades are associated with the local solar resource. The thermal climate
and solar climate in China are presented as follows.
China is a huge country, covering approximately 9.6 million square kilometres.
Approximately 98% of the land area stretches between a latitude of 20◦N and 50◦N,
from the subtropical zones in the south to the temperate zones (including
warm-temperate and cool-temperate) in the north (Chao, 1986; Zhang and Lin,
1992). China also has a complex topography, ranging from mountainous regions to
flat plains. Due to the large area and complex topography, the climate in China
differs from region to region.

Chapter 4
– 60 –
There are different ways to classify climate regions or zones in terms of the
different purposes of the different criteria. For the consideration of building thermal
design, five thermal climate zones, namely Severe Cold, Cold, Hot Summer and
Cold Winter, Mild, Hot Summer and Warm Winter, are commonly used in China.
The zoning criteria are mainly based on the average temperatures in the coldest and
hottest months of the year. The numbers of days that the daily average temperature
is below 5 °C or above 25 °C are counted as complementary indices for
determining the zones. Figure 4.1 shows the geographical layout of the thermal
climate zones of China (CSBTS and MCC, 1993).
Figure 4.1 Thermal climate zones of China
At the same time, the solar energy resource exhibits a large amount of potential
and unequal distribution in China. For the consideration of solar insolation, four
solar climate zones are widely used in China: I rich area (over 6700 MJ/(m2a)), II
moderate area (5400-6700 MJ/(m2a)), III utilisable area (4200-5400 MJ/(m
2a)) and

Chapter 4
– 61 –
IV poor area (less than 4200 MJ/(m2a)). Figure 4-2 shows the geographical layout
of the solar climate zones of China (Shen and Zeng, 2005).
Figure 4.2 Solar climate zones of China
4.1.2. Typical year weather database in China
The hourly and daily weather parameters, including temperature, solar
irradiance, wind direction and speed and humidity, vary from year to year;
therefore, the weather database of a typical year is required to provide the data
representative of the prevailing climatic conditions and weather patterns for the
specific location (Smart and Ballinger, 1984). Serving as input for driving the
calculation models within the simulation tools, the typical year weather database is
necessary for the building energy simulations and analyses that are widely applied
by engineers, architects, and researchers to determine the building energy
efficiency and to optimise the building design. The typical year weather database is
selected to be the data of a single year of 8760 hourly data selected from the
multi-year datasets that satisfy the statistical tests (Yang et al., 2007).
There are different types of typical years that are involved with weather data
sources, weather formats and methods. For example, the Test Reference Year

Chapter 4
– 62 –
(TRY) is one of the earliest, which was established by the American Society of
Heating, Refrigerating and Air-conditioning Engineers (ASHRAE) in 1976 (NCC,
1976). Later, the Typical Meteorological Year (TMY) was developed by Sandia
National Laboratories in the United States (NCC, 1981).
The TMY is the accepted method for generating a typical year and is widely
used by many countries and areas, including the U.S. (Hall et al., 1978), Canada
(Siurna et al., 1984), and Greece (Pissimanis et al., 1988) In Hong Kong, China, a
great amount of research studies have been performed to obtain typical weather
year data using the two methods of TRY and TMY (Hui and Lam, 1992; Lam et
al., 1992).
In mainland China, the Chinese Standard Weather Data (CSWD) is widely
used for typical weather data; the CSWD were developed by Dr. Jiang Yi of the
Department of Building Science and Technology at Tsinghua University and the
China Meteorological Bureau (CMB et al, 2005). The CSWD consists of a set of
270 typical hourly data weather files that were used for simulating the energy use
in buildings and calculating the renewable energy utilisation by researchers in
China (Yu et al., 2009).
The Department of Energy (DOE) in the United States provided the weather
data files that can be used in the EnergyPlus Energy Simulation Software (DOE,
2014). The weather data for China, which were derived from the source of CSWD,
are available on the DOE website. The typical weather files that were used in
Chapter 4 and Chapters 5-8 of this thesis were from a CD-ROM file in the CSWD
book and from the DOE website, respectively. These two datasets are the same
regarding the weather data source and different regarding the weather data format.
4.1.3. Thermal climate and solar climate in Wuhan
Wuhan was selected as the location where the energy performance of feasible
BIPV is studied in this thesis; the general information and comparative analysis of
the thermal climate and the solar climate in Wuhan are presented in this section.
Wuhan is located in the middle of China, with a latitude of 29°58′-31°22′N, a
longitude of 113°41′-115°05′E and an area of 8,494 km2. Wuhan is situated at the
confluence of the Hanshui and Yangtze Rivers along the middle reaches of the

Chapter 4
– 63 –
latter. The location of Wuhan, together with its subtropical monsoon climate,
enables hot air to collect and become difficult to dissipate. Thus, Wuhan deserves
its reputation as being one of the ―Three Furnaces of China‖.
Figure 4.3 shows plots of the daily average, maximum and minimum ambient
temperature in Wuhan from the weather files of the CSWD from January to
December. Spring is quite short in Wuhan and begins in March, with the rapid rise
of temperature, even to a maximum of above 20 ℃. Summer is very hot and
humid, continuing for a long period from May to September. Midsummer starts in
July. The maximum temperature during this time mostly stays at 37-39 ℃ during
the day, yet the minimum is still high at night, generally at 28℃. Autumn starts
after October, with temperature gradually declining and the air becoming dry. The
average temperature is 20-25 ℃, but sometimes it can reach 30 ℃ or above in
autumn. Autumn quickly transitions into winter, as long as there is cold air coming
from the north, leading to a rapid decrease in the temperature. Winter begins at the
end of December and runs through the next February, with an average temperature
in the range of 1-3℃. When there is fine weather, the temperature can be as high as
7-8 C; however, when there is a cold wave or sleet, the temperature is usually
below the freezing point. Winter in Wuhan is very cold and, although the
temperature is not as low as in some northern cities, the wind-chill from the river
winds and the high humidity makes it feel colder, and temperatures can drop to
-5 °C.
(a)January (b)February

Chapter 4
– 64 –
(c)March (d)April
(e)May (f)June
(g)July (h)August
(i)September (j)October

Chapter 4
– 65 –
(k)November (l)December
Figure 4.3 Daily average, maximum and minimum temperatures of Wuhan
Table 4.1 Latitudes of four Chinese cities
City Wuhan Shanghai Beijing Guangzhou
Latitude 30.39°N 31.22°N 39.92°N 23.11°N
Climate
zone
Hot Summer
and Cold
Winter
Hot Summer
and Cold
Winter
Cold
Hot Summer
and Warm
Winter
Figure 4.4 shows the monthly average temperature of four Chinese cities,
namely Wuhan, Shanghai, Beijing, Guangzhou, from January to December. The
temperature curves of Wuhan and Shanghai are very close to each other because
both of them are located in the same climate zone. The monthly average
temperature of Wuhan in January is higher than that of Beijing by 10°C and lower
than Guangzhou by 10°C. The monthly average temperature of Wuhan in July is
the highest in the four cities, at 30°C. From the this figure, Wuhan can be
regarded as the typical city for central China in climate, where building design
for energy efficiency and thermal comfort in buildings should be considered
carefully regarding the Hot Summer and Cold Winter climate.

Chapter 4
– 66 –
Figure 4.4 Monthly average temperatures of four Chinese cities
Five worldwide cities at latitudes similar to that of Wuhan were selected for
comparison with the monthly average temperature. As shown in Figure 4.5, the
maximum average temperature of Wuhan in summer is the highest one of the five
cities. Compared with Kagoshima and Atlantic, the Wuhan minimum average
temperature in winter is close to approximately 5°C, while the Wuhan maximum
average temperature in summer is higher than those of Kagoshima and Atlantic by
5°C. For cities in the latitude of approximately 30°N, where the winters are as cold
as Wuhan, the summer is found to be no hotter than that in Wuhan. Compared with
Cairo and Houston, the Wuhan maximum average temperature in summer is higher
than those of Cairo and Houston by 2°C, while the Wuhan minimum average
temperature in winter is lower than those of Cairo and Houston by 10°C and 6°C,
respectively. For cities in the latitude of approximately 30°N, where the summer is
not hotter than that in Wuhan, the winter is found to be much warmer than the
winter in Wuhan. From this figure, the weather condition in Wuhan is found to be
more extreme compared to other areas of the same latitude around the world.

Chapter 4
– 67 –
Table 4.2 Longitude and latitude of five worldwide cities
City Wuhan Cairo Kagoshima Houston Atlantic
Country China Egypt Japan U.S. U.S.
latitude 30.39°N 30.04°N 31.59°N 29.76°N 33.74°N
longitude 144.3°E 31.23°E 130.55°E 95.36°W 84.38°W
Figure 4.5 Monthly average temperatures of five worldwide cities
Figure 4.6 shows the column plots of the horizontal total solar irradiance,
horizontal beam solar irradiance and horizontal diffuse solar irradiance in Wuhan
from January to December, which was derived from the weather files of the
CSWD. The total solar irradiance in July and August is the highest over the entire
year, reaching 151 kWh/m2 and 137 kWh/m
2, respectively, while those in January
and December are the lowest, at only 56 kWh/m2 and 61 kWh/m
2, respectively,
The general tendency of the maximum in summer and minimum in winter also can
be found in the solar beam irradiance and the solar diffuse irradiance. However, the
solar beam irradiance is larger than the solar diffuse irradiance only in three
months, specifically May, June and July.

Chapter 4
– 68 –
Figure 4.6 Monthly solar irradiance in Wuhan
4.2. Calculation methods for annual power generation of PV façades
According to the definition of the Photovoltaic Cell Conversion Efficiency, the
power generation of PV can be written as equation (4.1)
( )dP t AG (4.1)
where Pd is the DC electrical power of PV generation, η is the PV cell
conversion efficiency, A is the aperture surface area of the PV cell, and G is the
solar irradiance.
In a certain time, the DC electrical energy E of PV generation can be
calculated from equation (4.2).
( )PV dE P t dt (4.2)
where t is the time in hours.
From equations (4.1) and (4.2), it can be concluded that the actual PV cell
conversion efficiency, η, and the actual solar irradiance, G, are indispensable to
estimate the annual power generation of the PV façade. G is perpendicular to the
surface in the equation 4.1. The calculation methods of both values are discussed in
Section 4.2.1 and Section 4.2.2.
4.2.1. Solar irradiance on the inclined surface

Chapter 4
– 69 –
Because they are installed on the building envelope as façades, the PV
modules are located at different orientations and inclinations to harmonise with the
building appearance. Because solar irradiance is unequally distributed on the
building envelope of different orientations and inclinations, it is necessary to know
the incident solar irradiance on an inclined surface to access the power generation
of the PV façade. There is usually no available measurement for the surface of
interest. Therefore, the irradiance on the inclined surface must be calculated from
the horizontal global and diffuse irradiance values, which are readily available from
the weather stations and the typical weather data.
In general, the total solar irradiance on the horizontal surface includes two
parts: the beam irradiance and the diffuse irradiance. In mathematical form, it can
be written as equation (4.3).
h b dG G G (4.3)
where Gh, Gb and Gd are the horizontal total irradiance, horizontal beam irradiance
and horizontal diffuse irradiance, respectively. The data of three irradiance values
can be obtained from typical weather data.
The total solar irradiance on the inclined surface, Gi, includes three parts: the
beam irradiance on the inclined surface (Gb,i), the diffuse irradiance on the inclined
surface (Gd,i) and the reflected irradiance on the inclined surface (Gr,i). As shown in
equation (4.4), the total irradiation on an incline surface is the sum of the three
parts (Noorian et al., 2008).
, , ,i b i d i r iG G G G
(4.4)
The three parts of the irradiance on an inclined surface can be individually
calculated using the following equations.
First, the beam irradiance on an inclined surface is calculated based on solar
geometry. The beam irradiance on the surface with inclination angle β, Gb,i, can be
calculated using equation (4.5) (Posadillo and López Luque, 2009).
,
cos
sin
ib i b b b
s
G G R G
(4.5)
Rb
is the geometric factor (Rb≥0), i.e., the ratio of beam irradiance on an
inclined surface to the horizontal beam irradiance. θi is the angle of incidence on

Chapter 4
– 70 –
the surface, and αs is the solar elevation. According to the geometry relationship of
the sun, the earth and the incline surface, αs and θi can be calculated using
equations (4.6) and (4.7).
sin sin sin cos cos coss (4.6)
cos sin sin cos sin cos sin cos cos cos cos cos
cos sin sin cos cos cos sin sin sin
i i
i i
(4.7)
where υ is the local latitude, which is 29°58′ N for Wuhan, β is the inclination
angle of the surface, and ω is the hour angle, which represents the angle between
the sun meridian and the local meridian (Iqbal, 1983).
15 ( 12)o t (4.8)
where t is the time in hours with the 24-hour time system, γi is the azimuthal angle
of the inclined surface, which is the angle between the vertical plane that contains
the normal to the wall and the vertical plane that runs north-south, and γs is the
azimuthal angle of the sun. The azimuthal angle is measured from the south and is
negative when the sun is to the east of south but positive when sun is to the west of
south. The solar declination angle, which is denoted by δ, varies seasonally because
of the tilt of the earth on its axis of rotation and the rotation of the earth around the
sun. The declination is zero at the equinoxes (March 22 and September 22),
positive during the northern hemisphere summer and negative during the northern
hemisphere winter. The declination reaches a maximum of 23.45° on June 22
(summer solstice in the northern hemisphere) and a minimum of -23.45° on
December 22 (winter solstice in the northern hemisphere). The declination angle
can be calculated using equation (4.9)
o o23.45 sin 360 (284 ) / 365n (4.9)
where n is the day of the year with January 1 as n=1.
Second, the reflected irradiance describes the reflected sunlight of
non-atmospheric objects such as the ground. To calculate the reflected irradiance,
both the beam and the diffuse radiation are usually assumed to isotropically reflect.
The surface with inclination angle β from the horizontal has a view factor to the

Chapter 4
– 71 –
ground of (1-cosβ)/2. Thus, the reflected irradiance on an inclined surface, Gr,i, can
be calculated from equation (4.10) (Vartiainen, 2000).
,
1 cos( ) ( )
2r i b dG G G
(4.10)
where ρ is the average ground reflectance. In general, the reflectance is assumed to
be 0.2 in the weather condition without snow.
Third, the diffuse irradiance on an inclined surface is difficult to accurately
determine because of the different spatial distribution of the cloud. For entirely
cloudy sky, the diffuse irradiance is isotropically distributed over the sky
hemisphere. The diffuse irradiance Gd,i can be calculated using equation (4.11) (Liu
and Jordan, 1962).
,
1 cos( )
2d i dG G
(4.11)
However, the theoretical overcast sky, which is appropriate for equation (4.11),
does not always occur in practice. Many researchers introduced new mathematical
models of diffuse irradiance on inclined surfaces. Hay proposed an anisotropy
index AI to weigh the circumsolar and isotropic irradiance components. The index
AI is defined in equation (4.12) (Hay and Davies, 1980).
I b oA G G (4.12)
where Go is the hourly extraterrestrial solar irradiation on a horizontal surface. The
calculation method of Go is shown in equation (4.13) (Duffie and Beckman, 1980).
2 12 1
12 3600 360(1 0.033cos )
365
2 ( )[cos cos (sin sin ) sin sin ]
360
o sc
nG I
(4.13)
where Isc is the solar constant, whose suggested value is 1367 W/m2 by the World
Radiometric Center (WRC) (Li et al., 2011).
According to the Hay model (Hay, 1979), the diffuse irradiance on an inclined
surface is calculated from equation (4.14).
,
1 cos[(1 ) ]
2d i d I I bG G A A R
(4.14)

Chapter 4
– 72 –
Subsequently, Reindl et al. added a horizon brightening diffuse term to the Hay
model. The magnitude of the horizon brightening is controlled by a modulating
function f, which is defined in equation (4.15).
bf G G (4.15)
By multiplying the modulating function f to the horizon brightening correction
term sin3(β/2), which is used in Temps and Coulson model (Temp and Coulson,
1977), the diffuse irradiance on an inclined surface in the Reindl model can be
calculated from equation (4.16) (Reindl et al., 1990).
3
,
1 cos[(1 )(1 sin ( 2)) ]
2d i d I I bG G A f A R
(4.16)
Because the relevant parameters can be achieved from typical weather files and
the specification of the inclined surface, the solar irradiance on the PV façade can
be approximately simulated. In particular, for the vertical building façade, the
inclination angle of the surface is 90 °.
4.2.2. PV generation power based on the operating temperature
The correlations that express the PV cell/module conversion efficiency as a
function of the PV operating temperature are well documented (Skoplaki and
Palyvos, 2009). The PV conversion efficiency is calculated in the traditional linear
expression as equation (4.17) (Evans, 1981).
0( ) 1 ( 25 )c c cT T C (4.17)
where Tc is the PV cell/module operating temperature, η(Tc) is the actual PV
conversion efficiency on the operating temperature of Tc, βc is the temperature
coefficient, and η0 is the PV conversion efficiency under Standard Test Conditions
(STC) . According to the IEC 60904-1 norm (Geneva, 2006) the Standard Test
Conditions (STC) are as follows: (IEC, 2006; IEC, 2007; IEC, 2008a ; IEC, 2008b)
–Irradiance: 1000 W/m2.
–Cell temperature: 25 °C.
–Spectral distribution: AM 1.5 (according to IEC 60904-3) (Geneva, 2008).
–Normal incidence.

Chapter 4
– 73 –
The PV conversion efficiency η0 and the temperature coefficient βc depend on
the solar cell material. The efficiency of mono-crystalline silicon solar cells is
approximately 14-18%, whereas that of poly-crystalline silicon is 13-16%
(Sonnenenergie, 2005; Sonnenenergie, 2008). Both values can be achieved using
on-site tests, where the PV cell/module power generations are measured at two
different temperatures for a given solar radiance flux (Hart and Raghuraman,
1982).
According to equation (4.17), the PV operating temperature is the key
parameter with important influence on the PV electrical efficiency and the PV
system generated energy. In other words, the question of how to estimate the
annual PV performance in conversion efficiency becomes the question of how to
estimate the annual PV temperature. The PV actual temperature is clearly a
function of weather variables such as ambient temperature, wind speed and solar
irradiance. Nevertheless, the Nominal Operation Cell Temperature (NOCT)
calculation method can be applied to simulate the annual PV temperature as
equation (4.18).
( 20)800
c a
GT T NOCT
(4.18)
where Tc is the PV cell/module operating temperature, Ta is the ambient
temperature, G is the solar irradiance on PV module in W/m2, and NOCT is the
normal operating cell temperature in °C.
Several international standards introduce the method to calculate the NOCT.
While operating in a normal temperature environment (NTE), which is specified as
follows, the PV module NOCT is calculated using equation (4.19).
( ) 20c a NTENOCT T T C (4.19)
NTE means:
–Irradiance: 800 W/m2,
–Cell temperature: 20 °C,
–Average wind speed: 1 m/s,
–Mounting: open rack, titled normally to the solar noon sun.

Chapter 4
– 74 –
The reported NOCT are 46-50 °C for the PV module (Garcia and Balenzategui,
2004). The simulation of the PV module annual temperature and performance
based on NOCT calculations was used by Spanish researchers with the Typical
Meteorological Year of Madrid (Balenzategui, 1999).
Because of the hourly data of ambient temperature are available from typical
weather files, and the solar irradiance on the PV module is obtained from the
calculations in Section 4.2.1, the annual power generation of the PV façade can be
estimated.
4.2.3. Validation on calculation methods
Validation works were performed to verify the calculation methods discussed
in Section4.2.1 and Section 4.2.2 with measurement data in the experimental room,
which was presented in the Chapter 3.
Figure 4.7 Validation of the solar irradiance calculation under sunny conditions
The total solar radiation, diffuse and direct solar radiation measured from field
experiment are served as input values in equation 4.3- equation4.16, thus to
calculate the solar radiation(vertical) on south wall. By doing so, the comparisons
between the measurements and calculation results of the solar radiation on south
wall are then available and shown in Figure 4.7 and Figure 4.8.

Chapter 4
– 75 –
First, the calculation of solar irradiance on an inclined surface was validated.
With the measured horizontal total solar irradiance and horizontal diffuse solar
irradiance, the total solar irradiance on the vertical façade was calculated using
equations 4.3 to 4.16 to match with the measured results in the field experiments.
Figure 4.7 presents the validation of the solar irradiance calculation on the southern
façade with sunny-day (7 August 2013) data, whereas Figure 4.8 presents a similar
work with cloudy-day (10 September 2013) data. The average error between the
calculated results and the measured results is 6.2% and 5.8% in Figures 5.7 and 5.8.
The solar irradiance on a vertical façade of the other orientation was also validated,
and the measurements and calculations are consistent.
Figure 4.8 Validation of the solar irradiance calculation under cloudy conditions
The ambient temperature and temperature of south wall measured from field
experiment are served as input values in equation 4.18- equation4.19, thus to
calculate the temperature of PV glazing. By doing so, the comparison between the
measurements and calculation results of the temperature of PV glazings is then
available and shown in Figure 4.9. The solar radiation on the south wall measured
from field experiment are served as input values in equation 4.1, inputted with η
(efficiency) calculated by equation 4.17, thus to calculate the PV electricity
generation. In the calculation, a standard efficiency of 14% (PV-2) is given by the

Chapter 4
– 76 –
manufacturer. By doing so, the comparison between the measurements and
calculation results of the PV electricity generation is then available and shown in
Figure 4.10.
Second, the calculation of the PV generation power based on operating
temperature was validated. The PV temperature was calculated using equation 4.18
with the measured ambient temperature and total solar irradiance on the PV façade.
The calculated PV temperature and the measured PV temperature were plotted in
Figure 4.9. Then, the PV generation power was calculated using equations 4.1 and
4.17 with the PV conversion efficiency according to the PV operating temperature.
The calculated and the measured PV generation powers were plotted in Figure
4.10. The calculated and the measured results are consistent in Figures 4.9 and
4.10. The data of figure 4.9 and 4.10 were from the measurements of April 17,
2013. Beside the data that were collected in April 17, 2013 and presented in the
figures, all valid data in the experiment period also verify the aforementioned
equations.
Figure 4.9 Validation of the calculation method of the PV operating temperature

Chapter 4
– 77 –
Figure 4.10 Validation of the calculation method of the PV generation power based
on the PV operating temperature
4.3. Parametric studies on the annual power generation of the PV façades in
China
With the validated calculation models and the solar radiation and ambient
temperature data provided by the typical yearly weather data, the annual power
generation of the PV façade can be estimated. In this section, the parametric studies
were performed on the PV output energy in several representative cities in China
and different integrations of the PV façades. The results of the parametric studies
can provide a reference for the optimal design of the PV façades.
4.3.1. Effects on the location and orientation
The annual power generation of the PV façades was simulated in four Chinese
cities: Beijing, Shanghai, Wuhan and Guangzhou, which are the representative
cities in North China, East China, Central China and South China, respectively. PV
modules should be installed on the façades of different orientations in these four
cities.

Chapter 4
– 78 –
Figure 4.11 Annual power generation of the PV façades of every orientation in four
cities of China
(a)

Chapter 4
– 79 –
(b)
Figure 4.12 Monthly power generation of the PV façades in Beijing and Wuhan
Suppose that a mono-crystalline PV module (conversion efficiency is 14% at
STC) with the area of one square meter was installed on the vertical façade of
different orientations in Beijing, Shanghai, Wuhan and Guangzhou. The annual
power generation of the PV façades was calculated and plotted in Figure 4.11. As
shown in this figure, the orientation of maximum PV output energy was south,
whereas the orientation of minimum PV output energy was north for all four cities.
The annual power generation of the southern PV façade reached 139.1 kWh/m2,
98.2 kWh/m2, 82.3 kWh/m
2 and 82.9 kWh/m
2 in Beijing, Shanghai, Wuhan and
Guangzhou, respectively. Beijing was significantly better than the other three
cities. In terms of the north PV façade, the annual power generation was 49.7k
Wh/m2, 52.8 kWh/m
2, 51.7 kWh/m
2 and 58.2 kWh/m
2. Beijing has the highest
value, whereas Guangzhou has the lowest value, but the overall value is not notably
different. In general, the gap between the most favourable orientation (south) and
the most unfavourable direction (north) in Beijing is relatively large, and the
difference of the photovoltaic power generation in Wuhan and Guangzhou is
relatively small.

Chapter 4
– 80 –
The monthly power generation of the PV façades in Beijing and Wuhan was
illustrated in Figure 4.12. There are similar characters for both cities. The monthly
PV power generations of the east façade and west façade are notably close but are
greatly different from the result of the north and south. For the southern PV façade,
the maximum PV energy is in winter, and the minimum PV energy is in summer.
On the contrary, the minimum PV energy is in winter for the eastern, western and
northern façades. The dissimilar character for Beijing and Wuhan is that the
difference in PV energy in different orientations is great in Beijing and relatively
small in Wuhan.
4.3.2. Effects on the building form
PV modules are installed on the building façades, and the architectural form
affects the orientation of the PV modules; thus, the PV power generation in the
entire building is associated with the form of architecture. The three most typical
building forms (rectangular, rhombus and circular) are selected for the parametric
study. The mono-crystalline PV (conversion efficiency is 14% at STC) is arranged
on the building façades with 3.6 m in storey height and 30 m in horizontal length.
Form 1 is a rectangular plane building with PV modules covering the south
façades; form 2 is a rhombus plane building with PV modules covering the
southeast and southwest façades; form 3 is a circular building with PV modules
covering the south semi-circular façades. The building forms were presented in
Figure 4.13 (a).
The annual power generations of the PV façades in the three building forms
were shown as columns in Figure 4.13 (b). The gap in PV energy of the three
building forms was slightly high in Beijing and relatively small in the other cities.
Form 1 Form 2 Form 3
(a)

Chapter 4
– 81 –
(b)
Figure 4.13 Annual power generation of the PV façades in three building
forms
4.3.3. Effects on the PV material and PV module arrangements
Although the form and site of the buildings may be identical, the PV façades
power generation varies according to the PV material and PV arrangement.
Parametric studies were performed with the assumption that the south façade (3.6
m in storey height and 30 m in horizontal length) of a rectangular-form building in
Beijing were covered with PV modules in four arrangements.
Supposed the conversion efficiency are 14% for mono-crystalline PV, 7.8% for
amorphous-silicon opaque PV and 4.9% for amorphous-silicon semi-transparent
PV, which could be regarded identically from the measurements. Arrangement 1 is
composed of a 0.9-meter-high solid wall and a 2.7-meter-high curtain wall.
Mono-crystalline opaque PVs (conversion efficiency is considered to be 14%) were
installed on the solid wall, and mono-crystalline semi-transparent PVs
(photovoltaic coverage ratio is 50%) were used on the curtain wall. Arrangement 2
is composed of two 0.9-meter solid walls and one 1.8-meter-high curtain wall.
Mono-crystalline opaque PVs were installed on the solid wall, and transparent
low-E glazing was used on the curtain wall. Arrangement 3 is composed of one
0.9-meter solid wall and one 1.8-meter-high curtain wall. Amorphous-silicon

Chapter 4
– 82 –
opaque PVs (conversion efficiency is considered to be 7.8%) were plugged on the
solid wall, and the amorphous-silicon semi-transparent PVs (conversion efficiency
is considered to be 4.9%) were used by the curtain wall. Arrangement 4 is
composed of two 0.6 m long PV shading with an angle of inclination of 60°. The
mono-crystalline opaque PVs are integrated to the shading. The four arrangements
were illustrated in Figure 4.14.
Figure 4.15 shows the column graphics of the annual power generation in the
four PV arrangements. The annual total PV generation energy is sorted in
descending order as Arrangement 1, Arrangement 2, Arrangement 4 and
Arrangement 3. The annual PV generation energy per square meter area in
descending order is as Arrangement 4, Arrangement 2, Arrangement 1 and
Arrangement 3. Using amorphous-silicon PV modules with the lower electrical
efficiency, arrangement 3 has the lowest total power generation and power
generation per square meter. Although the total generation energy of Arrangement
4 is not so high, but it has the highest generation energy per square meter among all
four arrangements. The generation energy per square meter of arrangement 4 is 1.5
times that of arrangement 2 and 2.5 times that of arrangement 1. This result implies
that in terms of the PV generation energy, the arrangement with the inclined PV
shading has an obvious advantage on the vertical arrangement of solid wall in
Beijing.

Chapter 4
– 83 –
Figure 4.14 Illustration of four arrangements for the PV façades
Figure 4.15 Annual power generation of the PV façades in four arrangements

Chapter 4
– 84 –
4.4. Conclusions
The calculation models of solar irradiance on an inclined surface and PV
generation power based on the operating temperature are developed and validated
with the measured data. The good agreements between measured results and
calculated results demonstrate that the calculation models can predict annual power
generation of PV façades with good accuracy. In addition, the developed and
validated calculation method in this chapter can be used as an easy-to-use tool in
the pre-design of BIPV.
With the validated calculation methods and the typical yearly weather data of
CSWD, the annual power generation of PV façades in China is calculated in
parametric studies. The results show that with various cities, building orientations,
building forms, materials and arrangements of PV modules, there is a distinct
difference in the electrical output energy of PV façades. PV façades have
maximum electrical generation in the south and minimum in the north. However,
although the gap between the most favourable orientation (south) and the most
unfavourable direction (north) in Beijing is relatively large, the difference of the
photovoltaic power generation in Wuhan and Guangzhou is relatively small. In
addition, the difference of PV electrical energy generated in rectangular, rhombus
and circular building forms was slightly higher in Beijing and relatively small in
the other cities. The parametric study results can serve as reference for architects,
engineers and installers in the BIPV project in China.

Chapter 5
– 85 –
Chapter 5 Calculation methods and
architectural models for energy
evaluation of semi-transparent PV
façades

Chapter 5
– 86 –
In previous Chapter 4, calculation methods for PV generation of
semi-transparent PV glazing is presented. However, to further investigate the
energy performance of semi-transparent PV façade integrated in building, complete
calculation methods of PV generation, thermal and daylighting are required and
presented in Section 5.2. In addition, architectural models are also required to serve
as architectural conditions and presented in Section 5.3. Models of baseline
buildings are necessary as they provide references to evaluate how much energy is
saved by semi-transparent PV façades in office buildings and is presented in
Section 5.4. This chapter would provide a solid foundation for further simulation
investigations in this study for semi-transparent PV façade.
5.1. Introduction
In Chapter 4, a calculation method for the PV generation of semi-transparent
PV glazing is presented. However, to further investigate the energy performance of
semi-transparent PV façades that are integrated in buildings, complete calculation
methods of PV generation, thermal and daylighting are required. In addition,
architectural models are also required to serve as architectural conditions. Thus,
this chapter presents the calculation methods and architectural models for the
energy evaluation for both mono-crystalline and amorphous-silicon
semi-transparent PV façades.
To evaluate the total energy of semi-transparent PV, relevant calculation
models and methods are necessary to predict different thermal and optical
characteristics of PV façades under different environmental and architectural
conditions. These characteristics involve the PV electricity generation output,
temperature behaviours of PV glazing, heat transfer process of PV glazing and
daylighting-related process of PV glazing. Based on these characteristics, the
overall energy consumption is calculated for further analysis. In this chapter, the
calculation models and methods for simulations are developed for both
mono-crystalline silicon PV and amorphous-silicon semi-transparent PV, which
includes PV power generation model, thermal model and daylighting calculation
method. Relevant studies (Ciulla et al., 2014; Hoang et al., 2014; Torres Lobera
and Valkealahti, 2013; Ishaque et al., 2011; Mei et al., 2003; Kamthania and

Chapter 5
– 87 –
Tiwari, 2014; Yun et al., 2007) have been reviewed to ensure the
comprehensiveness and practicability of the models and methods. Field
experiments were performed to obtain measured data to compare with the
simulated results for validation.
The semi-transparency of PV façades makes them more involved with the
building environment and the performance of building energy consumption (Leite
Didoné and Wagner, 2013 ; Lu and Law, 2013 ; Olivieri et al., 2014 ; Wong et al.,
2008). Thus, PV façades and architectural factors are more related to each other
than the usual PV applications on roofs. In this case, architectural models are
developed as an important part to investigate the energy performance of
semi-transparent PV glazing that is used as office façades, which includes
parameters of WWR, room depth, orientation and other necessary settings of the
building envelop materials, running schedule of people and equipment, etc. Models
of two baseline buildings without PV applications are also introduced in this
chapter, which serve as comparison cases with semi-transparent façades.
To serve and represent the general climate condition in Central China, Wuhan
is chosen as the typical city, which has been thoroughly discussed in Chapter 4.
Chinese Standard Weather Data (CSWD) is used for the typical year weather data
in simulations. In terms of validations for calculation methods, real climate data
recorded by field experiments is used and rewritten into the CSWD format to serve
as the climate conditions to provide the comparisons between the measurement
data and calculation results.
5.2. Calculation methods of semi-transparent PV glazing
Calculation models and methods of semi-transparent PV glazing are developed
for detailed simulation of the overall energy performance of PV façades. The PV
power generation model for different PVR glazings is developed to predict the
electricity generation under different conditions of solar radiation and glazing
temperature. A thermal model is developed for different PVR glazings to predict
the temperature on the PV layer and provide the necessary properties to incorporate
into Energy Plus to perform computation simulations (Energy Plus does not

Chapter 5
– 88 –
provide a calculation model for semi-transparent PV glazings). In the daylighting
calculation method, lighting control is introduced to maximise the benefit of
natural daylight, which is affected by different PVR PV glazings. Studies have
discussed the calculation models and methods for PV-glazing, and some (Wong et
al., 2008 ; Jiang et al., 2008) focused on the semi-transparent PV glazing. However,
few studies have carefully considered the effect of different PVR; thus, there is a
lack of development of calculation models and methods for different
semi-transparent PVR.
5.2.1. PV power generation model
The PV power generation efficiency is affected by the temperature of solar
cells: the PV efficiency decreases with increasing temperature (Ye et al., 2013).
Moreover, a PV panel with high PVR absorbs more solar radiation and achieves a
higher temperature than a panel with low PVR; this produces inconsistent results in
terms of PV power generation efficiency even under identical climatic conditions
(Jiang et al., 2008). To address this issue, a temperature coefficient power
generation (Skoplaki and Palyvos, 2009) must be included.
O C c[1 ( 25 )]P G T ℃ (5.1)
where P is the instant power of the PV panel, G is the solar radiation on the PV
plane (W/m2), ηo is the PV efficiency under standard conditions (0.14 for
mono-crystalline PV and 0.049 for amorphous-silicon PV given by manufacturer),
βC is the temperature coefficient, and Tc is the solar cell temperature (°C), which is
affected by PVR. In this model, the solar cell temperature Tc is unknown and must
be provided using heat balance models (as described in Section 5.2.2). In the
present study, the temperature coefficient βC was determined to be -0.72%/°C based
on field experiments.
The results that were obtained using the power generation model were
compared with the measurements that were obtained during field experiments. A
model of same settings of sizes and materials of the experiment room is built with
SketchUp (Figure 5.1) and then transferred into Energy Plus to provide the
simulation condition for validation of simulated results. The weather data is
recorded by experiment room and rewritten into CSWD format and used to provide

Chapter 5
– 89 –
the same weather condition for validation. Such a model is used for the validation
results (Figure 5.2, Figure 5.3, Figure 5.6 and Figure 5.7).
Figure 5.1 Computation models for energy plus to compared with field
experiment room
To perform a validation for calculated results of PV electricity output power by
PV power generation model, G is provided by Energy Plus, calculated with the
rewritten CSWD in real weather data measured by field experiments; Tc is
calculated by the thermal model in 5.2.2, ηo and βC is given fixed value discussed
in paragraph above previously. By doing so, the calculated results of PV electricity
output power is given with equation 5.1. Such calculated results are then used to
compare with experiments results.
It was demonstrated that the power generation model can predict the PV
electricity output with satisfactory accuracy. For example, Figure 5.2 compares the
measured and calculated PV electricity output results for a semi-transparent PV
panel with PVR of 40% using the climate data of August 1 2013, and the results are
clearly indicates good agreement, with an average deviation of 7.5%. Other
comparisons in all four seasons were also made; the results show good agreement,
with less than 9.2% deviation in all cases. Figure 5.3 shows the PV electricity
output results of the amorphous-silicon semi-transparent PV glazing with the

Chapter 5
– 90 –
climate date of June 3rd
2013. Both comparisons indicate that the power generation
model can predict the PV electricity output with a satisfactory accuracy.
Figure 5.2 Validation of the power generation of the mono-crystalline
semi-transparent PV
Figure 5.3 Validation of the power generation of the amorphous-silicon
semi-transparent PV

Chapter 5
– 91 –
5.2.2. Thermal calculation model
The temperature of the solar cell layers of semi-transparent PV panels must
be calculated using a thermal model. The thermal calculation model would provide
the temperature Tc in equation 5.1, which is changing by time and thus affects the
PV power generation, which makes it a critical part of the calculation of PV yield
and its efficiency. With the temperature Tc in equation 5.1, the accumulations of PV
electricity generation is calculated by a time step of 30 minutes. In terms of the
relation between the thermal calculation model and the Energy Plus, the thermal
calculation model would also provide the necessary properties of the investigated
glazings for Energy Plus including U-value, SHGC and visible transmittance, by
which the process of thermal calculation is carried out by Energy Plus.
For mono-crystalline silicon, the single-glazing semi-transparent PV glass
consists of multiple layers of materials, including internal and external layers of
clear glass (each is 6 mm thick) with a central layer of EVA (ethylene-vinyl acetate
copolymer) that contains a silicon cell of different PVR. In the adopted thermal
model, the semi-transparent PV glass is divided into 3 layers with 4 boundaries as
illustrated in figure 5.4. The properties of each layer are provided by the
manufacturer and presented in Table 5.1.
Table 5.1 Properties of individual layers of the mono-crystalline semi-transparent
PV
layer thickness
(mm)
thermal
conductivity
(W/mK)
absorptance transmittance reflectance
glass 6 0.760 0.108 0.810 0.082
EVA 1.8 0.116 0.060 0.900 0.040
silicon
cell
0.3 168.0 0.970 0 0.030

Chapter 5
– 92 –
Figure 5.4 Schematic illustration of the mono-crystalline semi-transparent PV
The temperature of each boundary was calculated based on heat balance
equations. The temperature of the solar cell layer Tc was assumed to be the average
of T2 and T3 because the difference between these two values was negligible in the
context of the model outcome. The heat storage in the single glazing was not
considered, and the heat transfer was assumed to be in quasi-steady state. Thus, the
heat balance equations for the first, second, third, and fourth boundaries were
established in equations (5.2), (5.3), (5.4), and (5.5), respectively.
4 4 11 1 out out,c 1 out 1 2
1
( 273.15) ( 273.15)G T T h T T T Td
(5.2)
1 21 EVA sc 1 2 2 3
1 2
1G PVR PVR T T T T Pd d
(5.3)
321 EVA 3 2 3 3 4
2 3
1G PVR T T T Td d
(5.4)
4 433 4 in,c 4 in 4 in
3
h ( 273.15) ( 273.15)T T T T T Td
(5.5)

Chapter 5
– 93 –
where G is the solar radiation on the PV plane (W/m2), αi is the solar absorbance of
layer i, and Ti is the temperature of boundary i. In addition, Tout and Tin are the
outdoor and indoor temperatures, respectively; hout,c and hin,c are the convective
heat transfer coefficients for the outside and inside surfaces of the semi-transparent
PV panel, respectively; is the emissivity of the front glass; σ is the Stefan–
Boltzmann constant (W/m2K
4); τi is the solar transmittance of layer i; PVR is the
solar cell coverage ratio; λi is the heat conductivity of layer i (W/mK); λsc and λEVA
are the heat conductivity of the solar cell and EVA, respectively (W/mK); P is the
PV power generation (W/m2); and di is the thickness of layer i (m). The external
and internal surface convection heat transfer coefficients were set to 16 W/m2K and
3.6 W/m2K, respectively, based on the obtained data from the standard entitled
―Calculation specification for thermal performance of windows, doors and glass
curtain-walls‖ (JGJ/T 151-2008) (MHUDC, 2008).
For amorphous-silicon semi-transparent PV glazing, it consists of inside and
outside layers of 6-mm clear glass and an amorphous-silicon layer in the middle.
Similar to mono-crystalline semi-transparent PV, the amorphous-silicon
semi-transparent PV glass is divided into three layers with four boundaries, and its
schematic illustration is shown in Figure 5.5. The properties of each layer is
provided by the manufacturer and shown in Table 5.2. The temperature of each
boundary is calculated through heat balance. The temperature of the solar cell layer
Tc is assumed to be the average value of T2 and T3. Thus, the heat balance equations
for the first, second, third, and fourth boundaries were established as in equations
(5.6), (5.7), (5.8), and (5.9), respectively.
4 4 11 1 out out,c 1 1 2
1
( 273.15) ( 273.15)outG T T h T T T Td
(5.6)
1 21 2 1 2 2 3
1 2
G T T T T Pd d
(5.7)
321 2 3 2 3 3 4
2 3
G T T T Td d
(5-8)

Chapter 5
– 94 –
4 433 4 in,c 4 in 4
3
h ( 273.15) ( 273.15)inT T T T T Td
(5.9)
Table 5.2 Properties of each individual layer of the amorphous-silicon
semi-transparent PV
Layers Thickness Thermal
conductivity
(W/mK)
Absorptance Transmission Reflectance
Glass 6mm 0.760 0.108 0.810 0.082
amorphou
s-Silicon
1.5mm 0.25 0.770 0.200 0.030
Figure 5.5 Schematic illustration of the amorphous-silicon semi-transparent PV
By using there rewritten CSWD weather data provided by field experiments
T1, T2, T3, T4 are calculated with equation 5.2-5.5 and equation 5.6-5.9 for both
type of PV glazing. Such calculated results are then used to compare with
experiments results.

Chapter 5
– 95 –
Figure 5.6 Comparison of the measured and the calculated inside-surface
temperatures for the mono-crystalline semi-transparent PV glazing
Figure 5.7 Comparison of measured and the calculated inside-surface temperatures
for the amorphous-silicon semi-transparent PV glazing

Chapter 5
– 96 –
The results that were calculated from the thermal model were compared with
the measurements collected during the field experiments. Figure 5.6 illustrates the
variations in the inside-surface temperature of an semi-transparent PV panel with
PVR of 40% throughout the course of a day (March 1 2013). Figure 5.7 shows the
inside-surface temperature of the amorphous-silicon PV throughout the course of a
day (June 3 2013). Both temperatures clearly demonstrate that the calculated results
are consistent with the measurements.
To calculate the heat and solar radiation transfer, which affects the heating and
cooling loads of the indoor space, it is necessary to obtain the U-factors and solar
heat gain coefficient (SHGC) for different PVR glazings (MHUDC, 2008). These
values are incorporated into Energy Plus to obtain the heat gain and loss data and
the heating and cooling demand in certain architectural conditions. These
calculation properties and methods can be used for both mono-crystalline and
amorphous-silicon semi-transparent PVs with a small change accordingly.
SHGC can be calculated according to equation (5.10):
SHGC N (5.10)
where τ is the total solar transmittance of semi-transparent PV, τi the solar
transmittance of layer i, N is the inward-flowing fraction of the absorbed radiation,
and α is the total solar absorbance of semi-transparent photovoltaics with different
PVR and can be obtained from WINDOW 6.3 using the properties in Table 1.
Furthermore, τ and N can be defined as shown in equations (5.11), (5.12) and
(5.13). In terms of these two types of PV glazing, amorphous-silicon
semi-transparent does not have a wide variation of solar transmittance, where τ3 is
the solar transmittance of the amorphous-silicon layer. This property is different
from mono-crystalline PV layer, where the solar transmittance is controlled by the
PVR and glazing that it contains.
For mono-crystalline semi-transparent PV:
1 2 3(1 )PVR (5.11)
For amorphous-silicon semi-transparent PV:

Chapter 5
– 97 –
1 2 3 (5.12)
in
in out
h
h + hN (5.13)
where hout and hin are the outside and inside heat transfer coefficients, respectively,
for the surfaces of semi-transparent PV panels. Similarly, the U-factors can be
calculated for different PVR using equation (5.14).
31 2
out 1 2 3 in
1
1 1
h h
Udd d
(5.14)
In the present study, the outside- and inside-surface heat transfer coefficients
were set to 20.2 W/m2K and 8.3 W/m
2K, respectively, based on the obtained data
from the standard entitled ―Calculation specification for thermal performance of
windows, doors and glass curtain-walls‖ (JGJ/T 151-2008) (MHUDC, 2008).
After the calculation of SHGC and U-factor, the heating and cooling loads
were simulated in Energy Plus.
5.2.3. Daylighting calculation method
According to the Standard for Lighting Design of Buildings for China
(GB50034-2004) (CABR, 2008), the indoor illuminance should reach 300 Lux in a
general office room. To simulate this code and the energy saving by daylight,
daylight detection and lighting control for simulation is introduced using Energy
Plus. When the daylight illuminance level is below 300 Lux, artificial lighting will
achieve the required illuminance level with extra electricity consumption.
According to the code, lighting settings in this study are assumed as fluorescent
lights to represent the current usage of artificial lighting system in office building.
However, in the future, the use of a more energy-efficient lighting setting like LED
could have a major impact on the results, which is not included in this study. To
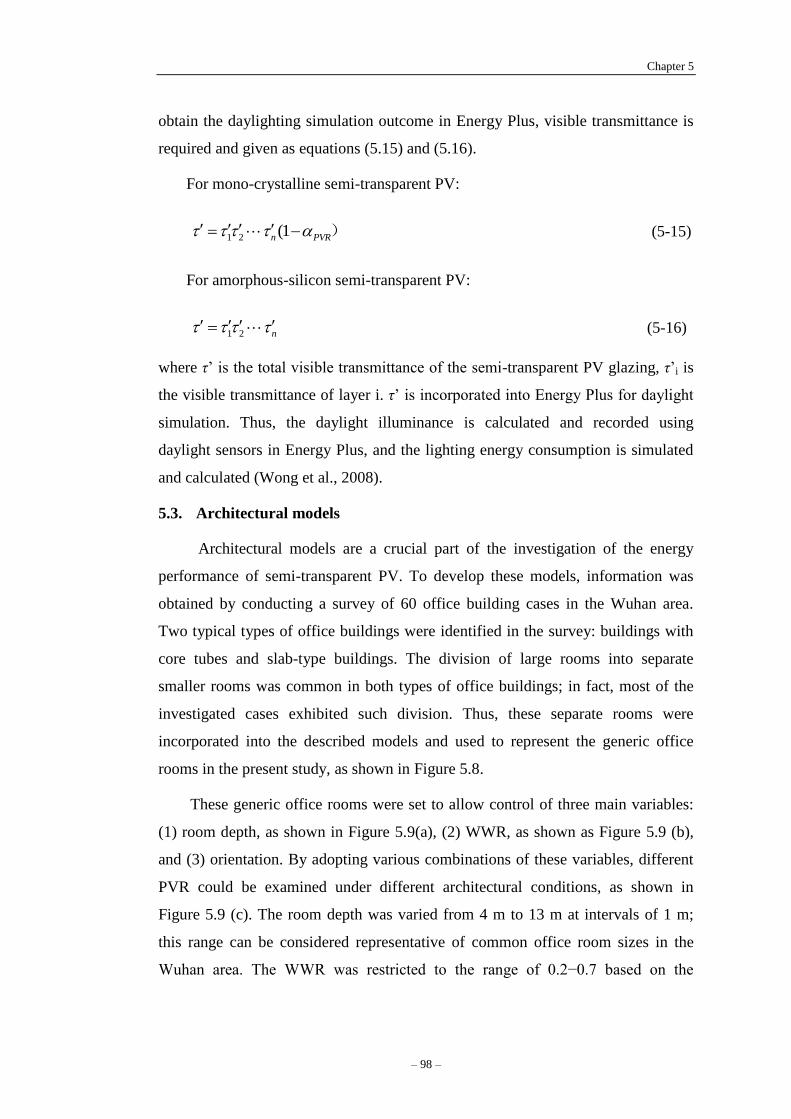
Chapter 5
– 98 –
obtain the daylighting simulation outcome in Energy Plus, visible transmittance is
required and given as equations (5.15) and (5.16).
For mono-crystalline semi-transparent PV:
1 2 (1n PVR ) (5-15)
For amorphous-silicon semi-transparent PV:
1 2 n (5-16)
where τ‘ is the total visible transmittance of the semi-transparent PV glazing, τ‘i is
the visible transmittance of layer i. τ‘ is incorporated into Energy Plus for daylight
simulation. Thus, the daylight illuminance is calculated and recorded using
daylight sensors in Energy Plus, and the lighting energy consumption is simulated
and calculated (Wong et al., 2008).
5.3. Architectural models
Architectural models are a crucial part of the investigation of the energy
performance of semi-transparent PV. To develop these models, information was
obtained by conducting a survey of 60 office building cases in the Wuhan area.
Two typical types of office buildings were identified in the survey: buildings with
core tubes and slab-type buildings. The division of large rooms into separate
smaller rooms was common in both types of office buildings; in fact, most of the
investigated cases exhibited such division. Thus, these separate rooms were
incorporated into the described models and used to represent the generic office
rooms in the present study, as shown in Figure 5.8.
These generic office rooms were set to allow control of three main variables:
(1) room depth, as shown in Figure 5.9(a), (2) WWR, as shown as Figure 5.9 (b),
and (3) orientation. By adopting various combinations of these variables, different
PVR could be examined under different architectural conditions, as shown in
Figure 5.9 (c). The room depth was varied from 4 m to 13 m at intervals of 1 m;
this range can be considered representative of common office room sizes in the
Wuhan area. The WWR was restricted to the range of 0.2−0.7 based on the

Chapter 5
– 99 –
guidelines in the Design Standard for Energy Efficiency of Public Buildings, which
was proposed by the Ministry of Housing and Urban–Rural Development of the
PRC(CAB, 2004), which forbids office buildings with a WWR above 0.7 in the hot
summer/cold winter climate zone. The PVR was varied from 10% to 80% at
intervals of 5%. PVR below 10% will make PV applications uneconomical;
conversely, PVR above 80% will block the entire window area, which makes it
difficult for daylight to enter the room and for occupants to see outside. The
adopted PVR interval of 5% should make different effects of PVR distinguishable
while maintaining a sufficiently practical simulation parametric analysis.
Figure 5.8 Illustrations of the generic office rooms

Chapter 5
– 100 –
Figure 5.9 Illustrations of the variations in (a) room depth, (b) WWR, and (c) PVR

Chapter 5
– 101 –
Table 5.3 Thermal and optical properties of the building envelope layers
Layers Thickness
(mm)
Thermal
conductivity
(W/mK)
Density
(kg/m3)
Specific
heat
(J/kg K)
Exterior wall
Brick 200 0.89 1920 790
insulation board 40 0.03 50 1210
Surface finish*2 20 0.16 800 1100
Interior wall
Brick 100 0.89 1920 790
Surface finish*2 20 0.16 800 1100
Ceiling/floor
Standard wood
board
8 0.12 540 1210
Cast concrete 120 1.60 2200 860
Surface finish 20 0.16 800 1100
Table 5.4 Hourly schedules of office rooms
Time
0:00-7:
00
7:00-8:
00
8:00-17:
00
17:00-19
:00
19:00-2
4:00
Cooling system (°C) 37 28 26 26 37
Heating system (°C) 12 18 20 20 12
Lighting, equipment
operation
schedules(fraction of
full occupant)
0 0.5 0.95 0.3 0
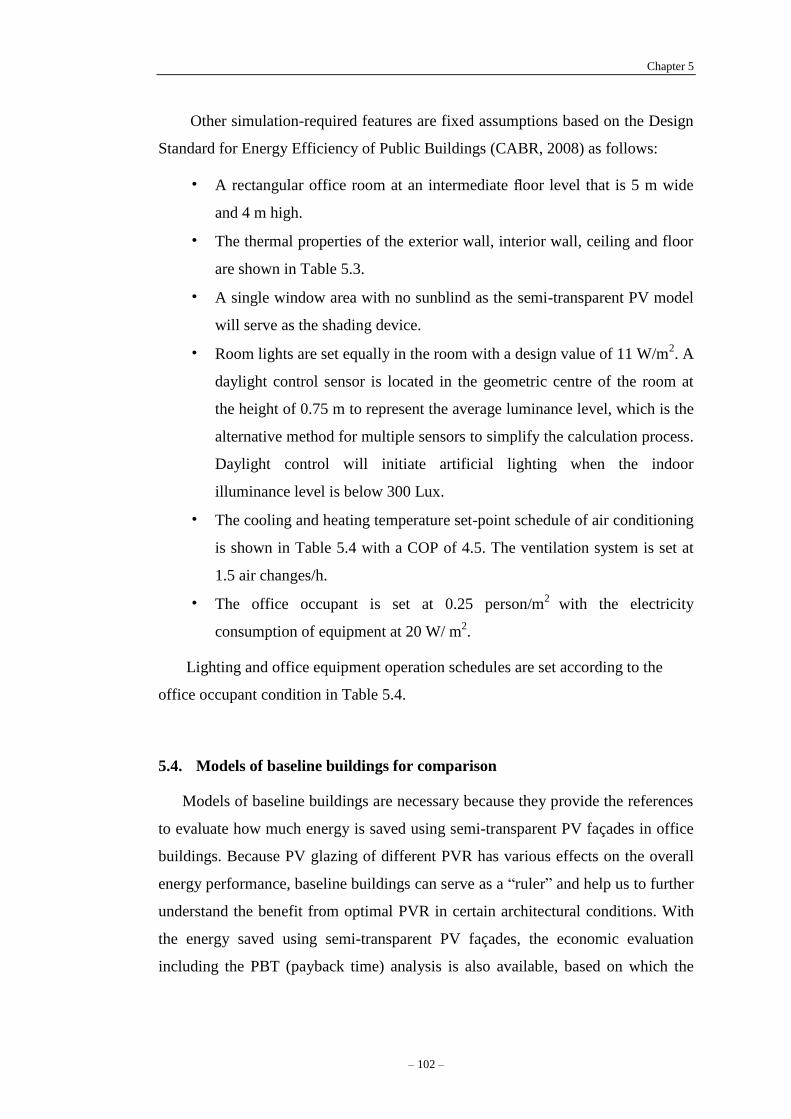
Chapter 5
– 102 –
Other simulation-required features are fixed assumptions based on the Design
Standard for Energy Efficiency of Public Buildings (CABR, 2008) as follows:
• A rectangular office room at an intermediate floor level that is 5 m wide
and 4 m high.
• The thermal properties of the exterior wall, interior wall, ceiling and floor
are shown in Table 5.3.
• A single window area with no sunblind as the semi-transparent PV model
will serve as the shading device.
• Room lights are set equally in the room with a design value of 11 W/m2. A
daylight control sensor is located in the geometric centre of the room at
the height of 0.75 m to represent the average luminance level, which is the
alternative method for multiple sensors to simplify the calculation process.
Daylight control will initiate artificial lighting when the indoor
illuminance level is below 300 Lux.
• The cooling and heating temperature set-point schedule of air conditioning
is shown in Table 5.4 with a COP of 4.5. The ventilation system is set at
1.5 air changes/h.
• The office occupant is set at 0.25 person/m2
with the electricity
consumption of equipment at 20 W/ m2.
Lighting and office equipment operation schedules are set according to the
office occupant condition in Table 5.4.
5.4. Models of baseline buildings for comparison
Models of baseline buildings are necessary because they provide the references
to evaluate how much energy is saved using semi-transparent PV façades in office
buildings. Because PV glazing of different PVR has various effects on the overall
energy performance, baseline buildings can serve as a ―ruler‖ and help us to further
understand the benefit from optimal PVR in certain architectural conditions. With
the energy saved using semi-transparent PV façades, the economic evaluation
including the PBT (payback time) analysis is also available, based on which the

Chapter 5
– 103 –
suitability of optimal PVR/WWR of semi-transparent PV façades is further
discussed in Chapter 8.
In China, there is no official academic general reference of baseline building
models for building energy studies to serve as comparison cases. However, certain
architectural codes and regulations provide us with requirements of
energy-efficient buildings. According to the Chinese Design Standard for Energy
Efficiency of Public Buildings (GB-50189-2005) (CABR, 2008), the standard of
―energy-efficient building‖ is provided, which can save approximately 50% energy
compared to traditional public buildings that are built in the 80s and 90s. Because
there are is other available option for reference cases in China, two types of
baseline buildings are developed based on the requirements of the Chinese Design
Standard for Energy Efficiency of Public Buildings (GB-50189-2005). The two
types of baseline buildings are described as follows:
Baseline building A
General and traditional office buildings that are built in the 80s and 90s. In
GB-50189-2005, these buildings are defined as consuming two times more
energy than energy-efficient buildings.
Baseline building B
Energy-efficient office buildings that satisfy the minimum requirements of
GB-50189-2005.
GB-50189-2005 provides the requirements of different aspects for different
climate zones and conditions of energy-efficient buildings. However, not every
requirement is necessary in the Hot-Summer Cold-Winter climate zone and suitable
for the comparison cases in this study. We defined three main aspects of
requirements as the basis to develop the baseline buildings: (1) envelope properties,
(2) operation setting, and (3) operation schedule.
The first aspect is building envelope properties, which affect the heat transfer
process of a building. Table 5.5 shows the requirements that are defined for the
envelope properties of energy-efficient office buildings based on GB 50189-2005,
which is specifically for the Hot-Summer Cold-Winter climate zone. Because the
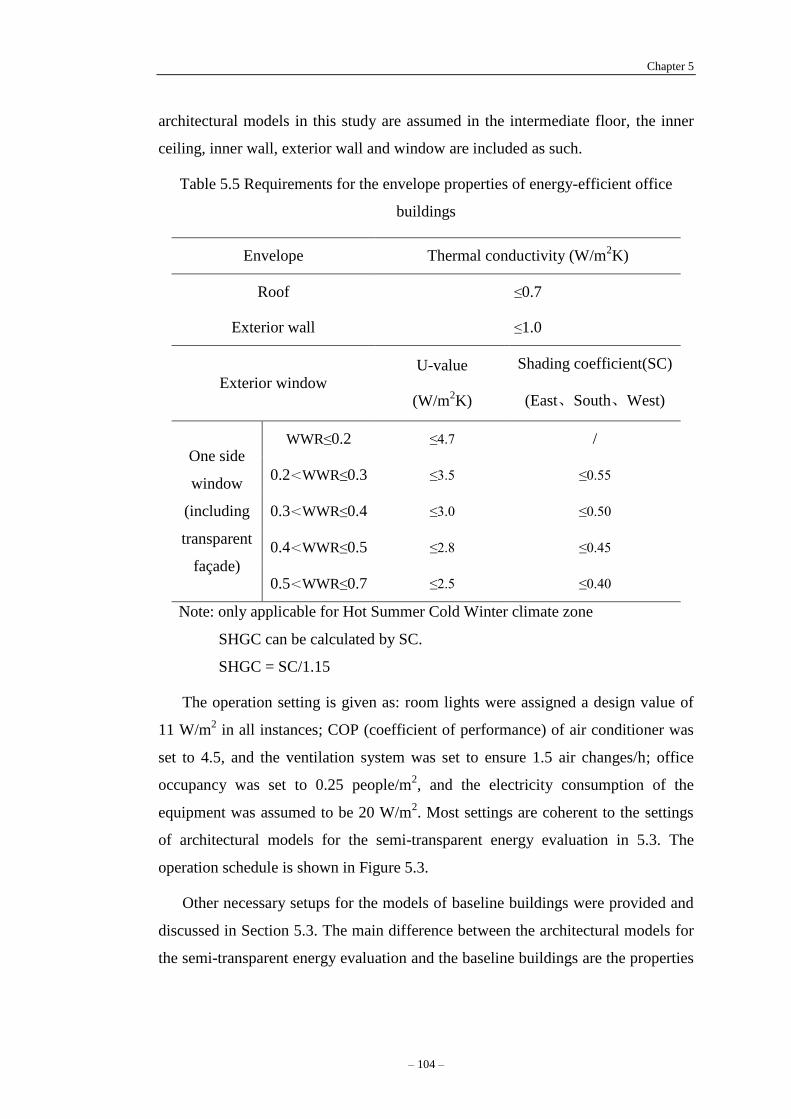
Chapter 5
– 104 –
architectural models in this study are assumed in the intermediate floor, the inner
ceiling, inner wall, exterior wall and window are included as such.
Table 5.5 Requirements for the envelope properties of energy-efficient office
buildings
Envelope Thermal conductivity (W/m2K)
Roof ≤0.7
Exterior wall ≤1.0
Exterior window U-value
(W/m2K)
Shading coefficient(SC)
(East、South、West)
One side
window
(including
transparent
façade)
WWR≤0.2 ≤4.7 /
0.2<WWR≤0.3 ≤3.5 ≤0.55
0.3<WWR≤0.4 ≤3.0 ≤0.50
0.4<WWR≤0.5 ≤2.8 ≤0.45
0.5<WWR≤0.7 ≤2.5 ≤0.40
Note: only applicable for Hot Summer Cold Winter climate zone
SHGC can be calculated by SC.
SHGC = SC/1.15
The operation setting is given as: room lights were assigned a design value of
11 W/m2 in all instances; COP (coefficient of performance) of air conditioner was
set to 4.5, and the ventilation system was set to ensure 1.5 air changes/h; office
occupancy was set to 0.25 people/m2, and the electricity consumption of the
equipment was assumed to be 20 W/m2. Most settings are coherent to the settings
of architectural models for the semi-transparent energy evaluation in 5.3. The
operation schedule is shown in Figure 5.3.
Other necessary setups for the models of baseline buildings were provided and
discussed in Section 5.3. The main difference between the architectural models for
the semi-transparent energy evaluation and the baseline buildings are the properties

Chapter 5
– 105 –
of the building envelope (façades). Thus, the energy performance and
characteristics of the semi-transparent envelopes can be better revealed.
5.5. Conclusions
In this chapter, calculation models and methods including PV power
generation model, thermal model and daylighting calculation method are
established and validated by field experiments. The results obtained using the
power generation model was compared with measurements obtained during field
experiments. It was demonstrated that the power generation model could predict
PV electricity output with satisfactory accuracy. Thermal model that is developed
for both crystalline silicon and amorphous-silicon PV of different PVR as the
temperature of the solar cell layers of semi-transparent PV panels need be
calculated using this models. The results calculated from the thermal model were
compared with the measurements collected during field experiments, which
demonstrates clearly that the calculated results agree well with the measurements.
In such cases, it is believed these calculation models and methods can be used for
further study of overall energy performance of semi-transparent PV façades with
satisfactory accuracy.
Architectural models are developed based on the survey of 60 cases of office
buildings in the Wuhan area. Generic office rooms are developed with variation of
WWR, room depth, orientation. Based on the solid survey in a large area in Wuhan,
it is believed the architectural models are proper and can be used for further study
of overall energy performance of semi-transparent PV façades.
Two kinds of baseline buildings (A and B) are developed to help us to further
understand the benefit from optimal PVR in certain architectural conditions, which
is also based on the requirements of Chinese Design Standard for Energy
Efficiency of Public Buildings. These standards have been largely used and proved
by a lot real projects in China and it is believed they could serve well in objective
comparison study for semi-transparent PV façades.

Chapter 6
– 106 –
Chapter 6 Evaluation on energy
performance of office buildings with
mono-crystalline semi-transparent
PV façades

Chapter 6
– 107 –
With the calculation methods and architectural models presented in Chapter 5,
energy (electricity) consumption of lighting, heating and cooling is calculated,
based on which, this chapter presents a discussion of energy evaluation of
mono-crystalline semi-transparent with a parametric analysis (Section 6.2). An
optimizing design approach for mono-crystalline semi-transparent PV façade by
optimal PVR is explored (Section 6.3). In addition, energy saving of
mono-crystalline semi-transparent PV compared to three traditional glazings is
investigated and presented in Section 6.4.
Throughout the evaluation (Chapter 6 Chapter 7 and Chapter 8), the main
calculation and model assumptions are made and presented in Chapter 5. However,
to further concentrate on the impact of semi-transparent glazing, several more
assumptions are necessary and made as following with certain possible limitations :
1. The construction of the façades is simplified without detailed
consideration of air leakage, heat bridge and other possible impacts from
façades components. In a real situation, especially in a poorly built and
maintained building, this could lead to a significant impact on energy
performance.
2. All the energy units relevant to the overall energy consumption are unified
by electricity unit (kWh), or (kWh/m2). The impact of better usage of
passive applications without the use of electricity in buildings could have
an impact on the results. However, with the same configurations (which
are also represent the most common cases of office buildings in Central
China) for the study cases, the results still give a fair and consistent
outcome and conclusions of how different semi-transparent PV façadess
impact on general office building cases.
3. The indoor shading methods of curtain or other shading devices are
assumed not existed as semi-transparent provides a certain level of
shading. However, if indoor shading is used in some particular
circumstances, these shading devices could lead to significant impact on
energy performance.

Chapter 6
– 108 –
4. The operation schedule of the building is a fixed assumption with same
daily routines, in which people behave equally by the fractions of
percentage of different activities. However, in a real case people could
behave differently, for example, if there‘s a party planned on weekend, the
activity could lead a significant change to the energy consumption.
5. Semi-transparent PV façades with single glazing were thoroughly
studied. However, other types of glazing such as double-glazing PV were
not included in this study. Double glazing is currently commonly used in
buildings, and the potential of semi-transparent PV double-glazing façades
is notably promising because they provide better thermal performance than
single glazing. The advantage of PV glazing could be even more
prominent in Semi-transparent double glazing PV façades.
6.1. Introduction
Evaluation on energy performance of PV façades should be carried out in
terms of the overall energy peroformance. PV façades affect the overall energy of a
building in many ways. First, with a higher PV coverage ratio, less daylight is
available indoors, which increases the daytime demand for artificial-lighting
energy. This result is particularly crucial in office buildings that primarily operate
in the daytime. The PVR also affects the indoor heat gain from solar radiation,
which affects the indoor heating and cooling demands. Additionally, different PV
coverage ratios have different electricity outputs from PV generation. Hence, the
overall energy assessment is required for the optimal design of PV façades. The
overall energy performance can be evaluated using the overall energy consumption
as:
Overall energy consumption = Lighting energy consumption + cooling and
heating energy consumption – PV electricity generation.
The energy consumption of equipment and other systems in a building are not
included in this assessment because they do not have an obvious relation to PV
façades in terms of the overall energy performance. The evaluation of the energy
performance of office buildings with mono-crystalline semi-transparent PV façades

Chapter 6
– 109 –
includes three main assessments: (1) PV electricity generation, (2)
artificial-lighting electricity consumption, and (3) heating and cooling electricity
consumption.
The PVR significantly affects the overall energy consumption of the buildings,
including PV generation, lighting, cooling, and heating. In a study of Bing Jiang
and Jie Ji, the effect of the PVR on the thermal and electrical performance of a
photovoltaic-Trombe wall showed that a larger PV coverage ratio reduced the
thermal performance (Lukač and Žalik, 2013). Another study (Jiang et al., 2008)
found that a certain PVR consumed the lowest energy consumption under specific
architectural conditions. In another study (Wong et al., 2008), different solar cell
transmittances had various effects on the overall energy performance of different
window-to-wall ratio cases, and lighting control was an important element in
maximising the benefit of a semi-transparent PV façade. Different ventilated PV
façades in a range of PVR were evaluated to determine their effects on the overall
energy performance to obtain the optimal design (Miyazaki et al., 2005). These
studies suggest that identifying the optimal PVR for PV façades can help reducing
the overall energy consumption. In the early design stages of PV façades, the effect
on the overall energy consumption should be considered.
Different climate environments result in different overall energy savings
because of the optimised PVR on PV façades. In Brazil, semi-transparent windows
save as much as 43% of energy consumption (Yun et al., 2007); whereas in Japan,
55% overall energy is saved using a solar cell transmittance of 40% compared to a
single glazing façade (Wong et al., 2008). In Singapore, energy is saved by
16.7-41.3% (Leite Didoné and Wagner, 2013). Other studies (Ng et al., 2013; Lu
and Law, 2013) also suggest that it is important to consider the effect of the urban
and climate environment on the design of semi-transparent PV façades.
This chapter discusses the energy evaluation of mono-crystalline
semi-transparent with a parametric analysis. The validated calculation models and
methods in Chapter 5 were incorporated into the previously defined architectural
model to investigate the effects of different PVR on the energy performance using
Energy Plus. The overall energy performance, which includes PV electricity

Chapter 6
– 110 –
generation, lighting, heating and cooling electricity consumption, was examined
under different architectural conditions. Different combinations of room depth and
WWR were carefully examined for a southern orientation, whereas the PVR was
varied from 10% to 80% at 5% intervals. The criterion of electricity consumption
per floor area (kWh/m2) was used to account for the differences in floor area for
different values of room depth, which provided normalised results. All figures are
evaluated using an annual value or average annual value (if it is not specifically
mentioned) to see the entire picture of overall energy consumption of all four
seasons.
6.2. Parametric analyses of the overall energy performance of
mono-crystalline semi-transparent PV façades
6.2.1. Effects on the PV electricity generation
Solar cells convert solar energy into electricity and typically operate with a
specific conversion efficiency, which is primarily affected by the material
characteristics and operating temperature of the cells. Compared to transparent
glass, mono-crystalline silicon solar cells typically have higher solar absorbance.
Thus, the amount of gained solar heat can be increased by adopting a denser solar
cell array and a higher PVR. Accordingly, this principle should also increase the
temperature and reduce the conversion efficiency of the solar cells. In the present
study, the temperature and conversion efficiency of solar cells were investigated
throughout March 1 2013 (Figure 6.1), which was a steady sunny day with little
cloud coverage to minimise the effect of incident climates. The temperature of the
solar cell significantly increased significantly (more than 18°C) in the morning
and reached the highest value at noon; then, it slowly decreased in the afternoon
but maintained a relatively high temperature compared to that in the morning.
Meanwhile, the PV electricity conversion efficiency decreased in the morning and
reached its lowest point at noon with a deviation of approximately 0.02. The
conversion efficiency began to increase in the afternoon but remained relatively
lower than that in the morning. The results demonstrate that the conversion
efficiency decreases with increasing temperature and vice versa.

Chapter 6
– 111 –
With different PVR, for example, when it is at noon, the temperature for the
80% PVR case was 7°C higher than that for the 10% PVR case; this temperature
difference corresponded to a 0.007 decrease in conversion efficiency, which is
5.5% lower than the 10% PVR case. The results demonstrate the importance of
considering PVR in PV electricity generation. This discovery indicates that with
the increase of PVR in PV façades, the marginal returns of the PV electricity yield
is diminished. The increase in PVR does not proportionally increase the PV
electricity yield. This marginal effect becomes more significant with high solar
radiation conditions; for example, at noon when solar radiation reaches its peak
value, the deviation of the PV conversion efficiency of different PVR also appears
most significant.
In conclusion, the analysis of the PV electricity conversion efficiency
indicates two important facts: (1) temperature significantly affects the conversion
efficiency; (2) the marginal returns of electricity yield are diminished by the
increase in temperature because of a higher PVR.
Figure 6.1 Solar cell temperature and its conversion efficiency
in different PVR cases

Chapter 6
– 112 –
6.2.2. Effects on the daylight and the lighting electricity consumption
The amount of daylight that is blocked by solar cells can considerably vary in
response to differences in PVR among semi-transparent PV panels, which can have
a vital effect on the indoor illuminance. If the indoor illuminance decreases below a
given threshold, artificial lighting is required to achieve a comfortable lighting
environment, and electricity must be consumed to achieve this result. However, the
room depth and WWR may also affect the performance of semi-transparent PV
panels at different PVR. Thus, it is important to understand the relationship
between PVR and the indoor illuminance for different combinations of room depth
and WWR.
For larger room depth (i.e., deeper rooms), it is more difficult for daylight to
reach deep inside the room. Thus, even for identical PVR, daylight illuminance
tends to vary depending on the room depth conditions. Figure 6.2 illustrates the
indoor daylight illuminance for different PVR under various room depth conditions
for a fixed WWR of 0.35. The results show that the indoor illuminance rapidly
decreases with increasing PVR, with more pronounced decreases at smaller values
of room depth. The illuminance decreases from 2000 lx to less than 600 when PVR
increases from 10% to 80% in a 4 m deep room. In a 13 m deep room, the
illuminance decreases from 230 lx to less than 50 lx. In such a room with less than
50 lx illuminance level, artificial lighting must be on full operation to maintain a
comfortable lighting environment indoor. In general, shorter rooms (i.e., smaller
room depth) experience much higher daylight illuminance than deep rooms (i.e.,
with larger room depth). Moreover, indoor illuminance remains below 400 lux for
all cases where the room depth exceeds 9 m. These results demonstrate that the
effects of PVR on daylight illuminance strongly depend on the room depth.

Chapter 6
– 113 –
Figure 6.2 Indoor daylight illuminance of different PVR
in different room depth cases
With artificial-lighting compensation, Figure 6.3 shows the lighting electricity
consumption of different PVR in different room depth cases. It is obvious that the
artificial-lighting electricity consumption increases when daylight illuminance
decreases because of higher PVR. However, this result does not occur with a linear
dependence. For small-room-depth cases, the lighting electricity consumption
increases much faster when PVR exceeds 50%; for larger-room-depth cases, the
increase is closer to a linear dependence. For example, in a 4 m deep room, the
lighting energy consumption increases from 17 kWh/m2 to 18 kWh/m
2 with only
notably limited increase when PV increases from 10% to 80%; however, in a 13 m
deep room, the lighting energy consumption increases from 21 kWh/m2 to 32
kWh/m2 with more than 11kWh/m
2 increase. However, because of the advantage of
higher indoor illuminance, small-room-depth cases consume less lighting
electricity of at most 15 kWh/m2.

Chapter 6
– 114 –
Figure 6.3 Lighting electricity consumption of different PVR
in different room depth cases
We previously discussed the effect of different PVR in different room depth
cases. The effects of different PVR in different WWR cases are discussed as
follows.
Compared to a small WWR case, a large WWR case allows more daylight to
reach inside the room and has a bigger window area to install mono-crystalline
semi-transparent PV, which leads to better illuminance indoor and reduce the
artificial-lighting demand. Figure 6.4 shows the average indoor daylight
illuminance of different PVR in different WWR cases at a fix room depth of 6 m.
Similar to the depth cases, illuminance decreases when PVR increases. In a 0.2
WWR room, the illuminance decreases from 1100 lx to less than 300 lx when PVR
increases from 10% to 80%. In a 0.7 WWR room, the illuminance decreases from
300 lx to less than 50 lx. However, the difference among different WWR cases is
much smaller compared to the different room depth cases. This result indicates that
the WWR less significantly affects the daylight illuminance than the room depth,
which is also true for lighting energy consumption as Figure 6.5 shows. The
lighting electricity consumption increases with the increase in PVR. However, the

Chapter 6
– 115 –
difference is smaller among the WWR cases with electricity savings of at most 9
kWh/m2.
Figure 6.4 Indoor daylight illuminance of different PVR in different WWR cases
Figure 6.5 Lighting electricity consumption of different PVR in different WWR
cases
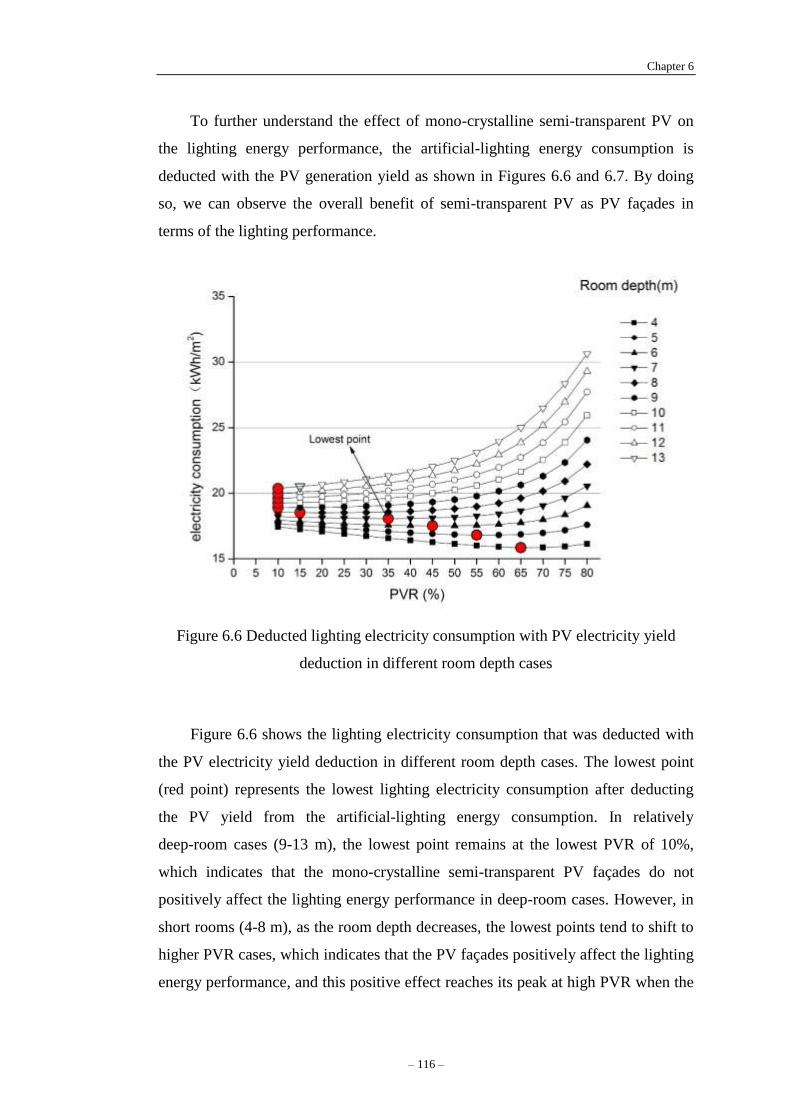
Chapter 6
– 116 –
To further understand the effect of mono-crystalline semi-transparent PV on
the lighting energy performance, the artificial-lighting energy consumption is
deducted with the PV generation yield as shown in Figures 6.6 and 6.7. By doing
so, we can observe the overall benefit of semi-transparent PV as PV façades in
terms of the lighting performance.
Figure 6.6 Deducted lighting electricity consumption with PV electricity yield
deduction in different room depth cases
Figure 6.6 shows the lighting electricity consumption that was deducted with
the PV electricity yield deduction in different room depth cases. The lowest point
(red point) represents the lowest lighting electricity consumption after deducting
the PV yield from the artificial-lighting energy consumption. In relatively
deep-room cases (9-13 m), the lowest point remains at the lowest PVR of 10%,
which indicates that the mono-crystalline semi-transparent PV façades do not
positively affect the lighting energy performance in deep-room cases. However, in
short rooms (4-8 m), as the room depth decreases, the lowest points tend to shift to
higher PVR cases, which indicates that the PV façades positively affect the lighting
energy performance, and this positive effect reaches its peak at high PVR when the

Chapter 6
– 117 –
room depth decreases. For example, in a 5 m deep room, the lighting energy
consumption with the deducted PV yield is minimum (16.81 kWh/m2) when PVR
is 55%, and the lowest value (15.8 kWh/m2) is achieved at 65% PVR for a 4 m
deep room.
Figure 6.7 Deducted lighting electricity consumption with PV electricity yield
deduction in different WWR cases
Figure 6.7 shows the deducted lighting electricity consumption with PV
electricity yield deduction in different WWR cases. Again, the lowest point (red
point) represents the lowest lighting electricity consumption after deducting the PV
yield from the artificial-lighting energy consumption. In relatively small WWR
cases (0.2-0.25), similar to the room depth cases in Figure 6.6, the lowest point
remains at the lowest PVR, which indicates that the mono-crystalline
semi-transparent PV façades do not positively affect the lighting energy
performance when the window area are small (small WWR). However, in mid- and
large-window room cases (WWR: 0.3-0.7), when the WWR increases, the lowest
points tend to shift to higher PVR cases. Thus, PV façades positively affect the
Chapter 6
– 118 –
lighting energy performance at higher PVR when the WWR increases. For
example, in a room of 0.5 WWR, the lighting energy consumption with deducted
PV yield is minimum (17.08 kWh/m2) when the PVR is 55%, and the lowest value
(16.3 kWh/m2) is achieved for a room of 0.6 WWR when the PVR is 60%.
The analysis with deducted lighting electricity consumption with PV
electricity yield implies that mono-crystalline semi-transparent PV façades are
more suitable and provide better lighting energy performance in relatively short
rooms or relatively large-window rooms. This discovery shows the importance of a
proper PVR when mono-crystalline semi-transparent PV façades are used for better
lighting energy performance.
6.2.3. Effects on the heating and cooling electricity consumption
Before we analyse the effects of heating and cooling electricity consumption,
the factor of climate conditions should be discussed because the heating and
cooling demand is strongly related to climate conditions.
In Wuhan, central China, which is in a typical hot-summer cold-winter climate
zone, the amount of heat gain through window glass in summer is larger than that
of heat loss in winter considering the use of air conditioning control system. Figure
6.8 shows the monthly heat gain and heat loss through clear window glass
(WWR=0.35) of a typical room in Wuhan area. In summer, the heat gain reaches
its peak of over 150 kWh in this simulated room in August, which is larger than the
heat loss in winter with a peak value of less than 80 kWh. In the entire year, the
total amount of heat gain is also lager than that of heat loss, which indicates that in
Wuhan, saving energy from reducing the cooling loads is more effective than
reducing the heating loads in terms of saving the total heating and cooling
electricity consumption. Office buildings are more easily affected by solar radiation
because they mainly function during daytime. Different amounts of solar radiation
through mono-crystalline semi-transparent PV of different PVR can affect the
heating and cooling loads. In winter, more solar radiation can reduce the heating
demand, but it increases the cooling demand in summer.

Chapter 6
– 119 –
Figure 6.8 Monthly heat gain and heat loss through clear window glass
(WWR=0.35) in the Wuhan
Heating and cooling loads of office buildings are more easily affected by solar
irradiance because office buildings typically function primarily during daytime.
Varying the amount of solar irradiance that enters a building by installing
mono-crystalline semi-transparent PV panels with different PVR can affect the
heating and cooling loads. Increasing the influx of solar irradiance can reduce the
heating demand in winter; however, it also increases the cooling demand in
summer.
A computation simulation is performed to investigate the effect of PVR on the
annual heat gain and heat loss through mono-crystalline semi-transparent PV
glazing in a generic room (WWR=0.2). As Figure 6.9 shows, the heat gain through
PV façades significantly changes with a changing PVR; however, the heat loss
remains constant for all PVR cases. With the increase in PVR (more solar radiation
was blocked by mono-crystalline), the heat gain by solar radiation is largely
reduced and significantly decreases the heat gain. The heat gain through PV
glazing decreases from more than 1900 kWh to less than 400 kWh when PVR
increases from 10% to 80%, which indicates that 78% of heat gain through glazing
is reduced by increasing the PVR. However, the heat loss slightly increases with
the increase in PVR. The amount of heat loss through a 10% PVR PV glazing is

Chapter 6
– 120 –
513 kWh, and that number slowly increases to 550 kWh when the PVR increases to
80%.
Figure 6.9 Heat gain and heat loss through mono-crystalline semi-transparent PV
glazing in a 4m-depth room (WWR=0.2)
A combined value of heat gain (heat gain minus heat loss) and heat loss is
shown in Figure 6.10 to investigate the heat balance through mono-crystalline
semi-transparent PV glazing of different PVR. The total heat balance state is
―gaining heat‖ when the PVR is 10-70%. This result indicates that the indoor
environment obtains too much heat from solar radiation and the outside
environment. Thus, the indoor cooling demand increases and costs more energy if
we want to maintain a comfortable temperature indoor. In this case, how to reduce
the cooling demand is the main issue in terms of saving energy consumption. When
the PVR increases as Figure 6.9 shows, the heat gain and heat loss tend to balance
when the PVR is approximately 70%. After the PVR surpasses 70%, the heat
balance state turns into ―losing heat‖. In general, this analysis indicates that a high
PVR is beneficial to reduce the heating demand and the AC electricity
consumption.

Chapter 6
– 121 –
Figure 6.10 Combined value of heat gain and heat loss (heat gain minus heat loss)
Figure 6.11 Heat gain and heat loss through mono-crystalline semi-transparent PV
glazing with a fixed PVR of 40% (WWR=0.2)

Chapter 6
– 122 –
To investigate the effect of the room depth, the heat gain and heat loss through
mono-crystalline semi-transparent PV glazing of different room depths are
simulated. In this simulation, the PVR is set at a fixed value of 40% (WWR=0.2).
The results are shown in Figure 6.11, and we observe that both heat gain and heat
loss changes notably little with the increase in room depth.
The analysis of heat balance through PV glazing indicates that a high PVR can
reduce the cooling demand because it reduces the heat gain. However, further
analysis of the heating and cooling energy of generic rooms remains necessary as a
final result of how the PV façades of different PVR affect the cooling and heating
demand and the electricity consumption.
Figure 6.12 Heating and cooling electricity consumption of different PVR in
different room depth cases at a fixed WWR of 0.35
Figure 6.12 illustrates the heating and cooling electricity consumption for
different PVR for several room depth cases with a fixed WWR of 0.35. The heating
and cooling electricity consumption first decreases with increasing PVR, although
the rate of decrease decreases when the PVR exceeds 50%. The cases with higher
PVR appear to perform better in terms of heating and cooling energy savings based

Chapter 6
– 123 –
on the annual data. This result can be primarily attributed to the climatic conditions
in central China, where the cooling load in summer is typically greater than the
heating load in winter. However, the benefits of high PVR become less pronounced
when the room depth increases: the shortest room has the highest heating and
cooling electricity consumption, although the variations in consumption with
changes in room depth become less pronounced when the room depth exceeds 9 m.
These results highlight the importance of considering the PVR, particularly in cases
with small room depths.
Figure 6.13 Heating and cooling electricity consumption of different PVR in
different WWR cases
Figure 6.13 illustrates the heating and cooling electricity consumption for
different PVR in cases with different WWR. For the cases with variable room
depths, the heating and cooling electricity consumption first decreases with
increasing PVR, and the rate of decrease decreases when the PVR exceeds 60%.
Cases with small WWR typically perform better in terms of heating and cooling

Chapter 6
– 124 –
energy saving, and the effects of varying PVR are typically less pronounced for
small WWR. However, the effects of the WWR increase even among cases, which
indicates that the heating and cooling electricity consumption continues to increase
with increasing WWR with no signs of decreasing or stabilising.
To further understand the effect of mono-crystalline semi-transparent PV on
the lighting energy performance, the heating and cooling electricity consumption is
deducted using the PV generation yield and shown in Figures 6.14 and 6.15. By
doing so, we can observe the overall benefit of semi-transparent PV as PV façades
in terms of the heating and cooling energy performance.
The main difference from the cases without considering the PV generation
benefit (Figure 6.11) is that the heating and cooling electricity consumption of the
generic rooms decrease (saving more energy) at a bigger value when the PVR
increases, as Figures 6.14 and 6.15 show.
Figure 6.14 Deducted heating and cooling electricity consumption with the PV
electricity yield deduction in different room depth cases

Chapter 6
– 125 –
For example, in Figure 6.14 (different room depth cases), with the PV
electricity yield, in a 4 m deep room, the heating and cooling electricity
consumption decreases from 38.2 kWh/m2 (at 10% PVR) to 27.7 kWh/m
2(at 80%
PVR) with 11.5 kWh/m2 electricity saved. Without the PV electricity yield, the
heating and cooling electricity consumption decreases from 38.6 kWh/m2
to 30.9
kWh/m2 with 7.3 kWh/m
2 electricity saved (Figure 6.12). This result indicates that
a high PVR reduce heating and cooling electricity consumption. However, this
positive effect becomes less significant in deep rooms. The electricity saving is
11.5 kWh/m2
for a 4 m deep room, and that number is 2.3 kWh/m2 for a 13 m deep
room. Again, these results highlight the importance of considering the PVR,
particularly in cases with small room depths.
Figure 6.15 Deducted heating and cooling consumption with a PV electricity yield
deduction in different WWR cases
In Figure 6.15 (different WWR cases), with the PV electricity yield, the
heating and cooling electricity consumption rapidly decreases compared to that
shown in Figure 6.13. For example, in a 0.7 WWR room, the heating and cooling

Chapter 6
– 126 –
electricity consumption decreases from 24.3 kWh/m2 (at 10% PVR) to 14.9
kWh/m2 (at 80% PVR) with 9.4 kWh/m
2 electricity saved. Without the PV
electricity yield, that consumption decreases from 24.9 kWh/m2
to 19.3 kWh/m2
with only 5.6 kWh/m2 electricity saved (Figure 6.12). With higher PVR, the benefit
from PV façades on saving the cooling and heating electricity consumption is more
profound in all WWR cases. However, this positive effect becomes less significant
in small WWR rooms (small window), where the electricity saving is 9.4 kWh/m2
for a 0.7 WWR room and only 1.9 kWh/m2 for a 0.2 WWR room.
6.2.4. Effects on the overall energy consumption
Based on the previously presented analysis, it can be concluded that increasing
PVR under the climatic conditions in central China typically decreases the PV
electricity conversion efficiency and the heating and cooling electricity
consumption but increases the lighting electricity consumption. However, the
effects of the room depth and the WWR on these relationships are pronounced,
which demonstrates that these factors must be carefully considered when designing
mono-crystalline semi-transparent PV technology for buildings. Therefore, it is
necessary to evaluate the overall energy consumption considering all of these
factors to determine an optimal PVR. With the electricity benefit of PV power
generation, the overall electricity consumption is provided as follows.
Overall energy consumption = Lighting energy consumption + cooling and
heating energy consumption – PV electricity generation.
Figures 6.16 (a) and (b) illustrate the overall energy consumption for cases
with large WWR (0.6) for two different room depths (6 m and 12 m, respectively).
These two figures can present the results in a large-window architectural situation.
In such cases, the solar radiation and daylight are strong, which leads to an
interesting ―competition‖ between the decrease of lighting electricity consumption
and the increase of heating and cooling electricity consumption. The key lies in
whether the increase or decrease has a bigger effect on the overall energy
consumption. In addition, because a larger window area indicates the larger area to
install PV, the PV electricity generation is also more significant in such cases.

Chapter 6
– 127 –
For a short room (6 m deep, Figure 16 (a)), the decrease in artificial-lighting
energy is more significant than the increase in the heating and cooling electricity
consumption. A PVR of 80% achieves the lowest overall electricity consumption,
which saves 18.9% energy compared to the case with a PVR of 10%. This result
can be primarily attributed to the influence of heating and cooling electricity
consumption: high PVR can reduce the enormous cooling demands for short
rooms. Conversely, for a room depth of 12 m, the greatest electricity savings are
achieved for a PVR of 50%. This result can be primarily attributed to the decreases
in lighting electricity consumption during daytime because of the smaller PVR;
these savings overwhelm the effects of the heating and cooling electricity
consumption.
Figures 6.17 (a) and (b) illustrate the overall energy consumption for cases
with small WWR (0.3) for two different room depths (6 m and 12 m, respectively).
These two figures can present the results in a small-window architectural situation,
which has a relatively smaller total solar radiation and daylight than the large
window cases in Figure 16. In addition, electricity generation is typically notably
small compared to the lighting and heating electricity consumption because of the
limited available area to install semi-transparent PV panels because the window
area is small. In this case, with small PV electricity generation, it becomes less
significant for semi-transparent PV applications. However, the influence of the
PVR remains pronounced, particularly its effects on daylight and the heating and
cooling demand. For the 6 m room, a PVR of 60% achieves the lowest electricity
consumption, with electricity savings of 6.8% compared to a PVR of 10%.
Conversely, in the 12 m room, a PVR of 20% achieves the lowest electricity
consumption, with electricity savings of 17.3% compared to a PVR of 80%.

Chapter 6
– 128 –
(a)
(b)
Figure 6.16 Overall energy consumption of large WWR rooms in two cases of
room depth (a) 6 m and (b) 12 m

Chapter 6
– 129 –
(a).
(b)
Figure 6.17 Overall energy consumption of small WWR rooms in two cases of
room depth (a) 6 m and (b) 12 m

Chapter 6
– 130 –
6.3. Optimal PVR according to the overall energy performance
Based on the previous parametric analysis, it is clear that an optimal PVR (i.e.,
that which achieves the lowest overall electricity consumption) can be obtained
based on a particular combination of WWR, room depth, and orientation. Thus, the
optimal PVR should be selected by comparing the overall energy consumption
results for all PVR cases under different architectural conditions (i.e., WWR, room
depth, and orientation). The southern orientation is typically affected more
extensively by solar energy than the other orientations; accordingly, it is often the
preferred orientation to install photovoltaic applications. Variations in WWR and
room depth can lead to considerable variations in the optimal PVR (Table 6.1).
Table 6.1 Optimal PVR in different combinations of room depth and WWR in the
southern orientation
Optimal PVR (%)
WWR Room depth(m)
4 5 6 7 8 9 10 11 12 13
0.2 75 55 50 40 35 20 10 10 10 10
0.25 80 60 55 50 40 40 30 10 10 10
0.3 80 75 60 55 50 40 40 30 20 10
0.35 80 80 75 55 55 45 40 40 35 30
0.4 80 80 75 60 55 50 45 40 40 40
0.45 80 80 80 75 60 55 50 45 40 40
0.5 80 80 80 75 70 60 55 50 45 40
0.55 80 80 80 80 75 60 55 55 50 45
0.6 80 80 80 80 75 75 60 55 55 50
0.65 80 80 80 80 75 75 60 60 55 50
0.7 80 80 80 80 80 75 75 60 55 55

Chapter 6
– 131 –
From Table 6.1, two main trends of the optimal PVR can be concluded as
follows.
(1) Optimal PVR tends to be lower in deep rooms and higher in short rooms.
(2) Optimal PVR tends to be lower in small WWR (small-window) rooms than
large WWR (big-window) rooms.
Table 6.2 Electricity saving using optimal PVR compared to most disadvantaged
PVR
The differences in the overall electricity consumption between the most and
least favourable PVR were calculated and are shown in Table 6.2. In particular,
electricity savings for different combinations of room depth and WWR were
calculated as percentages. The electricity savings ranged from 5% to 30%, with an
WWR
Electricity Saving (%)
Room depth(m)
Average
4 5 6 7 8 9 10 11 12 13
0.2 7 5 6 10 14 17 20 21 22 23 15
0.25 10 7 5 7 10 14 16 18 20 21 13
0.3 13 10 7 5 7 11 13 16 17 19 12
0.35 16 12 9 7 5 8 11 13 15 17 11
0.4 18 14 11 8 7 6 8 11 13 15 11
0.45 23 18 14 11 9 7 6 9 12 14 12
0.5 23 19 15 12 10 8 7 6 8 10 12
0.55 25 21 17 14 11 9 8 6 7 9 13
0.6 26 23 19 16 13 10 9 7 6 7 14
0.65 28 24 21 17 14 12 10 8 7 6 15
0.7 30 26 22 19 16 13 11 10 8 7 16
Average 20 16 13 12 11 10 11 11 12 13 13

Chapter 6
– 132 –
average saving of 13% for the optimal PVR. Moreover, the optimal PVR was
particularly important in short rooms with large WWR, where electricity savings of
over 20% were achieved. From Table 6.2, two conclusions can be made.
(1) The differences in the overall electricity consumption of different PVR are
more significant in deep rooms with small WWR.
(2) The differences in the overall electricity consumption of different PVR are
more significant in short rooms with large WWR.
The variations in optimal PVR were also investigated. The optimal PVR
decreased with increasing room depth (i.e., from 4 m to 13 m). This result can be
primarily attributed to the fact that the electricity demand during daytime increases
faster than the compensation of savings in heating and cooling. This result also
explains why rooms with greater depths typically have smaller optimal PVR.
Furthermore, the optimal PVR increases when the WWR increases from 0.2 to 0.7
primarily because the achieved electricity savings by adopting a larger WWR
(combined with the greater PV electricity generation and lower cooling load) result
in higher optimal PVR.
Table 6.3 Optimal PVR of different combinations of orientation and room depth
Orientation
Optimal PVR (%)
Room depth(m)
4 5 6 7 8 9 10 11 12 13
E 75 60 50 45 35 25 20 20 20 15
SE 75 60 50 45 40 35 30 30 25 20
S 80 80 75 55 55 45 40 40 35 30
SW 80 80 75 65 55 50 50 45 40 35
W 80 80 80 75 65 55 55 50 45 40

Chapter 6
– 133 –
To demonstrate the effects of different orientations on the optimal PVR,
different combinations of orientation and room depth (WWR) were investigated
with a fixed WWR of 0.35 (8 m). The orientation was varied among east,
southeast, south, southwest, and west (Table 6.3 and Table 6.4). The northern
orientation was not included in this investigation because it is particularly
unfavourable for PV applications. The results demonstrate that the optimal PVR is
highest in the west orientation. Under the prevalent climatic conditions in central
China, the cooling demands in the summer typically exceed the heating demands in
the winter. Thus, in the summer, a high PVR can reduce the cooling load that is
associated with the accumulated heat indoors during the daytime.
Table 6.4 Optimal PVR of different combinations of orientation and WWR(fixed
room depth of 8m)
Orientation
Optimal PVR (%)
WWR
0.2 0.25 0.3 0.35 0.4 0.45 0.5 0.6 0.6 0.65 0.7
E 25 40 40 45 50 60 60 60 70 70 70
SE 25 40 40 45 50 60 60 65 70 70 75
S 35 40 50 55 55 60 70 75 75 75 80
SW 35 50 50 60 65 65 70 75 75 75 80
W 35 50 50 60 65 65 70 75 75 75 80
6.4. Energy saving of mono-crystalline semi-transparent PV glazing
compared to three traditional glazings
In this section, the energy performance of the mono-crystalline
semi-transparent PV façade layouts of each optimal PVR is compared with three
traditional glazings: (1) single glazing, (2) Low-E double glazing and (3) normal
double glazing. This comparison is a further evaluation of how the
mono-crystalline semi-transparent PV competes with the traditional and commonly
used glazings that are currently in China in terms of energy saving.

Chapter 6
– 134 –
Figure 6.18 shows the sections of three traditional glazings: 3-mm single
glazing (Figure 6.18(b)), 6 mm Low-E double glazing with a 12-mm air gap
(Figure 6.18(c)) and 6-mm double glazing with a 12-mm air gap (Figure 6.18(d)).
Figure 6.18 (a) shows the mono-crystalline semi-transparent PV, of which the layer
consistency and calculation models were discussed and presented in Chapter 5.
Single glazing, which is common in buildings built before 1990, is still produced
and used in buildings today, but its usage has rapidly declined in recent years
because of inferior energy performance. With the increase in the energy price and
economic booming in China, more energy-efficient glazings are more commonly
used in new developments. Double glazing is the most commonly used glazing in
China today and has a much better performance than single glazing; additionally,
the cost is affordable for most building developments. Low-E double glazing is
currently the best glazing in the market in China. In terms of energy performance,
the Low-E layer in the glazing can reduce the heat gain from the outside
environment by reducing the long-wave radiation penetration. However, Low-E
double glazing is much more expensive than normal double glazing and single
glazing.
To perform such comparisons, calculation models for the three traditional
glazings are required and are provided by Energy Plus. The properties (Table 6.5)
of these glazings are also required, which are provided by the Chinese Calculation
Specification for Thermal Performance of Windows, Doors and Glass
Curtain-Walls (JGJ/T 151-2008). The properties are incorporated into Energy Plus
to perform the computation simulations.
Table 6.5 Properties of three traditional glazings
Glazings U-value
(W/m2K)
SHGC
Visible
transmitance
Single glazing 5.8 0.870 0.87
Low-E double glazing 1.9 0.446 0.72
Double glazing 2.8 0.767 0.71

Chapter 6
– 135 –
Figure 6.18 Mono-crystalline PV glazing and three traditional glazings
(a) Mono-crystalline PV glazing, (b) 3 mm single glazing, (c) 6 mm Low-E
double glazing with a 12 mm air gap and (d) 6 mm double glazing with a 12 mm
air gap
Two types of architectural models are used in this section and are illustrated
in Figure 6.19. The first type is generic rooms with relatively small windows at a
WWR of 0.3. The other type is generic rooms with larger windows at a WWR of
0.6. The 0.3 WWR model represents most traditional office buildings in China that
were built before 2000. The large WWR model represents the emerging A-class
office buildings with full glazing façades. The architectural-model details are
discussed and provided in Section 5.3.
Figure 6.19 Illustration of small WWR cases and large WWR cases

Chapter 6
– 136 –
The mono-crystalline semi-transparent PV and other three traditional glazings
are first compared in the small WWR case and subsequently in the large WWR
case to investigate the performance of lighting, heating and cooling energy. The PV
electricity generation of the PV glazing is automatically included in all
comparisons. The results are presented in annual values with different room depths.
6.4.1 Energy savings in small WWR cases
Figure 6.20 Daylight illuminance of different glazings at WWR of 0.3
Figure 6.20 shows the daylight illuminance of different glazings for the 0.3
WWR cases. The single glazing has the highest illuminance among all glazings,
and all mono-crystalline semi-transparent PV glazings are inferior to the three
traditional glazings. The 80% PVR mono-crystalline semi-transparent PV has the
worst daylight level. However, generally, the illuminance level of the
mono-crystalline semi-transparent PV glazing under 30% PVR is only 25% less
than that of the Low-E double glazing and is also notably close to that of double
glazing. It should be noticed that as long as the illuminance is above 300 Lux, the
indoor lighting environment is comfortable, and an artificial lighting system is not

Chapter 6
– 137 –
necessary. In such case, although the PV glazing has a much lower illuminance
than the traditional glazings, the difference of artificial-lighting energy
consumption between the two types of glazing is less significant than the daylight
illuminance level. In other words, the effect of such difference on the
artificial-lighting electricity consumption is not as obvious as the daylight
illuminance performance.
Figure 6.21 Lighting electricity consumption of different glazings at WWR of 0.3
Figure 6.21 shows the lighting electricity consumption of different glazings at
0.3 WWR. Because the traditional glazings have better daylight illuminance levels,
they relatively achieve lower artificial-lighting electricity consumption. However,
the difference varies in different room depth cases. In short rooms, the difference of
artificial-lighting electricity consumption is relatively small between the
mono-crystalline semi-transparent PV and the traditional glazings. This difference
increases in deep rooms. For example, an 80% PVR PV glazing is 2.2 kWh/m2
higher than the Low-E double glazing in a 4-m-deep room; however, in a
13-m-deep room, that number is above 13 kWh/m2. This result indicates that the

Chapter 6
– 138 –
effect of PV façades on the lighting electricity consumption is more profound in
deep rooms.
However, when the PVR is below 50%, the difference between the
mono-crystalline semi-transparent PV and traditional glazings is smaller than that
when the PVR is above 50%. For example, compared to Low-E double glazing, a
40% PVR PV glazing leads to only approximately 20% more electricity
consumption; this number is over 50% for a 80% PVR PV glazing.
Figure 6.22 Heating and cooling electricity consumption of different glazings
at WWR of 0.3
Figure 6.22 shows the heating and cooling electricity consumption of different
glazings at 0.3 WWR. The Low-E double glazing has the lowest electricity
consumption, and the mono-crystalline of different PVR has the second lowest
electricity consumption. The single glazing has the highest electricity consumption
among all types. The mono-crystalline semi-transparent glazing of 80% PVR can
save more than 30% heating and cooling electricity compared to single glazing and
25% compared to double glazing. Compared to the best performing glazing
(Low-E double glazing), PV glazings with at least 50% PVR maintains a small
difference (less than 10%). This result shows the great potential of
mono-crystalline semi-transparent PV in saving heating and cooling energy

Chapter 6
– 139 –
because it performs better than the most commonly used glazing (double glazing)
mainly because of the solar radiation blocking by PV cells in the summer, which
saves the cooling demands indoor. This outcome again confirms the conclusion
from Section 6.2.3, which is that saving the cooling energy consumption is more
efficient and profound than saving the heating energy consumption in Hot-Summer
Cold-Winter zones such as the Wuhan area.
Figure 6.23 Overall energy consumption of different glazings at WWR of 0.3
Figure 6.23 shows the overall energy consumption of different glazings at 0.3
WWR. In small room depths cases below 8 m, the Low-E double glazing has the
best energy performance, and the mono-crystalline semi-transparent PV of different
PVR has the second best performance, whereas single glazing and double glazing
have the worst energy performance. However, in large room depth cases above 8
m, the overall energy consumption of the mono-crystalline semi-transparent PV
glazing of 50%-80% PVR is higher than single glazing and double glazing mainly
because the increase in lighting electricity consumption is caused by high PVR.

Chapter 6
– 140 –
By comparing the overall energy performance of different glazings in the above
small WWR (small-window) cases, we conclude that:
(1) Low PVR (below 50%) mono-crystalline semi-transparent PV glazing has
a better overall energy performance than single glazing and double glazing
in all room depth cases.
(2) High PVR (above 50%) mono-crystalline semi-transparent PV glazing has
a better overall energy performance than single glazing and double glazing
in short rooms; however, in deep-room cases, it is worse than all
traditional glazings.
(3) The overall energy performance of mono-crystalline semi-transparent PV
glazings is worse than that of Low-E double glazing in all cases,
particularly in deep rooms.
6.4.2 Energy savings in large WWR cases
Figure 6.24 Daylight illuminance of different glazings at WWR of 0.6

Chapter 6
– 141 –
Figure 6.24 shows the daylight illuminance of different glazings at 0.6 WWR.
Similar to the small room depth cases, single glazing has the highest illuminance
among all glazing types, followed by double glazing and Low-E double glazing.
Mono-crystalline semi-transparent PV has the worst daylight illuminance level
among the three traditional glazings. Figure 6.24 shows the lighting electricity
consumption of different glazings at 0.6 WWR. Because the traditional glazings
have better daylight illuminance, they also have lower lighting electricity
consumption than the mono-crystalline semi-transparent PV glazing. The
difference between PV glazings and traditional glazings increases from less than
5% to 30% when the room depth increases from 4 m to 13 m. In addition, when the
PVR is over 60%, the lighting electricity consumption significantly increases
compared to that of the low PVR glazing.
Figure 6.25 Lighting electricity consumption of different glazings at WWR of 0.6
Figure 6.26 shows the heating and cooling electricity consumption of different
glazings at 0.6 WWR. Compared to the small WWR cases in Section 6.4.1, the
difference in heating and cooling electricity consumption becomes more significant
among mono-crystalline semi-transparent PV and single glazing and double

Chapter 6
– 142 –
glazing. The 80% PVR PV glazing has identically good energy performance with
the Low-E double glazing.
Figure 6.26 Heating and cooling electricity consumption of different glazings
at WWR of 0.6
Figure 6.27 shows the overall energy consumption of different glazings at 0.6
WWR. The mono-crystalline semi-transparent PVs of 50%-80% PVR have the best
energy performance among all glazings when the room depth is below 8 m. In
addition, in all room depth cases, the energy performance of the PV glazing
remains much better than single glazing and double glazing.
These discoveries indicate that in rooms with large windows, mono-crystalline
semi-transparent PV glazing of high PVR has the most efficient energy
performance, which is even better than Low-E double glazing in certain conditions.
This result is particularly important because the office buildings are developing
towards large-windows design in China. Nevertheless, its problem of high-energy
consumption must be addressed, and mono-crystalline semi-transparent PV façade
provides a promising option.

Chapter 6
– 143 –
Figure 6.27 Overall energy consumption of different glazings at WWR of 0.6
By comparing the overall energy performance of different glazings in these
large WWR (large-window) cases, we conclude that:
(1) Mono-crystalline semi-transparent PV glazing has a better overall energy
performance than single glazing and double glazing in all room depth
cases.
(2) High PVR (above 60%) mono-crystalline semi-transparent PV glazing has
a better overall energy performance than all traditional glazings in rooms
that are less than 8 m deep.
(3) In rooms with large windows, high PVR mono-crystalline
semi-transparent PV glazing has the most efficient energy performance.
6.5. Conclusions
This chapter discuses the energy evaluation of mono-crystalline
semi-transparent PV glazing on overall energy performance. The mono-crystalline
semi-transparent PV and traditional glazings were compared. Optimal PVR is

Chapter 6
– 144 –
investigated in different combinations of room depth, WWR and orientations. The
main discoveries are listed as following.
In the parametric analysis of the overall energy performance, the PV
electricity generation and the electricity consumption of lighting, heating and
cooling are analysed, with the following discoveries:
(1) Temperature significantly affects the conversion efficiency. When the
PVR increases, the PV electricity conversion efficiency decreases.
(2) When the PVR increases, the indoor daylight illuminance linearly
decreases, and the electricity consumption increases. The room depth has a
greater effect on the daylight performance than the WWR. In terms of
lighting energy saving, mono-crystalline semi-transparent PV façades are
more suitable and can provide better lighting energy performance in
relatively short rooms, or in relatively larger-window rooms.
(3) Under the climatic conditions of central China, increasing the PVR
appears to decrease the heating and cooling electricity consumption.
(4) An optimal PVR can be obtained with a particular combination of WWR,
room depth, and orientation. When the overall energy performance is
considered, adopting the optimal PVR can result in electricity savings of
up to 30% (average savings: 13%) compared to the least favourable PVR.
This result demonstrates the importance of selecting optimal PVR based
on the architectural conditions.
(5) The rooms with small room depth have relatively smaller optimal PVR
than rooms with lager room depth. Large WWR rooms have relatively
larger optimal PVR than small WWR rooms. This result indicates that
high PVR PV façades are more suitable for deep rooms with larger
window and small PVR PV façades are more suitable for short rooms with
small window.
In the comparison analysis between the three traditional glazings (single
glazing, double glazing and Low-E double glazing) and the mono-crystalline
semi-transparent PV glazing, the PV glazing generally has a better energy

Chapter 6
– 145 –
performance than single glazing and double-glazing, particularly in large WWR
cases:
(1) In small WWR rooms, low PVR (below 50%) mono-crystalline
semi-transparent PV glazing has a better over energy performance than
single glazing and double glazing in all room depth cases. In small WWR
rooms, high PVR (above 50%) mono-crystalline semi-transparent PV
glazing has a better overall energy performance than single glazing and
double glazing in short rooms; however, in deep-room cases, it is worse
than all traditional glazings.
(2) In small WWR rooms, the mono-crystalline semi-transparent PV glazing
has a worse overall energy performance than Low-E double glazing in all
cases, particularly in deep rooms.
(3) In large WWR rooms, high PVR mono-crystalline semi-transparent PV
glazing has the best efficient energy performance, which is even better
than Low-E double glazing in certain conditions. This result is particularly
important because the office buildings are developing toward large
window design in China.

Chapter 7
– 146 –
Chapter 7 Evaluation on energy
performance of office buildings with
amorphous-silicon semi-transparent
PV façades

Chapter 7
– 147 –
In Chapter 6, the overall energy performance of mono-crystalline
semi-transparent PV glazing has been examined. Amorphous-silicon
semi-transparent PV glazing is examined in Chapter 7 using similar methods. With
the calculation methods and architectural models presented in Chapter 5, the energy
(electricity) consumption of lighting, heating and cooling., is calculated. Section
7.2 discusses the energy evaluation for amorphous-silicon semi-transparent using a
parametric analysis. An optimizing design approach for amorphous-silicon
semi-transparent PV façade by optimal WWR is explored in Section 7.3. In
addition, energy saving of amorphous-silicon semi-transparent PV compared to
three traditional glazings is investigated and presented in Section 7.4.
7.1. Introduction
In terms of the two types of PV glazing, amorphous-silicon semi-transparent
does not have a wide variation of solar transmittance, which is different from
mono-crystalline semi-transparent PV, where the solar transmittance is controlled
using the PVR. On the contrary, the solar transmittance for amorphous-silicon PV
glazing is usually higher than 70% with limited changes. In this case, a fixed solar
transmittance value is used in this chapter for the amorphous-silicon
semi-transparent PV in all studied cases. This solar transmittance is obtained from
the observation value of the amorphous-silicon glazing that we use in the field
experiments. Other necessary properties for the simulation analysis were discussed
and provided in Chapter 5.
This chapter discusses the parametric analysis on the energy performance of
amorphous-silicon semi-transparent PV façades in office buildings. The validated
calculation models and methods for amorphous-silicon semi-transparent PV were
discussed in Chapter 5 and incorporated into the architectural models and Energy
Plus to investigate the effects of the amorphous-silicon PV in different WWR
cases. The overall energy performance, which includes the PV electricity
generation, lighting, heating and cooling electricity consumption, was examined
under different architectural conditions. Different combinations of room depth and
WWR were carefully examined for the southern orientation. The criterion of
electricity consumption per floor area (kWh/m2) was used to account for the
differences in floor area for different room depth to provide normalised results. All

Chapter 7
– 148 –
figures are evaluated using an annual value or average annual value (if it is not
specifically mentioned) to see the entire picture of the overall energy consumption
of four seasons.
7.2. Parametric analyses of the overall energy performance of
amorphous-silicon semi-transparent PV façades
7.2.1. Effects on the PV electricity generation
Figure 7.1 PV power generation of different WWR in different room depth cases
With the calculation method in Chapter 5, the PV generation conversion
efficiency of amorphous-silicon semi-transparent PV is simulated and investigated
throughout March 1 2013. Because the solar transmittance of the
amorphous-silicon PV layer is fixed, the results show that there is no tangible
relation between the WWR and the PV conversion efficiency. The conversion
efficiency remains at 4.9% for all cases in that result. With a larger WWR, there is
more window area for PV façades; thus, the PV electricity generation output
increases when the WWR increases. Because there is no tangible relation between
the WWR and the PV conversion efficiency, the PV electricity generation output
linearly increases with the increase in WWR as Figure 7.1 shows. In addition, it

Chapter 7
– 149 –
should be noticed that the amorphous-silicon semi-transparent PV (approximately
14%) has a much lower PV conversion efficiency than the mono-crystalline PV
(approximately 4.9%). In these cases, the total amount of PV electricity output is
also less significant.
7.2.2. Effects on the daylight and the lighting energy consumption
Figure 7.2 Indoor daylight illuminance of different WWR in different room depth
cases
Figure 7.2 shows the indoor daylight illuminance of different WWR in
different room depth cases. For a 4m deep room, illuminance increases 140% when
the WWR increases from 0.2 to 0.7; this incensement for a 13m deep room is
260%.. However, most cases remain below 300 lux, which indicates the
requirement of artificial-lighting compensation. When the room depth is above 8
m, the average daylight illuminance decreases below 100 lux and even 50 lux in
many cases. In this situation, daylight becomes insignificant and meaningless.
Artificial lighting must be provided to maintain a comfortable lighting environment
(above 300 lx) indoor for office function. Moreover, when the room depth is above
8 m, the difference among different WWR becomes less significant. Compared to

Chapter 7
– 150 –
the mono-crystalline semi-transparent PV glazing in Section 6.2.2,
amorphous-silicon PV glazing is obviously inferior, and its predictable outcome is
bad performance in lighting energy consumption mainly because the
amorphous-silicon layer in the PV glazing has a low visible and solar transmittance
value.
Figure 7.3 Lighting energy consumption of different WWR in different room depth
cases
Figure 7.3 shows the lighting electricity consumption of different WWR in
different room depth cases. The electricity consumption of different cases is within
20-40 kWh/m2. As we predicted, this artificial-lighting electricity consumption is
relatively higher than that of mono-crystalline semi-transparent PV glazing.
Meanwhile, compared to the daylight illuminance, the difference in lighting
electricity consumption is less significant. For a 4m deep room, lighting electricity
consumption decreases 15% when the WWR increases from 0.2 to 0.7; this
decreasement for a 13m deep room is 33%.. For short-room cases with room depth
below 7 m, the lighting energy consumption remains almost constant after WWR
exceeds 0.5.

Chapter 7
– 151 –
7.2.3. Effects on the heating and cooling electricity consumption
Figure 7.4 Heating and cooling electricity consumption of different WWR in
different room depth cases
With a low solar transmittance, it could be predicted that the heat gain by solar
radiation through amorphous-silicon semi-transparent PV is significantly reduced.
This result is beneficial in the summer because it can reduce the cooling demand,
however it also increases the heating demand in the winter because of the loss of
solar radiation. As previously discussed in Section 6.2.3, in central China, which is
a typical hot-summer cold-winter climate zone, the amount of heat gain through the
window glass in the summer is larger than the amount of heat loss of solar radiation
in the winter. This result indicates that saving the cooling energy will benefit more
in terms of the overall energy performance. Figure 7.4 shows the heating and
cooling electricity consumption of amorphous-silicon semi-transparent PV in
different WWR and room depth cases. The electricity consumption of different
cases is within 22-37 kWh/m2 and increases when the WWR increases, which is
lower than that of mono-crystalline PV (Figure 6.11). This outcome is consistent

Chapter 7
– 152 –
with the prediction. Similar to the lighting energy consumption, the difference in
heating and cooling electricity consumption among different WWR is less
significant in large room depth cases. In addition, in large room depth cases, the
heating and cooling energy increases more slowly when the WWR increases.
It can be concluded that amorphous-silicon semi-transparent PV glazing is
beneficial in terms of saving the overall heating and cooling energy. It consumes
relative less heating and cooling electricity than mono-crystalline semi-transparent
PV glazing.
7.2.4. Effects on the overall energy consumption
Based on the above analysis, it can be concluded that amorphous-silicon
semi-transparent PV decreases the heating and cooling electricity consumption but
increases the artificial-lighting electricity consumption. Amorphous-silicon
semi-transparent PV also has relatively lower PV electricity generation output than
mono-crystalline semi-transparent PV glazing. However, the effects of the room
depth and WWR on these relationships are pronounced, which demonstrates that
these factors must be carefully considered when designing amorphous-silicon
semi-transparent PV façades for buildings. Therefore, it is necessary to evaluate the
overall energy consumption considering these factors (which were discussed in
6.2.4) to determine an optimal WWR.
Figure 7.5 shows the overall energy consumption of different WWR in
different room depth cases. The overall energy consumption is mostly within 50
kWh/m2 to 60 kWh/m
2 for all cases. For large room depth (>8 m) rooms, the
overall energy consumption decreases when the WWR increases. The lowest
overall energy consumption is observed with a WWR of 0.7. However, for small
room depth (<8 m) rooms, when the WWR increases, the overall energy
consumption decreases at first and subsequently increases after the WWR exceeds
a certain value. This result indicates the existence of an optimal WWR in terms of
the overall energy consumption.

Chapter 7
– 153 –
Figure 7.5 Overall energy consumption of different WWR in different room depth
cases
To further explain the details of the overall energy consumption, Figure 7.6
shows the overall energy consumption with PV electricity generation, lighting and
heating and cooling electricity consumption in two room depth cases of 6 m (a) and
12 m (b).
For the 6 m room depth (short-room) cases, when the WWR increases from
0.2 to 0.7, the heating and cooling electricity consumption increases to 6.4
kWh/m2, whereas the lighting electricity consumption decreases to 8.7 kWh/m
2.
PV electricity generation increases 1.4 kWh/m2. In addition, when the WWR is
below 0.4, the heating and cooling electricity consumption is larger than that of
lighting. When the WWR is above 0.4, this situation reverses. The overall energy
consumption decreases with the increase in WWR at first and subsequently
increases. A 0.5 WWR achieves the lowest electricity consumption at a yearly
overall energy consumption of 50.6 kWh/m2.

Chapter 7
– 154 –
In the 12 m room depth (deep-room) cases, when the WWR increases from 0.2
to 0.7, the heating and cooling electricity consumption increases to 2.8 kWh/m2,
whereas that of lighting decreases to 10.7 kWh/m2. The PV electricity generation
increases to 0.7 kWh/m2. The PV electricity generation becomes notably
insignificant compared to the entire energy consumption and contributes notably
little to the energy saving. When the WWR is small, the lighting electricity
consumption is much larger than that of heating and cooling. This gap narrows
with the increase in WWR. The overall energy consumption decreases with the
increase in WWR for all cases. Thus, a WWR of 0.7 has the lowest overall
electricity consumption.
(a)

Chapter 7
– 155 –
(b)
Figure 7.6 Overall energy consumption of different WWR in cases of
room depth (a) 6 m and (b) 12 m
7.3. Optimal WWR according to the overall energy performance
From the parametric analysis above, it seems there is a certain value of WWR
would achieve the lowest overall electricity consumption. This particular value is
defined as optimal WWR, which is chosen by comparing the overall energy
consumption results of all WWR cases in different Room depth in the southern
orientation. Variations in room depth can lead to considerable variation in
optimal WWR (Table 7.1).
In short rooms (<8m), optimal WWR increases when Room depth increases.
In deep room (>8m), optimal WWR remains 0.7 (large window) for all cases. Since
a lager window area could provide more area for semi-transparent PV installation,
this results indicate that amorphous-silicon semi-transparent PV is more preferable
and practical in rooms with larger windows.

Chapter 7
– 156 –
To show the benefits of optimal WWR, electricity saving in percentage figure
by optimal WWR compared to most disadvantaged WWR is showed in Table 7.2.
There is at least 8%, up to 15%, with an average of 12% of deviation is seen by
comparison. The impact of optimal WWR is most significant in cases at Room
depth between 8m to 11m, with maximum figure seen in case at 9m Room depth.
Table 7.1 Optimal WWR in different room depth in south orientation
Table 7.2 Deviation by optimal WWR compared to most disadvantaged WWR
7.4. Energy saving of amorphous-silicon semi-transparent PV glazing
compared to three traditional glazings
In this section, the overall energy performance of the amorphous-silicon
semi-transparent PV façades layouts of each optimal WWR is compared with that
of three traditional glazings: (1) single glazing, (2) Low-E double glazing and (3)
normal double glazing.
Figure 7.7 (a) shows the sections of amorphous-silicon semi-transparent PV,
whose calculation methods were discussed and presented in Chapter 5. Figures 7.7
(b), (c) and (d) show the sections of the three traditional glazings, whose properties
and simulation methods were discussed in Section 6.4.
Room depth (m)
4 5 6 7 8 9 10 11 12 13
Optimal WWR 0.25 0.35 0.5 0.55 0.7 0.7 0.7 0.7 0.7 0.7
Room depth (m)
4 5 6 7 8 9 10 11 12 13
Deviation
(%) 8.6 4.3 8.9 12.5 14.7 15.8 15.7 15.0 14.0 13.0

Chapter 7
– 157 –
Figure 7.7 Amorphous-silicon PV glazing and three traditional glazings
(a) Amorphous-silicon PV glazing, (b) 3 mm single glazing, (c) 6 mm Low-E
double glazing with a 12 mm air gap, (d) 6 mm double glazing with a 12 mm air
gap
Two types of architectural models are used in this section and are illustrated in
Figure 6.18 in Chapter 6. The first type is generic rooms with relatively small
windows at a WWR of 0.3. The other type is generic rooms with larger windows at
a WWR of 0.6. The details of the architectural models are discussed and provided
in Section 5.3. Amorphous-silicon semi-transparent PV and the three traditional
glazings are first compared in the small WWR cases and subsequently in the large
WWR cases to investigate the performance of lighting, heating and cooling energy
performance. The PV electricity generation of PV glazing is automatically included
in all comparisons. The results are presented in annual value with different room
depths.
7.4.1 Energy savings in small WWR cases
Figure 7.8 shows the Daylight illuminance of different glazing at 0.3 WWR
cases. Compared to the three traditional glazings, daylight illuminance of
amorphous-silicon semi-transparent PV glazing is very low. Traditional glazings
are roughly 6-7 times higher than amorphous-silicon semi-transparent PV.

Chapter 7
– 158 –
Figure 7.8 Daylight illuminance of different glazings at WWR of 0.3
Figure 7.9 Lighting electricity consumption of different glazings at WWR of 0.3

Chapter 7
– 159 –
Because of the huge disadvantage of the indoor illuminance level, the
artificial-lighting electricity consumption of the amorphous-silicon
semi-transparent PV is also significantly higher than that of traditional glazings, as
Figure 7.9 shows. In the 4-m-deep room case, 26% more electricity was consumed
by the amorphous-silicon semi-transparent PV glazing compared to the traditional
glazings. In the 13-m-deep room, 95% more electricity is consumed by
amorphous-silicon semi-transparent PV glazing.
These results clearly show that amorphous-silicon semi-transparent PV is
significantly inferior to transitional glazings in terms of lighting energy
performance, which is particularly true for deep-room cases.
Figure 7.10 Heating and cooling electricity consumption of different glazings at
WWR of 0.3
Figure 7.10 shows the heating and cooling electricity consumption of different
glazings at 0.3 WWR. Low-E double glazing has the lowest electricity
consumption, followed by amorphous-silicon semi-transparent PV glazing. Single
glazing has the highest electricity consumption among all types. In the 4-m-deep

Chapter 7
– 160 –
room, the amorphous-silicon semi-transparent PV glazing saves 20% and 18%
electricity compared to double glazing and single glazing, respectively. However,
this advantage decreases when the room depth increases. In the 13-m-deep room,
the difference between amorphous-silicon semi-transparent PV glazing and double
glazing becomes insignificant.
Figure 7.11 shows the overall energy consumption of different glazings at 0.3
WWR. In the rooms with room depth below 6 m, the amorphous-silicon
semi-transparent PV glazing has a better energy performance than single glazing
and double glazing. However, in the rooms with room depth above 6 m, the
amorphous-silicon semi-transparent PV has the worst overall energy performance
mainly because the lighting electricity consumption of the amorphous-silicon
semi-transparent PV increases. In a 13-m-deep room, the overall electricity
consumption is 26-39% higher for amorphous semi-transparent PV glazing than for
the three traditional glazings.
Figure 7.11 Overall energy consumption of different glazings at WWR of 0.3

Chapter 7
– 161 –
By comparing the overall energy performance of different glazings the in
small WWR (small-window) cases, we conclude that:
(1) Amorphous-silicon semi-transparent PV is significantly inferior to
traditional glazings in terms of daylighting and lighting energy
performance.
(2) In rooms that are less than 6 m deep, the amorphous-silicon
semi-transparent PV glazing has a better overall energy performance than
single glazing and double glazing.
(3) In rooms that are deeper than 6 m, all three traditional glazings are better
than amorphous-silicon semi-transparent PV glazing in terms of the
overall energy performance.
7.4.2 Energy savings in large WWR cases
Figure 7.12 shows the daylight illuminance of different glazings at 0.6
WWR. Compared to the small WWR cases in 7.3.1, a larger window provides
better daylight illuminance, which is notably limited. The amorphous-silicon
semi-transparent PV remains having a notably lower illuminance than the
traditional glazings. Thus, the artificial-lighting electricity consumption of
amorphous-silicon semi-transparent PV in large WWR cases remains significantly
higher than that of traditional glazings, as Figure 7.13 shows. In the 4-m-deep
room, 11% more electricity was consumed by amorphous-silicon semi-transparent
PV glazing compared to traditional glazings. In the 13-m-deep room, 72% more
electricity is consumed by amorphous-silicon semi-transparent PV glazing.
Figure 7.14 shows the heating and cooling electricity consumption of different
glazings at 0.6 WWR. The difference between Low-E double glazing and
amorphous-silicon semi-transparent PV glazing is small, and both types save a
significant amount of energy compared to single and double glazing. In the
4-m-deep room, amorphous-silicon semi-transparent PV glazing saves 33% and
38% electricity compared to double glazing and single glazing, respectively.
However, the saving becomes less significant in large room depth cases.

Chapter 7
– 162 –
Figure 7.12 Daylight illuminance of different glazings at WWR of 0.6
Figure 7.13 Lighting electricity consumption of different glazings at WWR of 0.6

Chapter 7
– 163 –
Figure 7.14 Heating and cooling electricity consumption of different glazings at
WWR of 0.6
Figure 7.15 Overall energy consumption of different glazings at WWR of 0.6

Chapter 7
– 164 –
Figure 7.15 shows the overall energy consumption of different glazings at 0.6
WWR. In rooms with room depth below 10 m, the amorphous-silicon
semi-transparent PV glazing has a better energy performance than single glazing
and double glazing. The overall energy performance of all three traditional glazings
decreases when the room depth increases, whereas the amorphous-silicon
semi-transparent PV consumes the least energy when it is used in the 8-m-deep
room. In the 8-m-deep room, the overall electricity consumption of
amorphous-silicon semi-transparent PV glazing is 10% higher than that of Low-E
double glazing, 8% lower than that of double glazing and 14% lower than that of
single glazing. For amorphous-silicon semi-transparent PV, a proper room depth
appears to give the best overall energy performance.
By comparing the overall energy performance of different glazings in the
large WWR (large-window) cases, we conclude that:
(1) Amorphous-silicon semi-transparent PV is significantly inferior to
traditional glazings in terms of daylighting and lighting energy
performance even in rooms with large windows.
(2) In rooms that are less than 10 m deep, the amorphous-silicon
semi-transparent PV glazing has a better overall energy performance than
single glazing and double glazing.
(3) Amorphous-silicon semi-transparent PV glazing is inferior to Low-E
double glazing in all room cases.
7.5. Conclusions
This chapter discusses the parametric analysis of the overall energy
performance of amorphous-crystalline semi-transparent PV glazing. A comparison
analysis between amorphous-silicon semi-transparent PV and traditional glazings is
conducted. Optimal WWR is investigated in different room depth cases. The main
discoveries are listed as following.

Chapter 7
– 165 –
In the parametric analysis of the overall energy performance, the PV
electricity generation and the electricity consumption of lighting, heating and
cooling of amorphous-silicon semi-transparent PV are analysed, with the following
discoveries:
(1) The results show that there is no tangible relation between the WWR and
the PV conversion efficiency. The total amount of PV electricity output is
also less significant than that of mono-crystalline semi-transparent PV.
(2) When the WWR increases, the indoor daylight illuminance linearly
increases, and the electricity consumption decreases. However, because of
the low visible and solar transmittance value of the amorphous-silicon
layer in the PV glazing, the amorphous-silicon semi-transparent PV does
not perform well in terms of indoor daylighting and lighting energy
performance.
(3) Amorphous-silicon semi-transparent PV glazing is beneficial in terms of
saving the overall heating and cooling energy. Its heating and cooling
electricity consumption is relatively less than that of mono-crystalline
semi-transparent PV glazing.
(4) An optimal WWR (i.e., one that achieves the lowest overall electricity
consumption) can be obtained for a particular combination of room depth
and orientation. When the overall energy performance is considered,
adopting the optimal WWR can result in electricity savings of up to 15.8%
compared to the least favourable WWR, although the achieved savings
vary depending on the combination of room depth, at least in the south
orientation. This result demonstrates the importance of selecting the
optimal WWR based on the architectural conditions.
(5) The results of the optimal WWR indicate that amorphous-silicon
semi-transparent PV is preferable and more practical in rooms with large
windows.

Chapter 7
– 166 –
The main results of the comparison analysis among three traditional glazings
(single glazing, double glazing and Low-E double glazing) are as follows.
(1) Amorphous-silicon semi-transparent PV is significantly inferior to
traditional glazings in terms of daylighting and lighting energy
performance in all situations.
(2) In short rooms, amorphous-silicon semi-transparent PV glazing generally
has a better overall energy performance than single glazing and double
glazing.
(3) Amorphous-silicon semi-transparent PV glazing is inferior to Low-E
double glazing in all room cases.

Chapter 8
– 167 –
Chapter 8 Other implications of
semi-transparent PV façades in
office buildings

Chapter 8
– 168 –
In this chapter, other implications of semi-transparent PV façades in office
buildings are discussed. With the effects of other architectural factors, the overall
energy performance of semi-transparent PV façades is discussed in Section 8.2.
Suitability of optimal PVR/WWR strategies in different architectural conditions is
investigated in Section 8.3. In addition, Environmental performance of
semi-transparent PV façades is investigated in Section 8.4.
8.1 Introduction
The effects of other architectural factors on the overall energy performance
when semi-transparent PV façades are used are discussed. These architectural
factors are considered less important than the architectural factors such as WWR
and room depth, but they should be discussed to further understand different
architectural contributions to the effects on the overall energy performance when
semi-transparent PV façades are used.
The suitability of optimal PVR/WWR strategies in different architectural
conditions is investigated. We aimed to discover the performance of each optimal
PVR/WWR under different architectural conditions compared to the baseline
buildings (A and B) in terms of energy saving. If the optimal PVR/WWR strategy
achieves a lower overall energy consumption than the baseline buildings (energy
saving) in an architectural condition, this optimal PVR/WWR strategy can be refer
as ―suitable‖ in this architectural condition. In addition, the energy saving of each
optimal PVR/WWR is presented. Energy saving from office buildings becomes
increasingly more economically significant because the energy cost continues to
increase in China. This statement is particularly true when office buildings has
relatively higher electricity price than resident buildings in China, which indicates
that the economic savings from PV façades of office buildings will be even more
profitable.
The environmental performance of semi-transparent PV façades based on the
carbon reduction by the amount of CO2 and polluted emission such as SO2, NO and
carbonaceous dust is presented in this chapter. These polluted gases are produced
during the electricity production using thermal power generation. They can be

Chapter 8
– 169 –
reduced by using PV façades and replacing the power demand with solar energy,
which is notably clean and produces no harmful material to the environment.
8.2 Effects of other architectural factors on overall energy performance of
semi-transparent PV
In this section, other architectural factors such as room height, window height
and room width are developed and incorporated into the architectural models. A
room of 8 m room depth and 0.3 WWR is chosen as the study sample; its room
setups were discussed in Section 5.3. A mono-crystalline semi-transparent PV of
40% PVR is chosen as the sample of semi-transparent PV. The overall energy
consumption, which includes the PV electricity generation, heating and cooling
electricity consumption and lighting electricity consumption, is simulated and
presented to discover the effects of other architectural factors on the energy
performance. All figures show the annual values.
8.2.1. Effects of different room height
Figure 8.1 shows the overall energy consumption for different room heights.
The room height is set at 3.0 m, 3.5 m, 4.0 m and 4.5 m, which are the most
common heights for office buildings. When the room height increases, the PV
electricity generation slightly increases by 0.6 kWh/m2 because the wall area
increases when the room height increases, which increases the window area
because all cases have identical WWR. When the room height increases, the
lighting energy consumption decreases because the window area increases.
However, with a great increase in heating and cooling electricity consumption, the
overall energy consumption increases by 14.6% when the room height increases
from 3 m to 4.5 m.

Chapter 8
– 170 –
Figure 8.1 Overall energy consumption for different room heights
8.2.2. Effects of different window height
Figure 8.2 shows the overall energy consumption for different window
heights. The window height is defined as the window-sill height, which is set at 0.6
m, 0.9 m and 1.2 m. The height of 0.9 m is most common in office buildings, and
0.6 m is usually used for better views in large WWR situations. When the window
height increases, the PV electricity remains unchanged because the wall area does
not change. The lighting energy slightly decreases with insignificant change. The
heating and cooling electricity consumption remains unchanged for all cases. The
overall energy consumption decreases by 3.3% when the window height increases
from 0.6 m to 1.2 m. The window height appears to not significantly affect the
overall energy performance in terms of the semi-transparent PV façades
application.

Chapter 8
– 171 –
Figure 8.2 Overall energy consumption for different window heights
8.2.3. Effects of different room width
Figure 8.3 shows the overall energy consumption for different room widths,
which are set at 4 m, 5 m and 6 m. It should be noticed that with the increase in
room width, the window area and the floor area of the room also increase and
remain at a constant proportion. In that case, the PV electricity per floor area
remains constant. The lighting energy decreases by 4.1% when the room width
increases from 4 m to 6 m. The heating and cooling electricity consumption
decreases by 5.2%. In this case, the overall energy consumption decreases by 4.8%
when the room width increases from 4 m to 6 m.

Chapter 8
– 172 –
Figure 8.3 Overall energy consumption for different room widths
Among the three architectural factors, the room height has the most significant
effect on the overall energy consumption with a 14.6% change, followed by the
room width with a 4.8% change and the window height with a 3.3% change.
However, compared to PVR and WWR, these three factors have a less significant
effect on the energy performance in terms of semi-transparent PV façade
applications in office buildings.
8.3. Suitability of optimal PVR/WWR for semi-transparent PV on office
building façades
8.3.1 Introduction
In this section, the suitability of optimal PVR/WWR strategies in different
architectural conditions is investigated by comparing the energy saving to the
baseline buildings (A and B) of each optimal PVR/WWR under different
architectural conditions.

Chapter 8
– 173 –
The suitability is defined as follows: when the optimal PVR/WWR is
adopted in certain architectural conditions, the overall energy consumption is lower
than that of the baseline buildings (energy saving). In other words, if the optimal
PVR/WWR strategy achieves a lower overall energy consumption than the baseline
buildings (energy saving) in an architectural condition, this optimal PVR/WWR
strategy can be referred to as ―suitable‖ in this architectural condition.
8.3.2 Mono-crystalline semi-transparent PV façades
Table 8.1 Overall electricity consumption of office rooms with mono-crystalline
semi-transparent PV for each optimal PVR
Electricity consumption (kWh/m2)
WWR Room depth(m)
4 5 6 7 8 9 10 11 12 13
0.2 45.8 44.9 44.4 44.2 44.3 44.4 44.5 44.8 45.1 45.4
0.25 46.2 45.4 44.7 44.5 44.3 44.4 44.6 44.7 44.8 45.0
0.3 46.6 45.8 45.2 44.8 44.6 44.5 44.6 44.8 44.9 45.0
0.35 47.1 46.2 45.7 45.2 44.8 44.7 44.7 44.7 44.9 45.0
0.4 47.7 46.5 45.9 45.6 45.1 44.9 44.9 44.8 44.9 45.0
0.45 48.1 46.8 46.1 45.7 45.3 45.0 44.9 44.8 44.8 44.8
0.5 48.6 47.1 46.2 45.8 45.6 45.2 44.9 44.8 44.8 44.8
0.55 49.2 47.5 46.5 46.0 45.7 45.5 45.2 45.0 44.9 44.9
0.6 49.7 48.0 46.8 46.2 45.9 45.8 45.4 45.2 45.1 45.0
0.65 50.2 48.4 47.1 46.4 46.1 45.9 45.7 45.4 45.2 45.1
0.7 50.7 48.8 47.4 46.6 46.2 46.0 45.9 45.6 45.4 45.2

Chapter 8
– 174 –
With the optimal PVR provided in Section 6.3, the energy saving of the
optimal PVR of mono-crystalline semi-transparent PV is presented in this section
by comparing the energy consumption of each PVR in different architectural
conditions to the baseline buildings, which were discussed in Section 5.4. The
economic saving is also presented based on energy saving. This analysis shows us
the maximum benefits of mono-crystalline semi-transparent PV glazing as façades
for office buildings and its suitability under different architectural conditions.
Table 8.1 shows the overall electricity consumption (kWh/m2) of office rooms
with mono-crystalline semi-transparent PV for each optimal PVR according to
each combination of room depth and WWR. Tables 8.2 and 8.3 show the overall
electricity consumption (kWh/m2) of office rooms of baseline buildings A and B,
respectively.
Table 8.2 Overall electricity consumption of office rooms of baseline building A
for each combination of room depth and WWR
Electricity consumption (kWh/m2)
WWR Room depth(m)
4 5 6 7 8 9 10 11 12 13
0.2 109.0 103.3 99.7 97.8 97.0 97.0 97.6 98.7 100.2 101.9
0.25 95.3 92.2 90.3 89.4 89.3 89.8 90.5 91.7 93.2 94.9
0.3 98.1 94.2 91.8 90.4 89.7 89.7 90.1 90.7 91.6 92.7
0.35 97.4 93.6 91.1 89.6 88.8 88.5 88.7 89.1 89.7 90.5
0.4 99.1 94.7 91.3 89.0 87.5 86.6 85.9 85.5 85.3 85.2
0.45 98.5 94.1 90.8 88.5 86.9 85.9 85.2 84.7 84.4 84.3
0.5 100.9 96.4 93.0 90.7 89.3 88.4 87.8 87.5 87.5 87.8
0.55 99.7 95.5 92.1 89.9 88.5 87.6 87.0 86.7 86.6 86.7
0.6 101.5 96.9 93.3 90.8 89.2 88.2 87.4 87.0 86.8 86.7
0.65 103.2 98.4 94.5 91.8 90.0 88.8 87.9 87.4 87.0 86.9
0.7 104.9 99.8 95.6 92.8 90.8 89.4 88.5 87.8 87.3 87.1

Chapter 8
– 175 –
Table 8.3 Overall electricity consumption of office rooms of baseline building B
for each combination of room depth and WWR
Electricity consumption (kWh/m2)
WWR Room depth(m)
4 5 6 7 8 9 10 11 12 13
0.2 54.5 51.7 49.9 48.9 48.5 48.5 48.8 49.4 50.1 50.9
0.25 47.7 46.1 45.2 44.7 44.6 44.9 45.3 45.8 46.6 47.4
0.3 49.0 47.1 45.9 45.2 44.9 44.8 45.0 45.4 45.8 46.4
0.35 48.7 46.8 45.5 44.8 44.4 44.2 44.3 44.6 44.9 45.3
0.4 49.6 47.3 45.7 44.5 43.8 43.3 43.0 42.8 42.6 42.6
0.45 49.2 47.1 45.4 44.2 43.5 42.9 42.6 42.4 42.2 42.1
0.5 50.5 48.2 46.5 45.4 44.7 44.2 43.9 43.8 43.8 43.9
0.55 49.9 47.7 46.1 44.9 44.2 43.8 43.5 43.3 43.3 43.4
0.6 50.7 48.5 46.6 45.4 44.6 44.1 43.7 43.5 43.4 43.4
0.65 51.6 49.2 47.2 45.9 45.0 44.4 44.0 43.7 43.5 43.4
0.7 52.4 49.9 47.8 46.4 45.4 44.7 44.2 43.9 43.7 43.5
According to these results, the energy saving is calculated by comparing the
overall energy of mono-crystalline with that of baseline buildings A and B. Table
8.4 shows the energy saving of mono-crystalline semi-transparent PV compared to
baseline building A in different architectural combinations. Table 8.5 shows the
energy saving of mono-crystalline semi-transparent PV compared to baseline
building B in different architectural combinations. The green area shows the part
where mono-crystalline semi-transparent PV performs better than the baseline
buildings. With an optimal PVR, mono-crystalline semi-transparent PV can save
48-58% of the energy on average compared to baseline building A. However,
compared to baseline building B, mono-crystalline semi-transparent PV can only
save energy in relatively short rooms with small windows. In a 4-m-deep room

Chapter 8
– 176 –
with WWR 0.2, mono-crystalline semi-transparent PV glazing can save 16.0%
energy. In a 13-m-deep room with WWR 0.7, mono-crystalline semi-transparent
PV consumes 3.9% more energy than baseline building B.
Table 8.4 Energy saving with mono-crystalline semi-transparent PV compared to
baseline building A for each combination of room depth and WWR
Electricity saving(%)
WWR Room depth(m)
4 5 6 7 8 9 10 11 12 13
0.2 58.0 56.6 55.5 54.8 54.4 54.2 54.3 54.7 55.0 55.4
0.25 51.5 50.7 50.5 50.3 50.3 50.5 50.7 51.2 51.9 52.5
0.3 52.5 51.4 50.7 50.5 50.3 50.4 50.5 50.6 51.0 51.5
0.35 51.6 50.6 49.8 49.6 49.5 49.5 49.6 49.8 50.0 50.3
0.4 51.9 50.8 49.7 48.8 48.4 48.1 47.8 47.6 47.4 47.2
0.45 51.1 50.3 49.3 48.4 47.8 47.6 47.3 47.1 47.0 46.8
0.5 51.9 51.2 50.3 49.6 49.0 48.9 48.8 48.8 48.9 49.0
0.55 50.7 50.2 49.5 48.8 48.3 48.1 48.0 48.1 48.1 48.2
0.6 51.0 50.5 49.8 49.1 48.6 48.1 48.0 48.0 48.0 48.1
0.65 51.3 50.8 50.1 49.4 48.8 48.3 48.0 48.0 48.0 48.0
0.7 51.7 51.1 50.4 49.7 49.1 48.6 48.1 48.0 48.0 48.0
Note: The green area shows the part where mono-crystalline semi-transparent PV
performs better than building A
From these results, based on the comparison with baseline building B, it can
be concluded that PV façades are more suitable in short rooms or rooms with
small windows. However, this conclusion is based on baseline building B, which is
consistent with the Chinese Design Standard for Energy Efficiency of Public
Buildings (GB-50189-2005). If the setting and conditions of the baseline
buildings change, the suitability situation will change accordingly. The key
factor is the standard that we use for the baseline buildings.

Chapter 8
– 177 –
Table 8.5 Energy saving with mono-crystalline semi-transparent PV compared to
baseline building B for each combination of room depth and WWR
Electricity saving(%)
WWR Room depth(m)
4 5 6 7 8 9 10 11 12 13
0.2 16.0 13.2 11.0 9.6 8.7 8.4 8.7 9.3 10.0 10.8
0.25 3.1 1.5 0.9 0.6 0.7 1.0 1.4 2.4 3.7 5.1
0.3 5.0 2.8 1.5 1.0 0.7 0.8 1.0 1.3 1.9 3.0
0.35 3.2 1.3 -0.3 -0.8 -1.0 -1.1 -0.7 -0.4 -0.1 0.5
0.4 3.8 1.7 -0.7 -2.4 -3.2 -3.8 -4.4 -4.8 -5.3 -5.7
0.45 2.3 0.6 -1.5 -3.3 -4.3 -4.9 -5.4 -5.8 -6.1 -6.4
0.5 3.7 2.4 0.6 -0.9 -2.0 -2.3 -2.3 -2.4 -2.3 -2.0
0.55 1.4 0.4 -1.0 -2.4 -3.3 -3.9 -3.9 -3.9 -3.7 -3.5
0.6 2.0 1.0 -0.4 -1.7 -2.9 -3.8 -4.0 -4.0 -3.9 -3.8
0.65 2.7 1.6 0.2 -1.1 -2.5 -3.3 -3.9 -4.0 -3.9 -3.9
0.7 3.4 2.2 0.8 -0.5 -1.8 -2.9 -3.8 -3.9 -4.0 -3.9
Note: The green area shows the part where mono-crystalline semi-transparent PV
performs better than building B
With the energy saving of the mono-crystalline semi-transparent PV for each
optimal PVR, which was discussed in Section 8.3.1, the economic saving is
calculated using the electricity cost in Wuhan (0.93 RMB/kWh). Table 8.6 and 8.7
show the economical saving with mono-crystalline semi-transparent PV compared
to baseline buildings A and B in different architectural combinations.
Compared to baseline building A, mono-crystalline semi-transparent PV could
save 38.9-58.8 RMB/m2 and an average of 42.8 RMB/m
2 each year. This result
indicates that approximately 428,000 RMB of electricity cost was saved for an
office building of 10000 m2 floor area.

Chapter 8
– 178 –
Compared to baseline building B, mono-crystalline semi-transparent PV could
save 0.3-8.1 RMB/m2 with an average of 1.8 RMB/m
2 in office rooms with less
than 0.3 WWR and less than 6 m room depth. For a building of 10000 m2 floor
area, this result indicates that approximately 18,000 RMB electricity cost was
saved. However, in rooms with WWR over 0.35 and room depth over 6 m,
mono-crystalline semi-transparent PV consumes more energy than baseline
building B with a maximum of 2.5 RMB/m2.
Table 8.6 Economic saving with mono-crystalline semi-transparent PV compared
to baseline building A for each combination of room depth and WWR
Economic saving(RMB/m2)
WWR Room depth(m)
4 5 6 7 8 9 10 11 12 13
0.2 58.8 54.4 51.5 49.9 49.0 48.9 49.3 50.2 51.3 52.5
0.25 45.7 43.5 42.4 41.8 41.8 42.1 42.7 43.7 44.9 46.4
0.3 47.9 45.0 43.3 42.4 42.0 42.0 42.3 42.7 43.4 44.4
0.35 46.7 44.1 42.2 41.3 40.8 40.7 40.9 41.3 41.7 42.3
0.4 47.8 44.8 42.2 40.4 39.4 38.7 38.2 37.8 37.6 37.4
0.45 46.8 44.0 41.6 39.8 38.7 38.0 37.5 37.1 36.9 36.7
0.5 48.7 45.9 43.5 41.8 40.7 40.2 39.9 39.7 39.8 40.0
0.55 47.0 44.6 42.4 40.8 39.8 39.1 38.9 38.7 38.8 38.9
0.6 48.1 45.5 43.2 41.5 40.3 39.4 39.0 38.9 38.8 38.8
0.65 49.3 46.5 44.0 42.2 40.8 39.9 39.3 39.0 38.9 38.8
0.7 50.4 47.4 44.8 42.9 41.4 40.4 39.6 39.2 39.0 38.9
Note: The green area shows the part where mono-crystalline semi-transparent PV
performs better than building A

Chapter 8
– 179 –
Table 8.7 Economic saving from mono-crystalline semi-transparent PV compared
to baseline buildings B for each combination of room depth and WWR
Economic saving(RMB/m2)
WWR Room depth(m)
4 5 6 7 8 9 10 11 12 13
0.2 8.1 6.3 5.1 4.4 3.9 3.8 3.9 4.3 4.7 5.1
0.25 1.4 0.6 0.4 0.2 0.3 0.4 0.6 1.0 1.6 2.2
0.3 2.3 1.2 0.6 0.4 0.3 0.3 0.4 0.5 0.8 1.3
0.35 1.5 0.6 -0.1 -0.3 -0.4 -0.4 -0.3 -0.2 0.0 0.2
0.4 1.8 0.7 -0.3 -1.0 -1.3 -1.5 -1.8 -1.9 -2.1 -2.2
0.45 1.0 0.3 -0.6 -1.3 -1.7 -1.9 -2.1 -2.3 -2.4 -2.5
0.5 1.8 1.1 0.3 -0.4 -0.8 -0.9 -1.0 -1.0 -0.9 -0.8
0.55 0.7 0.2 -0.4 -1.0 -1.4 -1.6 -1.6 -1.6 -1.5 -1.4
0.6 0.9 0.4 -0.2 -0.7 -1.2 -1.6 -1.6 -1.6 -1.6 -1.5
0.65 1.3 0.7 0.1 -0.5 -1.0 -1.4 -1.6 -1.6 -1.6 -1.6
0.7 1.6 1.0 0.4 -0.2 -0.8 -1.2 -1.6 -1.6 -1.6 -1.6
Note: The green area shows the part where mono-crystalline semi-transparent PV
performs better than building B
8.3.3 Amorphous-silicon semi-transparent PV façades
With the optimal WWR provided in Section 7.3, the energy saving by the
optimal use of amorphous-silicon semi-transparent PV is presented in this section
and compared with the baseline buildings, which were discussed in 5.4. The
economic saving is also presented based on the energy saving. This result shows us
the maximum benefits of amorphous-silicon semi-transparent PV glazing as office
buildings‘ façades and its suitability under different architectural conditions.
In Table 8.8, the optimal WWR for different room depths is presented with its
overall electricity consumption. The overall energy consumption of 44.2-45.8
kWh/m2 is achieved by different optimal WWR. These figures are compared with

Chapter 8
– 180 –
the overall energy consumption of baseline buildings A and B as shown in Table
8.9. A maximum saving of 47.9 kWh/m2 is compared to baseline building A. With
the increase in room depth, this value decreases to 38.2 kWh/m2. However,
compared to baseline building B, all optimal WWR fail to achieve a better
performance. Amorphous-silicon semi-transparent PV consumes 4.2-23.5% more
electricity than baseline building B.
Table 8.8 Overall electricity consumption of office rooms with amorphous-silicon
semi-transparent PV with optimal WWR for each room depth cases
Room depth(m)
4 5 6 7 8 9 10 11 12 13
Optimal
WWR 0.25 0.35 0.5 0.55 0.7 0.7 0.7 0.7 0.7 0.7
Electricity
consumption
(kWh/m2)
45.8 44.9 44.4 44.2 44.3 44.4 44.5 44.8 45.1 45.4
Table 8.9 Energy saving with amorphous-silicon semi-transparent PV compared to
baseline buildings A and B in different room depth cases
Room depth(m)
4 5 6 7 8 9 10 11 12 13
Electricity
saving(%)
from baseline
building A
47.9 46.8 46.6 44.8 45.1 43.9 42.4 40.9 39.5 38.2
Electricity
saving(%)
from baseline
building B
-4.2 -6.4 -6.7 -10.5 -9.7 -12.2 -15.1 -18.2 -21.0 -23.5
Note: The green area shows the part where mono-crystalline semi-transparent PV
performs better than the baseline buildings

Chapter 8
– 181 –
Amorphous-silicon semi-transparent PV glazings appear to achieve better
energy performance than traditional office buildings (baseline building A) but fail
to perform better than baseline building B. In general, amorphous-silicon
semi-transparent PV façades are more suitable in short rooms (small room
depth). Again, it must be noted that if the setting and conditions of baseline
buildings change, the suitability situation will change accordingly. The key factor
is the standard that we use for the baseline buildings.
With the energy saving of the amorphous-silicon semi-transparent PV for each
optimal WWR, the economic savings of baseline buildings A and B are calculated
and presented in Table 8.10.
Table 8.10 Economic saving of mono-crystalline semi-transparent PV compared to
baseline buildings A and B of rooms with optimal WWR for different room depth
Room depth(m)
4 5 6 7 8 9 10 11 12 13
Optimal WWR 0.25 0.35 0.5 0.55 0.7 0.7 0.7 0.7 0.7 0.7
Economic
saving(%) from
baseline building A
54.5 47.6 41.8 39.3 37.7 36.1 34.5 34.2 35.1 36.3
Economic
saving(%) from
baseline building B
4.3 0.1 -2.7 -3.3 -4.1 -5.0 -6.2 -7.4 -8.5 -9.4
Compared to baseline building A, amorphous-silicon semi-transparent PV
could save 36.3-54.5 RMB/m2 with an average of 39.7 RMB/m
2 per year. This
result indicates that approximately 397,000 RMB of electricity cost was saved for
an office building of 10000 m2 floor area. Compared to baseline building B,
amorphous-silicon semi-transparent PV could save 4.3 RMB/m2 and 0.1 RMB/m
2
in office rooms with room depth of 4 m and 5 m, respectively. However, for rooms
over 6 m, amorphous-silicon semi-transparent PV consumes 2.7-9.4% more energy
than baseline building B.

Chapter 8
– 182 –
8.4. Environmental benefit of the semi-transparent PV façades
To evaluate the environmental performance of semi-transparent PV façades,
two aspects are examined:
Carbon reduction by the amount of CO2.
Polluted emission including SO2, NO and carbonaceous dust.
CO2 has major effects on global warming, which causes serious problems
including meteorological disasters, sea level rising, species extinction,. SO2, NO
and carbonaceous dust are currently parts of the major air pollutions in cities and
can cause health problems to humanity, particularly in China, where air pollution
has become a serious problem for every major city. It has been well recgnized of
the seriousness of such problem and the importance of reducing the air pollution
emission from thermal power gernation plants (Yang, 2008). In another study
carried out in 2012 (Zhang et al., 2012), the characteristics and sources of trace
elements in PM2.5 (main air pollution factor in China) in Wuhan city is
investigated. Concentrations of eleven typical trace elements in PM2.5 are analyzed
by inductively coupled plasma mass spectrum-try. The results show that in Wuhan
the pollution of trace elements in PM2.5 in autumn is less serious than that of
summer, but more serious than that of winter. Compared with other cities of China,
in Wuhan the concentrations of Zn, Mn, Cu, Pb are much higher, which are strong
correlated with the steel industry in Wuhan. However, human activities also play an
important part in emission of air pollutants including Ti, Se, Cd and Ni from the
electricity power consumption. Gases that are produced during the electricity
production by thermal power generation takes a great part of the total emission.
They can be reduced by using PV façades and replacing the power demand with
solar energy, which is notably clean and produces no harmful material to the
environment.
In China, every produced kWh yields 0.814 kg of CO2, 0.272 kg of carbonaceous
dust, 0.03 kg of SO2 and 0.015 kg of NO. The electricity benefit of
semi-transparent PV will be translated into the reduction of each of these
emissions(Yang, 2008).

Chapter 8
– 183 –
Table 8.11 Emission reduction each year using mono-crystalline semi-transparent
PV compared to baseline building A
CO2 SO2 NO Carbonaceous dust
Reduction
Kg/m2
36.06 1.33 0.66 12.04
The energy saving from mono-crystalline semi-transparent PV with optimal
PVR is discussed and presented in 8.4.1. An average of 44.3 kWh/m2 of electricity
is saved per year compared to baseline building A. Thus, CO2 and each polluted
emission is translated from electricity saving and presented in Table 8.11. For a
building with 10000 m2 floor area, this result indicates a reduction of 360 tons of
CO2, 13.3 tons of SO2, 6.6 tons of NO and 120 tons of carbonaceous dust.The
energy saving from amorphous-silicon semi-transparent PV with optimal WWR is
discussed and presented in 8.4.2. An average of 37.8 kWh/m2 of electricity is saved
per year compared to baseline building A. CO2 emission and each polluted
emission are translated from electricity saving and presented in Table 8.12.
Table 8.12 Emission reduction each year using amorphous-silicon semi-transparent
PV compared to baseline building A
CO2 SO2 NO Carbonaceous dust
Reduction
Kg/m2
30.76 1.13 0.57 10.28
PBT (payback time) analysis is often used in economic and environmental
assessments during the early design stages of PV roof systems (Hyoungseok et al.,
2014; Sergio et al., 2007; A. et al., 2010; Masakazu et al., 2010.). This analysis is
also an important method according to the Guidelines for the Economic Evaluation
of BIPV of the National Renewable Energy Laboratory (NREL) (Eiffert et al.,
2003). A detailed economic and environmental assessment of a PV system is very
complex and involves accounting for PV panel and inverter costs, PV structures,
the replacement of PV panels and inverters, maintenance costs, assurance costs,

Chapter 8
– 184 –
inflation, incentives, and other factors. These products can displace traditional
construction materials. As such, the added costs and embodied energy for a BIPV
system (rather than the full costs) should be considered in economic assessments,
including those that would be incurred regardless of the inclusion of a BIPV
system, as specifically noted in the guidelines established by NREL. In a study
with such method carried out in countries of Gulf cooperation council (Steve and
Hassan, 2013), a range of estimated payback time between 42 to 266 years is
presented, which indicates its great dependence on the energy cost price level from
its location. Unfortunately, in our study, the resources available are not enough to
carry out a detailed economic or environmental assessment of studied PV glazings
in Wuhan.
8.5. Conclusions
In this chapter, other implications of semi-transparent PV façades in office
buildings are discussed.
Other architectural factors such as room height, window height and room
width are developed and incorporated into the architectural models. The overall
energy consumption, which includes the PV electricity generation, heating and
cooling electricity consumption and lighting electricity consumption, is simulated
and presented to discover the effects of other architectural factors on the energy
performance. Among the three architectural factors, the room height has the most
significant effect on the overall energy consumption with a 14.6% change,
followed by the room width with a 4.8% change and the window height with a
3.3% change. However, compared to PVR and WWR, these three factors have a
less significant effect on the energy performance in terms of semi-transparent PV
façade applications in office buildings.
The suitability of optimal PVR/WWR strategies in different architectural
conditions is investigated by comparing the energy saving to baseline buildings (A
and B) for each optimal PVR/WWR under different architectural conditions. The
results show that mono-crystalline semi-transparent PV façades are more suitable
in short rooms or rooms with small windows. Amorphous-silicon semi-transparent

Chapter 8
– 185 –
PV façades are more suitable in short room (small room depth). However, this
conclusion is based on baseline building B, which is consistent with the Chinese
Design Standard for Energy Efficiency of Public Buildings (GB-50189-2005). If
the setting and conditions of baseline buildings change, the suitability situation will
change accordingly. The energy saving of semi-transparent PV compared to the
baseline buildings is discussed and presented. Office rooms with both
mono-crystalline semi-transparent PV and amorphous-silicon semi-transparent PV
have much better energy performance than baseline building A. However, compare
to baseline building B, mono-crystalline semi-transparent PV could only achieve a
better energy performance in small WWR and room depth office rooms, and
amorphous-silicon fail to perform better in all cases.
The environmental benefit of semi-transparent PV façades based on the
carbon reduction by the amount of CO2 and polluted emission, which includes SO2,
NO and carbonaceous dust, is presented in this chapter. The environmental benefit
is also evaluated and presented using the emission reduction amount of CO2, SO2,
NO and carbonaceous dust. The results show that the use of semi-transparent PV
façades is notably beneficial for the air environment and may aid in reducing the air
pollution problem in china.

Chapter 9
– 186 –
Chapter 9 Main contributions and
Future work

Chapter 9
– 187 –
In this study, with the establishment of the experimental room, the calculation
models of solar irradiance on inclined surface and PV generation power based on
operating temperature are developed and presented. Energy evaluation including
PV generation, lighting, heating and cooling performance of semi-transparent PV
façades for office buildings is provided and presented. Related calculation methods
and models for semi-transparent PV façades are developed and provided in
different architectural conditions. An optimizing design approach for
semi-transparent PV façade by the use of optimal PVR/WWR is developed and
presented.
9.1. Main contributions
The main contributions of this study can be listed as following five aspects.
(1) Establishment of the experimental room to evaluate the PV façade
performance in the local climate
To evaluate the energy performance of PV façades in the realistic local
climate, the experimental room with two inner and separate chambers was set up on
the flat rooftop of a building in Wuhan. With smart design, skillful construction,
durable measurement and careful calibration in the experimental room, the
systemically measured and recorded data of environmental parameters and the
parameters that are related to PV façades was verified to be effective and valid. The
PV façades parameters achieved from the field experiment in this study agree
reasonably well with the results of previous works of other researchers. In
particularly, the establishment of the experimental room can be considered an
achievement in this study because not only it provided high-quality data in the
realistic local climate but also the experimental procedures and measurement
techniques were developed and gained in the process.
(2) Estimation of annual power generation of PV façade in China
The calculation models of solar irradiance on an inclined surface and PV
generation power based on the operating temperature are developed and validated
with the measured data. The good agreements between measured results and
calculated results demonstrate that the calculation models can predict annual power
generation of PV façades with good accuracy. In addition, the developed and

Chapter 9
– 188 –
validated calculation method in this study can be used as an easy-to-use tool in the
pre-design of BIPV.
With the validated calculation methods and the typical yearly weather data of
CSWD, the annual power generation of PV façades in China is calculated in
parametric studies. The results show that with various cities, building orientations,
building forms, materials and arrangements of PV modules, there is a distinct
difference in the electrical output energy of PV façades. PV façades have
maximum electrical generation in the south and minimum in the north. However,
although the gap between the most favourable orientation (south) and the most
unfavourable direction (north) in Beijing is relatively large, the difference of the
photovoltaic power generation in Wuhan and Guangzhou is relatively small. In
addition, the difference of PV electrical energy generated in rectangular, rhombus
and circular building forms was slightly higher in Beijing and relatively small in
the other cities. The parametric study results can serve as reference for architects,
engineers and installers in the BIPV project in China.
(3) Evaluation of overall energy performance of two type of semi-transparent
PV façade for office buildings in Wuhan, China
The energy evaluation based on the overall energy consumption is performed
in study for two types of semi-transparent PV façades with the following main
findings.
Mono-crystalline semi-transparent PV
By evaluating the overall energy performance of mono-crystalline
semi-transparent PV, we conclude that increasing PVR under the climatic
conditions of central China typically decreases the PV electricity conversion
efficiency and heating and cooling electricity consumption but increases the
lighting electricity consumption. Temperature significantly affects the conversion
efficiency. When the PVR increases, the PV electricity conversion efficiency
decreases.
When the PVR increases, the indoor daylight illuminance linearly decreases,
and the electricity consumption increases. Mono-crystalline semi-transparent PV
façades are more suitable and can provide better lighting energy performance in

Chapter 9
– 189 –
relatively short rooms, or in relatively larger-window rooms. Under the climatic
conditions of central China, increasing the PVR appears to decrease the heating and
cooling electricity consumption.
Compared with traditional glazings, in small WWR rooms, low PVR (below
50%) mono-crystalline semi-transparent PV glazing has a better overall energy
performance than single glazing and double glazing in all room depth cases. In
small WWR rooms, high PVR (above 50%) mono-crystalline semi-transparent PV
glazing has a better overall energy performance than single glazing and double
glazing in short rooms; however, in deep-room cases, it is worse than all traditional
glazings. In small WWR rooms, the mono-crystalline semi-transparent PV glazing
has a worse overall energy performance than Low-E double glazing in all cases,
particularly in deep rooms. In large WWR rooms, high PVR mono-crystalline
semi-transparent PV glazing was the most efficient energy performance (even
better than Low-E double glazing) in certain conditions.
Amorphous-silicon semi-transparent PV
In the parametric analysis of the overall energy performance of
amorphous-silicon semi-transparent PV, the results show that there is no tangible
relation between the WWR and the PV conversion efficiency. Its total amount of
PV electricity output is also less significant than that of mono-crystalline
semi-transparent PV. When the WWR increases, the indoor daylight illuminance
linearly increases, and the electricity consumption decreases. However, because of
the low visible and solar transmittance value of the amorphous-silicon layer in the
PV glazing, the amorphous-silicon semi-transparent PV does not perform well in
terms of indoor daylighting and lighting energy performance. Amorphous-silicon
semi-transparent PV glazing is beneficial in terms of saving overall heating and
cooling energy. Amorphous-silicon semi-transparent PV glazing is beneficial in
terms of saving the overall heating and cooling energy. Its heating and cooling
electricity consumption is relatively less than that of mono-crystalline
semi-transparent PV glazing.
Compared with three traditional glazings( single glazing, double glazing and
Low-E double glazing), discoveries are as follows. Amorphous-silicon

Chapter 9
– 190 –
semi-transparent PV is significantly inferior to traditional glazings in terms of
daylighting and lighting energy performance in all situations. In short rooms,
amorphous-silicon semi-transparent PV glazing generally has a better overall
energy performance than single glazing and double glazing.
(4) The development of an optimizing design approach for semi-transparent
PV façade by the use of optimal PVR/WWR.
In the study, improved design approaches considering the optimal PVR (for
mono-crystalline semi-transparent PV façade) and WWR (for amorphous-silicon
semi-transparent PV façade) are developed.
For mono-crystalline semi-transparent PV façade, an optimal PVR can be
obtained with a particular combination of WWR, room depth, and orientation.
When the overall energy performance is considered, adopting the optimal PVR can
result in electricity savings of up to 30% (average savings: 13%) compared to the
least favourable PVR. This result demonstrates the importance of selecting optimal
PVR based the on architectural conditions.
The rooms with small room depth have relatively smaller optimal PVR than
rooms with lager room depth. Large WWR rooms have relatively larger optimal
PVR than small WWR rooms. This result indicates that high PVR PV façades are
more suitable for deep rooms with larger window and small PVR PV façades are
more suitable for short rooms with small window. The building orientation can also
affect the optimal ratio with changes of 5–10% according to the specific
orientation, and the optimal PVR is higher in the western orientation; however,
these changes are much less pronounced than those induced by the variations in
WWR and room depth.
For amorphous-silicon semi-transparent PV façade, an optimal WWR (i.e.,
one that achieves the lowest overall electricity consumption) can be obtained for a
particular combination of room depth and orientation. When the overall energy
performance is considered, adopting the optimal WWR can result in electricity
savings of up to 15.8% compared to the least favourable WWR, although the
achieved savings vary depending on the combination of room depth at least in the
south orientation. This result demonstrates the importance of selecting the optimal

Chapter 9
– 191 –
WWR based on the architectural conditions. The results of optimal WWR indicate
that amorphous-silicon semi-transparent PV is preferable and more practical in
rooms with large windows.
(5) The suitability of optimal PVR/WWR strategies of semi-transparent PV
façades
The suitability of optimal PVR/WWR strategies in different architectural
conditions is investigated by comparing the energy saving to baseline buildings (A
and B) for each optimal PVR/WWR under different architectural conditions. The
results show that mono-crystalline semi-transparent PV façades are more suitable
in short rooms or rooms with small windows. Amorphous-silicon semi-transparent
PV façades are more suitable for short room (small room depth). However, this
conclusion is based on baseline building B, which is consistent with the Chinese
Design Standard for Energy Efficiency of Public Buildings (GB-50189-2005). If
the setting and conditions of baseline buildings change, the suitability situation will
change accordingly. The key factor is the standard that we use for the baseline
buildings. The energy saving of semi-transparent PV compared to the baseline
buildings is discussed and presented. Office rooms with both mono-crystalline
semi-transparent PV and amorphous-silicon semi-transparent PV have a much
better energy performance than baseline building A. However, compare to baseline
building B, mono-crystalline semi-transparent PV only achieves a better energy
performance in small WWR and small room depth office rooms, and
amorphous-silicon fail to perform better in all cases.
9.2. Limitations and future work
Some of the assumptions made earlier in the study would lead to some
technical limitations. The construction of the façades is simplified without detailed
consideration of air leakage, heat bridge and other possible impacts from façades
components. In a real situation, especially in a poorly built and maintained
building, this could lead to a significant impact on energy performance. All the
energy units relevant to the overall energy consumption are unified by electricity
unit (kWh), or (kWh/m2). The impact of better usage of passive applications
without the use of electricity in buildings could have an impact on the results.

Chapter 9
– 192 –
However, with the same configurations (which are also represent the most common
cases of office buildings in Central China) for the study cases, the results still give
a fair and consistent outcome and conclusions of how different semi-transparent
PV façadess impact on general office building cases. The indoor shading methods
of curtain or other shading devices are assumed not existed as semi-transparent
provides a certain level of shading. However, if indoor shading is used in some
particular circumstances, these shading devices could lead to significant impact on
energy performance. The operation schedule of the building is a fixed assumption
with same daily routines, in which people behave equally by the fractions of
percentage of different activities. However, in a real case people could behave
differently, for example, if there‘s a party planned on weekend, the activity could
lead a significant change to the energy consumption.
The study of semi-transparent PV façades is mainly based on office buildings,
but the application of PV façades to other types of buildings such as hotel and
residential buildings are also important. Buildings of different functions have
different energy consumption demands and different times when the consumption
occurs. For example, residential buildings mainly function at night time, which is
completely different from office buildings. Thus, other types of buildings should be
included in the future study.
Semi-transparent PV façades with single glazing were thoroughly studied.
However, other types of glazing such as double-glazing PV were not included in
this study. Double glazing is currently commonly used in buildings, and the
potential of semi-transparent PV double-glazing façades is notably promising
because they provide better thermal performance than single glazing. To
demonstrate a sense of the difference of energy performance between single
glazing, double glazing and Low-E double glazing, three typical models of which
are established with Energy Plus (same settings as described in chapter 5) operated
on a CSWD weather data of Wuhan (whole year); properties of each glazing is
shown in table 9.1, scheme diagram of which is shown in figure 9.1. By doing so ,
overall energy consumption of each glazing is calculated and shown in table 9.2.
The energy performance of double glazing is approximately 5% better than that of
single glazing, of which the Low-E double glazing is 21% better. A further study of

Chapter 9
– 193 –
double PV glazing can proceed based on the existing experiment rooms with the
developed calculation models and methods, in which we expect a better energy
performance on cooling and heating energy consumption, however how much
better is the question and needs to be further studied; The advantage of PV glazing
could be even more prominent in semi-transparent double glazing PV façades.
Table 9. 1 Properties of the studied glazings
Glazing U-value(W/m2K) Visible
transmittance
SHGC
Single glazing 5.8 0.87 0.87
Double glazing 2.8 0.71 0.75
Low-E double glazing 1.9 0.62 0.45
Note: Data obtained from ―Calculation specification for thermal performance of
windows, doors and glass curtain-walls‖ (JGJ/T 151-2008) (MHUDC, 2008)
Figure 9.1 Scheme of the glazing; single glazing(left), double glazing(middle),
Low-E double glazing(right).
Table 9.2 Average energy consumption of each glazing
Glazing Energy consumption Overall energy
performance
Lighting Heating Cooling
Single glazing (with shading
slab)
18.3 4.3 68.5 91.1
Double glazing (with shading
slab)
18.5 2.2 66.2 86.8
Low-E double glazing (with
shading slab)
18.6 4.3 48.7 71.6
kWh/m2

Chapter 9
– 194 –
In urban environment, shadows from other buildings will have a major effect
on the solar irradiation distribution on building façades. The effect of urban
environment should be included in the future study. This speculation is particularly
true in China because most cities in the country, including minor cities, have high
population densities and many high-rise buildings, which create complex shadow.
The use of solar energy technology on building façades in these urban areas is
challenging and should be included in future work.

Papers Arising from This Thesis
– 195 –
Papers Arising from This Thesis
1. Xu, S., Liao W., Huang J. and Kang J. (2014). Optimal PV cell coverage ratio
for semi-transparent photovoltaics on office building façades in central China.
Energy and Buildings 77 (0): 130-138. (SCI journal paper, published)
2. Xu S., Hu Z.M., Kang J. and Liao W. Estimation on annual power generation
of PV façades in China. Submit to Journal of Harbin Institute of Technology (New
Series). (EI journal paper, accepted)
3. Xu S., Kang J. Liao W. and Huang J. Suitability of semi-transparent PV
façades for energy efficient office buildings in central China. Submit to
Architectural Journal. [in Chinese] (in preparation)

References
– 196 –
References
Alonso-Abella, M., Chenlo, F., Nofuentes, G., and Torres-Ramírez, M. (2014).
Analysis of spectral effects on the energy yield of different PV (photovoltaic)
technologies: The case of four specific sites. Energy, 67(0), 435-443.
Andolsun, S., Culp, C. H., Haberl, J., and Witte, M. J. (2011). EnergyPlus vs.
DOE-2.1e: The effect of ground-coupling on energy use of a code house with
basement in a hot-humid climate. Energy and Buildings, 43(7), 1663-1675.
A. S., J. U., Varun. (2010) Life cycle assessment of solar PV based electricity
generation systems: A review. Renewable and Sustainable Energy Reviews,
14(1), 540-544.
Balenzategui, J. L. (1999). SRADLIB: AC Library for Solar Radiation Modelling.
Informes técnicos Ciemat, Madrid, 904.
Becker, C., Amkreutz, D., Sontheimer, T., Preidel, V., Lockau, D., Haschke, J.,
Jogschies, L., Klimm, C., Merkel, J. J., Plocica, P., Steffens, S., and Rech, B.
(2013). Polycrystalline silicon thin-film solar cells: Status and perspectives.
Solar Energy Materials and Solar Cells, 119(0), 112-123.
Birol, F. (2010). World energy outlook 2010. International Energy Agency.
<http://www.worldenergyoutlook.org> [accessed 07 June 2011 ]
Boyano, A., Hernandez, P., and Wolf, O. (2013). Energy demands and potential
savings in European office buildings: Case studies based on EnergyPlus
simulations. Energy and Buildings, 65(0), 19-28.
Brennan, J. (2014). Sustainability Hub. U-values: definition and calculation<
http://www.architecture.com/SustainabilityHub/Designstrategies/Earth/1-1-1-
10-Uvalues(INCOMPLETE).aspx >[accessed 11 March 2014 ]
Carmody, J., Selkowitz, S., Lee, E., Arasteh, D., Willmert, T. (2004). Window
systems for high-performance buildings. W.W. Norton & Company, New
York.
Chao, S. C. (1986). Physical geography of China. Science Press, New York.
Charron, R., and Athienitis, A. K. (2006). Optimization of the performance of
double-façades with integrated photovoltaic panels and motorized blinds.
Solar Energy, 80(5), 482-491.

References
– 197 –
Chen, B. (2012). Energy and Resources .China's PV industry urges for
commercialization < http://www.china.
org.cn/business/2012-04/13/content_25137463.htm > [Accessed 07 Oct
2012]
China Academic of Building Research. (2008).
Standard for Lighting Design of Buildings. China Architectural & Building
Press, Beijing.
China Academic of Building. (2004). Research Design Standard for Energy
Efficiency of Public Buildings. China Architectural & Building Press,
Beijing.
China Meteorological Bureau, Climate Information Center, Climate Data Office
and Tsinghua University, Department of Building Science and Technology.
(2005). China Standard Weather Data for Analyzing Building Thermal
Conditions. China Architecture and Building Press, Beijing. [in Chinese]
China State Bureau of Technical Supervision, and Ministry of Construction of
China. (1993). National Standard of China: Thermal design code for civil
building GB 50176-93. China Planning Press, Beijing. [in Chinese]
Ciulla, G., Lo Brano, V., Di Dio, V., and Cipriani, G. (2014). A comparison of
different one-diode models for the representation of I–V characteristic of a
PV cell. Renewable and Sustainable Energy Reviews, 32(0), 684-696.
Crawley, D. B., Lawrie, L. K., Winkelmann, F. C., Buhl, W. F., Huang, Y. J.,
Pedersen, C. O., Strand, R. K., Liesen, R. J., Fisher, D. E., Witte, M. J., and
Glazer, J. (2001). EnergyPlus: creating a new-generation building energy
simulation program. Energy and Buildings, 33(4), 319-331.
DOE. (2014). EnergyPlus Energy Simulation Software. Weather Data: All regions:
Asia WMO Region 2:
China<http://apps1.eere.energy.gov/buildings/energyplus/cfm/weather_data3.
cfm/region=2_asia_wmo_region_2/country=CHN/cname=China>[accessed
12 March 2014]
Duffie, J. A. and Beckman W. A. (1980). Solar Engineering of Thermal Processes.
John Wiley & Sons, New York.

References
– 198 –
Eiffert P. (2003). Guidelines for the economic evaluation of building-integrated
photovoltaic power systems. In: International energy agency PVPS task 7:
photovoltaic power systems in the built environment. National Renewable
Energy Laboratory.
Evans, D. L. (1981). Simplified method for predicting photovoltaic array output.
Solar energy, 27(6), 555-560.
Fung, T. Y., and Yang, H. (2008). Study on thermal performance of
semi-transparent building-integrated photovoltaic glazings. Energy and
Buildings, 40(3), 341-350.
Garcia, A., and Balenzategui, J. L. (2004). Estimation of photovoltaic module
yearly temperature and performance based on nominal operation cell
temperature calculations. Renewable Energy, 29(12), 1997-2010.
Gevorkian, P. (2007). Solar Power in Building Design (Green Source): The
Engineer's Complete Project Resource. McGraw-Hill Professional, New
York.
Ghadimi, M., Ghadamian, H., Hamidi, A. A., Shakouri, M., and Ghahremanian, S.
(2013). Numerical analysis and parametric study of the thermal behavior in
multiple-skin façades. Energy and Buildings, 67(0), 44-55.
Goetzberger, A., and Hebling, C. (2000). Photovoltaic materials, past, present,
future. Solar Energy Materials and Solar Cells, 62(1–2), 1-19.
Goia, F., Bianco, L., Perino, M., and Serra, V. (2014). Energy Performance
Assessment of and Advanced Integrated Façade through Experimental Data
Analysis. Energy Procedia, 48(0), 1262-1271.
Gracin, D., Siketić, Z., Juraić, K., and Čeh, M. (2013). Analysis of
amorphous-nanocrystalline silicon thin films by time-of-flight elastic recoil
detection analysis and high-resolution electron microscopy. Applied Surface
Science, 275(0), 19-22.
Hall, I. J., Prairie, R. R., Anderson, H. E. and Boes, E. C. (1978). Generation of a
typical meteorological year. Proc. of the 1978 Annual Meeting of the
American Section of the International Solar Energy Society. Denver,
669-671.

References
– 199 –
Han, J., Lu, L., Peng, J., and Yang, H. (2013). Performance of ventilated
double-sided PV façade compared with conventional clear glass façade.
Energy and Buildings, 56(0), 204-209.
Hart, G. W., and Raghuraman, P. (1982). Simulation of thermal aspects of
residential photovoltaic systems. NASA STI/Recon Technical Report N, 83,
12555.
Hausladen, G., de Saldanha, M., and Liedl, P. (2008). ClimateSkin: Building-skin
Concepts that Can Do More with Less Energy. Birkhäuser, Basel.
Hay, J. E. (1979). Calculation of monthly mean solar radiation for horizontal and
inclined surfaces. Solar Energy, 23(4), 301-307.
Hay, J. E., and Davies, J. A. (1980). Calculation of the solar radiation incident on
an inclined surface. In Proc. of First Canadian Solar Radiation Data
Workshop, Ministry of Supply and Services Canada, 59(0), 59-72.
Hindrichs, D. U., and Daniels, K. (2007). Plusminus 20/40 latitude: sustainable
building design in tropical and subtropical regions. Axel Menges, Stuttgart .
Hoang, P., Bourdin, V., Liu, Q., Caruso, G., and Archambault, V. (2014). Coupling
optical and thermal models to accurately predict PV panel electricity
production. Solar Energy Materials and Solar Cells, 125(0), 325-338.
Hong, T. (2009). A close look at the China Design Standard for Energy Efficiency
of Public Buildings. Energy and Buildings, 41(4), 426-435.
Hong, T., Chou, S. K., and Bong, T. Y. (2000). Building simulation: an overview
of developments and information sources. Building and environment, 35(4),
347-361.
Hoover, E. R. (1980). SOLCEL-II: An improved photovoltaic system analysis
program (No. SAND-79-1785). Sandia Labs., Albuquerque, NM.
Hua, C., and Shen, C. (1998). Comparative study of peak power tracking
techniques for solar storage system. Applied Power Electronics Conference
and Exposition, 2, 679-685.
Hui, S. C., and Lam, J. C. (1992). Test reference year (TRY) for comparative
energy study. Hong Kong Engineer, 20(2), 13-16.

References
– 200 –
Huld, T., Friesen, G., Skoczek, A., Kenny, R. P., Sample, T., Field, M., and
Dunlop, E. D. (2011). A power-rating model for crystalline silicon PV
modules. Solar Energy Materials and Solar Cells, 95(12), 3359-3369.
Hussein, K. H., Muta, I., Hoshino, T., and Osakada, M. (1995). Maximum
photovoltaic power tracking: an algorithm for rapidly changing atmospheric
conditions. IEE Proceedings-Generation, Transmission and Distribution,
142(1), 59-64.
Hyoungseok K., Kyounghoon C., Vasilis F., Parikhit S., Tak H. (2014). Life cycle
assessment of cadmium telluride photovoltaic (CdTe PV) systems. Solar
Energy, 103, 78-88.
IEC. (2006). Standard IEC 60904-1: Photovoltaic Devices. Part 1: Measurement of
Photovoltaic Current–Voltage Characteristics. International Electrotechnical
Commission, Geneva, Switzerland.
IEC. (2007). Standard IEC 60904-9: Photovoltaic Devices. Part 9: Solar Simulator
Performance Requirements. International Electrotechnical Commission,
Geneva, Switzerland.
IEC. (2008a). Standar IEC 61646: Thin-film photovoltaic (PV) modules – Desing
qualification and typ approbal. International Electrotechnical Commission,
Geneva, Switzerland.
IEC. (2008b). Standard IEC 60904-3.: Photovoltaic devices. Part 3: Measurement
Principles for Terrestrial Photovoltaic (PV) Solar Devices With Reference
Spectral Irradiance Data. International Electrotechnical Commission, Geneva,
Switzerland.
Infield, D., Eicker, U., Fux, V., Mei, L., and Schumacher, J. (2006). A simplified
approach to thermal performance calculation for building integrated
mechanically ventilated PV façades. Building and Environment, 41(7),
893-901.
Iqbal, M. (1983). An introduction to solar radiation. Academic Press, New York.
Ishaque, K., Salam, Z., and Taheri, H. (2011). Modeling and simulation of
photovoltaic (PV) system during partial shading based on a two-diode model.
Simulation Modelling Practice and Theory, 19(7), 1613-1626.

References
– 201 –
Jaber, S., and Ajib, S. (2011). Thermal and economic windows design for different
climate zones. Energy and Buildings, 43(11), 3208-3215.
Jiang, B., Ji, J., and Yi, H. (2008). The influence of PV coverage ratio on thermal
and electrical performance of photovoltaic-Trombe wall. Renewable Energy,
33(11), 2491-2498.
Jin, Q., and Overend, M. (2014). Sensitivity of façade performance on early-stage
design variables. Energy and Buildings, 77(0), 457-466.
Kamthania, D., and Tiwari, G. N. (2014). Energy metrics analysis of
semi-transparent hybrid PVT double pass façade considering various silicon
and non-silicon based PV module Hyphen is accepted. Solar Energy, 100,
124-140.
Klein, S. A. and Beckman W.A. (1993). PV F-Chart User‘s Manual: Windows
Version. F-Chart Software, 4406 Fox Bluff Road, Middleton, Wisc. 53562,
Accessed on March 4, 2014,from www.fchart.com.
Klein, S. A., University of Wisconsin—Madison. Solar Energy Laboratory.
(1979). TRNSYS, a transient system simulation program. Solar Energy
Laboratory, University of Wisconsin—Madison.
Klems, J. H. (1988). Measurement of fenestration net energy performance:
considerations leading to development of the Mobile Window Thermal Test
(MoWitt) facility. Journal of solar energy engineering, 110(3), 208-216.
Klems, J. H. (1988b). U-values, solar heat gain, and thermal performance: Recent
studies using the MoWiTT. Lawrence Berkeley Laboratory.
Klems, J., and Keller, H. (1987). Measurement of Single and Double Glazing
Thermal Performance Under Realistic Conditions Using the Mobile Window
Thermal Test (MOWITT) Facility. Solar Engineering, 1, 424-430.
Kottas, T. L., Boutalis, Y. S., and Karlis, A. D. (2006). New maximum power point
tracker for PV arrays using fuzzy controller in close cooperation with fuzzy
cognitive networks. Energy Conversion, 21(3), 793-803.
Lam, J. C., Hui, S. C. M. and Yuen, R. K. K. (1992). Typical weather year for
building energy simulation in Hong Kong. Hong Kong Meteorological
Society Bulletin, 2 (1): 36-44.

References
– 202 –
Lam, J. C., Li, D. H. W., and Cheung, S. O. (2003). An analysis of electricity
end-use in air-conditioned office buildings in Hong Kong. Building and
Environment, 38(3), 493-498.
Leal, V., and Maldonado, E. (2008). The role of the PASLINK test cell in the
modelling and integrated simulation of an innovative window. Building and
Environment, 43(2), 217-227.
Leite Didoné, E., and Wagner, A. (2013). Semi-transparent PV windows: A study
for office buildings in Brazil. Energy and Buildings, 67(0), 136-142.
Li, D. H. W., Cheung, G. H. W., Cheung, K. L., and Lam, T. N. T. (2010).
Determination of vertical daylight illuminance under non-overcast sky
conditions. Building and Environment, 45(2), 498-508.
Li, D. H. W., Lam, T. N. T., Chan, W. W. H., and Mak, A. H. L. (2009). Energy
and cost analysis of semi-transparent photovoltaic in office buildings.
Applied Energy, 86(5), 722-729.
Li, H., Lian, Y., Wang, X., Ma, W., and Zhao, L. (2011). Solar constant values for
estimating solar radiation. Energy, 36(3), 1785-1789.
Li, J., Dou, W., Xu, Z., Peng, Y., and Xu, H. (2007). Research on MPPT methods
of photovoltaic power generation system. Acta Energiae Solaris
Sinica, 28(3), 268-273.[in Chinese]
Li, J., Wang, S., Zhang, M. J., and Ma, L. J. (2007). China solar PV
report-2007.China Environmental Science Press, Beijing.
Lim, J. W., Lee, S. H., Lee, D. J., Lee, Y. J., and Yun, S. J. (2013). Performances
of amorphous silicon and silicon germanium semi-transparent solar cells.
Thin Solid Films, 547(0), 212-215.
Liu, B., and Jordan, R. (1962). Daily insolation on surfaces tilted towards equator.
Trans ASHRAE, 67.
Lu, L., and Law, K. M. (2013). Overall energy performance of semi-transparent
single-glazed photovoltaic (PV) window for a typical office in Hong Kong.
Renewable Energy, 49(0), 250-254.
Lukač, N., and Žalik, B. (2013). GPU-based roofs' solar potential estimation using
LiDAR data. Computers & Geosciences, 52, 34-41.

References
– 203 –
Lv, F. (2012). Workshop Presentations. Perspectives for a post-FiT regulatory
framework in China <
http://iea-pvps.org/index.php?id=15&no_cache=1&tx_damfrontend_pi1%5B
showUid%5D=1257&tx_damfrontend_pi1%5BbackPid%5D=15&tx_damfro
ntend_pi1%5Bpointer%5D=5 >[accessed 21 May 2014]
Marion, B., and Anderberg, M. (2000). PVWATTS-an online performance
calculator for grid-connected PV systems. In Proceedings of the solar
conference,119-124. Lakewood, U.S. October 14-17, 2001.
Masakazu I., Keiichi K., Kosuke K. (2010). Life-cycle analyses of very-large scale
PV systems using six types of PV modules. Current Applied Physics, 10(2),
271-273.
Mateus, N. M., Pinto, A., and Graça, G. C. D. (2014). Validation of EnergyPlus
thermal simulation of a double skin naturally and mechanically ventilated test
cell. Energy and Buildings, 75(0), 511-522.
Mei, L., Infield, D., Eicker, U., and Fux, V. (2003). Thermal modelling of a
building with an integrated ventilated PV façade. Energy and
buildings, 35(6), 605-617.
Menicucci, D. F., and Fernandez, J. P. (1989). User's manual for PVFORM: A
photovoltaic system simulation program for stand-alone and grid-interactive
applications (No. SAND-85-0376). Sandia National Labs., Albuquerque,
NM.
Mermoud, A. (1995). Use and validation of PVSYST, a user-friendly software for
PV-system design. In 13th European photovoltaic solar energy conference,
Nice, 736-739.
Ministry of Housing and Urban-rural Development of China. (2008). Calculation
Specification for Thermal Performance of Windows, Doors and Glass
Curtain-walls. China Architectural & Building Press, Beijing.
Miyazaki, T., Akisawa, A., and Kashiwagi, T. (2005). Energy savings of office
buildings by the use of semi-transparent solar cells for windows. Renewable
Energy, 30(3), 281-304.

References
– 204 –
Motuziene, V., and Juodis, E. S. (2010). Simulation based complex energy
assessment of office building fenestration. Journal of civil Engineering and
management, 16(3), 345-351.
Nalanie, M. (2014). Academia.edu. Semi-Transparent Building-Integrated
Photovoltaic Windows: Potential Energy Savings of Office Buildings in
Tropical Singapore
<http://www.academia.edu/3146904/Semi-transparent_building_integrated_P
hotovoltaic_Windows_Potential_energy_savings_of_office_buildings_in_tro
pical_Singapore> [accessed 03 April 2014]
NCC. (1976). Test Reference Year (TRY) Tape Reference Manual. TD-9706.
National Climatic Center, Asheville.
NCC. (1981). Typical Meteorological Year User Manual. TD-9734. Hourly Solar
Radiation—Surface Meteorological Observations. National Climatic Center,
Asheville.
NDRC (National Development and Reform Commission). (2011). Notice on
Improving the Policy Regarding Feed-in Tariff for Solar PV Generation.
<http://www.ndrc.gov.cn/zcfb/zcfbtz/2011tz/t20110801_426501.htm>
[accessed 12 October 2011][in Chinese]
NDRC (National Development and Reform Commission). (2013). Notice on
Promoting the Healthy Development of Solar PV Industry through Price
Leverage
<http://www.sdpc.gov.cn/zfdj/jggg/dian/t20130830_56127.htm>[accessed 12
September 2013] [in Chinese]
NEA. (2012a). The 12th Five-Year Plan for Solar Energy Development
<http://zfxxgk.nea.gov.cn/auto87/ 201209/P020120912536329466033.pdf>
[accessed 13 October 2013 ] [in Chinese]
NEA. (2012b). Notice on Application for Scaling Up Demonstration Zones for
Distributed Solar Power
<http://zfxxgk.nea.gov.cn/auto87/201209/t20120928_1513.htm> [accessed
14 October 2013] [in Chinese]
NEA. (2013). Notice on the Construction of Scaling Up Demonstration Zones for
Distributed Solar Power

References
– 205 –
<http://www.cnre.info/zcfg/gnzc/tyn/2013-08-22-2915.html>[accessed 04
September 2013] [in Chinese]
Ng, P. K., Mithraratne, N., and Kua, H. W. (2013). Energy analysis of
semi-transparent BIPV in Singapore buildings. Energy and Buildings, 66(0),
274-281.
Noorian, A. M., Moradi, I., and Kamali, G. A. (2008). Evaluation of 12 models to
estimate hourly diffuse irradiation on inclined surfaces. Renewable Energy,
33(6), 1406-1412.
Norton, B., Eames, P. C., Mallick, T. K., Huang, M. J., McCormack, S. J., Mondol,
J. D., and Yohanis, Y. G. (2011). Enhancing the performance of building
integrated photovoltaics. Solar Energy, 85(8), 1629-1664.
OFweek Research. (2012). Global solar PV industries on road
<http://www.doc88.com/ p-680406267386.html> [accessed 07 October 2012]
Olivieri, L., Caamaño-Martin, E., Olivieri, F., and Neila, J. (2014). Integral energy
performance characterization of semi-transparent photovoltaic elements for
building integration under real operation conditions. Energy and Buildings,
68, Part A(0), 280-291.
Olivieri, L., Caamaño-Martin, E., Olivieri, F., and Neila, J. (2014). Integral
energy performance characterization of semi-transparent photovoltaic
elements for building integration under real operation conditions. Energy and
Buildings, 68, Part A(0), 280-291.
Parida, B., Iniyan, S., and Goic, R. (2011). A review of solar photovoltaic
technologies. Renewable and Sustainable Energy Reviews, 15(3), 1625-1636.
Peng, C., Huang, Y., and Wu, Z. (2011). Building-integrated photovoltaics (BIPV)
in architectural design in China. Energy and Buildings, 43(12), 3592-3598.
Petter Jelle, B., Breivik, C., and Drolsum Røkenes, H. (2012). Building integrated
photovoltaic products: A state-of-the-art review and future research
opportunities. Solar Energy Materials and Solar Cells, 100(0), 69-96.
Pissimanis, D., Karras, G., Notaridou, V., and Gavra, K. (1988). The generation of
a ―typical meteorological year‖ for the city of Athens. Solar Energy, 40(5),
405-411.

References
– 206 –
Poirazis, H., Blomsterberg, Å., and Wall, M. (2008). Energy simulations for glazed
office buildings in Sweden. Energy and Buildings, 40(7), 1161-1170.
Posadillo, R., and López Luque, R. (2009). Evaluation of the performance of three
diffuse hourly irradiation models on tilted surfaces according to the
utilizability concept. Energy Conversion and Management, 50(9), 2324-2330.
Reindl, D. T., Beckman, W. A., and Duffie, J. A. (1990). Evaluation of hourly
tilted surface radiation models. Solar Energy, 45(1), 9-17.
Rempel, A. R., Rempel, A. W., Cashman, K. V., Gates, K. N., Page, C. J., and
Shaw, B. (2013). Interpretation of passive solar field data with EnergyPlus
models: Un-conventional wisdom from four sunspaces in Eugene, Oregon.
Building and Environment, 60(0), 158-172.
RIBA. (2014). Efficient windows. Measuring Performance: Solar Heat Gain
Coefficient (SHGC) <http://efficientwindows.org/shgc.php > [accessed 11
March 2014]
Roberts, S., and Guariento, N. (2009). Building Integrated Photovoltaics: A
Handbook. Birkhäuser Verlag AG, Berlin.
Roberts, S., and Guariento, N. (2009). Building Integrated Photovoltaics: A
Handbook. Birkhäuser Verlag AG, Berlin.
Rozario, J., Vora, A. H., Debnath, S. K., Pathak, M. J. M., and Pearce, J. M.
(2014). The effects of dispatch strategy on electrical performance of
amorphous silicon-based solar photovoltaic-thermal systems. Renewable
Energy, 68(0), 459-465.
Saridar, S., and Elkadi, H. (2002). The impact of applying recent façade technology
on daylighting performance in buildings in eastern Mediterranean. Building
and Environment, 37(11), 1205-1212.
Sastry, O. S., Saurabh, S., Shil, S. K., Pant, P. C., Kumar, R., Kumar, A., and
Bandopadhyay, B. (2010). Performance analysis of field exposed single
crystalline silicon modules. Solar Energy Materials and Solar Cells, 94(9),
1463-1468.
Sergio P., Deepak S., Gregory K. (2007). Parameters affecting the life cycle
performance of PV technologies and systems. Energy Policy, 35(6),
3316-3326.

References
– 207 –
Serra, V., Zanghirella, F., and Perino, M. (2010). Experimental evaluation of a
climate façade: Energy efficiency and thermal comfort performance. Energy
and Buildings, 42(1), 50-62.
Shen, H., and Zeng, Z. (2005). Photovoltaic Technology. Chemical Industry Press,
Beijing.
Siurna, D. L., D‘Andrea, L. J., and Hollands, K. G. T. (1984). A Canadian
representative meteorological year for solar system simulation.
In Processdings 10th annual conference of the Solar Energy Society of
Canada. Alberta, 85-88, August 2-6, 1984.
Skoplaki, E., and Palyvos, J. A. (2009). On the temperature dependence of
photovoltaic module electrical performance: A review of efficiency/power
correlations. Solar energy, 83(5), 614-624.
Smart, M. G., and Ballinger, J. A. (1984). Fourier-synthesized weather data for
building energy use estimation. Building and Environment, 19(1), 41-48.
Solomon, S., Qin, D., Manning, M., Chen, Z., Marquis, M., Averyt, K.B., Tignor,
M., and Miller, H.L. (2007). Climate Change 2007 - the Physical Science
Basis: Working Group I Contribution to the Fourth Assessment Report of the
IPCC. Cambridge University Press, Cambridge.
Sonnenenergie, D. G. (2008). Planning and Installing Photovoltaic Systems: A
Guide for Installers, Architects and Engineers. James & James/Earthscan,
London.
Steve S, Hassan R. (2013). Assessing the technical and economic performance of
building integrated photovoltaics and their value to the GCC society.
Renewable Energy, 55, 150-159.
Strachan, P. A. (2008). Simulation support for performance assessment of building
components. Building and Environment, 43(2), 228-236.
Strachan, P. A., and Vandaele, L. (2008). Case studies of outdoor testing and
analysis of building components. Building and Environment, 43(2), 129-142.
Sun, X., Wu, W., Li, X., and Zhao, Q. (2002). A research on photovoltaic energy
controlling system with maximum power point tracking. Power Conversion
Conference, 2, 822-826.

References
– 208 –
Susorova, I., Tabibzadeh, M., Rahman, A., Clack, H. L., and Elnimeiri, M. (2013).
The effect of geometry factors on fenestration energy performance and
energy savings in office buildings. Energy and Buildings, 57, 6-13.
Tabares-Velasco, P. C., Christensen, C., and Bianchi, M. (2012). Verification and
validation of EnergyPlus phase change material model for opaque wall
assemblies. Building and Environment, 54(0), 186-196.
Taleb, H. M., and Pitts, A. C. (2009). The potential to exploit use of
building-integrated photovoltaics in countries of the Gulf Cooperation
Council. Renewable Energy, 34(4), 1092-1099.
Temps, R. C., and Coulson, K. L. (1977). Solar radiation incident upon slopes of
different orientations. Solar Energy, 19(2), 179-184.
Torres Lobera, D., and Valkealahti, S. (2013). Dynamic thermal model of solar PV
systems under varying climatic conditions. Solar Energy, 93(0), 183-194.
Vartiainen, E. (2000). A new approach to estimating the diffuse irradiance on
inclined surfaces. Renewable Energy, 20(1), 45-64.
Vartiainen, E. (2001). Electricity benefits of daylighting and photovoltaics for
various solar façade layouts in office buildings. Energy and Buildings, 33(2),
113-120.
Wawer, P., Müller, J., Fischer, M., Engelhart, P., Mohr, A., and Petter, K. (2011).
Latest Trends in Development and Manufacturing of Industrial, Crystalline
Silicon Solar-Cells. Energy Procedia, 8(0), 2-8.
Weller, B., Hemmerle, C., Jakubetz, S., and Unnewehr, S. (2010). Detail Practice:
Photovoltaics: Technology, Architecture, Installation, Birkhäuser Verlag AG,
Basel.
Wong, P. W., Shimoda, Y., Nonaka, M., Inoue, M., and Mizuno, M. (2005). Field
Study and Modeling of Semi-Transparent PV in Power, Thermal and Optical
Aspects. Journal of Asian Architecture and Building Engineering 4 (2),
549-556.
Wong, P. W., Shimoda, Y., Nonaka, M., Inoue, M., and Mizuno, M. (2008).
Semi-transparent PV: Thermal performance, power generation, daylight
modelling and energy saving potential in a residential application. Renewable
Energy, 33(5), 1024-1036.

References
– 209 –
Xie, H., Yu, Z., and Wu, J. (2011). The Current Situation and Problems in China's
Building Energy Efficiency. Procedia Engineering, 21(0), 1145-1151.
Xu, H. (2012). Status and trends of PV industry and technology in China <http://
apps1.eere.energy.gov/solar/newsletter/pdfs/01_statusandtrendsofpvinchi
na_xuhonghua_s.pdf> [accessed 07 October 2012]
Xu, H., Dou, C., Wang, S., and Lv, F. (2011). National survey report on PV power
application in China <
http://iea-pvps.org/index.php?id=93&tx_damfrontend_pi1=&tx_damfrontend
_pi1[catPlus]=&tx_damfrontend_pi1[catEquals]=&tx_damfrontend_pi1[cat
Minus]=&tx_damfrontend_pi1[catPlus_Rec]=87&tx_damfrontend_pi1[catMi
nus_Rec]=&tx_damfrontend_pi1[treeID]=201&tx_damfrontend_pi1[id]=93
>[accessed 05 May 2011]
Yang, L., Lam, J. C., and Liu, J. (2007). Analysis of typical meteorological years in
different climates of China. Energy Conversion and Management, 48(2),
654-668.
Yang. (2008). Analysis of potential for CO2 mitigation by photovoltaic systems.
Collection Theses of the 10th
Solar Conference of China, 05, 845-849.
Yao, R., Li, B., and Steemers, K. (2005). Energy policy and standard for built
environment in China. Renewable Energy, 30(13), 1973-1988.
Ye, Z., Nobre, A., Reindl, T., Luther, J., and Reise, C. (2013). On PV module
temperatures in tropical regions. Solar Energy, 88, 80-87.
Yu, G. J., Jung, Y. S., Choi, J. Y., and Kim, G. S. (2004). A novel two-mode
MPPT control algorithm based on comparative study of existing algorithms.
Solar Energy, 76(4), 455-463.
Yu, J., Yang, C., Tian, L., and Liao, D. (2009). Evaluation on energy and thermal
performance for residential envelopes in hot summer and cold winter zone of
China. Applied Energy, 86(10), 1970-1985.
Yun, G. Y., McEvoy, M., and Steemers, K. (2007). Design and overall energy
performance of a ventilated photovoltaic façade. Solar Energy, 81(3),
383-394.
Zhang, J., and Lin, Z. (1992). Climate of China. John Wiley & Sons, New York.

References
– 210 –
Zhang, Z. X. (1995). Energy conservation in China: an international perspective.
Energy Policy, 23(2), 159-166.
Zhang, X., Zhao, X., Smith, S., Xu, J., and Yu, X. (2012). Review of R&D
progress and practical application of the solar photovoltaic/thermal (PV/T)
technologies. Renewable and Sustainable Energy Reviews, 16(1), 599-617.
Zhang F., Cheng H., Wang Z., Chen H. and Liu J.(2012). Pollution characteristics
and sources analysis of trace elements in PM2.5 in Wuhan City. Engineering
Journal of Wuhan University, 45(06), 755-761.

Appendix A
– 211 –
Appendix A: The images of experimental room set-up and
experimental process
A1-A5: The construction process of the experimental room
B1-B8: Various types of the semi-transparent PV glazings on the façades
C1-C7: The equipment and measurement process in the field experiment
No. Image Description
A1
The bottom
frame of the
experimental
room
A2
The steel
frame of the
experimental
room

Appendix A
– 212 –
A3
The
construction
process (I)
A4
The
construction
process (II)
A5
The
construction
process (III)

Appendix A
– 213 –
B1
The outside
view of
mono-crystalli
ne
semi-transpare
nt PV glazing
B2
The inside
view of
mono-crystalli
ne
semi-transpare
nt PV glazing
B3
The
installation of
mono-crystalli
ne
semi-transpare
nt PV glazing

Appendix A
– 214 –
B4
The outside
view of the
experimental
façades (I)
B5
The outside
view of the
experimental
façades (II)
B6
The
installation of
amorphous-sil
icon
semi-transpare
nt PV glazing

Appendix A
– 215 –
B7
The outside
view of
amorphous-sil
icon opaque
PV glazing
B8
The inside
view of
amorphous-sil
icon opaque
PV glazing
C1
The
pyranometer
with shading
ring on the
roof

Appendix A
– 216 –
C2
The group of
pyranometers
on the roof
C3
The outside
luxmeter on
the roof and
and the
pyranometer
on the east
façade
C4
The
luxmeter
inside the
experimental
room

Appendix A
– 217 –
C5
The power
recorder and
data logger
inside the
experimental
room
C6
Fixing the
thermocouple
on outside
surface of PV
glazing
C7
The
measurement
of the
transmittance
of the
amorphous-sil
icon
semi-transpare
nt PV glazing

Appendix B
– 218 –
Appendix B: Optimal PV cell coverage ratio for
semi-transparent photovoltaics on office building façades in
central China

Appendix B
– 219 –

Appendix B
– 220 –
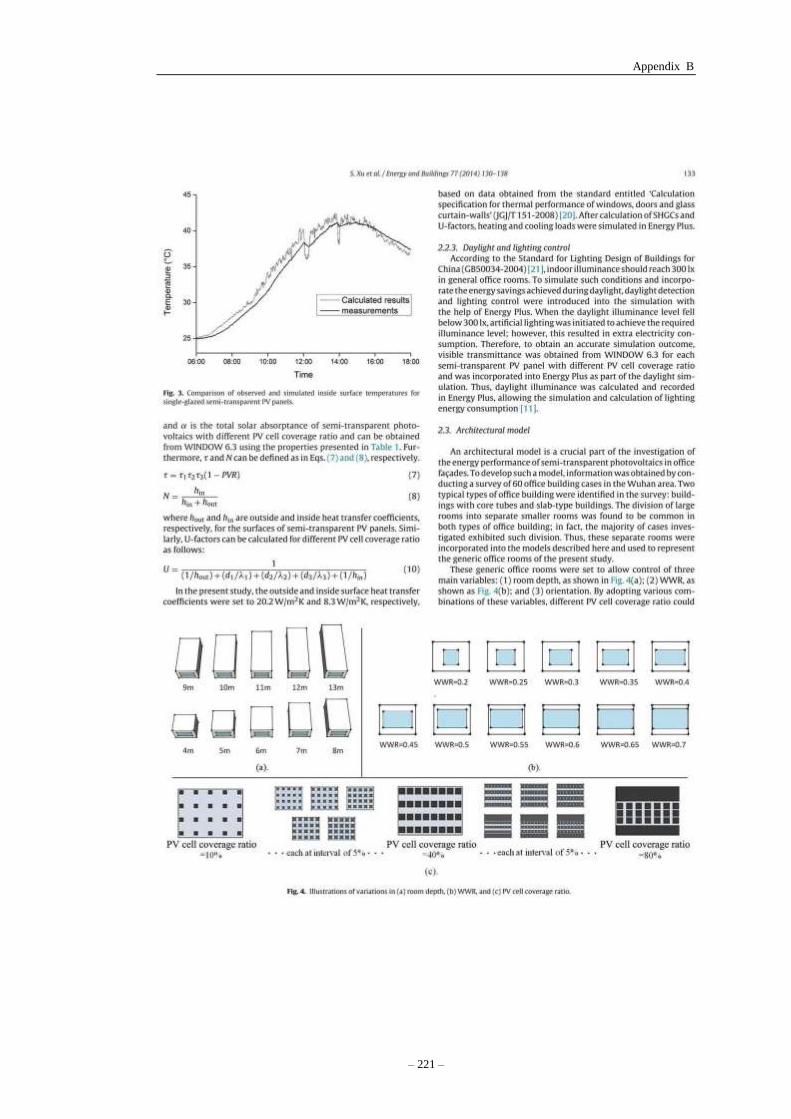
Appendix B
– 221 –

Appendix B
– 222 –

Appendix B
– 223 –

Appendix B
– 224 –

Appendix B
– 225 –

Appendix B
– 226 –