energy flow in global systems - weebly
TRANSCRIPT

Energy Flow in Global Systems

D1 – The Biosphere

• The Earth is a big place – how can we
divide it up from a geological and
ecological point of view?
• Climate change is a “hot” topic – how
do we know what we know and why
are we worried?
• If energy cannot be created or
destroyed, how is it transferred
throughout the biosphere?
• Can we calculate this energy transfer?

• The biosphere refers to the thin layer of Earth that has conditions suitable for life, includes:
• all living things
• the physical environment that supports those living things
• subdivided into three components that interact:
• atmosphere – layer of gases that surround the Earth
• lithosphere – a.k.a. Earth‟s crust – the solid portion off the Earth (includes the land under the oceans)
• hydrosphere – all the water on Earth (includes liquid, vapour and ice)

• made up of a mixture of gases,
• 78% N2(g), 21% O2(g), 1% other
• “other” includes Ar, CO2, Ne, He, CH4 and Kr
• does not include H2O because it is considered to be part of the hydrosphere
• also includes tiny solid particles called atmospheric dust
• including living things (e.g. pollen, micro-organisms) and non-living (e.g. soot)

• Divided up into four layers based on altitude (distance from
sea level)

• From 0 to 10 km
• Temperature 15oC to – 60oC
• only layer of the atmosphere with a mix of gases and
temperature to support a variety of life (including humans)
• contains most of the CO2 and H2O and atmospheric dust
present in the atmosphere
• where most of our weather occurs, including wind and
precipitation

• From 10 to 50 km
• Temperature – 60oC to 0oC
• only isolated clumps of living cells found living in this layer
• contains most of the ozone layer
• ozone is a molecule made up of three oxygen atoms (O3(g))
• protects living organisms from sun‟s UV radiation

• From 50 to 80 km
• Temperature 0oC to – 100oC

• From 80 to 300 km
• Temperature – 100oC to 1500oC
• named for the high temperatures near the edge of the layer
(closest to the sun)

• floats on top of the fluid layer called the mantle
• extends from the Earth‟s surface inward
• as thin as 5 km, as thick as 100 km in places
• warmed both by the heat from the sun and the heat from Earth‟s
core

• about 97% is salt water in the oceans
• the other 3% fresh water, but is mostly frozen in
snow and glaciers
• the total amount of water on Earth remains
constant
• warmed mostly by the sun, but also by the
Earth‟s core
salt water
fresh liquid water
ice

weather
• day-to-day conditions,
including
• temperature & air pressure
• cloud cover & humidity
• precipitation
climate
• average conditions occurring
over a period of 30 years or
longer
• e.g. Alberta has a relatively
cold and dry climate compared
to Brazil, which is warm and
humid

• the climate of a region (map #1)
- average air temperatures) has
several effects on the humans
that live there, including
• population distribution (map #2)
• clothing & shelter considerations
• heating & cooling requirements
• food availability & agricultural
options (map #3)
• economic opportunities

• The better suited to its climate an organism is, the better its
chances of survival
• an adaptation is a change in the structure or functioning of an
organism that makes it more suited to its environment

• Climate is long term – climate change refers to a noticeable change in average temperatures in a region over time
• A few common questions arise when discussing climate change:
• is climate change really happening, or are environmentalists using scare tactics?
• if climate change is occurring over such long terms, how do we know for sure?
• if climate change has occurred several times over Earth‟s history, why are we so worried now?

• Global warming IS happening – no educated scientist, politician or
environmentalist disputes this
• what IS up for debate is why it is happening and if it is cause for concern
• Since 1990, the global average temperature has risen by 0.6oC,
• the northern hemisphere is substantially warmer than at any point during the
past 1,000 years
• the key is that its GLOBAL AVERAGE temperatures – it doesn‟t necessarily
mean all regions of the world will experience warming at all
• in Canada, it could actually result in cooling temperatures and more extreme
weather events

• a variety of evidence exists to demonstrate that the climate of the Earth has varied throughout its history
• this change continues today, and is often referred to as global warming
• some of the evidence we use depends upon humans, so only describes the last few thousand years
• some of the evidence allows us to look back at the Earth‟s conditions prior to humans arriving

• two general categories of evidence exist:
• anecdotal evidence
• evidence based on stories people tell,
• from the word “anecdote”, meaning a short, personal story of an individual‟s experiences
• is most often qualitative in nature
• instrumental evidence
• includes any evidence that comes as a result of measurement
• may require special equipment,
• is most often quantitative in nature
• Which one is more reliable? Why?

• when trying to measure something, there are two approaches
• measure the factor directly (e.g. if you want to find out how far it is to Calgary, measure the distance)
• measure some other factor, and use it to make conclusions (e.g. calculate the distance based on your speed of travel and the time it takes)
• tracking climate change is the same way:
• direct evidence
• explicitly indicates global warming is occurring, based on an actual measured change in global temperatures.
• indirect evidence
• evidence that seems to support the idea of climate change but does not involve a direct measurement of temperature.

• uses historical data
• from scientists to farmers, people have been recording weather and temperature information for hundreds of years
• patterns emerge and are often used to predict future weather, such as in the Farmers‟ Almanac
• limited in how far back a written record goes; restricted only to the last few hundred years

• different types of evidence exist that support the idea of
climate change, though are not direct measurement of
temperature
• these include:
• tree ring analysis
• ice core sampling
• fossil record of insects
• pollen sampling from the bottom of lakes

• tree rings reflect the changing seasons of cold and drought,
warmth and precipitation during the life of a tree
• by examining wood from trees of different ages and from
different time periods, a continuous record of climate changes
can be established that goes back a few thousand years.

• The tree's age can be figured out by counting the pairs of light and dark rings. It's easier to see the dark rings so they are usually the ones used for counting.
• To help figure out what climate the tree grew in and what the environment was like, the scientist looks at each ring: • thickness:
• How wide a ring is can tell you if the environment was good or bad for the tree to grow in.
• In years when the amount of rain and temperature were good a tree's rings are wider.
• In bad years a tree's rings are thinner.

• shape: • if rings start to become thinner on one
side than the other it probably means the tree is leaning over to one side.
• High winds or a big storm can cause a tree to lean.
• strange marks or scars, • can be left by insects or disease.
• a forest fire can leave burnt marks.
• scientists use a computer to measure the width of rings up to 0.01 mm and to find other things they can't see by just looking at the tree.
Sample tree ring analysis
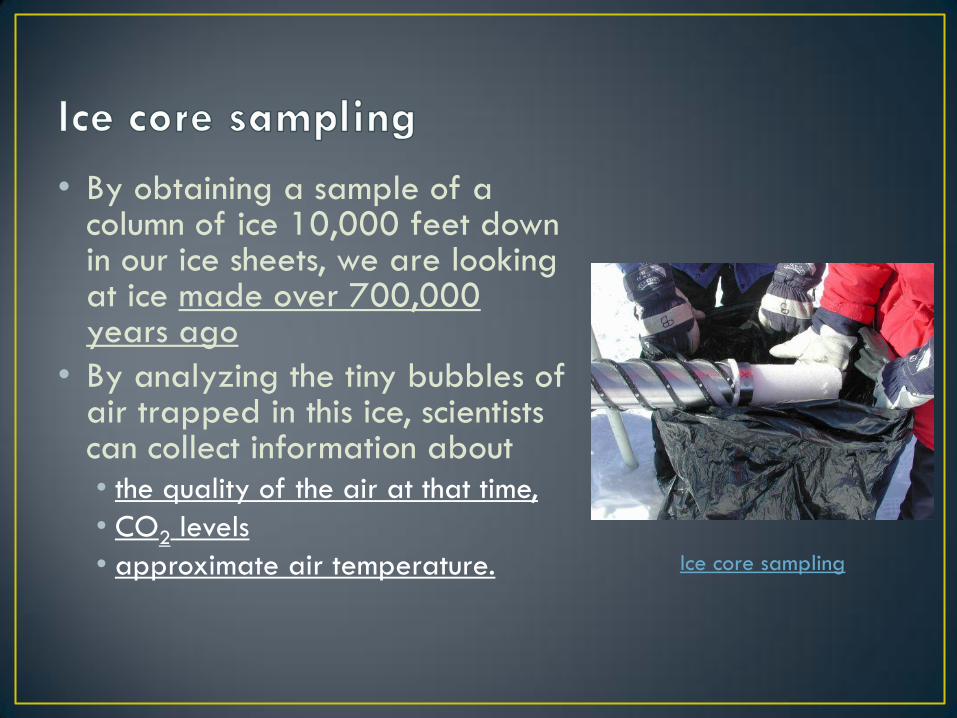
• By obtaining a sample of a column of ice 10,000 feet down in our ice sheets, we are looking at ice made over 700,000 years ago
• By analyzing the tiny bubbles of air trapped in this ice, scientists can collect information about • the quality of the air at that time,
• CO2 levels
• approximate air temperature.
Ice core sampling

• By examining fossil records or pollen samples from the past, we can determine what plants and insects existed at that point in Earth‟s history
• since we know that plants and animals are adapted to particular climates (temperature, humidity, amount of sunlight), we can make conclusions about the conditions in the area in which they were found

D2 – Energy transfer through the biosphere

• You‟ve probably heard that greenhouse gases are to blame
for climate change – that‟s partly true
• Natural factors, including solar fluctuations, slight “wobbles” in
the Earth‟s orbit, and the movement of the continents have also
influenced climate over Earth‟s history
• However, in the case of current global warming, the speed and
degree of change (how fast and how much) can only be
explained by human activity
• to understand how heat becomes trapped in the atmosphere, we have to
understand the sun‟s energy

• The sun‟s energy is radiant energy – recall, that means energy
that is transmitted in waves
• There are a wide variety of waves radiating from the sun
• All waves from the sun travel at the same speed, (the speed of light,
3.00x10⁸ m/s), but they vary in the amount of energy they carry

• Not all regions of the Earth receive the same amount
of the Sun‟s energy
• Insolation is the amount solar energy received by a region
of the Earth‟s surface

• Angle of Inclination
• while we often illustrate the Earth like this
• it‟s actually on a tilt, like this
• the angle of inclination refers to the angle of the Earth‟s axis
compared to the vertical
• while we have evidence that suggests the Earth wobbles a
bit, the angle of inclination is 23.5o

• the Earth orbits the Sun once per year
• the Earth‟s tilt is the reason for the seasons
• remember, you have to distinguish between hemispheres
when discussing seasons


• A equinox occurs when the Earth is tilted sideways relative to
the sun
• the number of daylight hours = the number of hours of darkness
• Spring Equinox – March 21
• Fall Equinox – September 21
• *in the Northern Hemisphere
• A solstice occurs when the Earth is tilted toward or away from
the sun
• the number of daylight hours are at their maximum or minimum
• Summer solstice – June 21
• Winter solstice – December 21
• *in the Northern Hemisphere


• Areas close to the equator:
• experience short sunrises and sunsets
• have very little variance in their number of daylight hours from season to season
• 12 hours of daylight, 12 hours of darkness every day
• Areas close to the poles:
• experience long sunrises and sunsets
• have significant variance in their number of daylight hours
• in summer, more than 23 hours of daylight, 1 hour of darkness
• in winter, less than one hour of daylight, 23 hours of darkness


• The shape of the Earth also plays a part in insolation
• Because it‟s spherical, a light ray hitting at the equator strikes
the Earth with more intensity than a light ray hitting at a
higher latitude

• The Angle of
Incidence is the
angle between the
incoming sun ray
and a line
perpendicular to
the Earth‟s surface
90o angle
sun is intense
40o angle
sun is diffuse

• Ever notice when you go out on a hot day wearing a black t-
shirt, you feel warmer than if you were wearing white?
• Conversely, when you go snowboarding, notice how the sun
reflects very brightly off the white snow than it does off rocks
or exposed ground?
• These two phenomena can be explained using a concept called
albedo

• the albedo of a surface is the percent of solar radiation that it reflects
• a white shiny surface (e.g. snow) has a high albedo
• a dark, dull surface (e.g. forest, dirt) has a low albedo
• the average albedo for Earth‟s surface is 30% (or 0.30)

• because snow and ice have a much higher albedo, regions that are frozen reflect more snow than regions without snow or ice
• the albedo of most regions in Canada is significantly higher in winter than in summer
• in the arctic, the albedo is high year-round
• deserts also have high albedo because they lack vegetation to absorb the sun‟s rays

• The climate of a region is largely determined by the insolation,
or amount of sunlight, the area gets
• Insolation is affected by
• the Angle of Inclination – due to the tilt of the Earth, areas further from
the equator see more variation in seasonal temperatures and the number
of daylight hours
• the Angle of Incidence – due to the spherical shape of the Earth, areas
further from the equator get less direct and intense sun
• Once the sun hits the Earth‟s surface, it may be absorbed or
reflected, depending on the albedo of the surface

• Recall, energy cannot be destroyed – so if some/most of the
sun‟s rays reflect off the Earth‟s surface, where do they go?
• the energy gets radiated back into the atmosphere in the form
of thermal energy

• normally, a portion of this thermal energy is lost to space, and a portion is
absorbed by the atmosphere
• the trapping of this heat by the atmosphere is called the Natural
Greenhouse Effect
• without this effect, the Earth would be 33oC colder

• Greenhouse gases are gases that contribute to the greenhouse
effect
• The main naturally-occurring greenhouse gas is water vapour.
Other naturally-occurring greenhouse gases include
Water vapour
Carbon dioxide
Methane
Dinitrogen monoxide
Other gases (incl. ozone &halocarbons)

• Before human activity made such an impact, the Earth‟s
radiation budget was balanced
• that is, some thermal energy was reflected out into space, and some
absorbed by the atmosphere
• the net result was zero
• net radiation budget = incoming radiation – outgoing radiation
• it is important to note that the budget is balanced on a planetary basis,
but some regions are in surplus and some in deficit
• the areas at the equator tend to have higher insolation, which gives them
a surplus
• the areas closer to the poles tend to have lower insolation, which gives
them a deficit

• net radiation budget = incoming radiation – outgoing radiation
• if a build-up of greenhouse gases causes more radiation to be
absorbed by the atmosphere, we have a surplus this will
cause global temperatures to rise

• Recall, thermal energy (or heat) moves from warm to cool
• Radiation - emission of energy as waves
• when radiant energy encounters particles of matter, those particles will
either re-radiate the energy back into space or pass the energy on to
other particles
• two methods for passing energy onto other particles:
• conduction
• convection

• transfer of heat through direct contact between particles
• this is the most common method of heat transfer in solids,
because it does not require movement of the particles to a
different location
• particles pass their energy on to neighbouring particles by
vibrating against them

• the transfer of thermal energy through the movement of
particles from one location to another
• usually occurs in fluids – liquids and gases – by inducing a
convection current in the fluid
• some of the particles heat up and begin moving faster
• as the warm particles move apart, they become less dense and rise
• when the particles contact cooler particles, they cool and fall back down

• the temperature of the air in the atmosphere near the equator
warms and rises toward the poles
• the air at the poles then cools and sinks back down
• because the cool air has higher atmospheric pressure, it moves toward
the equator where the pressure is lower
• wind is the movement of this cooler air from an area of high pressure to
an area of low pressure
• if the Earth were still (and not spinning), their would be a continuous
convection current between the equatorial and polar air
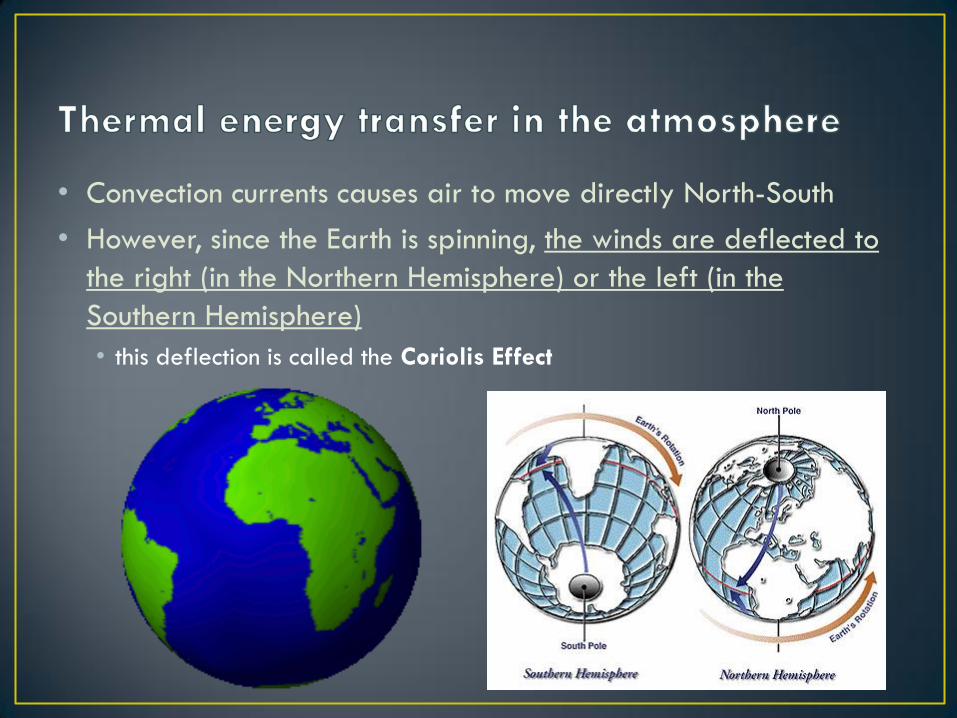
• Convection currents causes air to move directly North-South
• However, since the Earth is spinning, the winds are deflected to
the right (in the Northern Hemisphere) or the left (in the
Southern Hemisphere)
• this deflection is called the Coriolis Effect

• As a result of convection currents and the Coriolis Effect, global winds follow a predictable pattern • trade winds are the normal
wind patterns that transfer heat around the globe
• jet streams are bands of fast moving air in the stratosphere that travel much faster than wind in the troposphere • changes in normal jet stream
patterns are important in predicting weather changes and extreme weather events such as storms and cyclones

• The hydrosphere transfers thermal energy in a similar way as in
the atmosphere
• Surface water is pushed by trade winds
• Deeper water travels by convection currents
• Warmer waters near the equator are driven by convection currents
toward the poles
• currents in the Northern Hemisphere circle clockwise
• currents in the Southern Hemisphere circle counterclockwise
• Unlike air currents which don‟t have to circulate around
something, water currents are disrupted by the continents

• These three Canadian cities are at nearly the exact same
latitude
• Because they are all the same distance from the equator,
they are subject to the same air currents, so we might
expect that they all have the same average temperatures
49oN

• However, this is what Environment Canada actually
reports:
City Latitude Average Annual
Temperature (oC)
Average January
Temperature (oC)
Average July
Temperature (oC)
Vancouver, BC 49.11oN 10.1 3.3 17.5
Lethbridge, AB 49.38oN 5.7 - 7.8 18.0
Gander, NF 48.56oN 3.8 - 7.4 16.0
-10
-5
0
5
10
15
20
Vancouver
Lethbridge
Gander

• Vancouver has the warmest annual average, and the
least monthly temperature variation
• Gander has the coolest annual average, but also less
variation
• Lethbridge‟s average annual temperature is between
the other two, but sees the most variation
• these three observations can all be explained by the
presence or absence of a large body of water next to the
city

• At several points in this course, you‟ve been asked to consider
the special properties of water (e.g. good solvent, polar
molecule, solid is less dense than the liquid, cohesive & adhesive,
etc.)
• There is one more property of water that affects global energy
transfer: water has an unusually high specific heat capacity
• Specific heat capacity refers to the ability of a substance to absorb
thermal energy without changing temperature
• The high specific heat capacity of water means that it absorbs much of
the sun‟s radiant energy but stays at a constant temperature

• Cities next to oceans experience more moderate (less extreme) temperatures because water can absorb heat without changing temperature
• Because Vancouver and Gander are located on oceans, the air temperature is moderated by the water
• that means they will see less variation in their climate from month to month
• Vancouver is located next to a warm ocean current coming from the equator
• Gander is located next to a cool ocean current coming from the arctic
• this explains why Vancouver has a warmer average temperature
• Because Lethbridge is land-locked, it does not benefit from the regulating effect of the ocean, and therefore experiences greater temperature variation from month to month

• the quantity of thermal energy (Q) is the amount of
thermal energy (measured in joules) that is absorbed
or released when the temperature of a substance
changes
• it is affected by
• the mass of the substance (measured in grams)
• the amount of change in temperature (measured as the
number of oC it changes)
• how easily the substance changes temperature (as indicated
by its specific heat capacity)

• The formula is Q = mc∆t , where:
•Q = quantity of thermal energy (J)
•m = mass of the substance (g)
• c = specific heat capacity of the substance in
(J/g•˚C)
•∆t = change in temperature (oC)

• The specific heat capacity of water is 4.19 J/g•oC
• this means it takes 4.19 J of energy to warm one gram (one milliliter) of
water by one degree Celsius.
• This number is quite high compared to other substances, for
instance:
• aluminium: 0.900 J/g•oC
• copper: 0.380 J/g•oC
• lead: 0.130 J/g•oC
• Which means, compared to these metals, it takes a lot more
energy to make water change temperature
• Or, put another way, water can absorb a lot more energy without
changing temperature

• The „c‟ of other substances can be
determined using a calorimeter
• a calorimeter is a container that is
insulated to avoid heat loss (it can be
made of metal like a Thermos or as simple
as two Styrofoam cups)
• to determine the value of „c‟ for another
substance, it is massed, placed in the
calorimeter, and heated
• by knowing how much heat you used (Q)
and measuring the temperature change
(∆t) you can calculate „c‟

• 50.0g of water at 25.0oC is heated to 50.0oC on a hot plate.
Given that the theoretical specific heat capacity of water is
4.19 J/g•oC, determine the value for Q.
• Solution:
Q = mc∆t
= (50.0g)(4.19 J/g•oC)(50.0 – 25.0oC)
= 5237.5 J
= 5.24 x 10³ J or 5.24 kJ
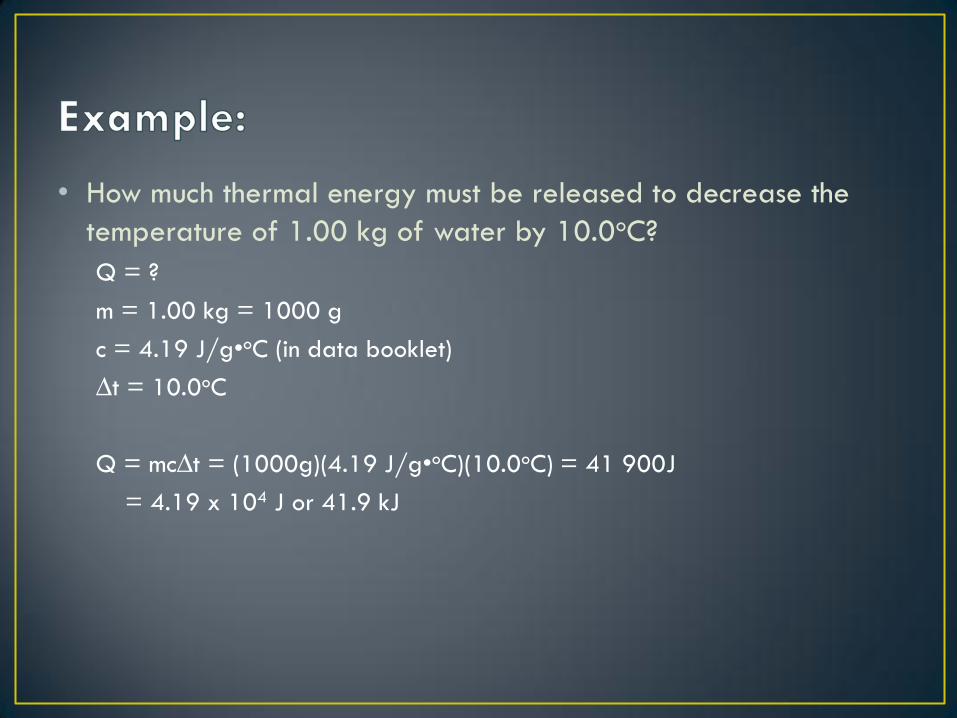
• How much thermal energy must be released to decrease the
temperature of 1.00 kg of water by 10.0oC?
Q = ?
m = 1.00 kg = 1000 g
c = 4.19 J/g•oC (in data booklet)
∆t = 10.0oC
Q = mc∆t = (1000g)(4.19 J/g•oC)(10.0oC) = 41 900J
= 4.19 x 10⁴ J or 41.9 kJ

• 1) a 200g mass of water at 4.00oC is warmed to 22.0oC.
Determine the amount of thermal energy absorbed.
• 2) Determine the quantity of energy required to warm a 1.00-
kg block of ice from – 15oC to 0.0oC. The theoretical specific
heat capacity of ice is 2.00 J/g•oC
• 3) 21.6 J of energy are used to heat a 2.0g piece of iron by
24.0oC. What is the experimental specific heat capacity of
iron?

• 1) a 200g mass of water at 4.00oC is warmed to 22.0oC.
Determine the amount of thermal energy absorbed.
Q = mc∆t
= (200g)(4.19 J/g•oC)(22.0 – 4.00oC)
= 15 084 J
= 1.51 x 10⁴J
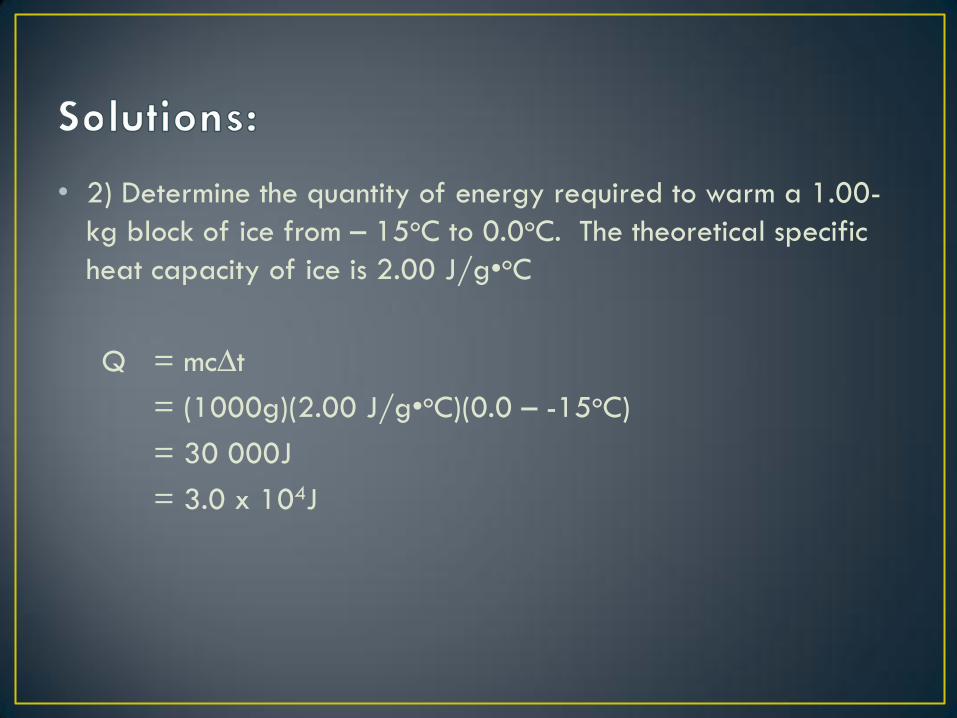
• 2) Determine the quantity of energy required to warm a 1.00-
kg block of ice from – 15oC to 0.0oC. The theoretical specific
heat capacity of ice is 2.00 J/g•oC
Q = mc∆t
= (1000g)(2.00 J/g•oC)(0.0 – -15oC)
= 30 000J
= 3.0 x 10⁴J

• 3) 21.6 J of energy are used to heat a 2.0g piece of iron by 24.0oC.
What is the experimental specific heat capacity of iron?
Q = mc∆t
c = Q/m∆t
= 21.6 J / (2.0g)(24.0oC)
= 0.45 J/g•oC
• This is slightly different than the theoretical specific heat capacity of
iron (0.449 J/g•oC) because of limits in the accuracy of the
experiment

• We‟ve seen how liquid water is able to absorb / release
thermal energy and its effect on climate, but this only describes
part of the hydrologic cycle
• the hydrologic cycle is the movement of water molecules
throughout the biosphere
• besides the movement of liquid water in convection currents, water in the
cycle also changes from solid liquid gas and vice versa

• Using this image as a
guide, identify a
process where water
goes from:
• solid to liquid
• liquid to solid
• liquid to gas
• gas to liquid
• gas to solid

• During a phase change, water changes
state without changing temperature
• this occurs because the thermal energy is
going toward breaking the bonds between
water molecules, rather than making the
water molecules move faster
• Since water molecules undergo many
phase changes in the cycle, a lot of
energy is transferred in the biosphere
without any change in temperature
• this helps to keep average global
temperatures relatively stable

• The heat of fusion of a substance is the amount of energy
absorbed when 1 mol of the substance melts from solid to liquid
without changing temperature
• it is equal to the heat of solidification, which is the amount of heat
released when 1 mol of the substance freezes
• The heat of vaporization of a substance is the amount of
energy absorbed when 1 mol of the substance evaporates from
liquid to gas without changing temperature
• it is equal to the heat of condensation, which is the amount of heat
released when 1 mol of the substance condenses from gas to liquid

Temp change
Phase change
Temp change
Phase change
Temp change

• The amount of energy absorbed or released during a phase change can be calculated from the following two formulas
or
• where
•Hfus = heat of fusion, or Hvap = heat of vaporization, in kJ/mol
•Q = quantity of thermal energy, in kJ
• n = number of moles, in mol

• The theoretical Heat of Fusion
of ice is 6.01 kJ/mol
• that means it takes 6.01 kJ of
thermal energy per mole of ice
that is melting
• The theoretical Heat of
Vaporization of water is
40.65 kJ/mol
• that means it takes 40.65 kJ of
thermal energy per mole of water
that is evaporating

• Calculate the amount of energy absorbed when 10.0 mol of ice
at 0.0oC melts. The theoretical heat of fusion of water is 6.01
kJ/mol
Hfus = Q/n
Q = Hfusn
= (6.01 kJ/mol)(10.0mol)
= 60 kJ

• Recall from the Chemistry unit, you can calculate the number of
moles if the mass and molar mass of the substance is known
• The formula is n = m/M
• m = mass (in g)
• M = molar mass (in g/mol)

• In an experiment, it is found that when 150 g of water
evaporates, 339 kJ of energy is absorbed. (Recall, the molar
mass of water is 18.02 g/mol). Determine the experimental
heat of vaporization of water.
n = m = 150g = 8.32 mol
M 18.02 g/mol
Hvap = Q = 339 kJ = 40.7 kJ/mol
n 8.32 mol

• 1) When 8.70 kJ of thermal energy is added to 2.50 mol of
liquid methanol, it vaporizes. Determine the heat of
vaporization of methanol.
• 2) If the theoretical heat of fusion of ice is 6.01 kJ/mol, how
much thermal energy is required to melt a 100 g ice cube?

• 1) When 8.70 kJ of thermal energy is added to 2.50 mol of
liquid methanol, it vaporizes. Determine the heat of
vaporization of methanol.
Hvap = Q/n
= 8.70 kJ / 2.50 mol
= 3.48 kJ/mol

• 2) If the theoretical heat of fusion of ice is 6.01 kJ/mol, how much thermal energy is required to melt a 100 g ice cube?
n = m/M
= 100g / 18.02 g/mol
= 5.55 mol
Hfus = Q/n
Q = Hfusn
= (6.01 kJ/mol)(5.55 mol)
= 33.4 kJ

D2.4 - Biomes

• a biome is a large geographical region with particular
climactic conditions
• a description of a biome includes
• the typical range of temperature and precipitation
• the plants and animals that are adapted to those conditions

• biomes function as a system – a set of interconnected parts
that may exchange energy and/or matter with the surroundings
• open systems – exchange energy AND matter with the surroundings
• examples – the human body, a home, a fish tank, cells
• closed systems – exchange energy, but not matter with the surroundings
• examples – a sealed Tupperware container, the hydrosphere
• a biome gets input energy from the sun, and loses energy
through heat, or chemical energy to other biomes
• a biome exchanges matter such as air, water, and plants and
animals with other biomes
• because they exchanges both energy and matter with the surroundings,
biomes are considered to be open systems

• Different classification systems exist for biomes – some
textbooks define as many as 20 different biomes
• In this course we classify the Earth according to SIX biomes


• Each biome has a typical range of temperature & precipitation
• They can be plotted on a graph
• deserts are hot and dry
• rain forests are hot and wet
• tundra are cold and dry
dry PRECIPITATION wet
cold
TEM
PER
ATU
RE
hot

• most tundra is found around the
Arctic circle
• the number of hours of daylight
vary greatly and in winter, this
biome receives little to no
isolation
• ice and snow cover most of the
tundra year-round, known as
permafrost
• this means the region has high albedo
and therefore reflects most radiation
back into space

• because of a lack sun, the tundra is characterized by the coldest and driest conditions of any biome
• plants
• short life cycle (to reproduce during short summer)
• small and lie close to ground
• animals
• feed mostly on fish
• protect themselves by burrowing underground or with thick coats and squat bodies
dry PRECIPITATION wet
cold
TEM
PER
ATU
RE
hot

• typically found just south of
the tundra
• also called boreal forest, due
to the abundance of conifer
(evergreen) trees
• taiga‟s conditions are similar
but less extreme than tundra
• longer growing season
• slightly warmer and wetter

• plants
• most have needles to make them resistant to drought and freezing during long winters
• “evergreen” means they can do photosynthesis year-round
• animals
• tend to be inactive during winter (burrow or hibernate)
• may have colour-changing coats for camouflage
• birds tend to migrate south for winter
dry PRECIPITATION wet
cold
TEM
PERA
TU
RE
h
ot

• distinguished by trees that lose their leaves in the fall
• found on N and S America, Asia, Europe and Australia
• more moderate climate and longer growing season than taiga
• due to a variation in insolation, this biome has very distinct winter and summer seasons
• rich mixture of plants and animals are supported by this type of forest

• roughly the same
precipitation as taiga but with
warmer temperatures
• plants
• broad-leaved trees
• forests have lots of undergrowth
• animals
• most are active year round, but
tend to reproduce in spring and
summer
dry PRECIPITATION wet
cold
TEM
PER
ATU
RE
hot

• grasslands occur on all continents and may have different
names such as prairie or savanna
• characterized by grasses and few trees
• temperature range can vary greatly depending on the
continent, however it always receives little precipitation

• plants
• drought-tolerant with extensive
root systems
• animals
• tend to be grazers, and able to
travel long distances dry PRECIPITATION wet
cold
TEM
PER
ATU
RE
hot

• the warmest and wettest biome, also
characterized by the richest variety of
plants and animals
• plants grow year-round
• amount of shade varies at different levels of
the forest

• plants
• maximize their access to sunlight
• grow tall, high
• leaves are broad and dark
green
• animals
• active year-round
• adapted to a particular part /
level of the rain forest
• ground
• mid-tree level
• treetops
dry PRECIPITATION wet
cold
TEM
PER
ATU
RE
hot

• like tundra, the dry conditions
mean little plant life
• unlike tundra, deserts receive
high insolation and are
marked by hot temperatures
during the day
• since there is a lack of water and
plant life to hold the day‟s heat,
deserts tend to be quite cold at
night
dry PRECIPITATION wet
cold
TEM
PER
ATU
RE
hot

• plants
• cacti are adapted to retain water
and minimize transpiration
• animals
• require very little water
• tend to be more active at night
• one concern about climate
change is the growth of the
desert biome as other biomes
become hotter and drier

• Climatographs are summary graphs that describe the average temperature and precipitation each month for a given region
• the horizontal axis is divided by month
• average precipitation is marked along the left vertical axis and is represented by bars on the graph
• average temperatures are marked along the right vertical axis and are represented by a line graph

• climatographs are most useful when they are used to compare
the climate of two different areas
• they can also help identify the factors that determine the
climate, such as
• insolation – mostly due to the latitude of the region
• patterns of global winds
• patterns of warm and cold ocean‟s currents
• you can also use climatographs to predict the biome of the
region

• Grasslands vary in
plants and animals
and are located
all over the world
• What general
trends do you
notice in these
grassland
climatographs?

• Below are five climatographs that represent five Canadian
cities.
• 1) Match each climatograph with the biome it represents
• 2) Which biome is not represented?
• 3) Match the biome with its city. The five cities are:
• Ottawa, ON
• Grande Prairie, AB
• Whitehorse, YT
• Nanaimo, BC
• Calgary, AB

-25.0
-15.0
-5.0
5.0
15.0
25.0
0
50
100
150
200
250
Ja
n
Feb
Ma
r
Apr
Ma
y
Ju
ne
Ju
ly
Aug
Sep
t
Oct
Nov
Dec
Tem
pe
ratu
re (
C
)
Pre
cip
itat
ion
(m
m)
City A
Precipitation (mm) Temperature (°C)
-25.0
-15.0
-5.0
5.0
15.0
25.0
0
50
100
150
200
250
Ja
n
Feb
Ma
r
Apr
Ma
y
Ju
ne
Ju
ly
Aug
Sep
t
Oct
No
v
De
c
Tem
per
atu
re (
°C)
Pre
cip
itat
ion
(m
m)
City B
-25.0
-15.0
-5.0
5.0
15.0
25.0
0
50
100
150
200
250
Ja
n
Fe
b
Ma
r
Apr
Ma
y
Ju
ne
Ju
ly
Aug
Sep
t
Oct
Nov
Dec
Te
mp
era
ture
(°C
)
Pre
cip
itat
ion
(m
m)
City C
-25.0
-15.0
-5.0
5.0
15.0
25.0
0
50
100
150
200
250
Ja
n
Feb
Ma
r
Apr
Ma
y
Ju
ne
Ju
ly
Aug
Sep
t
Oct
Nov
Dec
Tem
per
atu
re (
°C)
Pre
cip
itat
ion
(m
m)
City D
-25.0
-15.0
-5.0
5.0
15.0
25.0
0
50
100
150
200
250
Ja
n
Feb
Ma
r
Apr
Ma
y
Ju
ne
Ju
ly
Aug
Sep
t
Oct
No
v
De
c
Tem
per
atu
re (
°C)
Pre
cip
itat
ion
(m
m)
City E

-25.0
-15.0
-5.0
5.0
15.0
25.0
0
50
100
150
200
250
Jan Feb Mar Apr May June July Aug Sept Oct Nov Dec
Tem
pe
ratu
re (
C
)
Pre
cip
itat
ion
(m
m)
City A
Precipitation (mm) Temperature (°C)
City A represents the grassland biome
CALGARY, AB

-25.0
-15.0
-5.0
5.0
15.0
25.0
0
50
100
150
200
250
Jan Feb Mar Apr May June July Aug Sept Oct Nov Dec
Tem
per
atu
re (
°C)
Pre
cip
itat
ion
(m
m)
City B
Precipitation (mm) Temperature (°C)
City B represents the taiga biome
GRANDE PRAIRIE, AB

-25.0
-15.0
-5.0
5.0
15.0
25.0
0
50
100
150
200
250
Jan Feb Mar Apr May June July Aug Sept Oct Nov Dec
Tem
per
atu
re (
°C)
Pre
cip
itat
ion
(m
m)
City C
Precipitation (mm) Temperature (°C)
City C represents the tundra biome
WHITEHORSE, YT

-25.0
-15.0
-5.0
5.0
15.0
25.0
0
50
100
150
200
250
Jan Feb Mar Apr May June July Aug Sept Oct Nov Dec
Tem
per
atu
re (
°C)
Pre
cip
itat
ion
(m
m)
City D
Precipitation (mm) Temperature (°C)
City D represents the (temperate) rainforest biome
NANAIMO, BC

-25.0
-15.0
-5.0
5.0
15.0
25.0
0
50
100
150
200
250
Jan Feb Mar Apr May June July Aug Sept Oct Nov Dec
Tem
per
atu
re (
°C)
Pre
cip
itat
ion
(m
m)
City E
Precipitation (mm) Temperature (°C)
City E represents the deciduous forest biome
OTTAWA, ON The biome not represented is the desert biome.

D3 – Climate Change

• Recall, water vapour is the most abundant naturally-occuring
greenhouse gas
• Other greenhouse gases also play a role, and are produced by
human activity, such as industry and agriculture
• You can compare the effect of a specific greenhouse gas based
on two factors:
• persistence reflects the number of years the gas remains in the
atmosphere
• the Global Warming Potential (GWP) of a gas represents its ability to
trap thermal energy in the atmosphere
Gas GWP Persistence (years)
carbon dioxide (CO2) 1 50-200
methane (CH4) 23 10
nitrous oxide (N2O) 296 120

• although water vapour plays the largest role in the greenhouse
effect, it is naturally kept in balance by the hydrologic cycle
• the greenhouse gases that we‟re most concerned about,
therefore, are the gases that aren‟t kept in balance, especially
carbon dioxide

• Evidence of increasing
atmospheric CO2, N2O, and CH4
comes from a combination of ice
core samples and atmospheric
measurements by weather
balloons

CARBON SINKS
• Any process that removes
carbon dioxide from the
atmosphere
• The most significant carbon
sink is photosynthesis
• Other carbon sinks include:
• dissolving of CO2 in the ocean
• carbon sequestration initiatives
CARBON SOURCES
• Any process that releases carbon dioxide into the atmosphere
• The most significant carbon source is fossil fuel production and combustion
• Other carbon sources include:
• cellular respiration
• weathering of rock
• decomposition of living organisms

• Agriculture contributes to the greenhouse effect because
• manure and fertilizers release nitrous oxide
• livestock contribute methane
• Halocarbons are man-made chemicals used in coolants
• though their chemical structure makes them ideal for use in fridges and air
conditioners, their ability to absorb thermal energy also makes them
powerful greenhouse gases
• one category of halocarbons, called CFCs, have a GWP of 12 000
(recall, this is 12 000x more than CO2)
• fortunately, CFCs have been banned worldwide since the 1980s, when it
was discovered that they break down the ozone layer

• The line at 0.0 represents the global average temperature
between 1951 and 1980
• From the graph, we can conclude that:
• global temperatures are at a 100 year-high
• the start of this change in temperature coincides with the Industrial Revolution

• The Montreal Protocol was an
international agreement signed in
1987 by 182 nations
• agreement was made to replace CFCs with
less harmful chemicals in products such as
refrigerators and air conditioners
• CFCs had been found to cause a significant
loss in ozone in the stratosphere
• this agreement was the first international
agreement concerning an environmental
issue
Top: The ozone layer in 2008.
Bottom: The ozone layer in
2008 had the Montreal
Protocol not been signed.

• United Nations Framework Convention on
Climate Change was an agreement to stabilize
greenhouse gas emissions caused by human
activity
• the UNFCCC was not an action plan – it set out a process
for future actions on climate change, specifically that
future plans
• could not threaten global food production
• could not jeopardize the economic interests of any
nation
• must support sustainable development (the meeting
of today‟s needs without jeopardizing future
generations‟ ability to meet their needs)

• Kyoto Protocol
• in 1998, 161 countries signed an agreement to reduce the production of
greenhouse gases
• the countries agreed to reduce their emissions to 5% lower than they were
in 1990, by 2012
• countries could also earn “credits” toward their reduction by
• helping other countries lower their emissions
• contributing to a carbon sink (e.g. planting trees)

• pledging to reduce its emissions below 1990 levels meant that at the time of signing, Canada had to reduce its CO2 by 6%
• however, since we didn‟t make any significant changes to our industry practices, the target levels became further and further to meet
• in 2010, Canada became the first nation to publicly quit the agreement

• As a result of climate change, ecologists
predict that we will see a change to the
distribution of biomes in Canada
• these maps illustrate the predicted
changes:
• the appearance of desert in southern Alberta
• the reduction of tundra and taiga biomes
• the redistribution of grassland from southern
Alberta to Saskatchewan and Manitoba

• With the reduction of permafrost and snow cover, we will also
see a significant reduction in albedo
• as open water reflects less radiation than ice, global warming is expected
to accelerate

• Some of the predicted consequences of global warming that
will directly affect our province are:
• an increase in the frequency and severity of droughts, which could mean a
loss or change in crops
• an increase in insect populations
• an increased risk of forest fires
• a loss of species biodiversity
• an increase in diseases associated with warmer climates, such as Lyme
disease

• suggest two methods of reducing greenhouse gases in each economic sector below
• then, refer to page 429 of your textbook to fill in any actions you missed
Sector Actions
Transportation •
•
Energy •
•
Buildings /
infrastructure
•
•
Agriculture &
Forestry
•
•
Industry •
•

• With a partner, brainstorm
• five steps the AVERAGE Canadian could take to reduce their carbon footprint
•
•
•
•
•
• five steps that you YOURSELF could take to reduce your carbon footprint
•
•
•
•
•