energy storage study 2014 - california energy commission · 28.10.2014 · thereafter dispatching...
TRANSCRIPT

TURLOCK IRRIGATION DISTRICT
Energy Storage Study 2014
Willie G. Manuel
9/17/2014

1 of 28 Energy Storage Study 2014 (Final).docx
Contents1. Executive Summary .............................................................................................................................. 2
2. Introduction.......................................................................................................................................... 3
3. Technology............................................................................................................................................ 4
3.1. Electrochemical ............................................................................................................................ 5
3.1.1. Lithium Ion Battery............................................................................................................... 5
3.1.2. Sodium Sulfur Battery .......................................................................................................... 6
3.1.3. Flow Battery ......................................................................................................................... 6
3.2. Flywheel........................................................................................................................................ 7
3.3. Compressed Air ............................................................................................................................ 8
3.4. Thermal......................................................................................................................................... 9
3.4.1. Ice Thermal ........................................................................................................................... 9
3.4.2. Solar Thermal........................................................................................................................ 9
3.5. Pumped Hydro............................................................................................................................10
4. Storage Applications ..........................................................................................................................11
4.1. Time-of-Day Arbitrage................................................................................................................11
4.2. Peak Capacity .............................................................................................................................11
4.3. Ancillary Service .........................................................................................................................12
4.4. Load Following and Renewable Integration..............................................................................12
4.5. Voltage Support..........................................................................................................................12
4.6. Black Start...................................................................................................................................12
4.7. Transmission and Distribution Upgrade Deferral .....................................................................13
5. Analysis ...............................................................................................................................................13
5.1. Lithium-Ion Battery (without Regulation Reserve Sales)..........................................................14
5.2. Lithium-Ion Battery (with Regulation Reserve Sales) ...............................................................17
5.3. Flywheel......................................................................................................................................20
5.4. Thermal Storage .........................................................................................................................23
5.5. Transmission and Distribution Upgrade Deferral .....................................................................26
6. Recommendation ...............................................................................................................................28

2 of 28 Energy Storage Study 2014 (Final).docx
1. Executive Summary
Assembly Bill 2514 (“AB2514”) requires publicly-owned utilities such as Turlock Irrigation
District (“TID”) to determine if it is appropriate to establish targets for the procurement of
viable and cost-effective energy storage systems by December 31, 2016, and December 31,
2021. Such determination must be made by October 1, 2014 and reevaluated every three
years thereafter. In compliance with AB2514 the TID Board of Directors (“TID Board”)
through Resolution 2012-10 directed staff to review available energy storage systems and
recommend to the TID Board, if appropriate, energy storage procurement targets.
There are a number of energy storage technologies that are currently commercially
available and several other technologies under development. Each technology has differing
cost and operating characteristics. Energy storage systems can be utilized in various ways
such as absorbing energy during the low price periods for use during the high price periods,
to reduce the need for generation, transmission, and distribution capacity during the peak
load periods, provide ancillary services, and integrate intermittent renewable generation.
As directed by the TID Board staff conducted a review of available energy storage systems
which consisted of reviewing reports and publications by others regarding energy storage
systems, reports by others regarding their recommended energy storage procurement
targets, and modelling of several commercially available energy storage systems. The
results of the staff study concluded that energy storage systems are currently not cost-
effective and in most cases increased TID cost by millions each year. Furthermore, except
for pumped storage systems, there is limited operational history on utility scale storage
systems. Hence there is limited data on performance degradation, operation and
maintenance expense, and the life of storage systems in utility applications. Given the
results of the staff study, staff recommends that the Board make a determination that it is
not appropriate to adopt energy storage procurement targets at this time. Even though
staff is recommending no targets be set, staff believes that energy storage systems will
become cost effective and will be an integral part of a utility’s portfolio in the future and
plans to continually evaluate storage systems periodically.

3 of 28 Energy Storage Study 2014 (Final).docx
2. Introduction
On September 29, 2010 the Governor of California signed into law AB2514 which among
other things require publicly-owned utilities such as TID to do the following:
On or before March 1, 2012, initiate a process to determine appropriate targets, if
any, for the utility to procure viable and cost-effective energy storage systems to be
achieved by December 31, 2016, and December 31, 2021.
If determined to be appropriate, adopt the procurement targets by October 1, 2014.
Reevaluate the determinations made not less than once every three years.
Report to the Energy Commission regarding the energy storage system procurement
targets and policies adopted and any modifications made to those targets as a result
of subsequent reevaluations.
In compliance with the above described requirements, the TID Board through Resolution
2012-10 directed staff to review available energy storage systems and recommend to the
TID Board, if appropriate, energy storage procurement targets to be achieved by December
31, 2016, and December 31, 2021.
AB2514 defines energy storage systems (“Energy Storage”) as commercially available
technology that is capable of absorbing energy, storing it for a period of time, and
thereafter dispatching the energy. Energy Storage must be cost effective and either reduce
emissions of greenhouse gases, reduce demand for peak electrical generation, defer or
substitute for an investment in generation, transmission, or distribution assets, or improve
the reliable operation of the electrical transmission or distribution grid. Furthermore,
Energy Storage must do one or more of the following:
Use mechanical, chemical, or thermal processes to store energy that was generated
at one time for use at a later time.
Store thermal energy for direct use for heating or cooling at a later time in a manner
that avoids the need to use electricity at that later time.
Use mechanical, chemical, or thermal processes to store energy generated from
renewable resources for use at a later time.
Use mechanical, chemical, or thermal processes to store energy generated from
mechanical processes that would otherwise be wasted for delivery at a later time.
The Energy Storage may be centralized or distributed, owned by TID, by a customer of TID,
by a third party, or jointly owned.

4 of 28 Energy Storage Study 2014 (Final).docx
This report summarizes the evaluation done by TID staff to support staff’s recommendation
to the TID Board regarding the adoption of energy storage procurement targets.
3. Technology
There are a number of storage technologies that are currently commercially available and
several other technologies under development. Each technology has differing cost and
operating characteristics. For example, certain types of technology can provide a high
output quickly but cannot provide energy for a long duration (see Figure 1 below). Hence,
the appropriate storage technology would depend upon the intended use.
Figure 1 Energy Storage Technology Performance Matrix (Source: DOE/EPRI 2013Electricity Storage Handbook - July 2013)
In this report we have grouped the different types of commercially available storage
technologies for utility applications into the following: 1) Electrochemical, 2) Flywheel, 3)
Thermal, 4) Compressed Air, and 5) Pumped Hydro.

5 of 28 Energy Storage Study 2014 (Final).docx
3.1. Electrochemical
Below is a description of three types of commercially available battery
technologies suitable for utility applications. Although there are other types of
batteries for utility applications being develop (e.g. advanced lead-acid, sodium
metal halide, and metal air) they are currently not commercially available and
therefore not discussed herein.
3.1.1. Lithium Ion Battery
Lithium ion batteries (“Li-on”) rely on the transfer of lithium ions
between electrodes to charge and discharge and are currently used in
numerous applications in the personal electronics and automobile
industry. Compared to other battery storage technologies, they are
usually smaller in size for the same amount of capacity and energy (i.e.
they have relatively higher energy and power density) and have lower
operating and maintenance costs. Li-on batteries typically have a life of
15-20 years and round trip efficiencies of about 83%. This battery
technology is currently the fastest growing segment for stationary
storage applications. They have been deployed in a wide range of utility
energy-storage applications, ranging from a few kilowatt-hours in
residential systems with rooftop photovoltaic arrays to multi-megawatt
containerized batteries for the provision of grid ancillary services.
Currently there are roughly 83 MW of Li-on based storage systems in
operation in the United States.
Figure 2 Li-ion Battery Diagram (Source: DOE/EPRI 2013 Electricity
Storage Handbook - July 2013)

6 of 28 Energy Storage Study 2014 (Final).docx
3.1.2. Sodium Sulfur Battery
Sodium sulfur batteries (“NAS”) use electrochemical reactions between
sodium and molten sulfur to charge and discharge. They operate at fairly
high temperature of about 300-350o C, are highly corrosive, have low
power-to-energy ratios, life of 15 years, and round trip efficiencies of
about 75%. There are currently 12 MW of NAS batteries that have been
installed by U.S. utilities with about another 9 MW in-progress. Globally,
there is 316 MW of NAS installed to date.
Figure 3 Sodium Sulfur Battery Diagram (Source: DOE/EPRI 2013
Electricity Storage Handbook - July 2013)
3.1.3. Flow Battery
Flow batteries use a liquid electrolyte and an electrochemical cell to
store/generate electricity. The liquid electrolyte is stored externally and
pumped through the cell. This allows the energy capacity of the battery
to be increased at a moderate cost making them suitable for long
duration applications. These types of batteries are expected to last about
15 years and have round trip efficiencies of 70-80%. Relative to
integrated battery technologies such as the Li-on and NAS, flow batteries
tend to have a larger footprint due to the need for flow system
components. Historically, flow batteries can experience irreversible
capacity loss over time and thus have not been widely used. However,
recent electrolyte formulations seemed to have minimized the capacity
loss and allowed the use of lower cost separator materials. While there
are several different flow batteries, the vanadium redox system is the

7 of 28 Energy Storage Study 2014 (Final).docx
more mature type of flow battery. In the United States, there is a total of
1 MW of flow battery based storage systems operational. Recently,
EnerVault’s 0.25 MW/1 MWh iron-chromium flow batteries went online
in Turlock.
3.2. Flywheel
A flywheel is a rotating mechanical device used to store rotational energy that
can be called up instantaneously. At the most basic level, a flywheel contains a
spinning mass in its center driven by a motor and when energy is needed, the
spinning force drives a device similar to a turbine to produce electricity, slowing
the rate of rotation. A flywheel is recharged by using the motor to increase its
rotational speed once again. Some of the key advantages of flywheel energy
storage are low maintenance, long life (some flywheels are capable of well over
100,000 full depth of discharge cycles and the newest configurations are capable
of greater than 175,000 full depth of discharge cycles), and negligible
environmental impact. They have high energy density and substantial durability
which allows them to be cycled frequently with no impact to performance. They
also have very fast response and ramp rates. They generally can respond to
regulation signals in milliseconds and can go from full discharge to full charge
within a few seconds or less. Round trip efficiencies are between 70-80%.
Flywheel energy storage systems (FESS) are well suited for high power, relatively
low energy applications such as power quality maintenance and frequency
Figure 4 Vanadium Redox Battery Diagram (Source:DOE/EPRI 2013 Electricity Storage Handbook - July2013)

8 of 28 Energy Storage Study 2014 (Final).docx
response. There are two flywheel installations operating in the United States for
a combined total of 32 MW.
3.3. Compressed Air
Compressed air energy storage
(“CAES”) has been used since
the 1870’s. However, the first
utility scale deployment came
online in the 1970’s. CAES
stores energy by compressing
and storing ambient air under
pressure (typically at 1,015 psia)
in an underground cavern or
above ground pressure vessels
or pipes. To generate
electricity, the pressurized air is
heated and expanded in a
turbine that drives a generator.
There are currently only two operating utility sized CAES plants, the 321 MW
plant in Huntorf, Germany (operating since December 1978) and the 110 MW
plant in McIntosh, Alabama (with 18 years of operating history). These systems
typically have round trip efficiencies of 42-55%. Future improvements in the
heat recovery systems of CAES plants are expected to increase efficiency up to
Figure 6 Compressed Air Energy StoragePlant (Source: DOE/EPRI 2013 ElectricityStorage Handbook - July 2013)
Figure 5 Flywheel System Diagram(Source: DOE/EPRI 2013 ElectricityStorage Handbook - July 2013)

9 of 28 Energy Storage Study 2014 (Final).docx
70%. Salt caverns in deep salt formations have traditionally been used. The use
of natural aquifers and depleted natural gas fields are currently being studied.
3.4. Thermal
3.4.1. Ice Thermal
Ice storage supplements existing HVAC systems by creating ice during the
off-peak periods which is then used during the on-peak periods to reduce
the cooling load of the HVAC system. The City of Redding and several
Southern California Public Power Agency member utilities have deployed
ice storage technologies. There are currently 36 MW of ice storage
systems online in the United States. These systems are designed to last
20-25 years.
Figure 7 Ice Bear Distributed Energy Storage (Source: Ice Energy)
3.4.2. Solar Thermal
Solar thermal power plants store energy by heating a medium (typically
oil or molten salt) to store thermal energy and later using such medium
to generate steam that drives a turbine to produce electricity. In 2013
the 280 MW Solana Generation Station in Arizona came online. The
project consists of a concentrated solar plant using parabolic trough
coupled with six hours of storage capacity using molten salt. The 150
MW Rice Solar Energy Project to be located in Riverside County, CA also

10 of 28 Energy Storage Study 2014 (Final).docx
will consist of a concetrated solar plant coupled with molten salt thermal
storage. The project is expected to be online in 2016.
Figure 8 Schematic diagram of concentrated solar thermal power plantwith thermal storage (Source: Renewable Energy World 06/2003)
3.5. Pumped Hydro
Pumped hydro is one of the most established energy storage technologies and
has been used since the 1920s. Energy storage is achieved by pumping water
uphill (typically during the off-peak low energy cost periods) to an upper
reservoir. When energy is needed the water pumped uphill is released and
allowed to flow downhill through a hydro turbine. Pumped storage power plants
are unlike traditional hydroelectric power plants in that they are a net consumer
of electricity, due to hydraulic and electrical losses incurred in the cycle of
pumping from lower to upper reservoirs. These plants typically have round-trip
efficiencies of 76-85%.

11 of 28 Energy Storage Study 2014 (Final).docx
4. Storage Applications
Storage systems can be used in the electric system in various ways. In certain cases a storage
system performs several services (referred to as “Stacking”). For example, a storage system can
provide peak capacity during certain hours of the year and provide regulation in other hours.
Several storage applications are described below:
4.1. Time-of-Day Arbitrage
In this application, the storage device is charged during periods when electricity
prices are lower (generally during the off-peak periods) and discharged during
periods when electricity prices are higher (generally during the on-peak periods).
This application also allows for efficient operations of baseload generation
resources. Often baseload generation has to be operated at less efficient output
levels during the off-peak periods. Installing a storage system may allow a
baseload generation to generate at a higher output (more efficient) level during
the off-peak periods resulting in fuel cost savings.
4.2. Peak Capacity
A storage system can be used to serve peak load and thus reducing the need for
capacity from traditional generating resources. In this application, the storage
system is charged in low load periods and discharged during the high load
periods. This is somewhat similar to the previous application since generally low
Figure 9 Typical Pumped Storage Plant (Source: DOE/EPRI2013 Electricity Storage Handbook - July 2013)

12 of 28 Energy Storage Study 2014 (Final).docx
electricity prices occur during the low load (off-peak) periods and high electricity
prices occur during the high load (on-peak) periods. This application also allows
for efficient operations of baseload generation.
4.3. Ancillary Service
Western Electricity Coordinating Council (“WECC”) regulations require us to
maintain minimum operating reserves that consist of regulating, spinning, and
non-spinning reserves. Storage systems could be used to provide regulation,
spinning, and non-spinning reserves and therefore freeing up capacity on
existing generating resources for other uses such as power sales or reducing the
need for additional generating capacity.
4.4. Load Following and Renewable Integration
In order to balance supply and demand, generator output is constantly varied to
match demand. At TID, generally the output of Don Pedro or Walnut Energy
Center (“WEC”) is varied up or down in order to balance the system. The
constant movement of output puts additional wear and tear on the power plants
particularly thermal units such as WEC. Storage systems can be used to assist in
balancing system supply and demand.
The presence of intermittent resources (such as wind or solar) in a system
presents additional challenges to balance supply and demand in an electric
system. Storage systems can be located at or near intermittent resources to
smooth the output from the intermittent resource prior to it entering the
electric system thereby reducing system imbalance.
4.5. Voltage Support
Storage systems could be used to assist in maintaining the electric grid’s voltage
in lieu of traditional tools such as generators, capacitors, and voltage regulators.
4.6. Black Start
During catastrophic grid failures, a storage system can be used to energize the
grid and provide station power so power plants can be brought back on-line. In
this application, the storage system is charged and remains charged until a grid
failure occurs.

13 of 28 Energy Storage Study 2014 (Final).docx
4.7. Transmission and Distribution Upgrade Deferral
Transmission and distribution (“T&D”) facilities generally do not operate close to
their capacity. In most cases the load on a T&D facility only approach capacity
limits a few hours a year. Rather than increasing the capacity of the T&D facility
that is reaching its limits, a storage device could be used to serve a portion of the
load during the few peak hours in a year thereby delaying and possibly avoiding
T&D upgrades. Hence, installing a storage system allows the T&D capacity to be
optimized and could extend the life of the T&D facilities since the facility is not
subjected to higher loading. Storage systems could also be designed to be
mobile and therefore could be move around an electric utility system where it is
needed. For example, a storage system could be installed to defer upgrades to a
substation. Once that substation is eventually upgraded the storage system
could then be moved to another substation.
5. Analysis
AB2514 also required the California Public Utilities Commission (“CPUC”) to initiate a
process to determine appropriate energy storage procurement targets for load serving
entities under their jurisdiction. On December 16, 2010 the CPUC opened Rulemaking 10-
12-007 to initiate a proceeding (“CPUC Storage Proceeding”) to comply with the
requirements of AB2514. The CPUC Storage Proceeding involved several stakeholders
including the three California investor-owned utilities, other California load-serving entities,
storage vendors, and several consumer advocacy groups. The CPUC Storage Proceeding
identified several applications for energy storage in an electric utility system. Several of the
applications identified were modelled by the Electric Power Research Institute (“EPRI”) and
DNV Kema to evaluate the cost effectiveness of energy storage in such applications (“CPUC
Analysis”). Staff has reviewed the reports on the CPUC Analysis, several documents related
to the CPUC Storage Proceeding, the Department of Energy/EPRI Energy Storage Handbook
and database, and numerous other energy storage related reports/studies to guide the
evaluations done herein.
To determine whether an electric storage system will benefit TID, several types of
commercially available electric storage systems were added to TID’s resource portfolio to
determine their effect on TID’s operating cost. The storage technologies modelled in this
study were a 30 MW and 50 MW lithium-ion batteries both with 2 hour durations, a 30 MW
flywheel with 0.25 hour duration, and a 6 MW thermal storage system with a 6 hour
duration. The lithium ion battery was selected for modelling since it is the more commonly
used battery type for utility applications in the United States relative to the other types of
14 of 28 Energy Storage Study 2014 (Final).docx
electrochemical storage devices. Flywheels and thermal storage have seen some interest
from other utilities and were analyzed in this study as well. Compressed air storage was not
modelled in this study since there have been limited installations to date (only two projects
are operating in the United States). Pumped Hydro was also not modelled in this study
since TID has some recent analysis on the proposed Red Mountain Bar project.
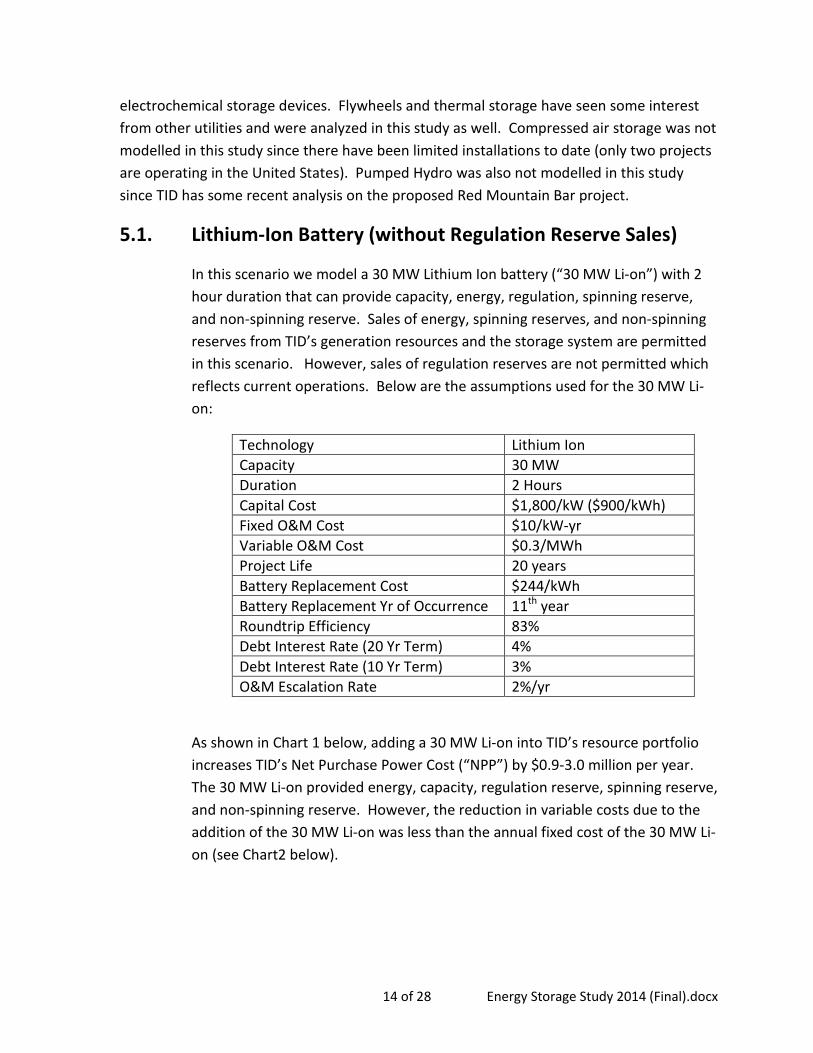
5.1. Lithium-Ion Battery (without Regulation Reserve Sales)
In this scenario we model a 30 MW Lithium Ion battery (“30 MW Li-on”) with 2
hour duration that can provide capacity, energy, regulation, spinning reserve,
and non-spinning reserve. Sales of energy, spinning reserves, and non-spinning
reserves from TID’s generation resources and the storage system are permitted
in this scenario. However, sales of regulation reserves are not permitted which
reflects current operations. Below are the assumptions used for the 30 MW Li-
on:
Technology Lithium Ion
Capacity 30 MW
Duration 2 Hours
Capital Cost $1,800/kW ($900/kWh)
Fixed O&M Cost $10/kW-yr
Variable O&M Cost $0.3/MWh
Project Life 20 years
Battery Replacement Cost $244/kWh
Battery Replacement Yr of Occurrence 11th year
Roundtrip Efficiency 83%
Debt Interest Rate (20 Yr Term) 4%
Debt Interest Rate (10 Yr Term) 3%
O&M Escalation Rate 2%/yr
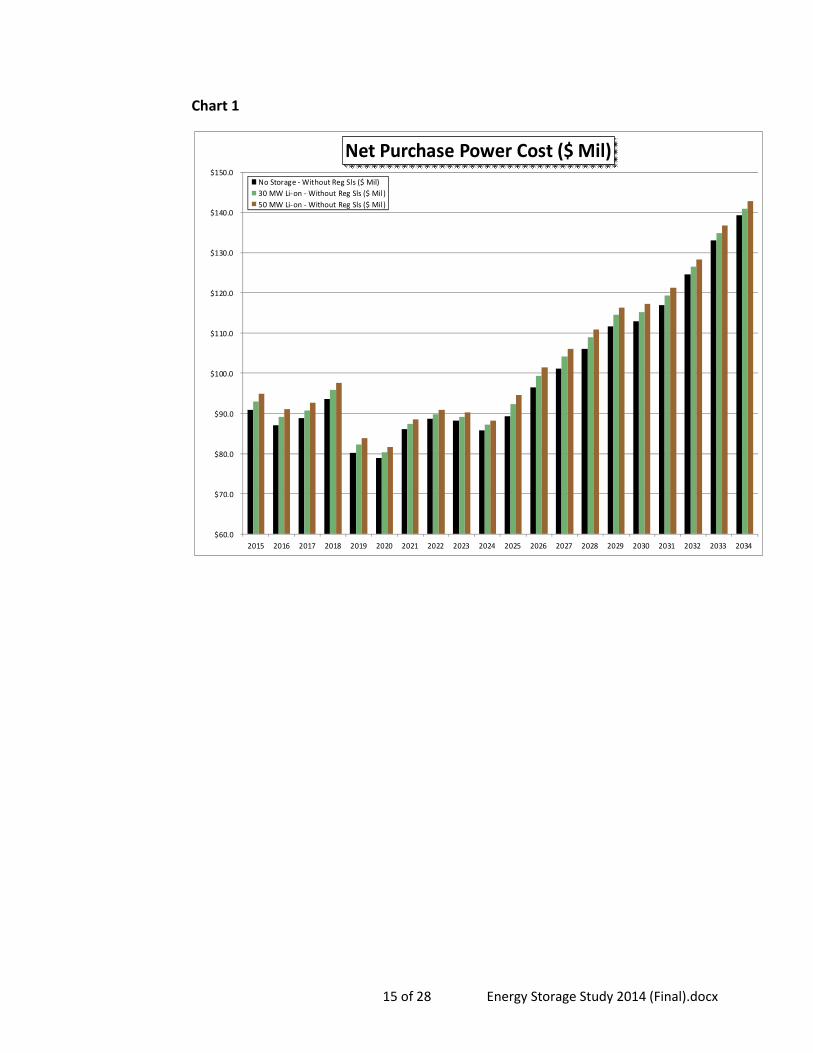
As shown in Chart 1 below, adding a 30 MW Li-on into TID’s resource portfolio
increases TID’s Net Purchase Power Cost (“NPP”) by $0.9-3.0 million per year.
The 30 MW Li-on provided energy, capacity, regulation reserve, spinning reserve,
and non-spinning reserve. However, the reduction in variable costs due to the
addition of the 30 MW Li-on was less than the annual fixed cost of the 30 MW Li-
on (see Chart2 below).
15 of 28 Energy Storage Study 2014 (Final).docx
Chart 1
$60.0
$70.0
$80.0
$90.0
$100.0
$110.0
$120.0
$130.0
$140.0
$150.0
2015 2016 2017 2018 2019 2020 2021 2022 2023 2024 2025 2026 2027 2028 2029 2030 2031 2032 2033 2034
Net Purchase Power Cost ($ Mil)
No Storage - Without Reg Sls ($ Mil)
30 MW Li-on - Without Reg Sls ($ Mil)
50 MW Li-on - Without Reg Sls ($ Mil)

16 of 28 Energy Storage Study 2014 (Final).docx
Chart 2
$-
$2.0
$4.0
$6.0
$8.0
$10.0
$12.0
2015 2016 2017 2018 2019 2020 2021 2022 2023 2024 2025 2026 2027 2028 2029 2030 2031 2032 2033 2034
Net Purchase Power Cost Savings vs. 30 MW Li-on Battery Cost
Net Pur Pwr Cost Reduction 30 MW Li-on - Without Reg Sls ($ Mil)
30 MW Li-on Fixed Cost ($ Mil)
Staff also ran a sensitivity case using a 50 MW Lithium Ion battery (“50 MW Li-
on”) with 2 hour duration. Below are the assumptions used for the 50 MW Li-on:
Technology Lithium Ion
Capacity 50 MW
Duration 2 Hours
Capital Cost $1,800/kW ($900/kWh)
Fixed O&M Cost $10/kW-yr
Variable O&M Cost $0.3/MWh
Project Life 20 years
Battery Replacement Cost $244/kWh
Battery Replacement Yr of Occurrence 11th year
Roundtrip Efficiency 83%
Debt Interest Rate (20 Yr Term) 4%
Debt Interest Rate (10 Yr Term) 3%
O&M Escalation Rate 2%/yr

17 of 28 Energy Storage Study 2014 (Final).docx
Adding the 50 MW Li-on into TID’s resource portfolio increased TID’s NPP by
$2.0-5.2 million per year (see Chart 1 above) again due to the fact that the
savings in TID’S NPP is less than the annual fixed cost of the storage system (see
Chart 3 below).
Chart 3
$-
$2.0
$4.0
$6.0
$8.0
$10.0
$12.0
2015 2016 2017 2018 2019 2020 2021 2022 2023 2024 2025 2026 2027 2028 2029 2030 2031 2032 2033 2034
Net Purchase Power Cost Savings vs. 50 MW Li-on Battery Cost
Net Pur Pwr Cost Reduction 50 MW Li-on - Without Reg Sls ($ Mil)
50 MW Li-on Fixed Cost ($ Mil)
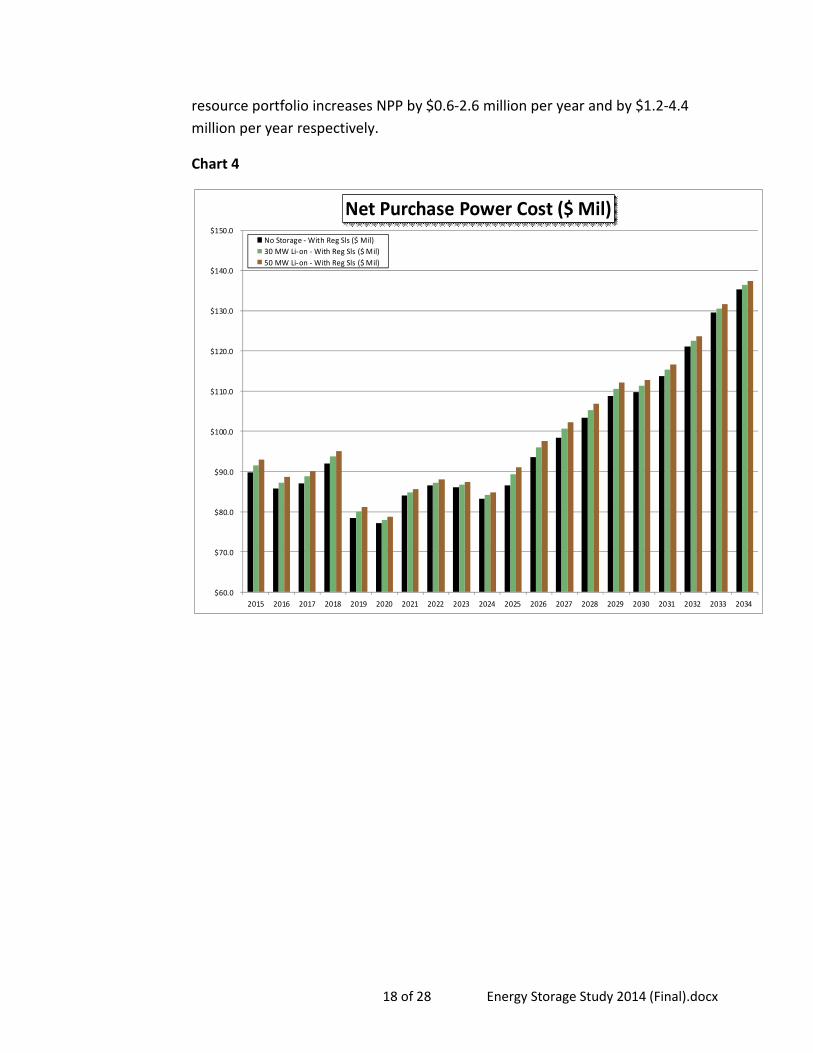
5.2. Lithium-Ion Battery (with Regulation Reserve Sales)
Regulation reserve prices have historically been higher than spinning and non-
spinning reserves prices. Since Li-on storage systems are capable of providing
regulation, we ran the same scenarios and using the same assumptions
discussed in Section 5.1 above except that the new scenarios allowed regulation
reserve sales.
As can be seen from Chart 4, Chart 5, and Chart 6 below, permitting regulation
reserve sales increase the value of the Li-on storage system because of higher
value regulation reserve sales. However, despite allowing the higher value
regulation reserve sales, adding the 30 MW Li-on and 50 MW Li-on into TID’s
18 of 28 Energy Storage Study 2014 (Final).docx
resource portfolio increases NPP by $0.6-2.6 million per year and by $1.2-4.4
million per year respectively.
Chart 4
$60.0
$70.0
$80.0
$90.0
$100.0
$110.0
$120.0
$130.0
$140.0
$150.0
2015 2016 2017 2018 2019 2020 2021 2022 2023 2024 2025 2026 2027 2028 2029 2030 2031 2032 2033 2034
Net Purchase Power Cost ($ Mil)
No Storage - With Reg Sls ($ Mil)
30 MW Li-on - With Reg Sls ($ Mil)
50 MW Li-on - With Reg Sls ($ Mil)

19 of 28 Energy Storage Study 2014 (Final).docx
Chart 5
$-
$2.0
$4.0
$6.0
$8.0
$10.0
$12.0
2015 2016 2017 2018 2019 2020 2021 2022 2023 2024 2025 2026 2027 2028 2029 2030 2031 2032 2033 2034
Net Purchase Power Cost Savings vs. 30 MW Li-on Battery Cost
Net Pur Pwr Cost Reduction 30 MW Li-on - With Reg Sls ($ Mil)
30 MW Li-on Fixed Cost ($ Mil)

20 of 28 Energy Storage Study 2014 (Final).docx
Chart 6
$-
$2.0
$4.0
$6.0
$8.0
$10.0
$12.0
2015 2016 2017 2018 2019 2020 2021 2022 2023 2024 2025 2026 2027 2028 2029 2030 2031 2032 2033 2034
Net Purchase Power Cost Savings vs. 50 MW Li-on Battery Cost
Net Pur Pwr Cost Reduction 50 MW Li-on - With Reg Sls ($ Mil)
50 MW Li-on Fixed Cost ($ Mil)
5.3. Flywheel
As mentioned earlier, flywheel energy storage systems are well suited for high
capacity low power quick response applications such as regulation. In this study
we modeled a 30 MW flywheel with a 0.25 hour (“Flywheel”) that can provide
capacity, energy, regulation, spinning reserve, and non-spinning reserve. Similar
to the analysis done for the Li-on, the Flywheel was analyzed with and without
regulation reserve sales. Below are the assumptions used for the Flywheel:
Technology Flywheel
Capacity 30 MW
Duration 0.25 Hours
Capital Cost $2,000/kW ($8,000/kWh)
Fixed O&M Cost $5.8/kW-yr
Variable O&M Cost $0.3/MWh
Project Life 20 years
Roundtrip Efficiency 81%

21 of 28 Energy Storage Study 2014 (Final).docx
Debt Interest Rate (20 Yr Term) 4%
Debt Interest Rate (10 Yr Term) 3%
O&M Escalation Rate 2%/yr
Adding the Flywheel to TID’s resource portfolio increased TID’s NPP by $3.5 to
4.0 million per year without regulation sales modeled (see Chart 7 below), and
by $3.3-4.0 million per year with regulation sales (see Chart 8 below). The
Flywheel provided energy, capacity, regulation reserve, spinning reserve, and
non-spinning reserve. But, similar to the Li-on, the benefit (reduction in variable
cost) provided by the Flywheel did not exceed the additional annual fixed cost of
the Flywheel (see Chart 9). Furthermore, the Flywheel provides minimal capacity
value since it only had 0.25 hour duration.
Chart 7
$60.0
$70.0
$80.0
$90.0
$100.0
$110.0
$120.0
$130.0
$140.0
$150.0
2015 2016 2017 2018 2019 2020 2021 2022 2023 2024 2025 2026 2027 2028 2029 2030 2031 2032 2033 2034
Net Purchase Power Cost ($ Mil)
No Storage - Without Reg Sls ($ Mil)
30 MW Flywheel - Without Reg Sls ($ Mil)

22 of 28 Energy Storage Study 2014 (Final).docx
Chart 8
$60.0
$70.0
$80.0
$90.0
$100.0
$110.0
$120.0
$130.0
$140.0
$150.0
2015 2016 2017 2018 2019 2020 2021 2022 2023 2024 2025 2026 2027 2028 2029 2030 2031 2032 2033 2034
Net Purchase Power Cost ($ Mil)
No Storage - With Reg Sls ($ Mil)
30 MW Flywheel - With Reg Sls ($ Mil)

23 of 28 Energy Storage Study 2014 (Final).docx
Chart 9
$-
$2.0
$4.0
$6.0
$8.0
$10.0
$12.0
2015 2016 2017 2018 2019 2020 2021 2022 2023 2024 2025 2026 2027 2028 2029 2030 2031 2032 2033 2034
Net Purchase Power Cost Savings vs. 30 MW Flywheel Cost
Net Pur Pwr Cost Reduction 30 MW Flywheel - Without Reg Sls ($ Mil)Net Pur Pwr Cost Reduction 30 MW Flywheel - With Reg Sls ($ Mil)30 MW Flywheel Fixed Cost ($ Mil)
5.4. Thermal Storage
For this analysis, we assumed that 1,000 Ice Bear systems are deployed in the
TID service area. The Ice Bear systems reduce afternoon cooling load by 6 MW
combined for six hours. Below are the assumptions used for the Ice Bear
systems:
Technology Ice Thermal Storage
Capacity 6 MW (combined)
Duration 6.00 Hours
Capital Cost $1,700/kW ($284/kWh)
Fixed O&M Cost $54/kW-yr
Variable O&M Cost NA
Project Life 20 years
Roundtrip Efficiency 120%
Debt Interest Rate (20 Yr Term) 4%
Debt Interest Rate (10 Yr Term) 3%

24 of 28 Energy Storage Study 2014 (Final).docx
O&M Escalation Rate 2%/yr
As shown in Chart 10 and 11 below, deploying the Ice Bear systems resulted in
an average increase in the NPP by $0.2 million per year. Similar to other energy
storage technologies studied, the reduction in variable costs achieved due to the
Ice Bear systems were less than the fixed costs of the Ice Bear systems deployed
(see Chart 12 below).
Chart 10
$60.0
$70.0
$80.0
$90.0
$100.0
$110.0
$120.0
$130.0
$140.0
$150.0
2015 2016 2017 2018 2019 2020 2021 2022 2023 2024 2025 2026 2027 2028 2029 2030 2031 2032 2033 2034
Net Purchase Power Cost ($ Mil)
No Storage - Without Reg Sls ($ Mil)
6 MW Thermal Storage - Without Reg Sls ($ Mil)

25 of 28 Energy Storage Study 2014 (Final).docx
Chart 11
$60.0
$70.0
$80.0
$90.0
$100.0
$110.0
$120.0
$130.0
$140.0
$150.0
2015 2016 2017 2018 2019 2020 2021 2022 2023 2024 2025 2026 2027 2028 2029 2030 2031 2032 2033 2034
Net Purchase Power Cost ($ Mil)
No Storage - With Reg Sls ($ Mil)
6 MW Thermal Storage - With Reg Sls ($ Mil)

26 of 28 Energy Storage Study 2014 (Final).docx
Chart 12
$-
$2.0
$4.0
$6.0
$8.0
$10.0
$12.0
2015 2016 2017 2018 2019 2020 2021 2022 2023 2024 2025 2026 2027 2028 2029 2030 2031 2032 2033 2034
Net Purchase Power Cost Savings vs. 6 MW Thermal Storage Cost
Net Pur Pwr Cost Reduction 6 MW Thermal Storage -Without Reg Sls ($ Mil)
Net Pur Pwr Cost Reduction 6 MW Thermal Storage -With Reg Sls ($ Mil)
6 MW Thermal Storage Fixed Cost ($ Mil)
5.5. Transmission and Distribution Upgrade Deferral
When a substation approaches its limits generally a new transformer or new
substation are added. Storage systems can be used to defer such distribution
system upgrades. For this analysis, we used the following assumptions:
Substation Size 25 Mva
New Substation Cost $6,000,000
New Transformer Cost $1,000,000
Substation Annual Load Growth 1.0%
Technology Lithium Ion
Capital Cost $1,800/kW ($900/kWh)
Fixed O&M Cost $10/kW-yr
Variable O&M Cost $0.3/MWh
Project Life 20 years
Battery Replacement Cost $244/kWh
Battery Replacement Yr of Occurrence 11th year

27 of 28 Energy Storage Study 2014 (Final).docx
Roundtrip Efficiency 83%
Debt Interest Rate (20 Yr Term) 4%
Debt Interest Rate (10 Yr Term) 3%
O&M Escalation Rate 2%/yr
A review of historical substation loading shows that in order to effectively reduce
the peak loading on a substation by 0.5 MW the storage system has to be able to
discharge a minimum of 3 hours and to effectively reduce peak loading by 1.0
MW the storage system has to be able to discharge a minimum of 5 hours.
Assuming an annual load growth of 1.0%, a 25 Mva substation’s load will grow
0.25 MW per year. Therefore, a 0.5 MW-3 hour duration storage system could
defer a substation upgrade for 2 years and a 1.0 MW-5 hour duration storage
system could defer a substation upgrade by 4 years. Deferring the installation of
a 25 Mva substation results in an annual savings of $240,000/yr ($6,000,000 x
4%). The capital cost of a 0.5 MW-3 hour duration storage system is $1,350,000.
Since the storage system can only defer the substation upgrade by 2 years the
savings realized by deferring the substation upgrade is not sufficient to pay for
the storage device. A 1 MW-5 hour duration storage system will have a capital
cost of $4,500,000. Since the storage system can only defer the distribution
system upgrade by 4 years the savings realized by deferring the substation
upgrade is not sufficient to pay for the storage device. Also, the savings
calculated above assumed a new substation was installed. If a new transformer
is added instead, the annual savings would be reduced from $240,000/yr to
$40,000/yr ($1,000,000 x 4%) making the storage system an even less economic
solution for the purpose of deferring the distribution upgrade. Some storage
systems are designed such that they can be moved to different locations to defer
upgrades on several substations. But at current storage system cost, one would
have to defer upgrades at more than a few substations to become cost effective.
Even if a mobile storage system prove to be a cost-effective way to defer
transmission and distribution upgrades there are currently no anticipated
upgrades needed in TID’s transmission and distribution system that can be
deferred by installing a storage system. For example, TID has 22 distribution
substations and only 2 experience peak loads that reach 80% of capacity.

28 of 28 Energy Storage Study 2014 (Final).docx
6. Recommendation
The analysis performed shows that the benefits of deploying various types of storage
systems fall short of the capital cost of such systems. Furthermore, except for pumped
storage systems, there is limited operational history on utility scale storage systems. Hence
there is limited data on performance degradation, operation and maintenance expense, and
the life of storage systems in utility applications. Given that the analysis show that storage
systems are currently not cost effective and that there is limited operating history, staff
recommends that the Board make a determination that it is not appropriate to adopt
energy storage procurement targets at this time. Even though staff is recommending no
targets be set, staff believes that energy storage systems will become cost effective and will
be an integral part of a utility’s portfolio in the future and plans to evaluate storage systems
periodically. For example, bids for storage systems were requested in TID’s recent
renewable resource solicitation.