energy technology for climate change accelerating … · energy technology for climate change:...
TRANSCRIPT

ENERGY TECHNOLOGY FOR CLIMATE CHANGE
Accelerating the Technology Response
BACkGROuNd REpORT BY THE AusTRALIAN ACAdEMY OF TECHNOLOGICAL sCIENCEs ANd ENGINEERING (ATsE) 2008
December 2008
eNerGY TecHNOLOGY FOr cLImATe cHANGe
Accelerating the Technology response
The key finding of this report by the Australian Academy of Technological Sciences and engineering (ATSe) is that a commitment is needed by government and industry to invest around $6 billion by 2020 on rD&D on new
power generation technologies. Increased deployment expenditure is required after that. Further, no single new
technology for stationary energy production will be capable of achieving the projected reductions for cO2. A new energy research council should be established and
should fund necessary rD&D proposals.

ENERGY TECHNOLOGY FOR CLIMATE CHANGE: ACCELERATING THE TECHNOLOGY REspONsE
© The Australian Academy of Technological sciences and Engineering (ATsE)
IsBN 978-1-921388-02-6
This work is copyright. Apart from any use permitted under the Copyright Act 1968, no part of it may be reproduced by any process without written permission from the publisher. Requests and inquiries concerning reproduction rights should be directed to the publisher.
publisher:
The Australian Academy of Technological sciences and Engineering (ATsE)
Ian McLennan House
197 Royal parade
parkville, Victoria 3052
(pO Box 355, parkville, Victoria 3052)
Telephone +613/03 9340 1200
Facsimile +613/03 9347 8237
Website www.atse.org.au
Author:
Dr John Burgess FTsE
This work is also available as a pDF document on the ATsE website, www.atse.org.au
Design and production: Coretext, www.coretext.com.au
printing: FsG print Management www.fsg.com.au
Date of publication: December 2008
Cover: Energy from the sun – the National solar Energy Centre, Newcastle.
photo: stefan Moore
energy technology for climate changew
ww
.atse.org.au
iEnergy Technology for Climate Change: Accelerating the Technology Response
executive SummaryWhile much emphasis is currently being given to a Carbon Pollution Reduction Scheme trading scheme (CPRS) to reduce greenhouse gases (GHG), a CPRS is a necessary, but not sufficient, condition for timely new technology deployment. New low-emission technologies for electricity generation must be deployed on a massive scale to achieve the proposed reductions in GHG and this has major implications for research and development (R&D) and demonstration (RD&D). Much technology is already being developed, but it awaits large-scale commercial implementation before the costs come down to allow widespread utilisation, even with a price on carbon.
The aim of this initial study is to identify those technologies that can most efficiently and effectively reduce carbon emissions for stationary power generation in both technical and financial terms. In addition to qualitative descriptions of low-carbon energy-generating technologies, results are presented using a probabilistic, computational approach to investment costs and carbon reduction for a range of hypothetical technology scenarios in the future.
The report outlines that a critical step is a commitment to invest around $6 billion by 2020 on RD&D and further increased deployment expenditure after that. Without accelerated development and commercialisation of new power generation technologies, the projected political targets for reduction of GHG will not be met. A new Energy Research Council should be established to identify and fund necessary research, development and demonstration proposals.
The conclusions will enable judgments to be made on the adequacy of planned government expenditure across a range of energy technology development programs and on the strategies of private industry for acceleration of the development and commercialisation of low-emission technologies for stationary energy in Australia.
The issue of climate change linked to greenhouse gases is receiving urgent attention in Australia. This has been facilitated recently by the release of a number of authoritative documents, including the Garnaut Climate Change Review reports1, the Government’s Green Paper on the Carbon Pollution Reduction Scheme2 and a recent Treasury report on global emissions trading modelling and low-carbon technologies3. While governments are providing considerable support for low-emissions technology research and demonstration funding, it is generally recognised that further and larger investments will be required to bring these technologies to deployment.
Against this background, the Australian Academy of Technological Sciences and Engineering (ATSE) has undertaken a scoping study aimed at providing a view about what steps need to be taken to accelerate the technology response to climate change in Australia. The study is restricted to stationary energy generation.
1 Garnaut, r., 2008, The Garnaut Climate Change Review: Final Report Garnaut climate change review, commonwealth of Australia, September 2008.
2 Department of climate change, 2008, Carbon Pollution Reduction Scheme: Green Paper, Department of climate change, commonwealth of Australia, canberra, July.
3 commonwealth of Australia, 2008, Australia’s Low Pollution Future – The Economics of Climate Change Mitigation, The Treasury, commonwealth of Australia, canberra, October.

energy technology for climate change
ii
ww
w.a
tse.
org.
au
Energy Technology for Climate Change: Accelerating the Technology Response
The ATSE study has addressed three aspects of the technology response: ¢ a qualitative analysis of the technologies and the issues associated with them; ¢ the probable investment costs required to achieve the cuts in carbon dioxide being suggested
politically; and ¢ the probable RD&D effort that will be needed to achieve commercialisation of the technologies.
Since there are many uncertainties associated with quantitative determination of these parameters, the Academy adopted a probabilistic rather than single-point forecasting approach in the study. Experts both within and beyond the Academy Fellowship have been consulted to provide information and data for the study and reference has also been made to recent expert external agency reports.
A number of technologies that have the potential to replace conventional coal-fired generation technologies are considered. These include:¢ natural gas firing of turbines plus combined cycle steam generation (CCG); ¢ large base-load gas firing; coal firing or gasification with capture and storage of carbon dioxide (CCS) and
new boiler operational technologies; ¢ renewable technologies such as solar photovoltaics (PV), solar thermal generation with steam, wind and
wave generation; ¢ biomass combustion with integrated gasification combined cycle (IGCC); ¢ geothermal power generation from subsurface hot rocks; and ¢ nuclear energy.
Consistent with the probabilistic approach adopted in this report, uncertainty has been taken into account for the key variables, such as the growth rates in Australian consumption of electrical energy and investment costs per unit of carbon reduction. Furthermore, several scenarios have been assumed for the porportion of various energy sources to deliver the required overall energy demand and carbon dioxide (CO2) reduction targets. Calculations have been performed to estimate the carbon replacement potential of the technologies in question and the investment costs to achieve the stated policy CO2 reduction targets to 2050. Results show, for example, that for a typical growth scenario of 1.4 per cent per annum and a portfolio of new technologies installed, around $250 billion in new technology investment will be required by 2050. However, the investment cost is dependent on the portfolio of technologies adopted, especially the higher cost and lower capacity-factor technologies such as wind and solar. In addition to the investment costs, the work has also illustrated the magnitude of the task ahead. For example, the above hypothetical portfolio in 2050 includes wind energy at 50 times the current level, solar PV application six times higher than a 2 kW panel on five million house roofs in Australia, and Carbon Capture and Storage (CCS) facilities requiring well in excess of 100 Mt/yr of CO2 sequestration.
ATSE’s results for projected investment costs are consistent with recent studies, including the International Energy Agency (IEA) study4 and the recent Australian Government Treasury report5.
The ATSE study shows that it is unlikely that any single technology will achieve the CO2 reduction outcome targets now being proposed. Rather, the response will require development and application of a portfolio of technologies. Many of the technologies reviewed have significant technical and commercialisation issues. Some have high investment cost in terms of amount of CO2 replaced, while others have low probability that commercially viable commercialisation can be achieved in the near future, since considerable technological uncertainties remain. In addition, there are major issues
4 International energy Agency, 2008, Energy Technology Perspectives: Scenarios and Strategies to 2050, OecD / IeA.5 Australian Government, 2008, Australia’s Low Pollution Future – The Economics of Climate Change Mitigation, The Treasury, commonwealth
of Australia, October.

energy technology for climate changew
ww
.atse.org.au
iiiEnergy Technology for Climate Change: Accelerating the Technology Response
related to public perception and government policy (e.g. nuclear energy), technical and environmental uncertainty regarding carbon dioxide storage sites (e.g. CCS), high investment cost to replace carbon (e.g. CCS, solar energy and geothermal generation) or other environmental issues (e.g. associated with extensive application of biomass, wind and wave generation).
While this project adopted a range of hypothetical future technology scenarios for analysis, it is recognised that Australia’s competitive electricity market and the future Carbon Pollution Reduction Scheme (CPRS) will ultimately determine the technology mix that will be deployed. The present study provides a suite of recommendations regarding the level of resources and the types of RD&D required. This will help ensure that the new power generation technologies are properly assessed for their suitability for the task of replacing fossil fuels at the levels being suggested. The critical step is a commitment to invest around $6 billion by 2020 on RD&D and further increased deployment expenditure after that.
Without accelerated development and commercialisation of new power generation technologies, there is a high likelihood that projected political targets for the reduction of GHG will not be met.

energy technology for climate change
iv
ww
w.a
tse.
org.
au
Energy Technology for Climate Change: Accelerating the Technology Response

energy technology for climate changew
ww
.atse.org.au
vEnergy Technology for Climate Change: Accelerating the Technology Response
recommendationsRECOMMENDATION 1Pursue relentless application of cost-effective energy efficiency and conservation strategies so that stationary energy demand growth is less than one per cent a year, over a sustained period.
RECOMMENDATION 2Form an overarching Energy Research Council to identify and fund necessary RD&D proposals so that no worthy project is denied funding. Use the Council to supervise existing funding in these areas. To encourage early investment by private companies, limit the life of the Council to 10 years.
RECOMMENDATION 3Continue to support existing Australian programs (including the Renewable Energy Fund, the Energy Innovation Fund (including the creation of an Australian Solar Institute), the National Low Emissions Coal Initiative and the Global Carbon Capture and Storage Institute (including demonstration programs for CCS, and the Otway CO2CRC project).
RECOMMENDATION 4In terms of support for RD&D on the new technologies:¢ provide support for CCS for coal-fired electricity generation with high priority and emphasis on an
accelerated program of technology demonstration at the largest possible scale in Australia;¢ provide support for geothermal technologies with high priority, and an emphasis on the demonstration
of feasibility at commercial scale in Australia;¢ provide support for solar energy, aimed at increasing the efficiency and lowering the investment
costs of solar PV and solar thermal technologies, preferably through participation of Australian researchers in international consortia and Australian demonstration of larger scale facilities.
¢ accelerate the deployment of wind generation, where economic, using the best international technology at suitable sites in Australia. Undertake a review to establish the maximum possible future generation of wind power as a function of the number of feasible sites, expected capacity factors and the investment costs per unit of energy obtained. The review should include offshore sites;
¢ undertake RD&D to support the introduction of energy storage mechanisms applicable for renewable energy technologies;
¢ critically evaluate nuclear energy as a base-load technology option for the longer term; and¢ accelerate the deployment of gas-fired plants for electricity generation, based on coal-seam
methane.
RECOMMENDATION 5Ensure that resources are made available for improvements in electricity transmission technologies and electricity grid infrastructure. Undertake a review of the national energy market to identify strategies that will optimise the market and maximise the capital efficiency of the suite of new technologies deployed.
RECOMMENDATION 6Allow accelerated depreciation or tax credits on new equipment aimed at greenhouse gas abatement and energy efficiency.

energy technology for climate change
vi
ww
w.a
tse.
org.
au
Energy Technology for Climate Change: Accelerating the Technology Response
RECOMMENDATION 7Consider introducing a government guaranteed electricity procurement scheme at favourable prices to encourage investment in the success of new low-carbon technologies.
RECOMMENDATION 8Ensure that there is adequate provisioning for training of sufficient personnel in the skills that are necessary for the new technologies.
energy technology for climate changew
ww
.atse.org.au
viiEnergy Technology for Climate Change: Accelerating the Technology Response
AcknowledgementsThis report was written under the guidance of a Working Party of ATSE Fellows. Membership of the Working Party comprised:¢ Professor Robin Batterham AO FTSE ¢ Dr John Burgess FTSE ¢ Dr Vaughan Beck FTSE ¢ Dr Peter Cook CBE FTSE ¢ Mr Agu Kantsler FTSE ¢ Mr Peter Laver AM FTSE ¢ Dr John Sligar FTSE ¢ Dr Ziggy Switkowski FTSE ¢ Professor Greg Tegart AM ATSE ¢ Mr Martin Thomas AM FTSE
Additional ATSE Fellows and other experts contributed both to the data used and to the qualitative technology descriptions. The calculations were undertaken by Dr John Burgess FTSE. Contributors to the technological database were: ¢ Professor Terry Wall AO FTSE ¢ Dr Peter Cook CBE FTSE ¢ Professor Bill Charters AM FTSE¢ Mr David Lamb, CSIRO¢ Dr Jim Smitham, CSIRO¢ Mr Wesley Stein, CSIRO ¢ Dr John Wright FTSE ¢ Dr Tom Denniss, Oceanlinx ¢ Professor Martin Green FAA FTSE ¢ Professor Andrew Blakers FTSE ¢ Professor Dong-Ke Zhang FTSE ¢ Mr Martin Albrecht AC FTSE¢ Dr John Soderbaum, ACIL Tasman Pty Ltd¢ Dr Stephen Schuck, Bioenergy Australia
Much of the data and views expressed in this report have been taken from the expert knowledge of this group.
The report was primarily written by Dr John Burgess FTSE and the editorial function was shared by Dr John Burgess FTSE and Dr Vaughan Beck FTSE. Useful contributions to this editorial process were also made by a number of ATSE Fellows, particularly from the Academy’s Energy Forum members, in the form of a peer review. The contribution of those Fellows and other experts involved in this study is gratefully acknowledged by the Academy.
The project was managed for ATSE by Dr Vaughan Beck FTSE, Technical Director, ATSE.
The production of this publication was overseen by Mr Bill Mackey, Communications Director, ATSE.

energy technology for climate change
viii
ww
w.a
tse.
org.
au
Energy Technology for Climate Change: Accelerating the Technology Response
This ATSE project was first announced at a meeting of the International Council of Academies of Engineering and Technological Sciences that was held in Tokyo in October 2007. Since that meeting, a number of Academies have expressed interest in this project.

energy technology for climate changew
ww
.atse.org.au
1Energy Technology for Climate Change: Accelerating the Technology Response
contentsExECuTIvE SuMMARy i
RECOMMENDATIONS v
ACkNOwlEDgMENTS vii
1 INTRODuCTION 3
2 TEChNOlOgIES 52.1 An Introduction 5
2.2 Energy vs. Power 5
2.3 Summaries of the Technologies 6
2.3.1 Coal firing with Carbon Capture and Storage (CCS) 6
2.3.2 Solar Energy Technologies 9
2.3.2.1 Solar Photovoltaics (Pv) 10
2.3.2.2 Solar Thermal 11
2.3.3 Biomass Combustion 12
2.3.4 wind Energy 13
2.3.5 wave and Tidal Energy 14
2.3.6 geothermal Energy 15
2.3.7 Nuclear Energy 16
2.3.8 gas-fired Plants 18
3 ANAlySIS Of fuTuRE INvESTMENT COSTS 213.1 Costs to Replace 10 per cent of Total Emissions 21
3.2 Analysis using a Probabilistic Approach 23
3.3 growth in Supply of Electricity 23
3.4 Investment Costs of Technologies 25
4 CONCluSIONS fROM ThE SCENARIO ANAlySES 33
5 gAP BETwEEN RD&D AND DEPlOyMENT 355.1 R&D 35
5.2 Demonstration and deployment and costs 35
5.3 valley of death 35
6 POlICy ISSuES 37
APPENDIx 39
ACRONyMS 41

energy technology for climate change
2
ww
w.a
tse.
org.
au
Energy Technology for Climate Change: Accelerating the Technology Response

energy technology for climate changew
ww
.atse.org.au
3Energy Technology for Climate Change: Accelerating the Technology Response
1 IntroductionThe Australian Academy of Technological Sciences and Engineering (ATSE)6 is undertaking a program of study aimed at providing an expert view about what steps need to be taken to accelerate the technology response to climate change. The title of the study is Energy Technology for Climate Change: Accelerating the Technological Response (the ATSE ATR project). The current study takes the pragmatic approach that, since governments are proposing to address the risk of climate change through financial mechanisms, they need considered advice on technical solutions that have realistic potential to address their requirements. The study, which does not address the science or causes of climate change, concentrates on stationary electricity generation because it is the largest component of greenhouse gases in Australia. Also, the report considers only the capital investment costs for electricity generating facilities and no consideration is given to electricity transmission and distribution. The study object is to determine the magnitude of the technological and investment task to acheive the GHG reduction targets set.
The ATSE study addresses three aspects of the technological response: ¢ a qualitative description of the technologies and the issues associated with them; ¢ the probable investment costs required to achieve the stated targets; and ¢ the probable RD&D effort needed to achieve commercialisation of the technologies.
Since many uncertainties are associated with quantitative determination of these parameters, the Academy has adopted a probabilistic rather than single-point forecasting approach. Experts both within and outside the Fellowship of the Academy were consulted to provide information and data for the study. Reference is also made to recent expert external agency reports, some of which also have expert input from the ATSE Fellowship.
Secondly, the ATSE study reviews policy issues surrounding new technologies. As Australia is legislated to move towards a low-carbon intensity society through financial instruments, it is recognised that there is a significant gap between the existing energy resource mix and a lower- carbon intensity one. Some of the technologies considered appropriate are not yet developed to the necessary scale for effective mitigation, while others are explicitly excluded during the ebb and flow of political debate. Accordingly, much of the world is caught in a valley between the hills of:a) predicted impending climate change impacts; andb) costs to individuals, companies and countries.
Much technology is already known, but it awaits large-scale implementation before reducing costs allow widespread utilisation, even with a price on carbon. Accordingly, this report also identifies mechanisms to accelerate the introduction of new technologies at major scale by investigating new approaches through novel mechanisms associated with economic and policy initiatives. It must also be recognised that the Australian competitive market in electrical energy and the proposed CPRS will also drive the adoption of new technologies for stationary energy generation as a function of their delivered energy cost.
6 ATSe, founded in 1976, is an independent, non-government organisation consisting of more than 750 eminent Australian Fellows that promotes the development and adoption of existing and new technologies that will improve and sustain our society and economy.

energy technology for climate change
4
ww
w.a
tse.
org.
au
Energy Technology for Climate Change: Accelerating the Technology Response

energy technology for climate changew
ww
.atse.org.au
5Energy Technology for Climate Change: Accelerating the Technology Response
2 Technologies 2.1 AN INTRODuCTIONA number of candidate technologies able to replace or ameliorate carbon dioxide emissions from conventional coal-fired generation technologies have been considered. These include natural gas firing of turbines plus IGCC; large base-load gas firing; coal firing or gasification with CCS; renewable technologies such as PV, solar thermal generation with steam, wind and wave generation; biomass combustion with IGCC; geothermal energy generation from subsurface hot rocks; and nuclear energy.
The study, along with others, indicates that it is probable no single technology will achieve the carbon dioxide (CO2) reduction outcome targets currently proposed. Rather, the response will likely require the development and application of a portfolio of technologies, probably including nuclear energy. Many of the technologies reviewed have significant commercialisation issues and high investment cost in terms of CO2 reduction, and many technology uncertainties remain. The issues are also related to public perception and government policy (e.g. nuclear energy), current technical and environmental uncertainty regarding carbon dioxide storage sites (e.g. CCS), high present investment cost to replace carbon (e.g. CCS, solar energy and geothermal generation) or environmental issues (e.g. extensive application of biomass, wind and wave generation).
The study uses some selected hypothetical scenario modelling to the years 2020 and 2050, taking into account a possible range of energy demand growth rates in Australia. It has also asked the question: ‘What is the investment cost of replacing 10 per cent of Australia’s total CO2 equivalent emissions for each technology?’ Learning curves for all technologies leading to reduced investment costs over time have been incorporated into the analysis. The results show that investment costs to achieve the proposed reduction targets are of the order several hundred billion dollars by 2050 for a typical new technology portfolio. This sum could be reduced considerably through higher energy efficiency (or lower demand through a CPRS) and correspondingly lower energy growth trajectories. Moreover, there are very significant investment cost differentials between technologies, especially in the next two decades before cost reductions occur due to learning and scale.
Above all significant RD&D and commercial demonstration investment will be required before new technologies are commercial. For an accelerated response, this RD&D should be focused in Australia primarily on carbon capture and storage and geothermal energy if appropriate. Provision should be made within the regulatory and public acceptance frameworks for the possible, and indeed likely, adoption of nuclear power within the portfolio. Support and involvement by Australian researchers in international development programs in solar thermal and solar PV technologies should be aimed at significantly reducing technology costs in the Australian context. There is also a sound case for investment in large-scale demonstration of these renewable technologies in Australia.
2.2 ENERgy vS. POwERCapacity and Availability factorsIt is useful firstly to consider availability and capacity factors for energy generation. The availability factor is the percentage of time when the technology is available for use. It accounts for downtime for maintenance and items such as overhaul. Capacity factor, on the other hand, is the percentage of energy actually delivered compared with the energy that could theoretically be delivered if the technology was run at rated output for the full time it was available. Capacity factor is always less than availability factor. Capacity factor depends not only on the technology availability and time power is available for

energy technology for climate change
6
ww
w.a
tse.
org.
au
Energy Technology for Climate Change: Accelerating the Technology Response
renewables, but on the way in which the electricity generation and transmission system is controlled and managed. For example, current capacity factors for coal-fired generation in Australia based on ESAA data are around 70 per cent. Capacity factors are nonetheless important, since they govern the investment that must be made in generating capacity to satisfy electricity demand. Future capacity factors for large-scale generation from renewable energy sources, such as solar energy, must be estimated based on the daily availability of the sun and the wind.
Power vs. EnergyBefore commencing the technology descriptions it is important to distinguish between energy and power. Power is the rate of production of energy. The chemical energy in fossil fuels is released when burnt to produce electrical power. Communities and industry consume energy. Therefore to replace CO2 we need to replace the energy consumed, not the instant power generated.
One watt (W) of power delivers one joule ( J) of energy each second. One watt produced for one day (24h) will produce 86,400 J (or 86.4 kJ) of energy (3600s x 24h). For each low-emissions technology it is this energy that replaces fossil fuels and hence CO2. If, however, like some renewables, peak power can be provided for (say) only five hours per day, it will only replace 18,000 J (3600s x 5h), just 21 per cent of the energy and hence 21 per cent the CO2 from fossil fuels burned for up to 24 hours per day. In this instance the capacity factor would be 21 per cent.
In order to clarify this important distinction further, consider for example a 1 GWe coal-fired generator with an availability factor of 95 per cent. Its annual energy output capacity is 8,322 GWhe. (1 GWe for 0.95 of 8760 hours in the year). Consider also a 1 GWe solar electricity generator that operates for 20 per cent of the time when the sun shines. Its annual energy output capacity is 1,752 GWhe. (1 GWe for 0.20 of 8760 hours in the year). To eliminate the CO2 emissions from the 1 GWe coal-fired generator by replacing it with solar in this example would require a 4.75 GWe peak capacity solar electricity generator (that is, 8322 divided by 1752). It is this principle that significantly increases the investment cost (expressed in $/watt) of some intermittently operating technologies for CO2 reduction from existing fossil fuel generators.
2.3 SuMMARIES Of ThE TEChNOlOgIESEach of the technologies under consideration has a range of technological and engineering uncertainties. A brief description of the technologies is described in this section, together with a summary of the current issues and uncertainties7.
2.3.1 Coal firing with Carbon Capture and Storage (CCS)Conventional coal firing with steam generation and electricity generation involves several steps. Either black or brown coal is pulverised in air-swept pulverising mills and the powdered coal is conveyed to the boiler by the air. This primary air and coal enters a burner and secondary air is swirled around the coal-air jet to achieve a recirculating flow that promotes ignition and combustion of the coal. The flame transfers heat to high-pressure water tubes in the boiler, which then converts to steam. This steam, superheated by the rising hot gases in the tubes at the top of the furnace, drives a steam turbine, which in turn drives an alternator to generate power. The flue gases leave the boiler and the fly ash is removed by electrostatic precipitation and/or bag filters. The flue gas then passes to the atmosphere. The carbon dioxide concentration of this flue gas is relatively low, and mixed with nitrogen.
Efficiencies of conversion of thermal energy from the coal to electricity with conventional firing range from 29 to 36 per cent8. Lower efficiencies occur with brown coal generation (e.g. in the La Trobe
7 most of the technical information in this section was provided by the ATSe Fellows listed in the Acknowledgements.

energy technology for climate changew
ww
.atse.org.au
7Energy Technology for Climate Change: Accelerating the Technology Response
valley) because of the high inherent moisture content of this fuel. This moisture is evaporated during the combustion, requiring a significant portion of the heat energy in the coal. Efficiency can be increased, in the case of brown coal, by drying the coal before firing. Projects on this technology are currently under way in Victoria.
Efficiencies of conventional coal firing can also be increased by improving heat transfer in the furnace and increasing steam pressure and temperature. This can lead to so-called supercritical or ultra-critical steam generation where the steam reaches supercritical conditions in the boiler tubes.
Newer Australian power stations do use supercritical boilers but with moderate temperatures and only a modest efficiency improvement. This is because the low Australian coal cost does not justify the increased cost of the higher temperature materials and fabrication cost, even though boiler design is not dramatically changed. The current state-of-the-art for coal-fired supercritical steam cycles, such as in Japan where coal costs are high, is ~630˚C / 300 bar maximum steam conditions, with a thermal efficiency of about 45 per cent. In the future five to 10 years, 650˚C to 700˚C is expected, for example, through the EC-THERMIE ‘700’ project, with resulting cycle efficiencies of ultra-supercritical plant in the range 48 to 53 per cent.
Future carbon emission prices will drive the economics to ultra-supercritical plant.
Notwithstanding the improvements to design and efficiency that could occur with conventional coal firing and improved design, these technology developments will be insufficient for the step-change reductions necessary to mitigate emissions of carbon dioxide to reach targets proposed politically. For this to occur, carbon dioxide must be captured from the flue gases of coal fired generators and stored underground – so called Carbon Capture and Storage (CCS). With this technology, the CO2 would be captured from the flue gases, compressed and transported using chemical engineering technologies and injected into appropriate rock strata underground using petroleum reservoir engineering technologies.
CO2 can be relatively easily captured from conventional flue gases containing nitrogen using ammonia-based organic compounds (e.g. monoethanolamine (MEA)). However, since the CO2 concentrations in conventional flue gases are low, larger chemical engineering facilities would be required to handle the large gas flows and low gas concentrations and these would have attendant high capital costs. Nevertheless, pilot facilities are currently being developed to remove CO2 from current power station flue gases using a range processes and solvents such as amines, ammonia, amino acids and carbonates in different states in Australia. Retrofitting of existing stations is thus technically feasible.
In order to increase the concentration of CO2 in the flue gases to assist in CO2 capture, coal may be either burnt or gasified using oxygen rather than air. This leads to two possible technological developments for future power generation with coal:(i) coal-oxygen burners in a boiler design using recycled CO2 and no nitrogen to generate steam; and(ii) coal gasification (in either oxygen or air) and a shift reaction to produce carbon monoxide (CO) and
hydrogen (H2) fuel gas. This mixture would be used to power an IGCC plant, with both a gas turbine and an integrated steam turbine utilising the hot exhaust gases from the gas turbine to generate steam and thus generate power. Efficiencies of 45 to 50 per cent can be achieved from this technology9.
8 Johnson T, and Pleasance G, 1996, Clean Coal Technology for Brown Coal Power Generation, coal Utilisation, The Australian coal review, Victoria, October.
9 http://www.brain-c-jcoal.info/cctinjapan-files/english/2_2b5.pdf
energy technology for climate change
8
ww
w.a
tse.
org.
au
Energy Technology for Climate Change: Accelerating the Technology Response
The resulting flue gases from both oxygen technologies would be rich in CO2 after drying. Compared with the retrofitted case, the chemical engineering facilities to remove the CO2 from the other gases would be smaller in these two cases. However, an additional plant to separate oxygen from air would be required for both of the oxygen based technologies.
The dry CO2 produced from any of the three technologies above needs to be stored rather than emitted to the atmosphere. The proposed method for this to occur would be storage as a dense fluid in underground rock. CO2 can be converted into a liquid at room temperature by compression to high pressure. At very high pressures the CO2 becomes highly dense and is referred to as a supercritical fluid. Geological storage of this CO2 requires a situation whereby deep underlying porous rock is covered by an impermeable layer to prevent CO2 leakage. The underlying porous layer would be similar to rocks which store oil, so spent petroleum reservoirs could be suitable for this duty. There will no doubt be other geological situations where the required situation occurs, but these will need to be carefully investigated to ensure sustainable containment of the CO2 by the over-capping rock. It is important to note that the CO2 will not be stored in an underground ‘cave’. Rather, it will be injected into the tiny pores in the porous rock, which is essentially similar to sandstone. In some cases the CO2 could displace underground water or brine whilst in other cases the CO2 could displace hydrocarbons or other fluids. In this respect, as well as in the geological structures, each underground storage site will be different. One example of a detailed investigation and demonstration at small scale of this process (up to 100,000 tonnes of CO2 injected) is currently being undertaken by the CO2CRC Otway Project in western Victoria10.
Internationally, CO2 injection into petroleum reservoirs is currently widely used for enhanced oil recovery (EOR). As well as EOR there are a number of large-scale storage projects (Sleipner in the North Sea, Algeria and Canada) injecting approximately 1 Mt CO2 per annum, which is roughly one-sixth to one-eighth of the requirement for a large (1 GWe) coal-fired power station operating at a typical Australian capacity factor.
In order to inject the CO2 it must be compressed to high pressure (over 100 atmospheres). The CO2 is then transported by pipeline under pressure to the suitable geological storage location and injected under pressure via drill-holes into the deep porous rock strata. Depending on the amount of CO2 injected and the geological characteristics of the site, many wells will be required and configured to optimise long-term storage. These operations are part of the overall cost of CCS and will contribute to the overall power generation cost.
Compared to a conventional coal-fired power station, CCS requires more energy for the process of removal of the CO2 from the off-gases and to compress, transport and inject it. That is, CCS reduces the effective nameplate rating of the unit. For instance a 600 MW unit with CCS may have an effective rating of say 400 MW with 120 to 180 MW being used to capture and transport and store the carbon dioxide. Thus, depending on the situation, post combustion capture consumes 20 to 30 per cent of the input energy of the coal over-and-above the requirement for conventional coal firing. This means that more coal must be burnt with CCS to provide the same energy output as a conventional unit. This also means that the CO2 to be sequestered for a 1 GWe CCS facility will be around 8 Mt/yr CO2, depending on the boiler efficiency. The CCS facility will also require increased capital investment compared with the existing conventional facilities. Our estimate of this investment cost in 2020, including a typical CO2 transport scenario of several hundred kilometres, is more than twice the cost of a new conventional coal-firing facility (that is, approximately $3.5/W (2008 $) for a CCS facility at the 1 GW scale compared with $1.5/W for a conventional coal firing facility).
10 http://www.co2crc.com.au/

energy technology for climate changew
ww
.atse.org.au
9Energy Technology for Climate Change: Accelerating the Technology Response
ATSE analysis of the CCS technology indicates that the chemical engineering of a power-generation facility, even with the changes outlined above, is complex but feasible. RD&D will be required in the area of coal gasification with oxygen for the gasification option together with demonstration of both the coal gasifier and the associated gas turbine technologies. RD&D will also be required for the combustion of coal in a carbon dioxide mixture with oxygen for the recycled CO2 option, as will the associated boiler design with recycled CO2. The capture of CO2 from the resulting flue gases, however, should comprise conventional chemical engineering technology for initial deployment activities. Additional capture R&D is warranted to support the need for cost reductions over time. Compression of CO2 to the supercritical state prior to pipeline transport and injection should represent conventional petroleum processing technology, albeit at large scale and potentially over large distances.
Careful RD&D of the CO2 injection and storage process will be required. Firstly, the concept will need to be proved at an appropriate geological location, as is currently occurring at the CO2CRC Otway Project. This should include careful monitoring over time of the structure to ensure that the stored CO2 does not escape. For commercialisation, each identified location will need to be characterised in geological terms to ensure the underground strata are suitable. This will apply to both the storage rock, which will need to have the required permeability, and the over-capping impermeable rock, which will need to be free of escape routes (e.g. cracks) for the CO2. In this respect, each storage location is likely to be different and this will require ongoing study and monitoring. The discipline of petroleum reservoir engineering will provide the skills base for this aspect of CCS. We estimate that between $1.5 billion and $2.5 billion will be required over time in the Australian context for RD&D to fully demonstrate a single commercial application of CCS.
2.3.2 Solar Energy TechnologiesAustralia receives many orders of magnitude more solar energy each year than all fossil fuel use combined. Conventional collection of solar energy utilises only very common materials (e.g. Si smelted and purified from SiO2) and implementation has minimal environmental impact. Australia has a strong presence in the worldwide PV industry, and this could be built upon to create an export-oriented, technology-based industry.
Two solar energy-capture technologies are relevant to CO2 reduction: solar photovoltaics (PV) and solar thermal (ST). PV power is generated by the incidence of sunlight on semiconductor photo-sensitive cells made from silicon or other appropriate metals. PV technologies are many, broadly falling into the categories of flat plate and concentrating. Even within these categories the variations in technology are considerable as developers seek to increase energy capture and reduce costs.
For solar thermal electrical power (as distinct from solar hot water) the sun’s rays are focused onto a high temperature absorber. The absorber may contain water that is turned to steam to directly power an electricity generator. Alternatively, the absorber may contain an intermediate fluid such as oil that can be used in a heat exchanger to generate steam to power an electricity generator.
For all solar technologies, capacity factor depends on the hours of sunlight at the location of the generator. Thus capacity factors for flat-plate collectors (e.g. rooftop) are typically only about 15 to 20 per cent. However, ‘tracking collectors’ using parabolic dishes and troughs have the potential to increase this to 20 to 25 per cent.
Options for the provision of stable and continuous solar power include actively shifting loads from night to daytime; wide geographical dispersion of solar systems to minimise the effect of cloud and time zones; precisely predicting solar energy output using satellite imagery; and solar energy storage. Storage options for solar energy could include pumped hydro-power, whereby water would be pumped uphill when

energy technology for climate change
10
ww
w.a
tse.
org.
au
Energy Technology for Climate Change: Accelerating the Technology Response
energy is being generated and released through turbines when the sun is down, if power prices at these times were appropriate11. In the longer term, intercontinental low-loss high-voltage DC transmission from remote solar generation sites could possibly reduce the need for storage.
Australian solar energy capacity factors range from 15 per cent in Tasmania, through 20 per cent in Adelaide to 25 per cent in Central Australia and the North West, with around five peak hours on average. The urban alternative of distributed solar PV (‘a solar power station on every roof ’) is still expensive but could become increasingly attractive as collector costs fall and systems serve as the primary roofing material.
Notwithstanding these comments, solar power generation, while exhibiting very significant promise, will be unlikely to enjoy widespread adoption as an energy (and hence fossil fuel replacement) without continued subsidy due to its high investment costs per unit of energy supplied (as detailed below).
All high-temperature solar thermal systems are based on sun-tracking concentrators. There is extensive crossover between the technology of PV and solar thermal concentrators. The concentrating systems are essentially the same, with the major technical difference being the solar receiver mounted at the focus: a black solar absorber in one case, and a PV array in the other. The efficiency of PV could eventually rise to 60 per cent12, compared with the current world record efficiency of 43 per cent. The cost of PV systems can be expected to continue to decline – as has happened with the related integrated circuit industry. The fact that PV uses sunlight directly, rather than converting the light into heat or other forms, gives PV a thermodynamical advantage. However, the power generated from solar systems only generates energy for a small proportion of the total time so a large capacity is required at high investment cost at present in order to generate sufficient energy to replace the energy generated from fossil fuels.
2.3.2.1 Solar Photovoltaics (Pv)PV initially found widespread use in niche markets such as consumer electronics, remote area power supplies and satellites. Now, as costs decline, many PV systems are being installed on house roofs in cities. The worldwide PV industry has been doubling every 20 months since 2000 and production is currently 5000 MW per year. Mass production is causing steady reductions in cost, although the investment cost is currently relatively high per watt of peak power.
Most PV systems are mounted on fixed support structures such as house roofs. Some PV systems are mounted on sun-tracking platforms to maximise output. Others use sun-tracking concentrators to concentrate light by 10 to 1000 times onto a small number of solar cells. These concentrators can be reflecting parabolic troughs or dishes, a central tower surrounded by a field of reflecting heliostats or a refracting Fresnel lens. The concentrators are essentially identical to those used by concentrating solar thermal systems.
As noted above, present investment costs for solar PV are relatively high. For example, domestic installations currently cost $20,000 for a 2 kW power system that operates for three to five hours per day at this power level, at an investment cost of $10/W. Nevertheless, it has been suggested by experts in the field that at present a large centralised solar PV system could be built for $5.0 to $6.0/W. The costs of solar PV due to its “learning curve”13 are falling rapidly at about 20 per cent per doubling of PV capacity,
11 Normally, pumped energy storage operates to reduce power costs by pumping water up to a reservoir at night, when power prices are low, and using the hydro-power in the day when power prices are higher.
12 Professor A blakers, Director centre for Sustainable energy Systems, Australian National University, Personal communication, 2008.

energy technology for climate changew
ww
.atse.org.au
11Energy Technology for Climate Change: Accelerating the Technology Response
according to the IEA. Production of solar PV cells is also growing rapidly. This means that the future costs of solar PV, depending on its penetration into the market, could fall to around $2.0 to $2.5/W peak power within the next 20 to 25 years, depending on growth in PV capacity. These estimated costs include not just the cost of the panels themselves, but also the balance-of-system costs such as structures, inverters and cabling.
Although silicon is the second most abundant element in the Earth’s crust, there is a current shortage and high cost of purified silicon, from which most PV cells are manufactured. However, it is projected that production will rise tenfold over the next four years, which could reduce constraints on the PV industry. Nevertheless, the availability and price of this material will be a key issue in future development of solar PV cells made from silicon.
A range of global research and development programs are underway to achieve the $2.0/W investment cost required to make solar PV competitive with other technologies. These include re-design of the silicon surface at a nanoscale to increase the light retention in the cell through internal refraction of the light photons, and the development of highly engineered materials for solar concentrator systems.
A significant PV development is the use of ‘thin film’ technology involving the manufacture of very thin films (human hair thickness) comprising combinations of relatively exotic, highly engineered materials. Examples of these developments include Cadmium-Telluride, Cobalt-Arsenic-Gallium-Indium, and Copper-Indium-Gallium-Selenium materials on an inert substrate. Current issues include cost, toxicity and scarcity, but if successful they could decrease the demand on hyper-pure silicon for the more conventional silicon cells. They could also be coated on steel or glass roofing sheet for building construction.
Solar PV installations have high investment costs per unit of total energy they provide because they have low capacity factors. They thus have relatively high investment costs per unit of coal-fired electrical energy they replace. On the other hand, they have no fuel costs. In a water-constrained situation they have the major advantage of not requiring cooling water, the supply of which can be an issue for coal and nuclear power plants.
Storage of power (e.g. by pumped storage of water coupled with hydro power) to give more hours power generation a day does not change the solar energy equation, since higher power and therefore higher cost facilities are required to ensure sufficient power to provide the stored energy while the sun is shining. However, if storage could be provided to extend the time to include the evening demand peak, this would assist in improving electrical supply system stability and provide power at peak periods of demand.
2.3.2.2 Solar ThermalIn this technology mirrors focus light from the sun onto some form of heat exchanger. Water in the exchanger is turned into steam, which is used in a turbine to drive an alternator to generate electrical power. The types of mirrors used can vary from parabolic troughs or dishes focused onto a pipe heat exchanger, to mirrors focused on a ‘power tower’ (or elevated platform supporting the heat exchanger), to Fresnel lens systems using less expensive flat mirrors. The temperatures achieved are greater than 1000˚C and the systems could thus also be used to provide energy for chemical processes such as the production of ammonia or for gas reforming. Solar thermal mirrors could also be used to focus light onto a solar PV array, thus increasing efficiency.
13 International energy Agency, 2008, Energy Technology Perspectives: Scenarios and Strategies to 2050, OecD / IeA, Paris. refer to: ‘Deployment and Technology Learning’, chapter 5, pp.201-219 of this reference.

energy technology for climate change
12
ww
w.a
tse.
org.
au
Energy Technology for Climate Change: Accelerating the Technology Response
Some 350 MW of trough mirror plants have been operating in a commercial environment in California for more than 20 years. Developments of some 400 MW of new facilities are either under construction or recently commissioned, primarily in Spain and the US. An additional estimated 1200 MW is planned14.
Solar thermal systems can be engineered to contain an integrated energy storage system. These could be large thermal inertia masses, such as carbon blocks, or molten salt systems where the heat exchanger contains an inorganic salt such as sodium nitrate at high temperature. This molten salt could be physically stored in tank containers and used to transfer heat to make steam and hence drive turbines after sundown. Again, this system could be used to extend the power generation time into the evening peak period of high electrical consumption.
Solar thermal generators would of necessity be large, centralised systems. The same issues identified above for centralised solar PV would apply, relatively low capacity factor and thus high investment cost per unit of energy obtained. However, like PV, there are no fuel costs. It is projected that the real investment cost of solar thermal facilities, using a learning rate of 10 per cent per doubling of capacity15, will reduce from around $4.5/W now to $3.0/W in the next decade to $2.0/W in 25 years time, and this will depend on significant market penetration of the technology. The current technology being used in California (trough mirrors with oil) has been through its learning curve and significant new R&D and demonstration on newer technologies will be required.
2.3.3 Biomass CombustionBiomass from material rejected from sugar cane stalks after milling is used in Australia and elsewhere today to generate power and steam. Most of this is used in the sugar extraction process, but some excess power is sold to the electricity grid. This use of biomass is seasonal, corresponding to the winter-spring harvesting season. Most of the equipment used is small-scale and employs single-cycle steam turbine generation, with the largest being a 68 MW unit at Pioneer sugar mill in Queensland. Notwithstanding this scale, there has been significant innovation in this industry in some aspects of biomass combustion technology. Overseas, Denmark has a 590 MW multi-fuel unit, which is partially fuelled on wood pellets and straw bales.
It is technically feasible to use land to purpose-grow biomass and use the biomass in a sustainable power generating industry. While the biomass is growing it absorbs CO2 from the atmosphere. If the biomass is harvested and then burnt to produce power, the CO2 emitted will be absorbed by the growing biomass, thus closing the CO2 cycle. Less new CO2 will therefore emitted to the atmosphere compared with the combustion of fossil fuels. Biomass combustion has been called ‘carbon neutral’ but the net carbon balance of such an arrangement is not yet been fully understood in order to calculate the net CO2 emitted to the atmosphere and retained in the soil, etc. This understanding will be required for future emissions trading for agricultural biomass production. Also, extra CO2 is generated as a result of the harvesting, transport and processing activities associated with biomass fuels.
Other aspects of the environment may benefit from growth of biomass for fuel. For example, mallee trees are being grown in South West Australia to assist in lowering the water table and hence reduce land salinity. Research is currently being undertaken on conversion of this mallee into sustainable charcoal to provide fuel for smelting furnaces for minerals. Growing biomass can also have negative environmental and social impacts. For example, biomass growing could displace land for food agriculture, which could
14 W Stein, cSIrO energy Technology, Personal communication, 2008.15 International energy Agency, 2008, Energy Technology Perspectives: Scenarios and Strategies to 2050, OecD / IeA, Paris. refer to:
‘Deployment and Technology Learning’, chapter 5, pp.201-219 of this reference.

energy technology for climate changew
ww
.atse.org.au
13Energy Technology for Climate Change: Accelerating the Technology Response
have negative social impacts such as increased food prices. Furthermore, biomass is a relatively poor converter of solar energy into fuel and hence energy compared with (say) solar PV systems.
In principle, trees can be grown, harvested, dried and chipped to produce biomass for combustion. Boilers using fluidised bed and tube boiler technologies with steam turbines are in operation and even biomass IGCC facilities gasifying sawdust or pulverised dried biomass are technically feasible.
The logistics of forestry (or other agriculture for shrub or grass biomass) is a key issue for biomass combustion for energy. When biomass is grown it contains moisture. For example, green wood from trees contains 60 per cent moisture and this biomass must be dried before it can be used as a fuel. For one GWhe, it can be calculated that about 1500 tonnes an hour of green wood is required, which equates to about 13 million tonnes a year, taking efficiency of electrical energy generation into account. To purpose grow this biomass in a 10-year cycle, 0.5 million hectares of land area is required. If solar drying was used and wood required one year of drying before use, 13 million tonnes of timber would need to be stored. In addition, the growing biomass requires water and this could represent a key negative issue for the concept, as groundwater would be removed from the river basin where the biomass was grown. Biomass growing and harvesting would be a considerable enterprise requiring a significant land area for generation equivalent to a large coal-fired power station. The costs of growing, harvesting, transporting, drying and preparing the biomass for use as a fuel would be also be high, using current technology. Depending on these costs, it may be more economic in the longer term to simply grow biomass and claim emission credits as part of an emissions trading scheme (depending on the carbon price). Under these conditions it is expected that biomass combustion will remain a niche technology and be under 100 MW in unit scale. At this scale it is estimated that the capital cost for the fuel firing component of biomass power generation is about $2.0/W.
2.3.4 wind Energy The use of wind for power generation is now well established. It is an area of substantial growth, with installed wind power growth of 27 per cent in the US in 2006. The proportion of electricity generation capacity in Denmark in 2006 was 21 per cent (3.1 GW capacity), and the total generating capacity in Germany in 2006 was 20.6 GW. Globally, 0.9 per cent of world electricity consumption in 2006 was from wind power16. In Australia, the corresponding proportion of electricity energy supply was 0.4 per cent in 2007, with one per cent of generating capacity17.
Wind-turbine technology is now based on aircraft design, with companies such as GE in the US manufacturing the turbine components. The blades of the turbines now utilise sophisticated materials and designs. Average turbine size in the US reached 1.6 MW in 2006, with the largest at 3 MW. Installed costs in 2006 stabilised in the US at about US$1.5/W now that efficiencies at around 50 per cent have become close to the theoretical maximum.
The overall costs of wind power depend significantly on the wind intensity and duration. Steady winds increase the capacity factor for wind power and, as explained previously, this increases the total energy supplied per unit of investment. For this reason, it is important to site wind turbines in favourable locations. In Australia, these are on hilltops (e.g. in north Queensland) or coastal headlands (e.g. South West WA or Southern SA). Proposals have been made to site wind turbines offshore in order to increase capacity factor, although this development will depend on a balance between investment costs and increased wind availability.
16 Wiser r and bolinger m, 2007, Annual Report on US Wind Power Installation, Cost and Performance Trends: 2006, US Department of energy, may, 24pp.
17 electrical Supply Association of Australia (eSAA), 2008, Electricity Gas Australia 2008, pp.14-17.

energy technology for climate change
14
ww
w.a
tse.
org.
au
Energy Technology for Climate Change: Accelerating the Technology Response
Environmental considerations are important in wind-power generation. The public is sometimes concerned about visual pollution and debate occurs about siting wind turbines in areas where bird strikes can occur. Nevertheless, compared with solar power and other renewable energy sources, wind energy appears to offer a lower risk and lower cost technological solution to renewable power generation, provided sufficient suitable sites can be found. However, it is not capable of providing a total replacement of base-load energy due to the vagaries of weather conditions, losses in electricity transmission from remote sites and lack of low-cost electricity storage technologies at the scale required.
2.3.5 wave and Tidal EnergyWave power devices capture the energy of waves. There are many different methods being deployed to capture this energy globally: some capture the mechanical energy created by the rising and falling of buoys using devices such as pivot arms or hydraulics while others rely on the internal motion of an oscillating water column to displace air at high velocity, which in turn drives a turbine.
There are many wave-power systems being developed in various parts of the world. In Portugal, three wave-power machines currently generate 2.25 MW of peak power and a further 28 machines are forecast to be built for $120 million to generate 72.5 MW of peak power (an investment cost of $1.7/W). A similar surface-tracking Pelamis wave-power farm is also to be built in Scotland to generate 3 MW peak power18. A ‘wave hub’ has also been announced for offshore from the north coast of Cornwall, England generating 20 MW. In the US a group is constructing a commercial wave-power park in Oregon utilising 40kW modular buoys.
In Australia, Oceanlinx has a prototype 450kW unit utilising Oscillating Water Column (OWC) technology powering an internal variable blade pitch air turbine and has other facilities up to 5 MW planned in the UK, Australia and US19.
Challenges facing the wave-power technologies are mainly associated with improving the conversion efficiency of intermittent mechanical movement into electrical power and constructing devices that can survive the harsh marine environment. Further innovation in both these areas should occur as wave power climbs the learning curve. In order to achieve this, more demonstration devices of different designs will be required in-situ at a variety of locations.
Wave-power generation also suffers from the same issue of idle time that is present with solar and wind generators. Capacity factors for wave power associated with the presence of waves at the location in question are in the range 20 to 30 per cent. As noted previously for other technologies, this increases the investment cost of obtaining energy from wave-power farms relative to generators that operate continuously.
The above description could leave an impression that wave-power generation is comparable to wind generation in technological maturity. However, the reality is that although wave generators have been in development for decades they have not progressed past the demonstration phase. Reasons for this could include the difficulty of deploying and servicing moving machines in the hostile ocean water environment and the mechanical complexity of the devices. It is the assessment here that wind power has a far greater prospect of significantly replacing fossil fuels than wave or, indeed, tidal power.
Tidal power converts the energy of tidal flows into electricity, generally by installing a water turbine into the flow. Tidal barrages that change the water level on each side to generate a water head, and hence a flow, are also used. Tidal power efficiency is improved with high tidal-flow rates, so areas where this
18 european marine energy centre (emec) Ltd, Stormness, Orkney, Scotland. (http://www.emec.org.uk)19 Oceanlinx Limited, botany, NSW, Australia (http://www.oceanlinx.com).

energy technology for climate changew
ww
.atse.org.au
15Energy Technology for Climate Change: Accelerating the Technology Response
occurs are preferred. These are not necessarily close to locations where the power generated is consumed. Also, tidal flows are not constant and they reverse direction and this means that the capacity factor is below 50 per cent (e.g. a total of 12 hours operation at the required flow velocity).
In Australia, Tidal Energy Pty Ltd has successfully trialled their high efficiency shrouded turbine (efficiency more than 60 per cent) and plan to produce a facility in North West Australia generating 3.5 MW peak power20. Other facilities are also planned. Tidal facilities using propeller-type turbines are being demonstrated in the UK and Norway at the hundreds of kW scale. In Northern Ireland a 1.2 MW peak power commercial scale turbine unit has been connected to the electricity grid since early 2008. Several other turbine farms in the MW peak power scale have been foreshadowed internationally.
In France a barrage-type tidal power plant has been in operation since 1996 with an installed peak power of 240 MW and an annual production of energy of 600 GWhe21. This gives a capacity factor of 28 per cent. Two other barrage-type tidal facilities operate globally: at the Bay of Fundy in Canada (18 MW peak) and Kislaya Guba in Russia (0.5 MW peak). Other facilities of this type are planned.
It is assumed that the investment cost of tidal power generation facilities will be similar to wave generating units at between $1.5 and $2.0/W peak. Further demonstration and commercial facilities will provide a learning curve for these technologies to lower these costs further. Like wind power, wave and tidal power facilities face environmental concerns. These include visual pollution of coastal seascapes and harm to marine creatures. In the case of tidal power, changes to estuarine ecosystems, turbidity, salinity and sediment movement may also limit their applicability. Again, it is the assessment here that tidal power will only occupy a small niche position in replacing fossil fuels relative to other technologies.
2.3.6 geothermal EnergyHarnessing of a hot water stream for energy from shallow hydrothermal areas associated with volcanic activity has been practiced for centuries in countries such as New Zealand. In some cases, steam has also been captured through boreholes and used to drive steam turbines. Geothermal energy is therefore not new and, for example, the Philippines generate around one quarter of its electricity from this source.
There are two types of non-volcanic geothermal power; one using the energy in deep hot rocks and the other using the energy in shallower hot water. The hot rock concept is to create an artificial hydrothermal field by drilling down into dry, hot rocks (say more than 200˚C), pump water down the drill-hole, force the water along horizontal fractures in the rock, and then collect the generated steam and superheated water in a second borehole and use it to drive a steam turbine at the surface to generate electricity. Impermeable rocks such as granite are the most effective reservoirs of heat for this purpose, so the rocks have to be made permeable through fracturing in order to heat the water.
In the Cooper Basin, Australia has some of the hottest rocks of this type in the world. At this location a company called Geodynamics has drilled two 4300-metre-deep wells and created an underground heat exchanger by fracturing and stimulation of the rock in a demonstration facility. Performance testing of the wells and heat exchanger are in progress and a one MW generator is planned to be installed by the end of 2008. Full commercial scale development requires the development of various drilling and stimulation techniques. The first 50 MW unit is planned by Geodynamics for commissioning in mid-2011. Similar demonstration facilities are also being developed by other companies in Australia and in other countries (e.g. France).
20 Tidal energy Pty Ltd. ( http://tidalenergy.net.au )21 energy System research Unit (eSrU), University of Strathclyde, Glasgow, Scotland. (http://www.esru.strath.ac.uk/eande/Web_
sites/01-02/re_info/tidal1.htm)

energy technology for climate change
16
ww
w.a
tse.
org.
au
Energy Technology for Climate Change: Accelerating the Technology Response
A second hot water (or sedimentary geothermal) concept is based on the fact that in some sedimentary basins, the water in deep saline aquifers can have a temperature in the range of 125˚C to 150˚C. Examples of basins where this is the case include the Otway Basin where for example it has been estimated by Hot Rock Ltd that there is scope for a generation capacity of 1750 MW (approximately 35 per cent of Victoria’s electrical power needs). Sedimentary geothermal resources are found at a shallower depth (typically around 3000 metres) and some occur in areas where there are major high voltage transmission lines. While the temperatures are lower than for hot rock, binary-cycle power plants can effectively produce electricity at a lower temperature differential, albeit at lower thermal efficiency.
Geothermal energy production has many advantages, including the fact that the heat resource is immense and the environmental impact is low. For example, it has been noted that the recoverable heat under the US is the equivalent of 2000 years worth of current US energy consumption. The technology also has the potential for an availability factor approaching 100 per cent, meaning that it would be efficient in replacing coal-fired capacity. If the technology is developed using Australian know-how, the benefits to Australia in technology exports could be significant. Investment in demonstration of the technology is therefore warranted.
The application of hot rock geothermal technology could be limited by high costs. The holes required are deep and penetrate dense rock. Many holes could be required for a producing field, so operating costs as time goes on could be large. If the fields are also situated at remote locations in Australia, transmission inefficiencies and costs will be large. However, the energy produced by the technology could supply large remote mining operations such as Olympic Dam in SA. In this regard, it is noteworthy that processing of minerals in Australia consumes more than 10 per cent of the national electricity supply22.
Investment costs of geothermal energy at the present time are high and estimated as $6.0/W. This cost should decrease over time with learning, but exact quantification of this is uncertain. Again, effective demonstration of the technology and its associated costs is required. Investment costs in sedimentary geothermal are likely to be less because of the shallower depths and because fairly standard oil field techniques are used.
Notwithstanding its promise, it is the assessment here that geothermal energy production still has many technological hurdles to overcome before large-scale commercialisation. It is not at the same stage of its life cycle as, for example, wind energy in terms of replacing fossil fuels.
2.3.7 Nuclear EnergyNuclear power generation has served the international community well and with remarkable safety for more than 50 years. Today it is part of the generation portfolio of some 31 countries with more than 440 civilian power reactors in service worldwide, providing more than 15 per cent of the world’s electrical energy. Nuclear power is not yet part of Australia’s generation portfolio despite Australia having nearly 40 per cent of the world’s easily won low-cost uranium resources. Australia is nevertheless a major exporter of uranium ‘yellowcake’, providing fuel for the world’s fast-growing reactor fleet.
Reasons for the lack of nuclear power take up in Australia are both economic and political. Economically Australia has an abundance of low-cost coal resources close to load centres against which nuclear power cannot yet compete while carbon emissions are not costed; its electricity generation cost being some 20 to 50 per cent higher. Politically neither Commonwealth nor State government policies yet permit nuclear generation, while community attitudes remain mixed and uncertain. Whether these policies
22 b Fraser, AmIrA International; and Professor G Jameson AO FTSe, University of Newcastle, Personal communication, 2008.

energy technology for climate changew
ww
.atse.org.au
17Energy Technology for Climate Change: Accelerating the Technology Response
will change is a matter for community debate and improved understanding. However, nuclear power generation, with its minimal carbon footprint, may well prove economically and hence politically attractive as carbon emission reduction pressures grow.
As with most technologies nuclear power has developed over a series of technological ‘generations’. Generation 1, now almost all removed from service, included the prototype gas-cooled Magnox reactors of Britain, commissioned in the 1950s, the last of which will close down in 2010.
Generation 2, commencing in the mid-1960s, comprised a range of commercial reactors of varying designs (LWR, PWR, BWR, CANDU, VVER and RBMK). Many of these are still in service with some notable exceptions; the Soviet designed RBMK reactors installed at Chernobyl and elsewhere in the then USSR have all been substantially modified or removed from service.
Generation 3, entering service from the mid 1990s, ushered in a new series of advanced, safer and more reliable light water reactors (LWRs) comprising the ABWR, System 80+, AP1000 and EPR designs, currently being installed or on order throughout the world. The so called Generation 3+ designs, with yet better fuel utilisation and further improved safety features, will enter service from 2010 onwards and, should Australia embark on a nuclear power program, this is likely to be the technology of choice. Availability factors higher than 90 per cent can confidently be expected with plant service lives of well over 40 years. Safety standards will be very high.
Generation 4, still under development with six candidate technologies, promises a whole new approach but is unlikely to be in commercial service before 2030. Five of the designs are so called ‘fast neutron’ types, which will extract some 50 to 60 times more energy from the uranium fuel by using not only the U235 but also the more plentiful U238 unused by earlier generations. Australia is currently considering its potential commitment to their development through the Generation 4 International Forum.
The nuclear fuel cycle, expressed simply, comprises the following steps: mining and milling (producing uranium oxide concentrate U3O8 sometimes known as ‘yellowcake’); conversion to gaseous uranium hexafluoride; enrichment to increase the percentage of the fissile isotope U235 occurring in natural uranium from around 0.7 per cent to between three and five per cent – known as low-enriched uranium (LEU); fuel fabrication into small pellets; loading of pellets into fuel rod assemblies; loading into the reactor for some three years of controlled fission and heat release for conventional steam generation; cooling and radioactive decay of the spent fuel assemblies in deep water ponds; safe and permanent encapsulation and deep burial in an appropriately engineered deep repository 500 to 2000 metres underground.
Australia has numerous remote geo-stable regions suitable for such a repository which, in any event, would not be needed until after 2050 should nuclear power be adopted. Moreover the quantities of high-level waste, relative to the waste volumes of some other technologies, are small; amounting to only two to three cubic metres per annum for a 1 GWe base load nuclear power station if the fuel is reprocessed; about 10 cubic metres if not. Engineering of such a repository lies well within the skill base of Australian hard rock mining engineers. Indeed it has been proposed that Australia might lease its uranium to approved world users, taking it back after 30 years for permanent encapsulation and burial unless reprocessed. It is postulated that if kept under Australian control the risks of proliferation are minimised.
The 2006 Uranium Mining Processing and Nuclear Energy Review (the UMPNER report) showed, on the basis of the best information then available, that the earliest that nuclear electricity could be delivered to the Australian grid would be 10 years, with 15 years more probable, from the time of commitment to a nuclear program. However, as the report noted, the establishment of a single national regulator supported by an organisation with skilled staff would be required. Likewise a core of trained nuclear

energy technology for climate change
18
ww
w.a
tse.
org.
au
Energy Technology for Climate Change: Accelerating the Technology Response
power industry scientists, engineers and technologists would be needed; human resources reported to be in increasingly short supply in the current worldwide ‘nuclear renaissance’.
The economics of nuclear power hinge greatly on the cost of capital, the balance between (and ownership of ) equity and debt and the means of managing financial risk. Fuel costs are a relatively small proportion of overall electricity generation costs which, apart from financing and regulatory costs, would include, through a levy on power sold, for all waste disposal and eventual decommissioning costs. Plant decommissioning costs are from nine to15 per cent of initial capital cost but lie so far in the future that a modest levy of around US$1.0 to US$2.0/MWh on electricity sent out is sufficient to provide adequate funds. Likewise spent fuel disposal costs are typically around US$1.0/MWh and can be dealt with similarly.
Capital costs comprise plant engineering, procurement and construction (EPC) and owner’s costs, typically land, cooling infrastructure, administration and associated buildings, site works, switchyards and project management.
Many sources of cost data exist, including the UMPNER report23 which commissioned an independent report from the Electric Power Research Institute (EPRI)24. In terms of investment costs, an August 2008 paper of the World Nuclear Association (WNA)25 draws on much the same data as EPRI in 2006 but adds recent worldwide contract figures. Recent EPC costs recorded (and there are many) range from US$1.53/W (for China Guandong Nuclear Power Company’s 4x1080 MWe CPR-1000 units at Hongyanhe) to US$3.58/W (for Florida Power and Light’s 2x1100 MWe AP-1000 units at Turkey Point, Miami). The average for the new contracts recorded recently lies between US$2.5and US$3.0/W. Mid-2008 vendor EPC quotes are all around US$3.0/W in a competitive worldwide market. In the discussion that follows below we have assumed an investment cost in 2050 of $2.0/W not including infrastructure costs, reflecting a modest learning curve for the newer nuclear technologies over the next 40 years.
Fuel costs can be quite variable, especially on the spot market, although most operators lock in long-term fuel supply contracts. Typical fuel costs at current world contract prices equate to US$5.0 to US$6.5/MWh. With new mines opening in Australia and overseas, contract prices are unlikely to increase dramatically. Even so, fuel is but a small proportion of the electricity generation cost and thus sensitivity to fuel price variation is low. Moreover modern designs are increasingly fuel-efficient.
2.3.8 gas–fired plantsThere is an opportunity to replace carbon (coal) with coal-seam methane (CSM) as a base-load energy supply for the Australian electricity industry. This opportunity is a function not only of the much lower carbon content of methane but the improvement in the thermal efficiency that can be achieved in base load conversion using combined-cycle gas turbines. These facilities can achieve about 60 per cent thermal efficiency for electricity generation and 85 per cent thermal efficiency for combined heat and power generation. Further efficiency gains are possible by replacing centralised electricity generation, with its transmission losses, with more efficient gas reticulation and local power generation and the development of new technologies for distributed power systems. These could include: micro-generation with gas-fired Stirling Engines; combined heat and power systems that have the ability to
23 commonwealth of Australia, 2006, Uranium Mining, Processing and Nuclear Energy Report, report to the Prime minister by the Uranium mining, Processing and Nuclear energy review Taskforce, December, p.59.
24 electric Power research Institute, 2006, Review and Comparison of Recent Studies for Australian Electricity Generation Planning, electric Power research Institute, Palo Alto, california, USA.
25 The economics of Nuclear Power, World Nuclear Association, August 2008; m Thomas Am FTSe, Personal communication, 2008. (http://www.world-nuclear.org)

energy technology for climate changew
ww
.atse.org.au
19Energy Technology for Climate Change: Accelerating the Technology Response
produce electricity and heat energy in a single integrated unit, and residential cogeneration systems operating on natural gas.
Exploitation of Australian CSM resources has lagged that of the US, where extraction and exploitation of CSM for commercial gas supplies has been a feature of the market for many years and where it is a significant business. By the mid-1990s a number of developers commenced the development of technology and methodology suitable to Australia’s extensive coal deposits which contain large resources of CSM, particularly in Queensland and New South Wales. Estimates of gas-in-place in these deposits suggest that they could yet be larger than the combined conventional gas resources of Bass Strait, the Cooper Basin and the North West Shelf25.
CSM has the capacity to deliver huge quantities of gas to market. Like all resource commodities, demand, price and supply will be tightly linked. The CSM industry is rapidly growing in Australia and tracks earlier growth in the US, with annual Australian production of 133 PJ year-to-mid-2008, up 35 per cent from a year earlier, out of total domestic gas demand of about 885 PJ. In the US, CSM production in 2004 was about 1720 PJ.
25 http://www.westsidecorporation.com/coal+seam+gas+overview.aspx

energy technology for climate change
20
ww
w.a
tse.
org.
au
Energy Technology for Climate Change: Accelerating the Technology Response

energy technology for climate changew
ww
.atse.org.au
21Energy Technology for Climate Change: Accelerating the Technology Response
3 Analysis of Future Investment costs
The analysis presented here does not attempt to model global or national economics, but focuses on the investment costs of technologies aimed at replacing or sequestering fossil fuel CO2. The Treasury of the Australian Government has recently published a report27 that uses global equilibrium economic models to examine the influence of future world carbon trading prices on the adoption of new technologies and the impact of this on Australia’s economy into the future. This extensive modelling work was released after the calculations in this work were undertaken. The Treasury models incorporate investment cost of new technologies into the future as a sub-set of their overall model, and the portfolio of technologies required is established as an outcome of the technology costs and the carbon trading price. A competitive market for electrical energy exists in Australia and it will also drive the future selection of technologies by industry, depending on their delivered power cost. In contrast, the technology portfolios assumed here are hypothetical and presented for illustrative purposes based on the qualitative judgements of Academy Fellows. Notwithstanding this difference, the results of our calculations below on the technologies considered are in broad alignment with the Treasury modelling, although the more sophisticated Treasury work incorporates changing electricity demand as a function of future carbon price.
No consideration is made here of the prospective electrical power distribution system, or its stability and security, with the new technology scenarios. In addition, no differentiation has been made between centralised and distributed generation for some of the renewable technologies such as solar PV, although the investment costs for the latter are for a centralised facility. Variation in the generation output of some of the renewable technologies due to weather could prove to be important in power system stability if these technologies are deployed at significant fractions of total capacity and this will need to be taken into account in any actual future portfolio of generation technologies.
3.1 COSTS TO REPlACE 10 PER CENT Of TOTAl EMISSIONSAs part of the analysis of investment costs for CO2 mitigation with new technologies, an analysis of the costs to replace 10 per cent of Australia’s current total CO2e emissions has been made28. The magnitude of the investment challenge facing Australia can be gauged from the results of this calculation in Table 1, where the amount of capital investment29 required, for various electricity generating technologies30 to each reduce Australia’s current total carbon emissions by 10 per cent (e.g. 60Mt/yr CO2e) is given (further details are given below and in the Appendix). Table 1 shows the investment costs required in 2020 and 2050, taking into account learning factors for cost reduction. Nuclear energy has been included only for 2050, since it is unlikely that current government policy will allow commercial nuclear generation in
27 commonwealth of Australia, 2008, Australia’s Low Pollution Future – The Economics of Climate Change Mitigation, The Treasury, commonwealth of Australia, October.
28 To undertake this calculation, the 10 per cent reduction (60 mt/yr cO2e) was converted to GWhe supplied from coal in conventional generating stations using both established emission factors (~1000 t cO2e per GWhe supplied on a weighted average basis) and from a calculation based on weighted average coal chemistry and specific energy properties. both these assumptions gave similar results.
29 Learning curves from the International energy Agency, 2008, (Energy Technology Perspectives: Scenarios and Strategies to 2050, International energy Agency, OecD / IeA). have been used to calculate the expected change in peak power investment costs for each of the technologies. Only the capital cost for plant investment is included, and the cost takes into account the annual degree of conversion of peak power into energy and losses in efficiency during generation. No additional allowance for transmission or distribution cost is made, and infrastructure costs for biomass firing and nuclear are not included.
30 Overall capacity factor (a combination of capacity factor and availability factor, refer Section 2.2) for the various technologies are assumed for the calculation as follows: ccS, Gas, biomass, Geothermal and Nuclear assumed the same as current coal firing at 70 per cent, Solar PV and Solar Thermal assumed as 20 per cent, Wind assumed as 30 per cent, Wave assumed as 25 per cent. This assumption is conservative in terms of the ability of the new technologies to replace coal fired capacity.

energy technology for climate change
22
ww
w.a
tse.
org.
au
Energy Technology for Climate Change: Accelerating the Technology Response
Australia to be deployed by 2020. Table 1 provides some indication of what investment will be required, illustrating the variation in investment costs with the type of technology. As can be seen, there is large variation in the investment required to replace fossil fuel carbon between the new technologies. In this context, gas firing, CCS, nuclear and wind generation are among the lower investment cost alternatives, while solar energy has relatively high investment cost.
Note that in this report only investment costs have been considered. These have not been converted to total costs per unit of energy generated by taking into account required returns on investment, operating costs such as fuel, cooling water, energy storage, forestry for biomass, infrastructure costs, energy transmission costs, carbon trading costs and credits, and externality costs31 and so on. Our object here has been to determine the magnitude of the investment in generating capacity required in Australia to replace present coal fossil fuel power generation.
The assumed investment costs of the technologies in this work, as noted previously, are in broad agreement with the recent Treasury Report32. The differences in this work are mainly in the investment costs of solar and geothermal technologies. For example, this report is more optimistic about solar technologies achieving a steeper cost-reduction learning curve due to technology development than the Treasury report33. On the other hand, in this report we are not as optimistic about the cost of geothermal hot rocks technology into the future, primarily because the present costs of this commercially unproven technology are high34. It is noteworthy that our investment costs for carbon capture and storage (CCS) technology and wind technology are very similar to those in the Treasury Report35.
The investment cost to replace 10 per cent of Australia’s total current CO2 emissions, as given in Table 1, depend both on the estimated unit capital costs and the relevant capacity factors36,37.
Table 1 Investment costs to replace 10 per cent of Australia’s total current CO2e emissions using different new technologies in 2020 and 2050
Technology
EstimatedCapital Cost
$/W2020
EstimatedCapital Cost
$/W2050
Cost to Replace 60 Mt/a coalfired CO2 (10% of total Australian GHG)
($B)2020
($B)2050
ccS - coal 3.5 2.5 49 35 Gas 1.5 1.3 30 26 biomass 2.5 2.0 25 20 Solar PV 5.0 2.0 174 70 Solar Thermal 3.0 2.0 104 70 Wind 2.0 1.5 46 35 Wave 1.5 1.3 42 36 Geothermal 6.0 4.0 60 40 Nuclear 2.0 20
31 ATSe is currently conducting a project on energy externalities for stationary energy production. 32 commonwealth of Australia, 2008, Australia’s Low Pollution Future – The Economics of Climate Change Mitigation, The Treasury,
commonwealth of Australia, October, Table b.23, p.251.33 Treasury models assume concentrating solar PV in 2020 to be $4.64/W compared with our $5.0/W, while the comparison in 2050 is
$3.12/W compared with our $2.0/W. Similarly the Treasury solar thermal cost in 2050 is $2.70/W, compared with our $2.0/W.34 Treasury models assume the investment cost for geothermal hot rocks technology in 2050 is $2.80/W, compared with our $4.0/W.35 Treasury models assume an average ccS investment cost of $3.40/W in 2020, compared with our $3.5/W. In 2050 the comparison is
$2.53/W and $2.6/W, respectively. The Treasury investment cost for wind technology is $1.75/W in 2050, compared with our $1.5/W.36 For ccS, the same capacity factor of existing coal fired generators (electrical Supply Association of Australia (eSAA), 2008, Electricity Gas
Australia 2008, electrical Supply Association of Australia, pp.14-17) is assumed on the basis that ccS capacity will be base-load, and the investment cost and capacity required is adjusted for an assumed conservative 30 per cent loss in efficiency due to the extra power requirements of the ccS process.
37 For gas-fired generators, the same capacity factor of existing coal fired generators is used on the assumption that in the future much new gas capacity will be base-load. Since gas firing still emits cO2, the investment cost to replace cO2 from coal firing is adjusted (by an assumed 50 per cent cO2 emission of gas relative to coal) to calculate the required gas firing capacity and hence required investment.
energy technology for climate changew
ww
.atse.org.au
23Energy Technology for Climate Change: Accelerating the Technology Response
3.2 ANAlySIS uSINg A PROBABIlISTIC APPROAChThe Academy has also adopted a probabilistic approach to the analysis of future investment costs and timing of new technologies aimed at carbon dioxide emission reduction from stationary energy sources. It has adopted this approach in the light of the uncertainties associated with these costs, given the state of development of most of the technologies.
Our basic approach has been to develop three scenarios for future adoption of the technologies. The scenarios are wholly hypothetical, although they do take into account an assessment of the state of development of the technologies at the present time, as well as current politically driven targets for reduction of carbon dioxide emissions. The scenarios are:1. Use of 20 per cent ‘low carbon’ technologies (solar, wind, hydro, etc. at 16 per cent and four per cent
CCS) for the electricity supply in 2020, with only minor adoption of CCS by then.2. An approximate 50 per cent reduction in carbon dioxide emissions by 2050 relative to 2000 for
stationary energy generation, using a relatively large increase in renewables, natural gas generation, substantial CCS application and moderate continuation of conventional coal generation.
3. An approximate 70 per cent reduction in carbon dioxide emissions in 2050 for stationary energy generation, similar to 2 above, but with no conventional coal generation and moderate application of CCS and nuclear power, along with renewables.
The scenarios considered are not meant to be forecasts of the future for Australia. Rather, they are essentially a portfolio of possible technologies, and their investment costs, to illustrate what is implied for the country in the adoption of current carbon dioxide emission targets applied to stationary electricity generation. Clearly the indicated portfolios could be changed within limits, especially for 2050, in order to achieve similar overall results for emission levels. Adjustments of the portfolio in terms of the type of technology employed would change the investment cost in the early years, but towards 2050 the investment costs of the technologies per unit of power tend to converge due to their learning curves in terms of $/watt (see discussion below). However, the capacity factors for most of the renewables remains low, meaning that they have high investment costs per unit of coal firing energy replaced. The limits for the technology portfolio would need to encompass aspects such as electrical system stability, whereby base-load supply with a high capacity factor needs to be maintained for periods when renewable energy generators are idle. It is likely that this base-load supply will need to be greater than 60 per cent of overall power supply in any scenario.
The calculations have recognised uncertainty through a probabilistic approach where key variables have been allocated a distribution of outcomes. Thus, key variables in the future have three values: a p50 value which is the expected outcome, and p10 and p90 values that represent, respectively, the value at which 10 per cent of values in the distribution are smaller than the number, and the value at which 90 per cent of the values are smaller than the number.
3.3 gROwTh IN SuPPly Of ElECTRICITyFuture growth in electricity supply will depend on energy savings at the point of consumption. For the purposes of the analysis, growth rates between 0.8 per cent per year (p10) and 2.2 per cent per year (p90), with the p50 value at 1.4 per cent per year have been assumed in Table 2, based on 2007 supply of 229 TWhe (ESAA38 data):
As can be seen, future electricity consumption in Australia is very dependent on the assumed growth rate, with the median consumption in 2050 about 90 per cent greater than in 2007. There is large variation around this mean depending on growth rate, leading to the important conclusion that energy saving
38 electrical Supply Association of Australia (eSAA), 2008, Electricity Gas Australia 2008, electrical Supply Association of Australia, pp.14-17.

energy technology for climate change
24
ww
w.a
tse.
org.
au
Energy Technology for Climate Change: Accelerating the Technology Response
technologies will be very important in any strategy to reduce CO2 emissions in the future. For example, a McKinsey cost study39 showed that many energy efficiency measures had a higher net present value (NPV) than other methods of CO2 emission mitigation. Some of these cost-effective efficiency measures include air conditioning and air heating efficiency and lighting in both commercial and residential buildings, residential water-heating systems, electrical appliances, electric drive systems in industry and fuel economy for motor vehicles. In the US, the State of California has slowed growth in energy consumption per capita to one per cent a year, with half the savings being produced from regulation and half with incentives such as tax credits to industry40. As is shown above, there are considerable savings in new carbon mitigation technology investment that can be achieved by reducing electrical energy growth in Australia to less than one per cent. These savings are potentially of the order of many tens of billions of dollars. However, while recognising the importance of energy savings41 through such means as energy efficiencies and conservation, they are not part of the present study, which is focused on energy generation technologies.
Table 3 Electricity supply and capacity for various technologies (ESAA data for 2007 and assumed)
Technology
2007Gross
supplyTWhe
CapacityGW
2007 Overall
CapacityFactor
%
2007percentage
supply%
2007percentage
Capacity%
coal (steam) 176.6 29.3 69 77.2 62
Oil (engines) 0.1 0.1 11 0.1 0Gas (steam) 14.6 2.4 69* 6.4 5Gas (turbines) 20.7 7.7 31 9.1 16coal (ccS) 0 0 7042 0.0 0biomass 2.0 0.4 53 0.9 1Hydro 13.7 6.7 23 6.0 14Solar PV** 0 0 20* 0.0 0Solar Thermal 0 0 20* 0.0 0Wind 0.9 0.3 32 0.4 1Wave*** 0 0 25* 0.0 0Geothermal 0 0 70* 0.0 0Nuclear 0 0 7043 0.0 0
228.6 46.9* assumed ** gross supply for Solar PV is 17 GWhe *** gross supply for Wave is 3 GWhe
39 mcKinsey and company, 2008, An Australian Cost Curve for Greenhouse Gas Reduction, mcKinsey and company, February.40 J Jutsen, executive Director, energetics Pty Ltd, Personal communication, 2008.41 energy savings give rise to lower growth rates for electricity consumption; this is equivalent to the low range (p10) of the electricity
growth probabilistic distributions assumed in this report. 42 The capacity factor for ccS is assumed to be similar to existing coal-fired generators. In the calculations account is taken of the loss
in efficiency forecast occur with ccS. This loss in efficiency for ccS is assumed as 30 per cent relative to conventional coal firing. This conservative assumption does not take into account probable increases in efficiency with learning or with new boiler technologies (e.g. Ultra Super critical steam operation with oxy-fuel).
43 The capacity factor for nuclear energy should be closer to 85 to 90 per cent (personal communication mr m. Thomas FTSe), but for the purposes of the analysis here the overall capacity factor has been conservatively assumed as 70 per cent, which is the same as current coal-fired base-load generators.
Table 2 Assumed distribution of net electricity supply in 2020 and 2050Net supply (TWhe)
2020 probability level 2050 probability level255 10% 340 10% 275 50% 429 50% 295 90% 540 90%
mean 2020 275 mean 2050 429

energy technology for climate changew
ww
.atse.org.au
25Energy Technology for Climate Change: Accelerating the Technology Response
An increasing carbon price into the future, as envisaged in the Australian Government’s CPRS, could lead to reduced electricity demand, depending on the carbon price. The recent Treasury report44 uses global equilibrium models to calculate the demand in electricity as a function of the world carbon-trading price to achieve specified atmospheric concentrations of CO2. As a result, the demand for electricity in their modelling falls in the future as the carbon price rises, depending on the particular scenario. This is in contrast to the constant electricity demand growth over time assumed here.
The energy supply growth shown in Table 2 can be converted to required generating capacity using capacity factors for the various technologies. Overall capacity factors45 are based on data taken from ESAA data46 for existing technologies. Using this data, the generating capacity for the various technologies in 2007 are shown in Table 3, along with assumed overall capacity factors for the new technologies.
Table 3 shows that capacities of some existing technologies can be low, depending on whether the technology is used for base-load or peak. The assumed overall capacity factors for the new technologies are based on either natural factors (e.g. sun, wind and waves) or similarity to existing coal base-load generation. Again, it is important to note that if a capacity factor is low, then a larger investment cost will be required to provide sufficient energy to replace existing coal firing supply.
3.4 INvESTMENT COSTS Of TEChNOlOgIESThe costs of investing in the technologies to replace conventional coal firing have been estimated by the Academy using expert advice from ATSE Fellows as well as external sources of data. For the analysis, distributions for all of these costs have been assumed and going forward costs have been estimated from published learning curves from the IEA47, which provide an estimate of the expected reduction in cost for each doubling of commercial capacity of the technology. Given in Table 1 are the estimated investment costs per watt (p50) for each technology in 2020 and 2050 (2008 $) and the Appendix gives more information on the assumed probabilistic distributions for the estimates in this part of the report.
2020 ScenarioFor the first scenario we have taken the often politically expressed target of 20 per cent ‘low carbon emission’ technologies (including some CCS) by 2020 as a basis. A feasible portfolio of technologies has been assumed but no attempt has been made to determine the technical feasibility of distribution and supply of electricity under the scenario. Again, nuclear energy has been included only for 2050 (see below), since it is unlikely that current government policy will allow commercial nuclear generation in Australia to be deployed by 2020. Financial drivers, such as the competitive electricity market and the proposed CPRS have also not been taken into account. Given the technology scenario, calculation of the probabilistic supply (based on the probabilistic growth assumptions above) and then the required capacity using the overall capacity factors listed in Table 3, has been made. From that, a probabilistic estimate of investment costs has been estimated using the data from Table 1 and the Appendix. As mentioned, the selection of the technologies in this scenario is for illustrative purposes, and could be varied depending on financial or other circumstances. The two important parameters that are examined from the estimates are the investment cost of installing these technologies and the amount of greenhouse gases that can be replaced relative to the year 2000 in the scenario.
44 commonwealth of Australia, 2008, Australia’s Low Pollution Future – The Economics of Climate Change Mitigation, The Treasury, commonwealth of Australia, October
45 Overall capacity Factor is defined in the remainder of this chapter to be a combination of both the capacity Factor and the Availability Factor; refer to Section 2.2.
46 electrical Supply Association of Australia (eSAA), 2008, Electricity Gas Australia 2008, electrical Supply Association of Australia, pp.14-1747 International energy Agency, 2008, energy Technology Perspectives: Scenarios and Strategies to 2050, OecD / IeA, Paris. refer to:
‘Deployment and Technology Learning’, chapter 5, pp.201-219 of this reference.

energy technology for climate change
26
ww
w.a
tse.
org.
au
Energy Technology for Climate Change: Accelerating the Technology Response
For the purposes of comparison only, a business-as-usual electricity generation combination – that provides the increased 2020 capacity required through increases in conventional coal firing, gas firing and other methods of generation (except hydro) in the same ratio as 2007 – has also been calculated. In this case, the generating supply is 20 per cent greater than in 2007 and the supply from renewables in 2020 totals about five per cent (mainly hydro, biomass and wind). The purpose of this calculation is to examine what the extra investment cost would be under this mainly fossil fuel firing scenario49, as well as the magnitude of the CO2e emitted. The results of this calculation show that the investment cost would be around $15 billion (p50) to provide the extra supply, assuming no capital investment to replace existing facilities by 2020. Under these predominantly fossil fuel-fired conditions, the CO2e emissions are calculated to increase by 31 per cent by 2020, relative to 2000. This provides a baseline for comparison with the results below for the assumed portfolio including renewables and CCS, but does not include the replacement and repair costs of existing fossil-fuel fired capacity up to 2020.
The investment costs for a 2020 portfolio that is based on 20 per cent renewables (including CCS at four per cent of supply) have been calculated by taking the assumed proportion of supply for each of the technologies and calculating the generating capacity required using the technology’s overall capacity factor. This capacity has then been multiplied by the investment cost, as outlined previously. Table 4 shows these costs.
As can be seen, the required capacity for electricity generation under this scenario would increase at the middle of the probabilistic distribution (p50) to about 66 GW in 2020 from 47 GW in 2007, an increase in supply of around 20 per cent. The aggregated investment costs for the various new technologies to
Table 4 Assumed contribution of technologies to electricity supply in 2020 together with investment costs required to provide required capacity
Proportion ofNet Supply
%
TotalPercentage
%
capacityrequired
GW
Additionalcosts
required(p50)($b)
TECHNOLOGYFossil fuels coal - ccS 4.0 2.5 9.0
coal - conventional 60.0 26.9 0Oil 0.0 0 0 Gas - Steam 10.0 4.5 2.748
Gas - Turbine 10.0 10.5 3.6 Fossil fuels 84.0 renewables biomass 1.0 0.5 1.1 Hydro 4.0 6.3 0 Solar PV 3.0 4.7 24.0 Solar Thermal 3.0 4.7 4.1 Wind 4.0 4.2 7.7 Wave 0.5 0.6 1.0 Geothermal 0.5 0.2 1.3
Renewable energy 16.0Nuclear 0.0 0
ToTal 100.0 65.6 64.5
48 The investment costs for gas and renewables such as wind are calculated from the net increase in capacity relative to 2007 data. Since gas firing still emits cO2, the investment cost to replace cO2 from coal firing is adjusted (by an assumed 50 per cent cO2 emission of gas relative to coal) to calculate the required gas firing capacity and hence required investment. Under these conditions, increased gas capacity relative to coal is required to replace cO2 in the portfolio.
49 For this fossil fuel fired scenario in 2020, the following is the assumed energy supply: -conventional coal firing 78 per cent, gas firing 16 per cent, hydro 4 per cent, other renewables 2 per cent.

energy technology for climate changew
ww
.atse.org.au
27Energy Technology for Climate Change: Accelerating the Technology Response
be installed under this scenario would amount to $65 billion (p50, in 2008 $), with a calculated p10 to p90 range between $56 billion and $76 billion. This number is significantly influenced by the solar technologies,with their high costs and low overall capacity factors, and the fact that more than nine GW of solar generation would be required in this assumed scenario, compared with 0.004 GW in 2007 (ESSA data). This would represent a very large increase in the application of solar energy in Australia under the scenario within a short period of time. Wind power generation also increases to around four GW, compared with 0.3 GW in 2007, an increase of over 1200 per cent in 12 years. Even gas-generated power would need to increase by 40 per cent under this scenario at the p50 level, taking into account the smaller overall capacity factor of intermittent new gas turbine facilities. Also, under this hypothetical scenario, 2.5 GW of CCS generating capacity would be required in 12 years’ time, representing commercial operation of (say) three large power stations with CO2 sequestration, each capturing and sequestering around eight million tonnes a year of CO2, depending on their efficiency. Again, this is a major technological advance when compared with where we stand now. If this CCS capacity is not developed by then, the supply capacity would need to be provided by even more wind, solar renewables or gas fired facilities amounting to at least 2.5 GW capacity.
Figure 1 shows the predicted cumulative probability distribution for investment costs predicted for the scenario from the probabilistic model. The p10 and p90 values are shown on this distribution (representing growth rates of 0.8 per cent and 2.2 per cent respectively). As can be seen, the p10 point represents an approximately $20 billion lower investment cost than the p90 point. This lower cost is primarily a function of the lower growth rate in consumption, although it does also take into account the lowest end of the technology investment cost estimations.
It is the Academy’s view that even the results from this simple scenario and the data shown in Table 4 and Figure 1 points towards the necessity for both accelerated technology demonstration and commercialisation of the technologies and the need for large energy savings to reduce growth in consumption towards the low end of the probability distribution (e.g. less than 0.8 per cent growth).
Cumulative proportion
65 9545 55 75 85
56
Mean = $65 billion
1.000
0.800
0.600
0.400
0.200
0.000
76
10%
Figure 1 Cumulative distribution of investment costs predicted for the 2020 scenario (p10 = $56 billion, p90 = $76 billion)
10%80%
Investment cost, $ billion
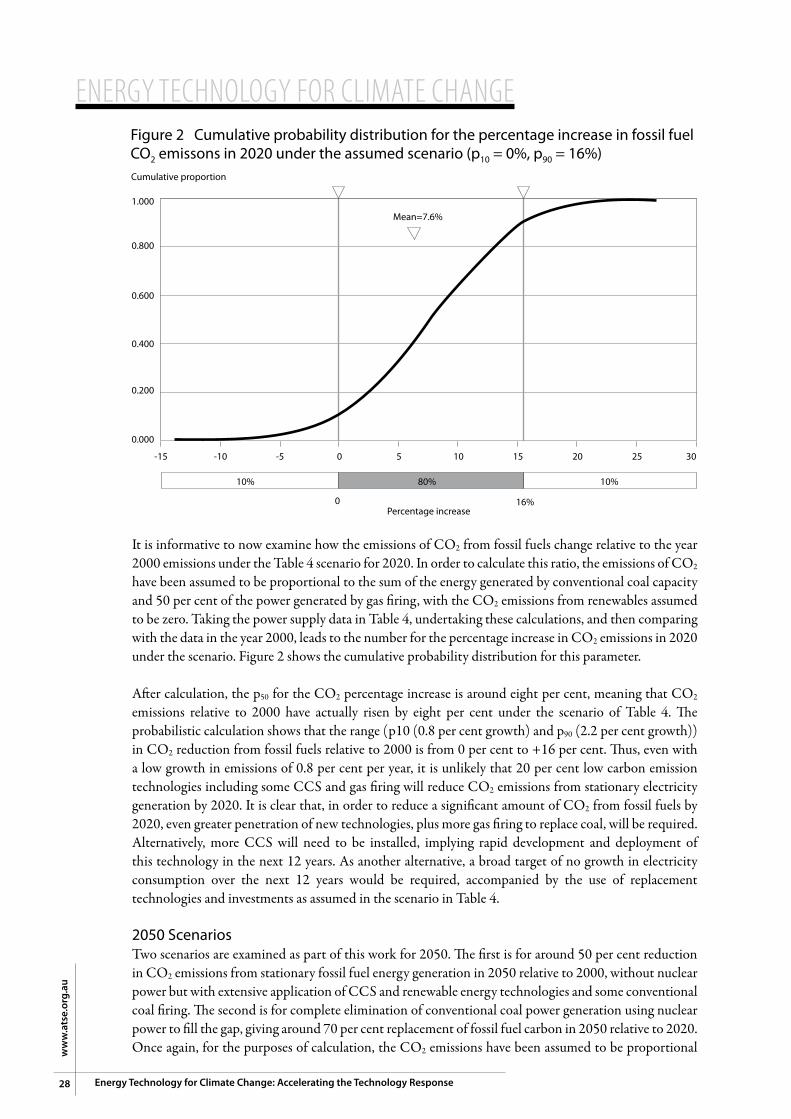
energy technology for climate change
28
ww
w.a
tse.
org.
au
Energy Technology for Climate Change: Accelerating the Technology Response
It is informative to now examine how the emissions of CO2 from fossil fuels change relative to the year 2000 emissions under the Table 4 scenario for 2020. In order to calculate this ratio, the emissions of CO2 have been assumed to be proportional to the sum of the energy generated by conventional coal capacity and 50 per cent of the power generated by gas firing, with the CO2 emissions from renewables assumed to be zero. Taking the power supply data in Table 4, undertaking these calculations, and then comparing with the data in the year 2000, leads to the number for the percentage increase in CO2 emissions in 2020 under the scenario. Figure 2 shows the cumulative probability distribution for this parameter.
After calculation, the p50 for the CO2 percentage increase is around eight per cent, meaning that CO2 emissions relative to 2000 have actually risen by eight per cent under the scenario of Table 4. The probabilistic calculation shows that the range (p10 (0.8 per cent growth) and p90 (2.2 per cent growth)) in CO2 reduction from fossil fuels relative to 2000 is from 0 per cent to +16 per cent. Thus, even with a low growth in emissions of 0.8 per cent per year, it is unlikely that 20 per cent low carbon emission technologies including some CCS and gas firing will reduce CO2 emissions from stationary electricity generation by 2020. It is clear that, in order to reduce a significant amount of CO2 from fossil fuels by 2020, even greater penetration of new technologies, plus more gas firing to replace coal, will be required. Alternatively, more CCS will need to be installed, implying rapid development and deployment of this technology in the next 12 years. As another alternative, a broad target of no growth in electricity consumption over the next 12 years would be required, accompanied by the use of replacement technologies and investments as assumed in the scenario in Table 4.
2050 ScenariosTwo scenarios are examined as part of this work for 2050. The first is for around 50 per cent reduction in CO2 emissions from stationary fossil fuel energy generation in 2050 relative to 2000, without nuclear power but with extensive application of CCS and renewable energy technologies and some conventional coal firing. The second is for complete elimination of conventional coal power generation using nuclear power to fill the gap, giving around 70 per cent replacement of fossil fuel carbon in 2050 relative to 2020. Once again, for the purposes of calculation, the CO2 emissions have been assumed to be proportional
Cumulative proportion
0 30-15 -10 -5 5 10 15 20 25
0
Mean=7.6%
1.000
0.800
0.600
0.400
0.200
0.000
16%
10% 10%
Figure 2 Cumulative probability distribution for the percentage increase in fossil fuel CO2 emissons in 2020 under the assumed scenario (p10 = 0%, p90 = 16%)
80%
Percentage increase

energy technology for climate changew
ww
.atse.org.au
29Energy Technology for Climate Change: Accelerating the Technology Response
to the energy generated from conventional coal firing plus 50 per cent of the energy from gas firing. Hypothetical portfolios of different technologies have been assumed and no attempt has been made to determine the technical feasibility of distribution and supply of electricity under the scenarios. In the case of nuclear power, political issues have been not taken into account. Other combinations of renewables, CCS, gas firing and nuclear power could have been assumed to achieve the same ends, although a higher proportion of renewables with low overall capacity factors could lead to system instability due to the need for turndown capacity of base-load supply when renewables are idle. The example scenarios are given to illustrate typical investment costs and levels of power substitution required.
Calculation of the probabilistic supply (based on the probabilistic growth assumptions) and the subsequent required capacity using the overall capacity factors for each technology listed in Table 2, has been made for each scenario. The generally lower unit investment costs for the technologies in 2050 relative to 2020 used for the investment cost calculations are given in Table 1 and the probabilistic parameters for each technology investment cost are given in the Appendix.
Once again, for the purposes of comparison only, a business-as-usual case that provides the increased 2050 capacity required through increases in solely in conventional coal firing and gas firing in the same ratio as 2007 has been calculated, with renewable energy supplies held constant. The assumed p50 growth rate in supply for this case is 1.4 per cent a year. Under these conditions the supply from renewables in 2050 totals about five per cent, with a 104 per cent increase in supply required at the p50 growth level relative to 2007. The purpose of this calculation is to examine what the investment cost would be under this mainly fossil fuel firing 2050 scenario50, as well as the magnitude of the CO2e emitted. By 2050, it is likely that most of the current coal-fired capacity would need to be replaced, and this has also been assumed for this business-as-usual calculation. The results of the calculation show that the extra investment cost would be around $101 billion to provide the fossil fuel-fired capacity at the p50 growth
Table 5 2050 Scenario 1 – 50 per cent reduction of CO2 emissions relative to 2000 without nuclear energy (p50)
proportion ofNet supply
(%)
Totalpercentage
(%)
CapacityRequired
(GW)
Additional CostsRequired (p50)
($B)TECHNOLOGYFossil fuels coal - ccS 20 20.0 51.4
coal – conventional 10 7.0 0
Oil 0 0 0 Gas - Steam 12 8.4 7.8Gas - Turbine 11 18.0 13.4
Fossil fuels 53 renewables biomass 3 2.1 4.2 Hydro 2 4.9 0 Solar PV 10 24.5 49.0 Solar Thermal 15 36.7 73.5 Wind 10 16.3 24.4 Wave 3 5.9 7.7 Geothermal 4 2.8 11.5
Renewable energy 47Nuclear 0 0 ToTal 100 146.6 242.9
50 For this fossil-fuel fired scenario in 2050, the following is the assumed energy supply: -conventional coal firing 79 per cent, gas firing 16 per cent, hydro 3.5 per cent, other renewables 1.5 per cent. The overall increase in demand relative to 2007 (p50) is 104 per cent.

energy technology for climate change
30
ww
w.a
tse.
org.
au
Energy Technology for Climate Change: Accelerating the Technology Response
level assuming a cost of $1.5/W for the conventional coal capacity and $1.3/W for the extra gas capacity, with overall capacity factors as in Table 5. Under these predominantly fossil fuel-fired conditions, the CO2e emissions are calculated to increase by 110 per cent by 2050, relative to 2000. This provides a base-line for comparison with the results in Table 5 for the assumed portfolio including renewables and CCS and Table 6 including nuclear energy.
Table 5 shows the portfolio of technologies assumed and calculated for the first 2050 technologies portfolio case, which yields around 50 per cent CO2e reduction relative to 2000. As can be seen, the investment cost for this combination of technologies is around $243 billion at the p50 level.
There are several important key issues that arise from the first 2050 technology scenario calculation shown in the Table. The first is that, for an energy supply growth rate of 1.4 per cent (p50), around 20 GW of CCS power capacity would be required. This also implies that, by 2050, about 150 million tonnes of CO2 per year will need to be sequestered in suitable sites if a reasonable level of CCS is included in the technology portfolio, depending on the efficiency of the boiler and carbon capture and sequestering technologies.
Under the same scenario in Table 5 at the p50 level, around 60 GW of solar capacity would also be needed, either in the form of solar PV or solar thermal generation, while about 16 GW of wind power capacity would additionally be needed. This wind power capacity requirement is approximately 50 times current levels, while the solar capacity requirement is approximately six times higher than a 2kW PV unit on five million house roofs in Australia. This implies that, if solar energy is to make a substantial contribution to Australia’s CO2 reduction, it will need to be not only distributed but also comprise large centralised generation facilities at suitable sites.
The CO2 replacement relative to 2020 emissions for the above first 2050 scenario is calculated to be 48 per cent at the p50 level. The range in this parameter is approximately 35 per cent (p90 = 2.2 per cent/year growth) to 60 per cent (p10 = 0.8 per cent/year growth) for this case.
Table 6 2050 Scenario 1 – 70 per cent reduction of CO2 emissions relative to 2000, including nuclear energy (p50)
proportion ofNet supply
(%)
Totalpercentage
(%)
CapacityRequired
(GW)
AdditionalCosts
Required(p50)($B)
TECHNOLOGYFossil fuels coal - ccS 17 17.0 43.7
coal – conventional
0 0 0
Oil 0 0 0 Gas - Steam 12 8.4 7.8Gas - Turbine 11 18.0 13.4
Fossil fuels 40 renewables biomass 2 1.4 2.8 Hydro 2 4.9 0 Solar PV 10 24.5 49.0 Solar Thermal 15 36.7 73.5 Wind 10 16.3 24.4 Wave 2 3.9 5.1 Geothermal 4 2.8 11.5 Renewable energy 45 Nuclear Nuclear 15 10.5 21.0 ToTal 100 144.4 252.2

energy technology for climate changew
ww
.atse.org.au
31Energy Technology for Climate Change: Accelerating the Technology Response
As mentioned previously, investment costs to provide the electrical generating capacity for the scenario by 2050 are calculated as $243 billion (p50, in 2008 $). The range is from $180 billion (p10) to $305 billion (p90). These costs are dominated by the technologies with low overall capacity factor (e.g. for 25 per cent of supply provided by solar, the cost is $122 billion (p50) or 50 per cent of the total, even though costs have decreased through the learning curve by then.)
The second part of the assumed scenarios for 2050 involves substitution of nuclear power for the remaining conventional coal fired capacity with other minor adjustments to the technology portfolio, as shown in Table 6.
The investment cost in this second 2050 scenario does not change appreciably from the first (it shows an increase of approximately $10 billion to $252 billion; range $185 billion to $315 billion). However, the introduction of nuclear power has increased the p50 CO2 reduction ratio relative to 2020 to 72 per cent (range 66 per cent (p90) to 79 per cent (p10)). This shows the ability of nuclear power to make deep cuts in CO2 emissions and clearly a percentage of supply greater than 15 per cent could be deployed in any future technology portfolio to achieve further reductions.
The two scenarios considered above, namely the non-nuclear and nuclear scenarios, indicate that the investment cost in electricity generating plant will be some $250 billion by the year 2050 in order to achieve a 50 to 70 per cent reduction in CO2 emissions from a baseline in the year 2000. This represents some $6 billion per annum (2008 $) over the next 40 years.
Figure 3 shows a summary of the results presented above in terms of the reduction in CO2e emissions, while Figure 4 shows a summary in terms of the investment costs, both for the period to 2050. In these figures, the business-as-usual case is based on the 1.4 per cent supply growth p50 value, with new capacity mainly supplied by conventional coal fired capacity, as described above. The business-as-usual case also assumes that all present conventional coal fired capacity is replaced by 2050. The assumed scenarios cover the ranges in values presented above for the assumed new technology portfolios. In Figure 4, the net investment cost for the new technologies is represented by the difference between the business-as-usual and the new technology scenario costs.
In order to compare the 2050 scenario (without nuclear) described above with the recent Australian Government Treasury Report, the Treasury scenario CPRS-5 has been examined here under the same
Figure 3 Summary of the results for the change in CO2e emissions under the business-as-usual and new technology scenario cases
Chan
ge in
CO
2e e
mis
sion
s (%
)
+100%
0
–100%
2000 20502040203020202010year
Business as usual,1.4% growth
Application of new technologiesunder the assumed scenarios
decrease
increase

energy technology for climate change
32
ww
w.a
tse.
org.
au
Energy Technology for Climate Change: Accelerating the Technology Response
terms. The Treasury scenario calculates a changing growth rate in demand from now to 2050 as a function of carbon price. The Treasury predicted future electricity demand for CPRS-5 in 2050 is lower than the p50 estimate used in this work because of lower electricity demand associated with the CPRS (350 GWhe/yr compared to 429 GWhe/yr, respectively). After some calculation, converting renewable energy capacities into electricity supply51 using overall capacity factors from Table 3, it is found that the CPRS-5 scenario assumes greater use of carbon capture and storage (CCS) and geothermal energy generation, and less solar than our scenario above52. That is, we have assumed here – compared with Treasury modelling – that (i) CCS will be more difficult to achieve technologically; (ii) that there will be marginally greater cost reduction learning to 2050 by solar technologies; (iii) and that there are higher initial costs per watt for geothermal energy. Nevertheless, the predicted investment cost using the Treasury data under CPRS-5 is $171 billion in 2050 (2008 $), which is of the same order to the above when corrected for the difference in the electricity growth assumptions53. It can therefore be concluded that the cost results from the present work generally align with the Treasury report when the small differences in the assumptions are taken into account and given the difficulties of predicting the technology portfolio and electricity demand in 40 years’ time.
The IEA54 has considered a scenario in which electricity is projected to grow at 1.9 per cent a year and new technologies are required to achieve a global reduction of CO2 emissions by 50 per cent from current levels by 2050 (to 14 Gt CO2 per annum). The IEA shows that under this scenario a global investment level of US$16.5 trillion is required by the year 2050. Since Australia generates around 1.25 per cent of global electricity, this would imply an investment in Australia in the order of A$215 billion; or approximately A$5 billion a year for the next 40 years, a result similar to that presented above. Accordingly, there is general consistency between the ATSE, Treasury and IEA (pro rata) estimates for the investments required for electricity generating plants to 2050, notwithstanding the different growth rates used in the calculations.
Figure 4 Summary of the results for the investment cost under the business-as-usual and new technology scenario cases
Cum
ulat
ive
inve
stm
ent c
ost (
$B)
2000 20502040203020202010year
Application of new technologiesunder the assumed scenarios
Business as usual,1.4% growth
200
100
0
300
51 commonwealth of Australia, 2008, Australia’s Low Pollution Future – The Economics of Climate Change Mitigation, The Treasury, commonwealth of Australia, October, pp.174-179.
52 It can be calculated that Treasury cPrS-5 models yield that the supply proportions in 2050 (using the capacity factors in this work) are ccS 31 per cent, gas 19 per cent, solar 5 per cent, wind 13 per cent, hydro 5 per cent, biomass 4 per cent and geothermal 22 per cent.
53 equivalent to an investment cost of $210 billion, compared with $243 billion in this work.54 International energy Agency, 2008, Energy Technology Perspectives: Scenarios and Strategies to 2050, OecD / IeA.
energy technology for climate changew
ww
.atse.org.au
33Energy Technology for Climate Change: Accelerating the Technology Response
4 conclusions from the Scenario Analyses
The analysis presented here reveals there is a major challenge in terms of what needs to be done technically in order to reach the emission targets being proposed politically. A number of key conclusions follow.
Calculations undertaken separately for the different growth rates, and not considering distribution of the investment costs for the technologies, show that reducing energy demand growth from 2.2 per cent a year to 0.8 per cent a year saves around $150 billion in investment costs in electricity capacity by 2050. Relentless development and application of energy savings technologies and approaches therefore need to be high priority and this needs to be sustained if targets are to be met. As shown by the recent report by the Treasury55, an increasing carbon price by the proposed CPRS will also reduce demand and increase energy use efficiency, leading to lower generation investment costs.
RD&D on CCS for coal-fired electricity generation should be a high priority. A large base-load supply is necessary and this cannot be supplied entirely by renewable technologies. Without CCS, targets will not be reached without large application of gas firing (which reduces CO2 emissions by around 50 per cent relative to coal) or the use of nuclear energy. It will be particularly important to undertake demonstration of CCS technology at large scale.
Storage technologies for solar energy that increase the time over which energy can be supplied should be supported to allow solar energy generation to be a higher proportion of the energy mix at high demand periods. Participation and support should be given to local and overseas RD&D in this area, as well as to efforts aimed at increasing the efficiency and lowering the costs of solar PV and solar thermal technologies. Large scale demonstration facilities in Australia may also be warranted to commercially test technologies such as solar energy storage.
Geothermal technologies are currently high cost and located remotely. If successful, geothermal generation offers sustainable electrical energy generation at high overall capacity factor, and its development should be supported.
The existing RD&D programs underway on clean energy should continue to be supported and enhanced. The programs include: Renewable Energy Fund ($500 million – geothermal, biofuels), Energy Innovation Fund ($150 million – solar, clean energy), National Low-Emissions Coal Initiative ($500 million – focussed on carbon capture and new boiler technologies), the Otway demonstration facility (CO2CRC), and other existing programs and projects.
In aggregate, it is very likely (more than 90 per cent confidence) that, based on the probabilistic estimates provided by Academy Fellows for the individual technologies, and with sufficient RD&D and commercial deployment, an appropriate technology portfolio can be deployed to meet stringent emission reduction targets in the future for electricity generation. The economic viability of such a technology portfolio, however, will depend on the future price of carbon and any government investment incentives, as well as the costs of the technologies themselves at commercial scale.
55 commonwealth of Australia, 2008, Australia’s Low Pollution Future – The economics of climate change mitigation, The Treasury, commonwealth of Australia, October, p.172.

energy technology for climate change
34
ww
w.a
tse.
org.
au
Energy Technology for Climate Change: Accelerating the Technology Response
As mentioned previously, overall capacity factors56 are generally low for renewable technologies and this leads to high investment costs. The national energy market also plays a role in determining overall capacity factors and efforts will need to be made to optimise this market in the future to maximise the overall capacity factors and hence capital efficiency for the suite of new technologies.
RD&D will be important in reducing the costs and increasing the likelihood of commercial success of the new technologies. Some areas that should be addressed by RD&D for key stationary energy technologies are:¢ Coal-fired technologies:¢ design for improvement in coal-fired boiler efficiency;¢ integrated Gasification Combined Cycle generation (IGCC); and¢ advanced technology for power generation (e.g. fluidised bed with IGCC, supercritical steam).
¢ CCS:¢ coal combustion and gasification technology in CO2 and oxygen mixtures, including coal-natural
gas mixtures;¢ boiler and gasifier design;¢ engineering design for capital cost reduction;¢ process technology for CO2 capture;¢ geology and reservoir engineering for CO2 storage; and¢ demonstration at commercial scale of the integrated CCS process.
¢ Solar:¢ production of low-cost and hyperpure silicon for PV;¢ design of PV cells and solar collectors to increase collection efficiency;¢ energy storage technologies integrated with the solar generator;¢ demonstration of solar processes at commercial scale; and¢ participation in international consortia aimed at large scale application.
¢ Geothermal:¢ cost reduction of the drilling and stimulation processes; and¢ demonstration of the geothermal process at commercial scale.
¢ Gas:¢ coal seam methane extraction technology at commercial scale; ¢ utilisation of coal seam methane in efficient generation facilities; and¢ cost minimisation of gas power facilities.
¢ General:¢ electricity transmission technologies; and¢ smart technologies for energy distribution.
56 A key parameter in dictating the investment cost of new technologies is the operational “capacity factor” of the technology. This factor is the ratio of actual power delivered over time to the peak power generation capacity.

energy technology for climate changew
ww
.atse.org.au
35Energy Technology for Climate Change: Accelerating the Technology Response
5 Gap between rD&D and Deployment
This section discusses the transition required from research, development and demonstration (RD&D) to the subsequent deployment of those technologies at commercial scale.
5.1 R&D Estimates from the this Academy study indicate that the required basic research57 cost, not including demonstration, for new technologies in electricity generating plant is around A$500 million by the year 2015. Further research would be required after this date depending on the outcomes of the work up until then.
For comparison, the IEA58 has noted that the current level of global RD&D spending is far from enough required to accelerate cost reductions and the technical improvements of existing as well as new technologies. While the IEA notes that even a doubling of current levels of investment may not be enough, various studies have concluded that three to 10 times the current level of RD&D spending is needed.
5.2 DEMONSTRATION & DEPlOyMENT AND COSTSThe estimate from this project for the cost of single demonstration of the required technologies (up to 1 GW scale) is about A$6 billion, primarily before 2020; this represents a rate of more than $500 million a year59 each year until then.
From another viewpoint, if Australia’s share of the global RD&D60 outlay is held at the same percentage as electrical generation, then the International Energy Agency’s (IEA) deployment61 estimate US$3,800 billion from now to 2050 would imply a deployment investment in Australia in the order of A$1.4 billion a year for each of the next 40 years, based on Australia generating around 1.25 per cent of the world’s electricity.
While RD&D costs are significant, the costs of commercialisation are significantly greater, often by an order of magnitude.
5.3 vAllEy Of DEAThMoving from publicly-funded demonstration to commercial viability is often the most difficult phase for many technologies, resulting in what various observers have called a ‘valley of death’. It is at this point, where investment costs can involve billions of dollars and where technical and commercial risks also remain significant, that projects can easily fail. Frequently, neither the public nor the private sector considers it their duty to finance commercialisation. This is where neither ‘technology-push’ force nor ‘market-pull’ force has sufficient strength to fill the gap. This funding gap is particularly problematic
57 Australia spent $988 million on energy r&D in 2004-05. About 72 per cent was directed at finding and developing energy resources and 28 per cent at improving the quantity and efficiency of energy supply. The government has recently announced new spending for clean coal technologies and renewable energy technologies.
58 International energy Agency, 2008, Energy Technology Perspectives: Scenarios and Strategies to 2050, OecD / IeA.59 Note that Deployment costs and Demonstration costs are not directly comparable.60 research, Development and Demonstration61 Deployment costs represent the total costs of cumulative production needed for new technology to become competitive with the
current, incumbent technology.

energy technology for climate change
36
ww
w.a
tse.
org.
au
Energy Technology for Climate Change: Accelerating the Technology Response
for technologies with long lead times and a need for considerable applied research and testing between invention and commercialisation, as is the case for many new energy technologies.
Navigating the ‘valley of death’ towards successful technology application in the energy field normally requires very high levels of capital investment and high technological risk. Under such circumstances, governments normally provide support and a variety of policy tools can be deployed (such as grants, tax credits, production subsidies, or guaranteed procurements) and knowledge access support (e.g. the codification and diffusion of generated technical knowledge) and spin-off companies.
Technology learning normally occurs during deployment as economies of scale are established and as progressive product improvements result in reductions in the unit capital costs. Deployment costs represent the total costs of cumulative production needed for new technology to become competitive with the current, incumbent technology.

energy technology for climate changew
ww
.atse.org.au
37Energy Technology for Climate Change: Accelerating the Technology Response
6 Policy IssuesThis Academy project has provided estimates of the level of funding required to support the introduction on new low-emission technologies applicable for electricity generation in Australia.
Australia’s competitive electricity market, where electricity prices vary according to demand, itself leads to the adoption of new technologies depending on their delivered electricity cost. Future electricity generation policies should not interfere with this market mechanism for improvement.
The Government has recognised that a strong stimulus must be provided to support the necessary RD&D of new energy technologies and to this end has established a range of funding programs. State governments have also committed funding to similar objectives. These programs all have different funding levels, timings and matching fund requirements. Many are relatively new but together they would appear to result in an investment in low-emissions technology development of less that $500 million a year if all government contributions were matched with funds from other sources. Based on the IEA and Australian future low-carbon technology portfolio scenarios a much greater effort is required in this area.
Consistent with the Garnaut Review, ATSE strongly supports the need for an over-arching Energy Research Council to oversight these various programs, to identify gaps, avoid duplication, avoid ‘double-dipping’ and ensure quality. The different programs may still need their own guidelines and administration but need to be co-ordinated so that the best possible results are obtained from the investment made.
A major function of the Energy Research Council would be to identify worthy projects being proposed that could not obtain government funding due to budgetary constraints or because they did not fit within the guidelines of any of the funding programs. In this way the allocation to low-emission energy research could become market and research capacity-driven, rather than constrained by an arbitrarily set budget allocation. The Energy Research Council would recommend annually to government(s) the appropriate level of Emission Trading permit revenue that should be allocated to research, development and commercialisation, based on ensuring that all the worthy applications for support would receive their required funding.
For research and research commercialisation, ATSE holds the view that matching grants are the most efficient and transparent means to ensure sufficient resources are allocated to low-emission and energy-efficiency technologies. It needs to be recognised that most energy technologies are particularly susceptible to the ‘valley-of-death’ problem, the large investment required to bridge the transition from a laboratory-proven concept to a low-risk commercial operation. By their nature, energy technologies are far more capital-intensive than other areas, such as ICT and medicine, and high initial capital costs are normally reduced over time through technology learning. This, along with the acknowledged externalities that arise, justifies additional government support measures, such as through granting scheme mechanisms62 or through the taxation system by allowing accelerated depreciation or tax credits on new equipment aimed at greenhouse gas abatement or improved energy efficiency.
To accelerate the rate of research and investment in emission reduction technology, any funding program should be established for only a limited time, possibly 10 years, so firms will be encouraged to invest earlier and more extensively than they would otherwise have done.
62 This may include funding from existing rD&D schemes or through revenue gained from an emissions Trading scheme.

energy technology for climate change
38
ww
w.a
tse.
org.
au
Energy Technology for Climate Change: Accelerating the Technology Response
ATSE further takes the view that the ‘valley of death’ that intervenes between demonstration and commercial viability can additionally be bridged by a guaranteed procurement scheme. In Germany, guaranteed procurement in the form of a substantial feed-in tariff has been the driving force behind the commercial deployment of solar electricity. Government support via a guaranteed procurement mechanism should be attractive to government because government’s cost is contingent on success, not speculation. It should also be attractive to developers because banks and other financial investors can take the guaranteed procurement revenue into account when calculating the risk profile and the return on investment.

energy technology for climate changew
ww
.atse.org.au
39Energy Technology for Climate Change: Accelerating the Technology Response
AppendixThe following assumptions have been made in order to calculate the costs and CO2 reduction results in the report:
1 gENERATINg PlANT63 AND COAl PROPERTIES64
CO2 Emissions65
black coal = 890 kg cO2/mWhe
brown coal = 1160 kg cO2/mWhe
2 PROBABIlISTIC CAlCulATIONS2007 power generation and plant capacity data are taken from Electricity Supply Association of Australia (ESSA); see reference below.
2000 data is calculated from 2007 data assuming 1.2 per cent growth 2000–07.
Fossil fuel CO2 emissions are not calculated, but assumed proportional to power generation from coal plus 50 per cent of power generated from natural gas.
All probabilistic distributions are assumed as normal distributions, with p50=mean, and p10 and p90 the 10th percentile and the 90th percentile in the cumulative distribution, respectively.
Principal generating plant Black Coal GW capacity Brown Coal GW capacity
NSW 11.7 Vic 6.5Qld 8.1 Tas 0.2SA SA 0.8WA 1.3
Total 21.1 7.5ToTal 28.6
Percentage black coal = 21.1/28.6 = 75%Generating efficiency = 30%
Coal properties property Black Coal Brown Coalmoisture (as delivered) 10% 60%Ash (as delivered) 15% 4%Specific energy (as delivered) 28 mJ/kg 11 mJ/kgcarbon content (daf*) 80% 65%
* daf = dry ash free; that is, coal composition after moisture and ash have been removed
63 electrical Supply Association of Australia (eSAA), Electricity Gas Australia 2008, pp.14-17.64 (i) NSW Department of mineral resources, Australian Coal, http:www.railpage.org.au/articles/coal.html
(ii) coal chemistry, energy Technology centre, morwell, Vic, http://www.powerworks.com.au/chemistry.pdf65 Johnson T and Pleasance G, 1996, Clean Coal Technology for Brown Coal Power Generation, coal Utilisation, The Australian coal review,
Victoria, October. http://www.australiancoal.csiro.au/pdfs/Johnson%20Pleasance.pdf

energy technology for climate change
40
ww
w.a
tse.
org.
au
Energy Technology for Climate Change: Accelerating the Technology Response
The range in growth in demand into the future is assumed as a distribution with p10=0.8 per cent/yr, p50=1.4 per cent/yr, p90=2.2 per cent/yr.
The averages and ranges in 2020 and 2050 investment costs for technologies are taken from expert Academy Fellow advice and from IEA learning curve data66, as follows:
The calculation of energy supplied from the power generated for the new technologies in replacing the energy generated from existing coal fired facilities is calculated from the assumed overall capacity factors given in Table 3 in the text. For CCS, account is taken of the an assumed 30 per cent loss in efficiency as a result of the CCS process while, for base-load gas firing, account is taken of its lower CO2 emission, assumed as 50 per cent of that for coal. The replacement of CO2 is assumed to be proportional to the coal fired energy replaced due to utilisation of the new technologies. In the case of gas firing, it is proportional to the coal fired energy replaced less the CO2 generated by the utilisation of gas firing as a replacement technology.
2020$
$/W 2050$
$/W
biomass IGcc 1.8 p10 biomass IGcc 1.5 p102.5 2.5 p50 2.0 2.0 p50 3.0 p90 2.5 p90
Solar PV 4.0 p10 Solar PV 1.5 p105.0 5.0 p50 2.0 2.0 p50 7.0 p90 2.5 p90
Solar Thermal 2.5 p10 Solar Thermal 1.5 p103.0 3.0 p50 2.0 2.0 p50 3.5 p90 2.5 p90
Wind 1.75 p10 Wind 1.25 p102.0 2.0 p50 1.5 1.5 p50 2.25 p90 2.0 p90
Wave 1.2 p10 Wave 1.0 p101.5 1.5 p50 1.3 1.3 p50 2.0 p90 2.0 p90
Geothermal 4.5 p10 Geothermal 3.0 p106.0 6.0 p50 4.0 4.0 p50 7.0 p90 6.0 p90
Nuclear 1.5 p10 Nuclear 1.5 p102.0 2.0 p50 2.0 2.0 p50 2.5 p90 2.5 p90
Gas (Steam) 1.2 p10 Gas (Steam) 1.2 p101.5 1.5 p50 1.3 1.3 p50 1.8 p90 1.5 p90
Gas (IGcc) 1.2 p10 Gas (IGcc) 1.2 p101.5 1.5 p50 1.3 1.3 p50 1.8 p90 1.5 p90
ccS 2.5 p10 ccS 2.0 p103.5 3.5 p50 2.5 2.5 p50 4.5 p90 3.0 p90
66 International energy Agency, 2008, Energy Technology Perspectives: Scenarios and Strategies to 2050, OecD / IeA, Paris. refer to: ‘Deployment and Technology Learning’, chapter 5, pp.201-219 of this reference.

energy technology for climate changew
ww
.atse.org.au
41Energy Technology for Climate Change: Accelerating the Technology Response
AcronymsABWR Advanced Boiling Water Reactor AP1000 Westinghouse Electric PWRATR Accelerating the Technology ResponseATSE Australian Academy of Technological Sciences and EngineeringBWR Boiling Water Reactor°C degrees Celsius CANDU Canadian Deuterium Uranium ReactorCCG Cycle Steam Generation CCS Carbon Capture and Storage (capture and storage of carbon dioxide) CO Carbon monoxideCO2CRC Cooperative Research Centre for Greenhouse Gas TechnologiesCPRS Carbon Pollution Reduction SchemeCSM Coal Seam MethaneEPC Engineering, Procurement and Construction EPR Areva European Pressurised ReactorEPRI Electric Power Research Institute ESAA Electrical Supply Association of Australia GHG Greenhouse GasesGW gigawatt (1 GW = 109 W)GWe gigawattGWhe gigawatt-hourh hourH2 HyrdrogenIEA International Energy Agency IGCC Integrated Gasification Combined Cycle J joule (SI unit of work or energy – work done by a force of 1 Newton over 1 m)kJ kilojoulekW kilowattLEU Low-enriched Uranium LWR Light Water ReactorMEA Monoethanolamine Mt megatonne (1 Mt = 1,000,000 tonnes)Mt/yr megatonne per yearMW megawatt (1 MW = 106 W)MW/h megawatt per hourNPV Net Present Value OECD Organisation for Economic Co-Operation and Development OWC Oscillating Water Column PV Photovoltaics (solar)PWR Pressurised Water ReactorR&D Research and developmentRBMK Russian high powered channel reactorRD&D Research, development and demonstrationST Solar Thermal System 80 Westinghouse Electric PWRTWhe terawatt-hour (T = 1012)UMPNER Uranium Mining Processing and Nuclear Energy ReviewVVER Russian version of PWRW watt (1W = 1J/s)WNA World Nuclear Association yr year

energy technology for climate change
42
ww
w.a
tse.
org.
au
Energy Technology for Climate Change: Accelerating the Technology Response

ATSE – in briefThe Academy of Technological Sciences and Engineering (ATSE) is an independent, non-government organisation, promoting the development and adoption of existing and new technologies that will improve and sustain our society and economy.
ATSE consists of more than 750 eminent Australian Fellows and was founded in 1976 to recognise and promote the outstanding achievement of Australian scientists, engineers and technologists.
ATSE provides a national forum for discussion and debate of critical issues about Australia’s future, especially the impact of science, engineering and technology on quality of life.
ATSE links Australia with leading international bodies and worldwide expertise in the technological sciences and engineering.
ATSE fosters excellence in science, engineering and technology research and the critical education systems that underpin Australia’s capacity in these areas.
ATSE tackles many of the most difficult issues governing our future, by offering fresh ideas, practical solutions and sound policy advice – and putting them on the public record.

Energy Technology for Climate Change: Accelerating the Technology Response
© Australian Academy of Technological Sciences and Engineering
The Australian Academy of Technological Sciences and Engineering (ATSE)
ATSE OfficeIan McLennan House197 Royal ParadeParkville VICTORIA 3052AUSTRALIA
Mail addressPO Box 355Parkville VICTORIA 3052AUSTRALIA
Phone(03) 9340 1200 (National)(613) 9340 1200 (International)
Fax(03) 9347 8237 (National)(613) 9347 8237 (International)
[email protected] [email protected]
Websiteswww.atse.org.auwww.crawfordfund.org www.cluniesross.org.au
Cover: Energy from the sun – the National Solar Energy Centre, Newcastle.Photo: Stefan Moore