energy year 2014 electricity 21.1.2015 finnish energy industries
TRANSCRIPT
Energy Year 2014
Electricity
21.1.2015Finnish Energy Industries
21.1.2015
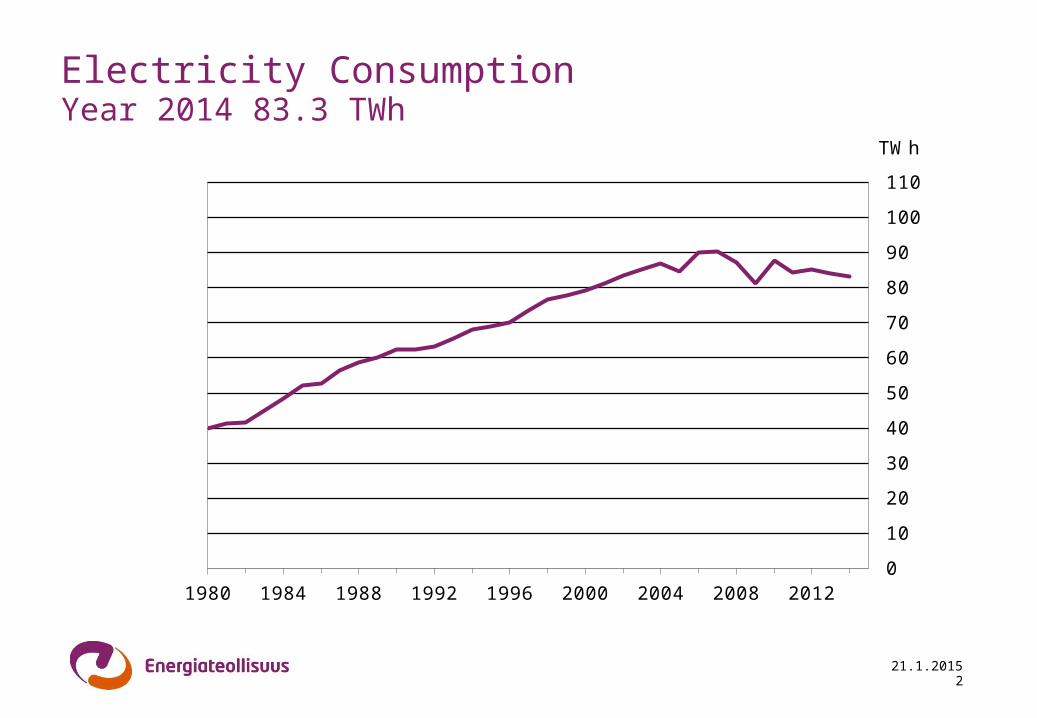
Electricity ConsumptionYear 2014 83.3 TWh
0
10
20
30
40
50
60
70
80
90
100
110
1980 1984 1988 1992 1996 2000 2004 2008 2012
TWh
2
21.1.2015
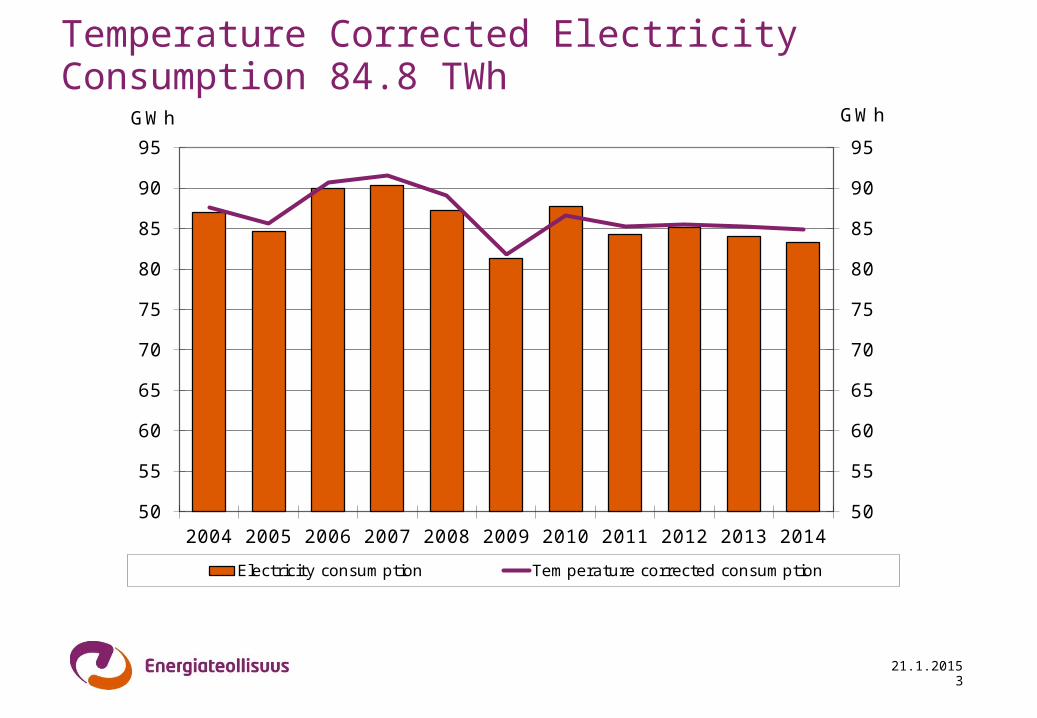
Temperature Corrected Electricity Consumption 84.8 TWh
50
55
60
65
70
75
80
85
90
95
50
55
60
65
70
75
80
85
90
95
2004 2005 2006 2007 2008 2009 2010 2011 2012 2013 2014
GWhGWh
Electricity consumption Temperature corrected consumption
3
21.1.2015
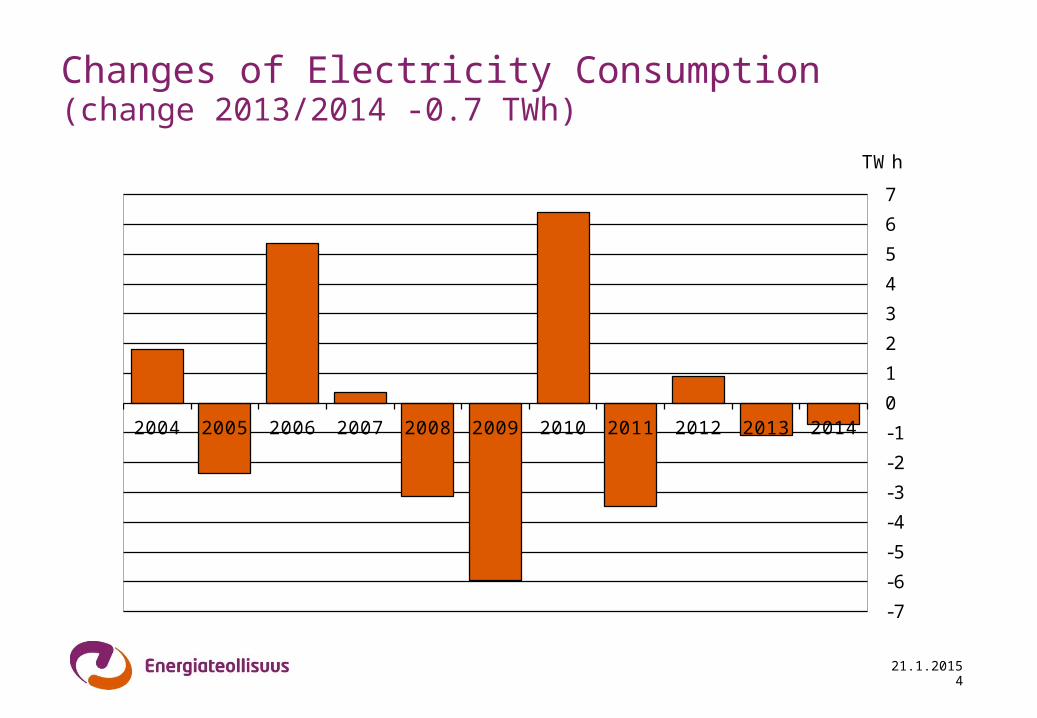
Changes of Electricity Consumption (change 2013/2014 -0.7 TWh)
-7
-6
-5
-4
-3
-2
-1
0
1
2
3
4
5
6
7
2004 2005 2006 2007 2008 2009 2010 2011 2012 2013 2014
TWh
4
21.1.2015
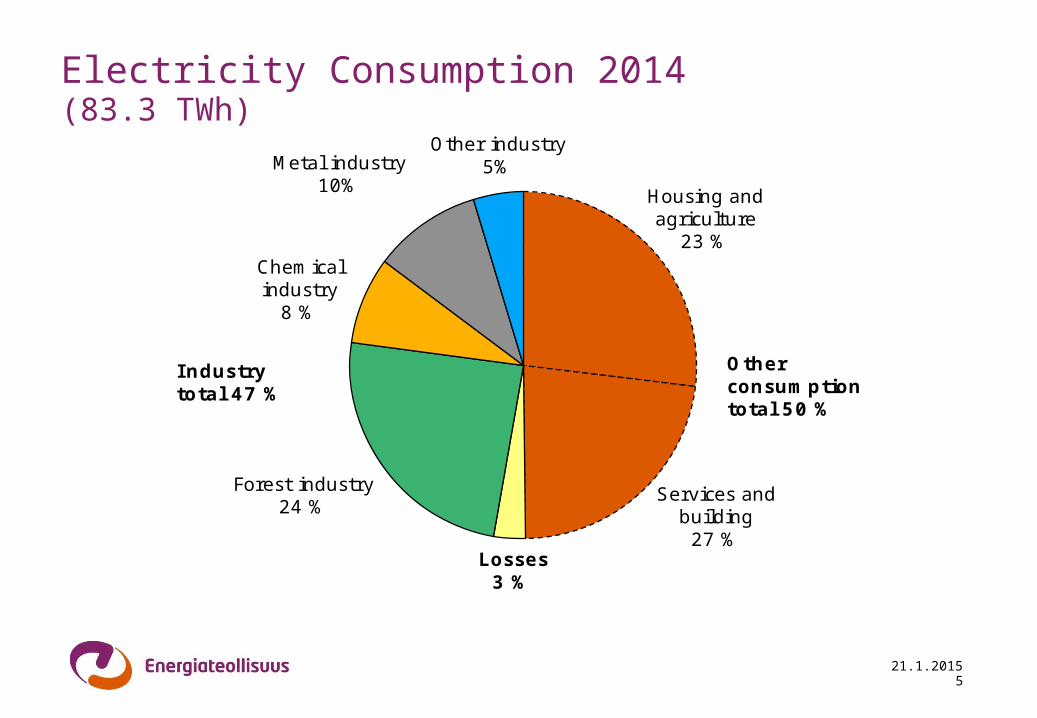
Electricity Consumption 2014(83.3 TWh)
Housing and agriculture
23 %
Services and building
27 %Losses
3 %
Forest industry24 %
Chemical industry
8 %
Metal industry10%
Other industry5%
Other consumption total 50 %
Industry total 47 %
5
21.1.2015
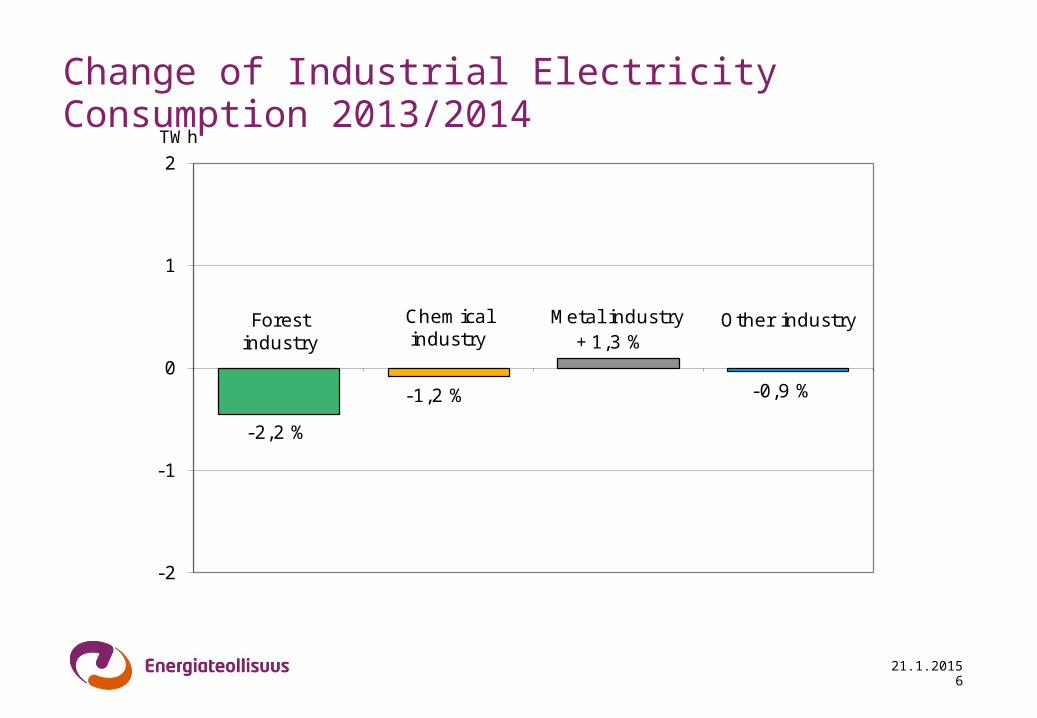
Change of Industrial Electricity Consumption 2013/2014
Forest industry
Chemical industry
Metal industry Other industry
-2
-1
0
1
2TWh
-2,2 %
-1,2 %
+1,3 %
-0,9 %
6
21.1.2015
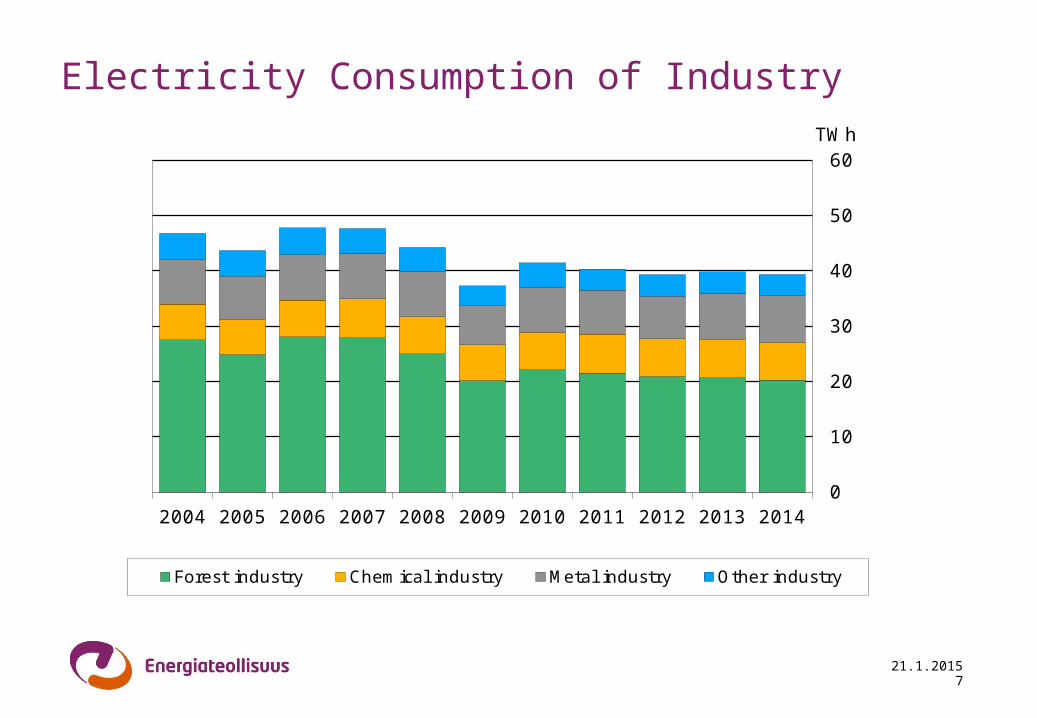
Electricity Consumption of Industry
0
10
20
30
40
50
60
2004 2005 2006 2007 2008 2009 2010 2011 2012 2013 2014
TWh
Forest industry Chemical industry Metal industry Other industry
7
21.1.2015
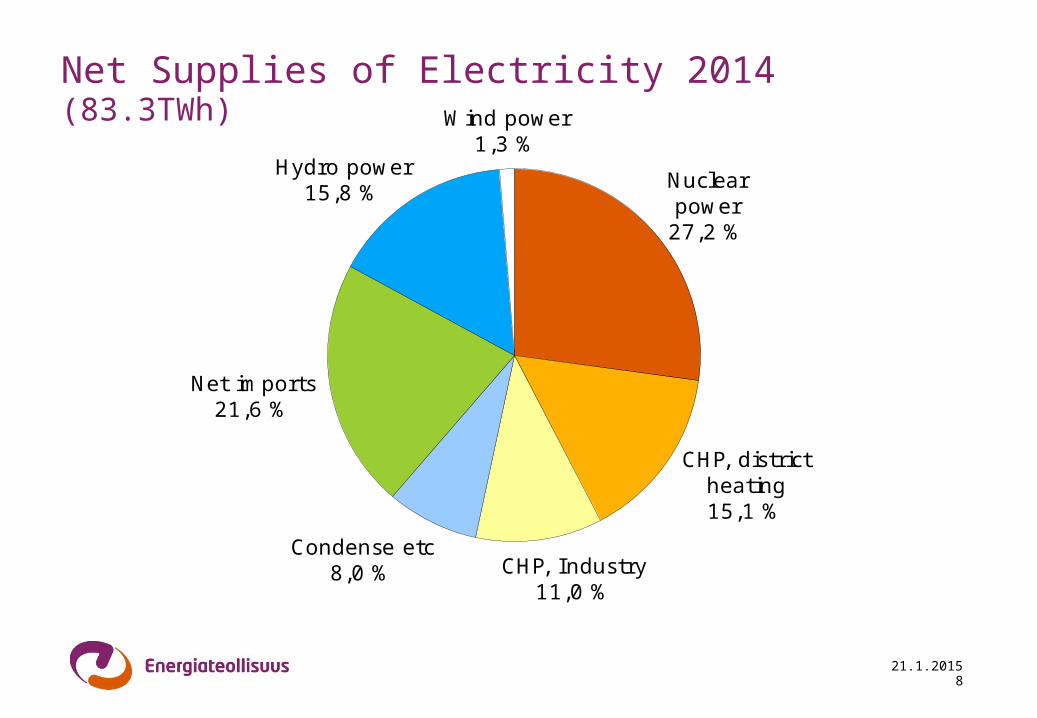
Net Supplies of Electricity 2014(83.3TWh)
Nuclear power27,2 %
CHP, district heating15,1 %
CHP, Industry11,0 %
Condense etc8,0 %
Net imports21,6 %
Hydro power15,8 %
Wind power1,3 %
8
21.1.2015
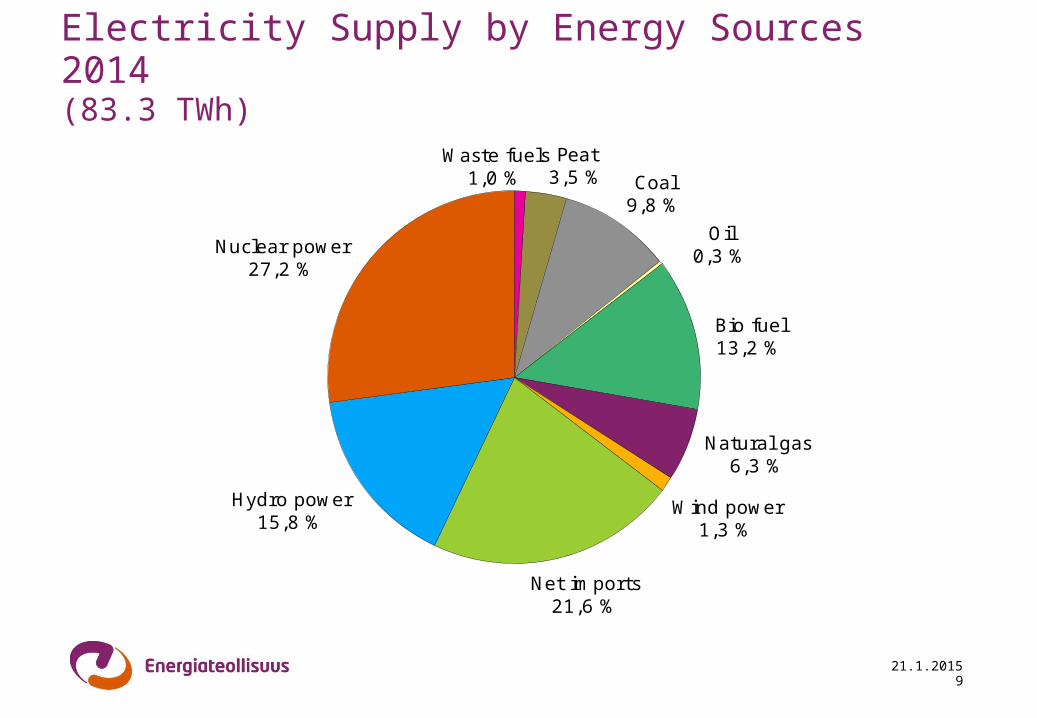
Electricity Supply by Energy Sources 2014(83.3 TWh)
Waste fuels1,0 %
Peat3,5 % Coal
9,8 %
Oil 0,3 %
Bio fuel13,2 %
Natural gas6,3 %
Wind power1,3 %
Net imports21,6 %
Hydro power15,8 %
Nuclear power27,2 %
9
21.1.2015
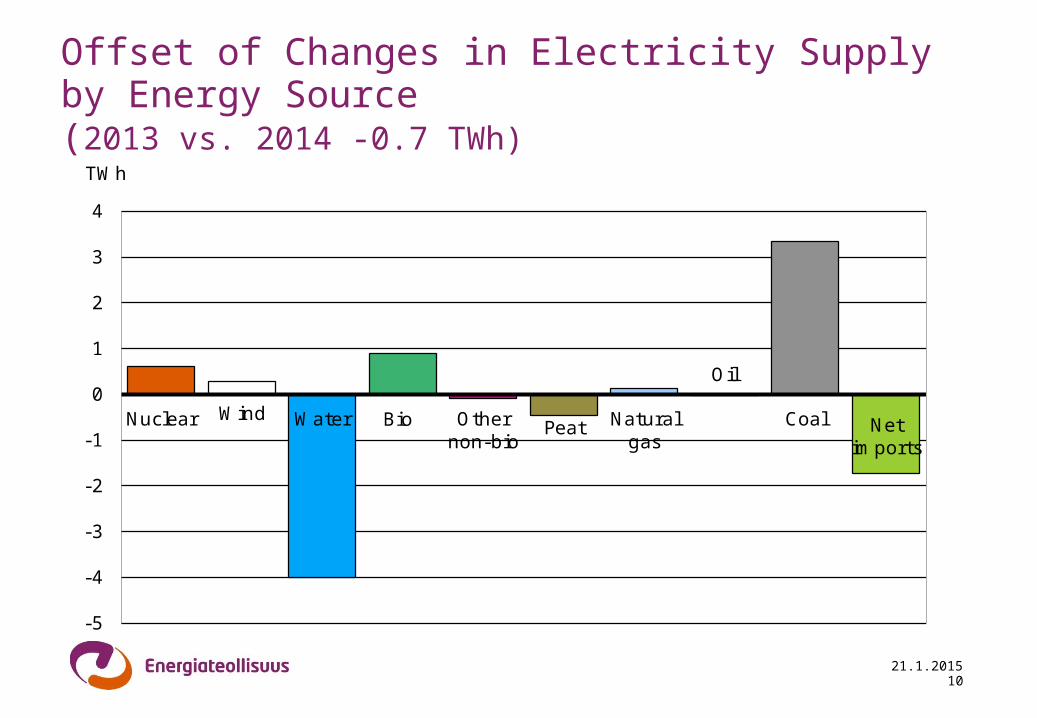
Offset of Changes in Electricity Supply by Energy Source (2013 vs. 2014 -0.7 TWh)
Wind Bio Peat
Oil
Net imports
-5
-4
-3
-2
-1
0
1
2
3
4
Nuclear Water Othernon-bio
Naturalgas
Coal
TWh
10
21.1.2015
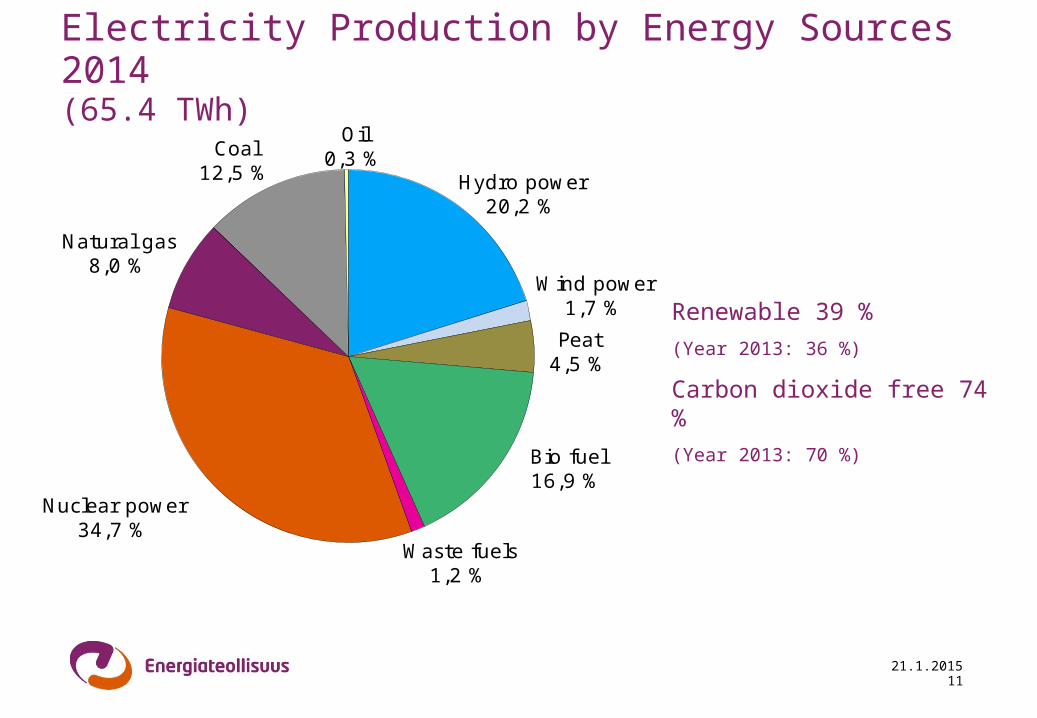
Electricity Production by Energy Sources 2014(65.4 TWh)
Renewable 39 %
(Year 2013: 36 %)
Carbon dioxide free 74 %
(Year 2013: 70 %)
Hydro power20,2 %
Wind power1,7 %
Peat4,5 %
Bio fuel16,9 %
Waste fuels1,2 %
Nuclear power34,7 %
Natural gas8,0 %
Coal12,5 %
Oil 0,3 %
11
21.1.2015
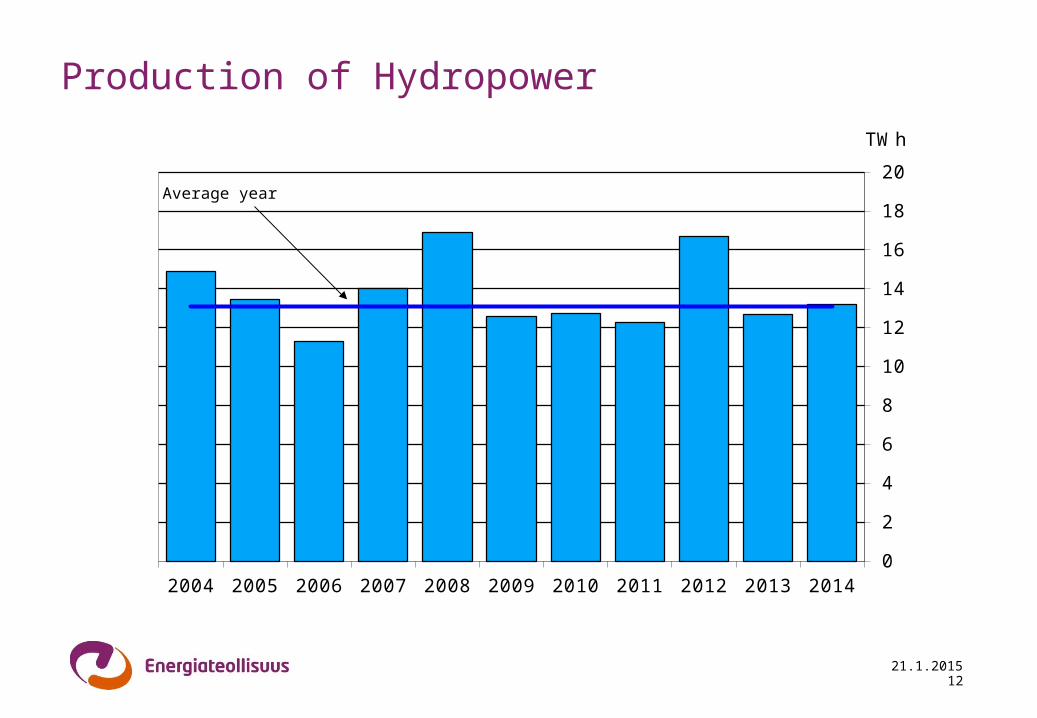
Production of Hydropower
Average year
0
2
4
6
8
10
12
14
16
18
20
2004 2005 2006 2007 2008 2009 2010 2011 2012 2013 2014
TWh
12
21.1.2015
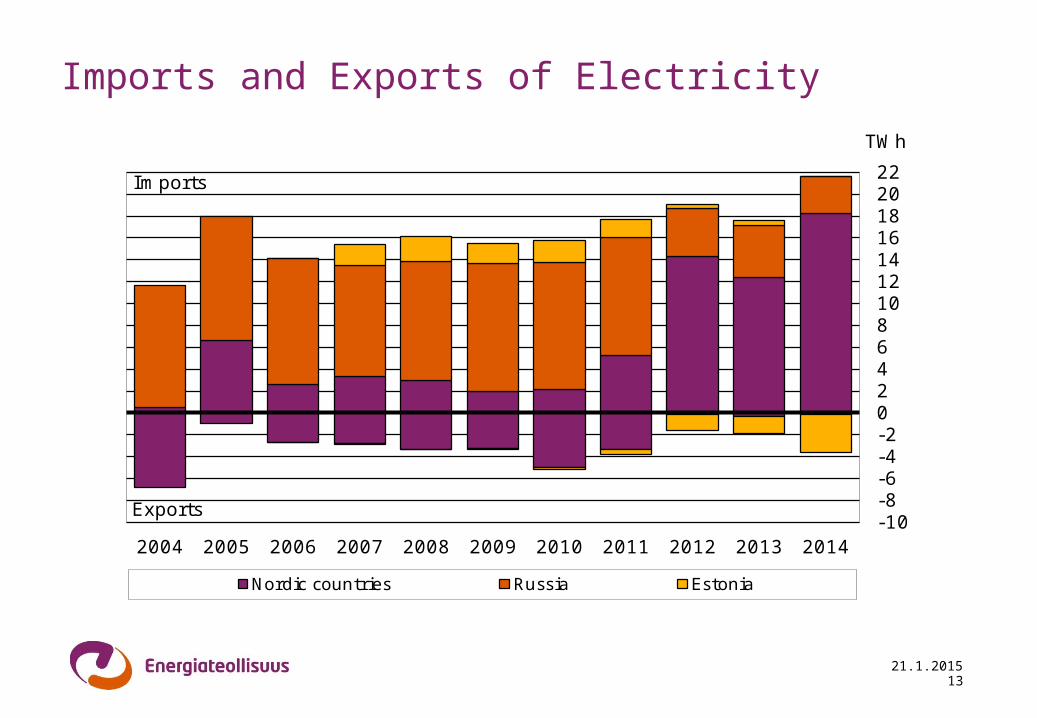
Imports and Exports of Electricity
-10-8-6-4-20246810121416182022
2004 2005 2006 2007 2008 2009 2010 2011 2012 2013 2014
Imports
Exports
TWh
Nordic countries Russia Estonia
13
21.1.2015
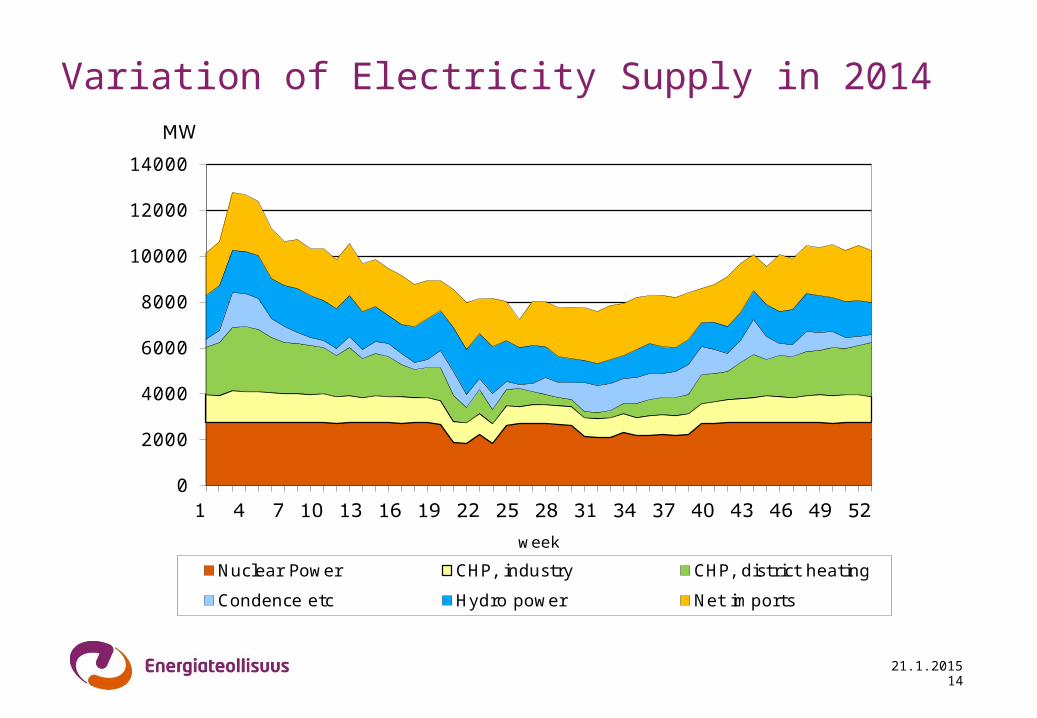
Variation of Electricity Supply in 2014
0
2000
4000
6000
8000
10000
12000
14000
week
Nuclear Power CHP, industry CHP, district heating
Condence etc Hydro power Net imports
14
21.1.2015
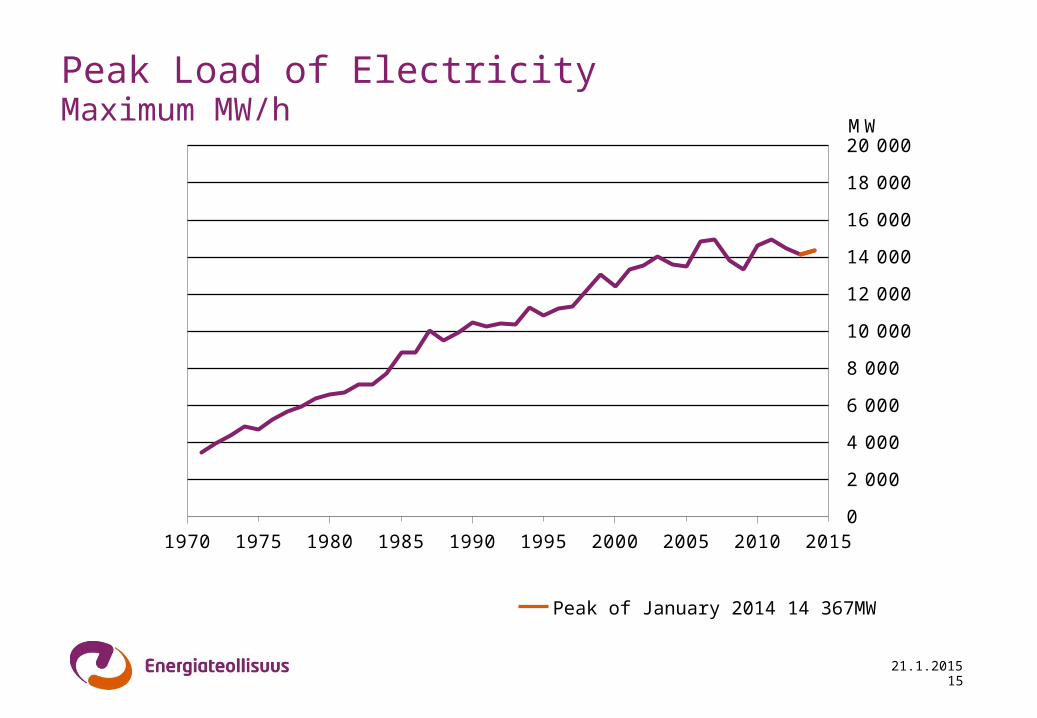
Peak Load of ElectricityMaximum MW/h
Peak of January 2014 14 367MW
0
2 000
4 000
6 000
8 000
10 000
12 000
14 000
16 000
18 000
20 000
1970 1975 1980 1985 1990 1995 2000 2005 2010 2015
MW
15
21.1.2015
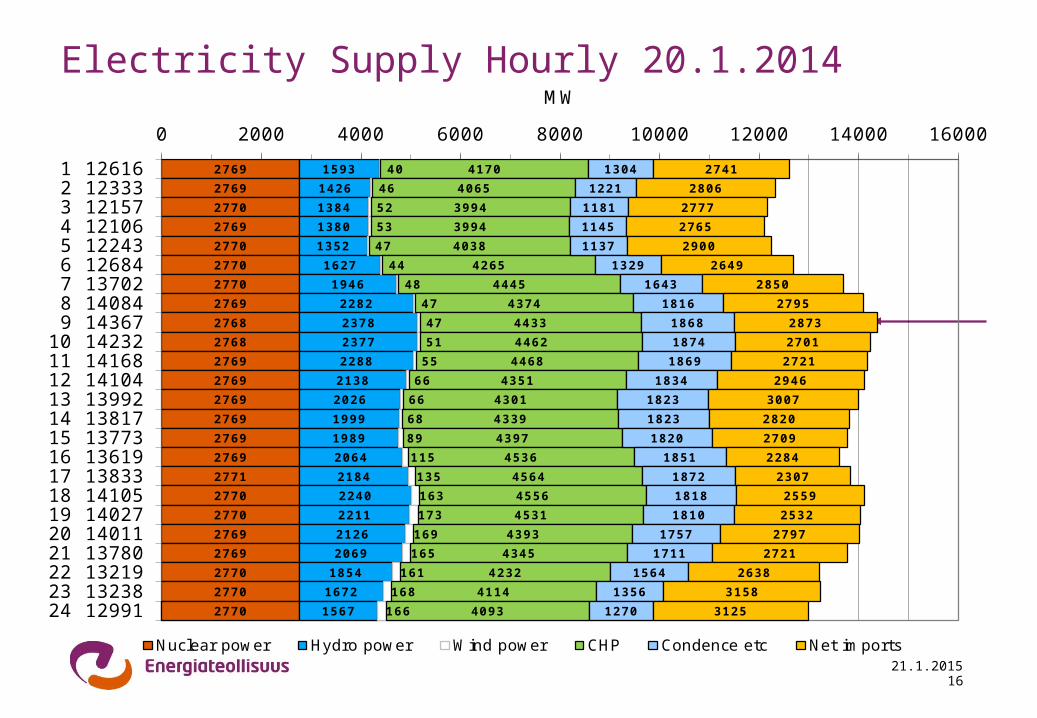
Electricity Supply Hourly 20.1.2014
2769
2769
2770
2769
2770
2770
2770
2769
2768
2768
2769
2769
2769
2769
2769
2769
2771
2770
2770
2769
2769
2770
2770
2770
1593
1426
1384
1380
1352
1627
1946
2282
2378
2377
2288
2138
2026
1999
1989
2064
2184
2240
2211
2126
2069
1854
1672
1567
40
46
52
53
47
44
48
47
47
51
55
66
66
68
89
115
135
163
173
169
165
161
168
166
4170
4065
3994
3994
4038
4265
4445
4374
4433
4462
4468
4351
4301
4339
4397
4536
4564
4556
4531
4393
4345
4232
4114
4093
1304
1221
1181
1145
1137
1329
1643
1816
1868
1874
1869
1834
1823
1823
1820
1851
1872
1818
1810
1757
1711
1564
1356
1270
2741
2806
2777
2765
2900
2649
2850
2795
2873
2701
2721
2946
3007
2820
2709
2284
2307
2559
2532
2797
2721
2638
3158
3125
0 2000 4000 6000 8000 10000 12000 14000 16000
1 126162 123333 121574 121065 122436 126847 137028 140849 14367
10 1423211 1416812 1410413 1399214 1381715 1377316 1361917 1383318 1410519 1402720 1401121 1378022 1321923 1323824 12991
MW
Nuclear power Hydro power Wind power CHP Condence etc Net imports
16
21.1.2015
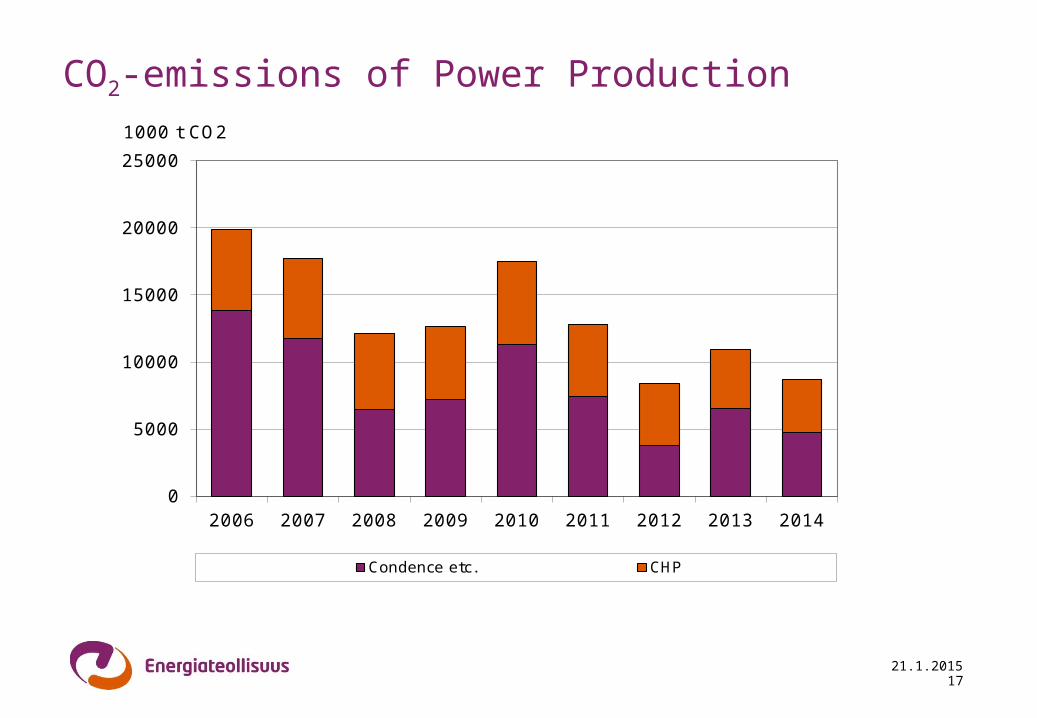
CO2-emissions of Power Production
0
5000
10000
15000
20000
25000
2006 2007 2008 2009 2010 2011 2012 2013 2014
1000 t CO2
Condence etc. CHP
17
21.1.2015
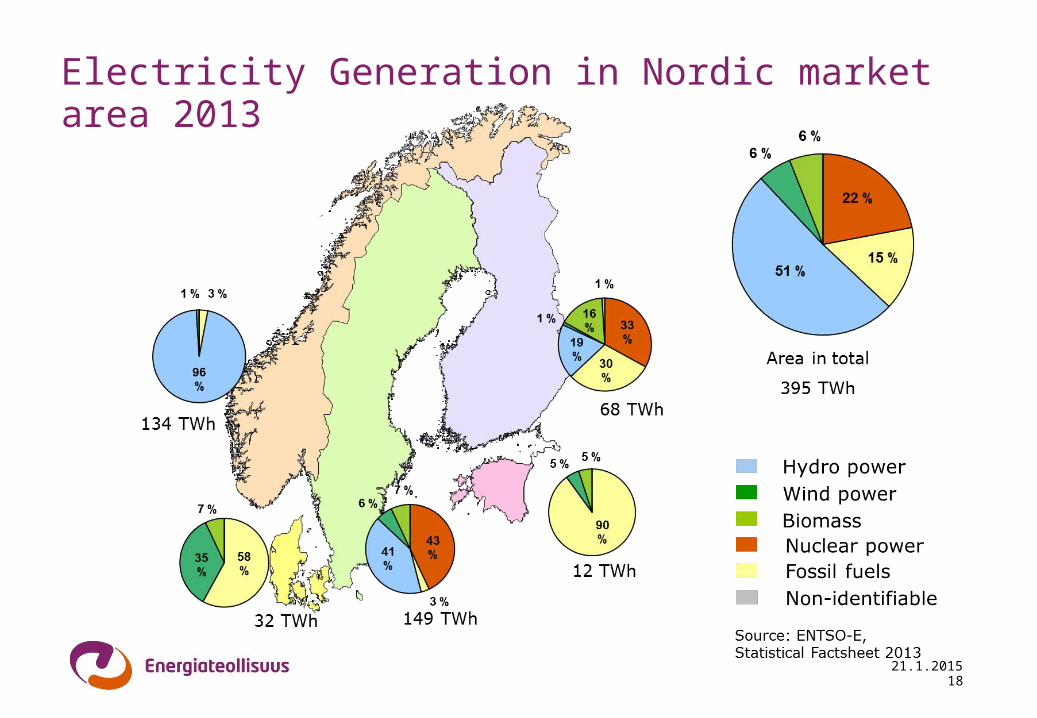
Electricity Generation in Nordic market area 2013
18