energy,co2 climate,and you! - bnl
TRANSCRIPT
Stephen E. Schwartz
Energy, CO2,Climate,and YOU!
Dr. Steve(Doctor of Chemistry)
www.bnl.gov/envsci/schwartz
CARPOOLING TO SUMMER SUNDAY AT BNL
THE MOST EFFECTIVE WAY TODOUBLE THE FUEL ECONOMY OF A CAR . . .
IS TO PUT TWOPEOPLE IN IT!
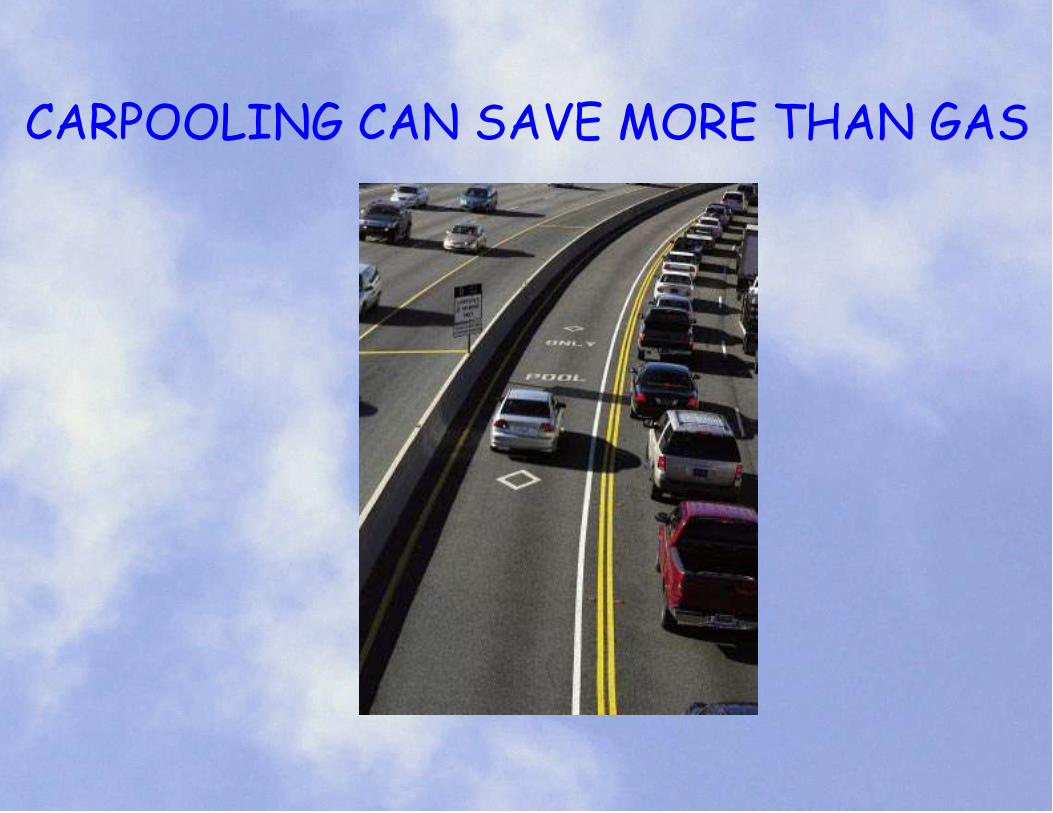
CARPOOLING CAN SAVE MORE THAN GAS
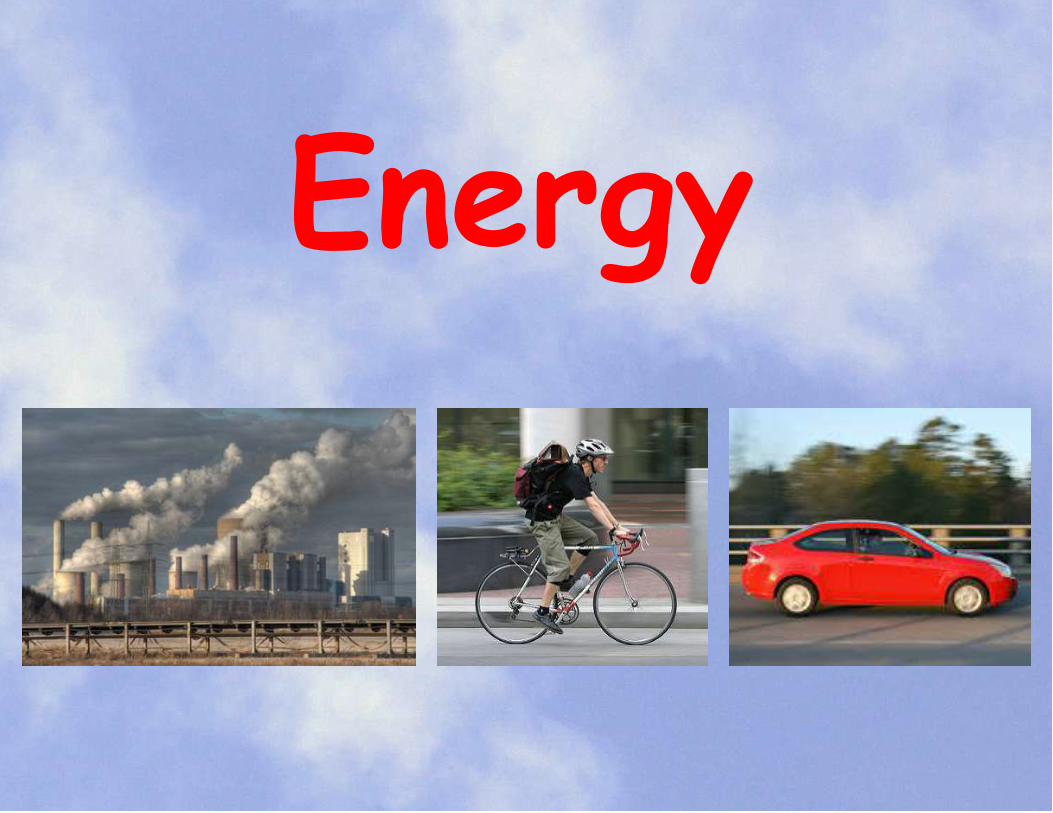
Energy
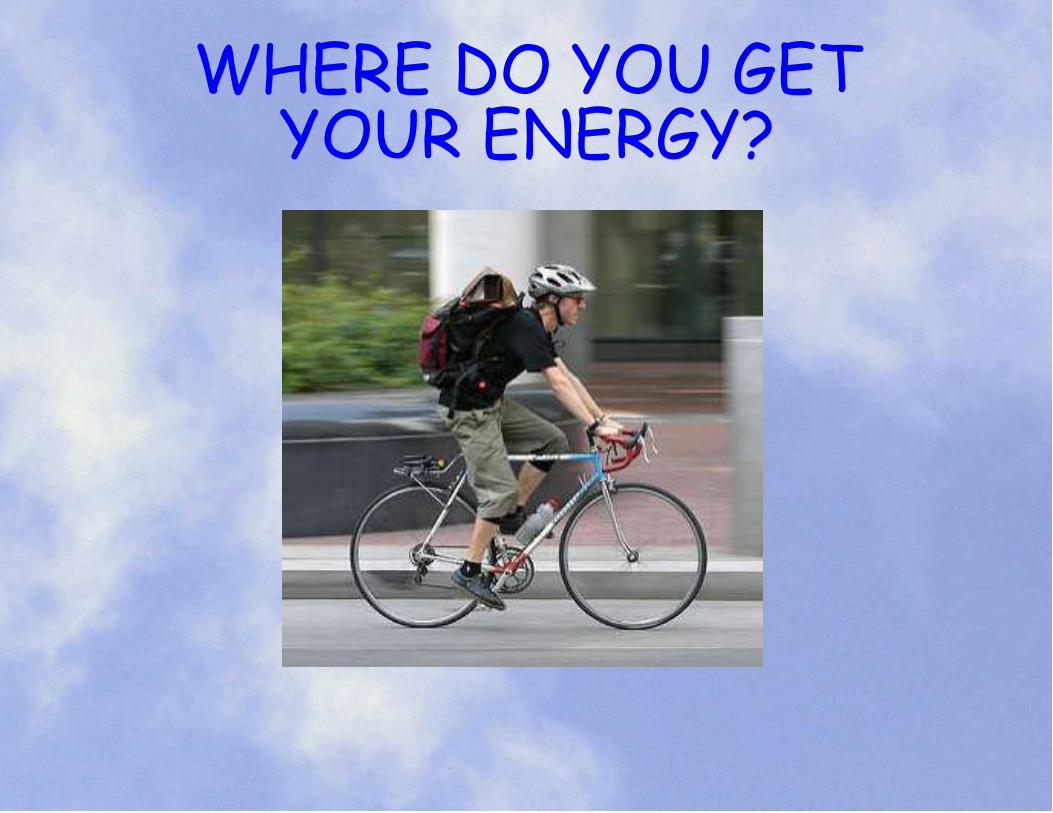
WHERE DO YOU GETYOUR ENERGY?

WHERE DO YOU GETYOUR ENERGY?
FOOD

HOW DO ENERGY AND OXYGENGET TO YOUR MUSCLES?
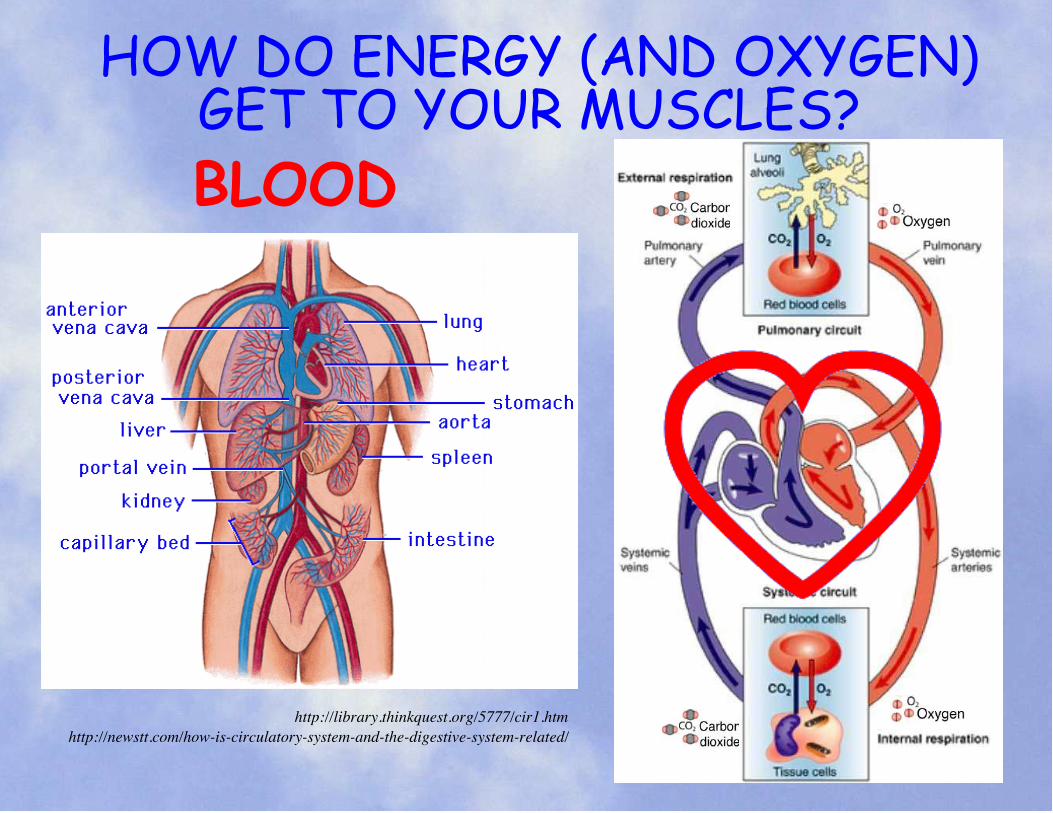
http://library.thinkquest.org/5777/cir1.htmhttp://newstt.com/how-is-circulatory-system-and-the-digestive-system-related/
HOW DO ENERGY (AND OXYGEN)GET TO YOUR MUSCLES?BLOOD

WHERE DOES YOUR FOODGET ITS ENERGY?
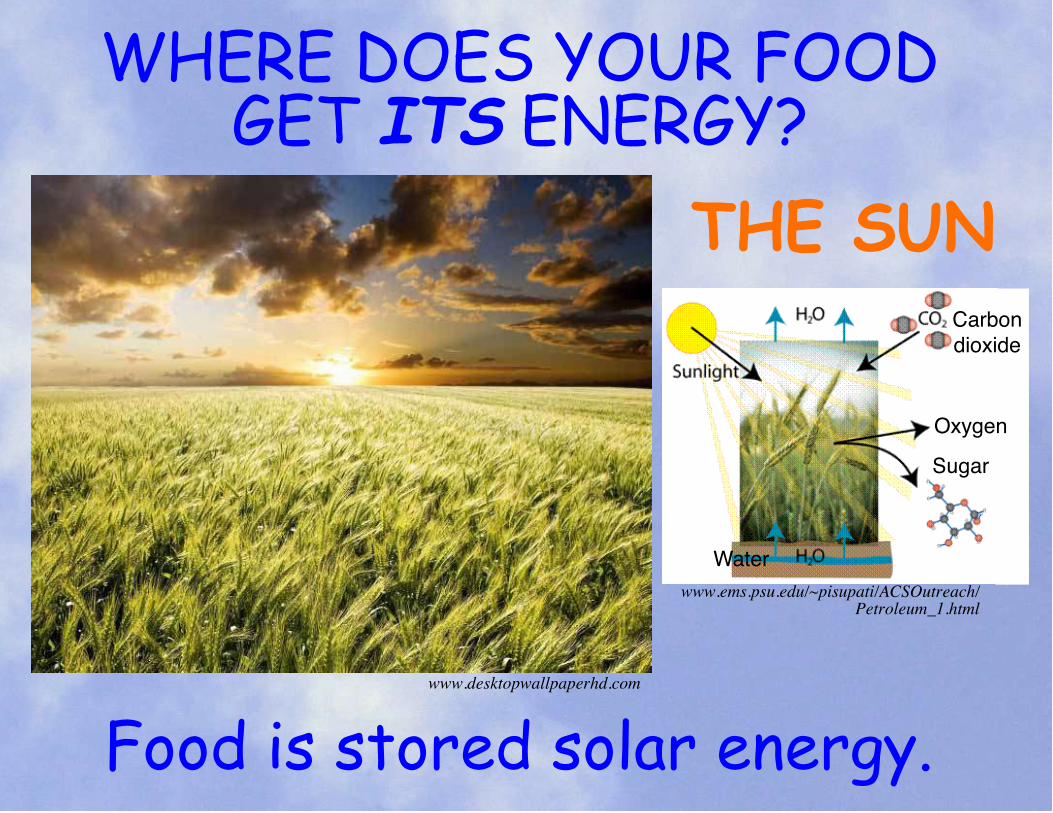
WHERE DOES YOUR FOODGET ITS ENERGY?
www.desktopwallpaperhd.com
www.ems.psu.edu/~pisupati/ACSOutreach/Petroleum_1.html
Sugar
Oxygen
Carbondioxide
Water
Food is stored solar energy.
THE SUN
HOW MUCH ENERGY IS IN YOUR FOOD?
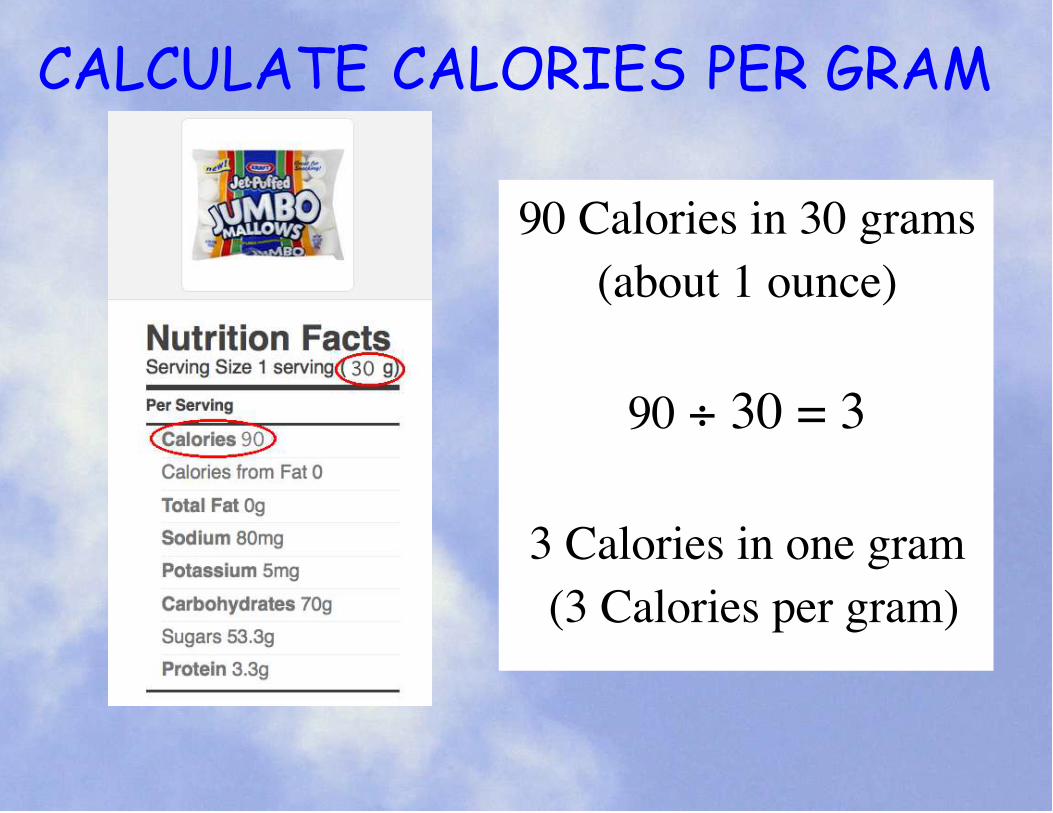
CALCULATE CALORIES PER GRAM
90 Calories in 30 grams(about 1 ounce)
90 ÷ 30 = 3
3 Calories in one gram(3 Calories per gram)
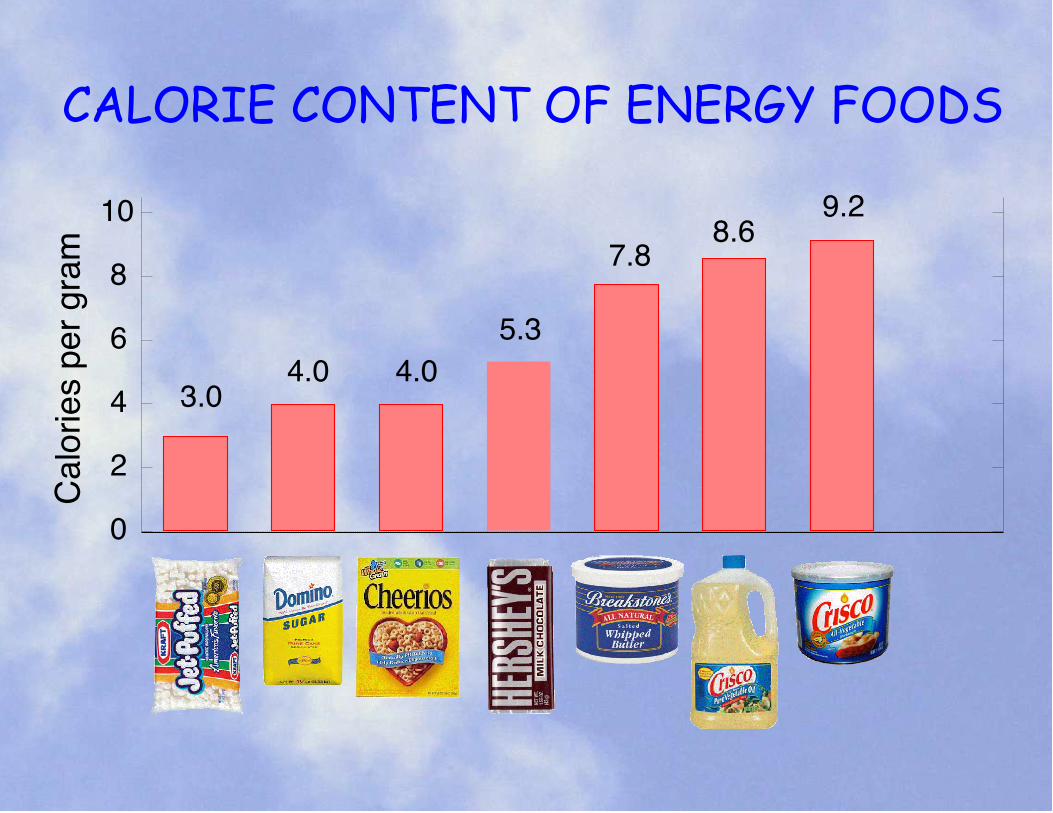
CALORIE CONTENT OF ENERGY FOODS
10
8
6
4
2
0
marg rep seirolaC
9.28.6
7.8
5.30.4 0.4
3.0
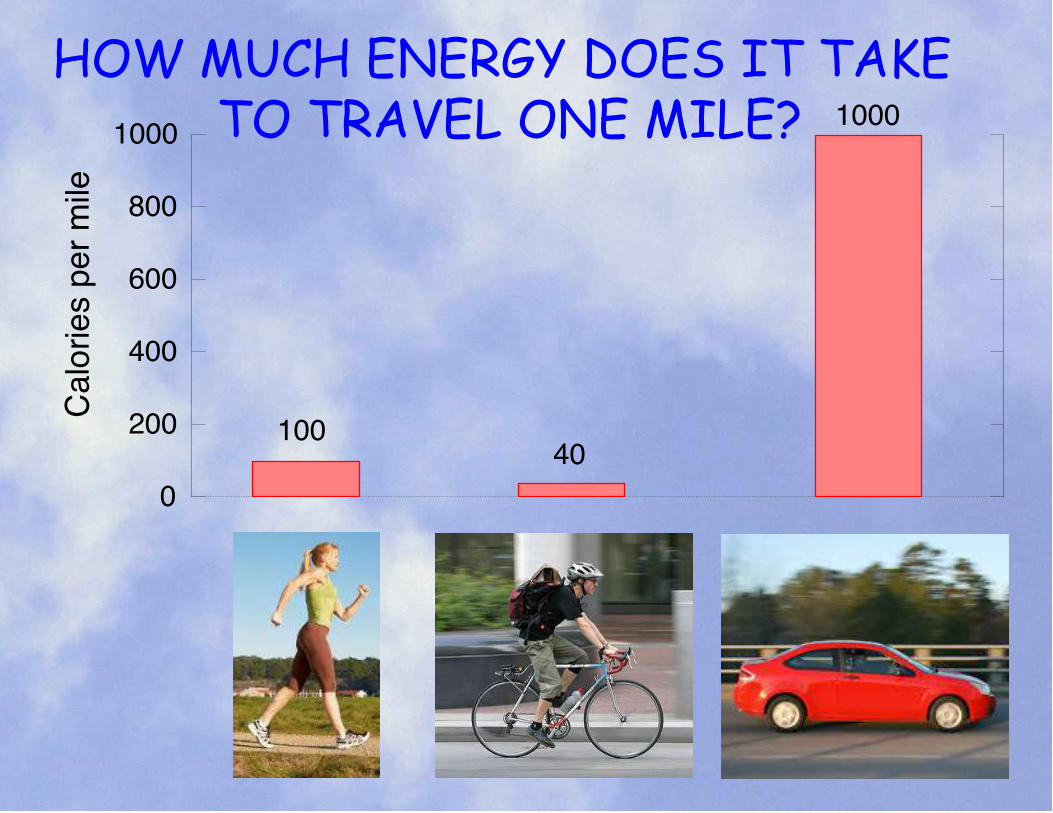
HOW MUCH ENERGY DOES IT TAKE TO TRAVEL ONE MILE?1000
800
600
400
200
0
elim rep seirola
C1000
10040
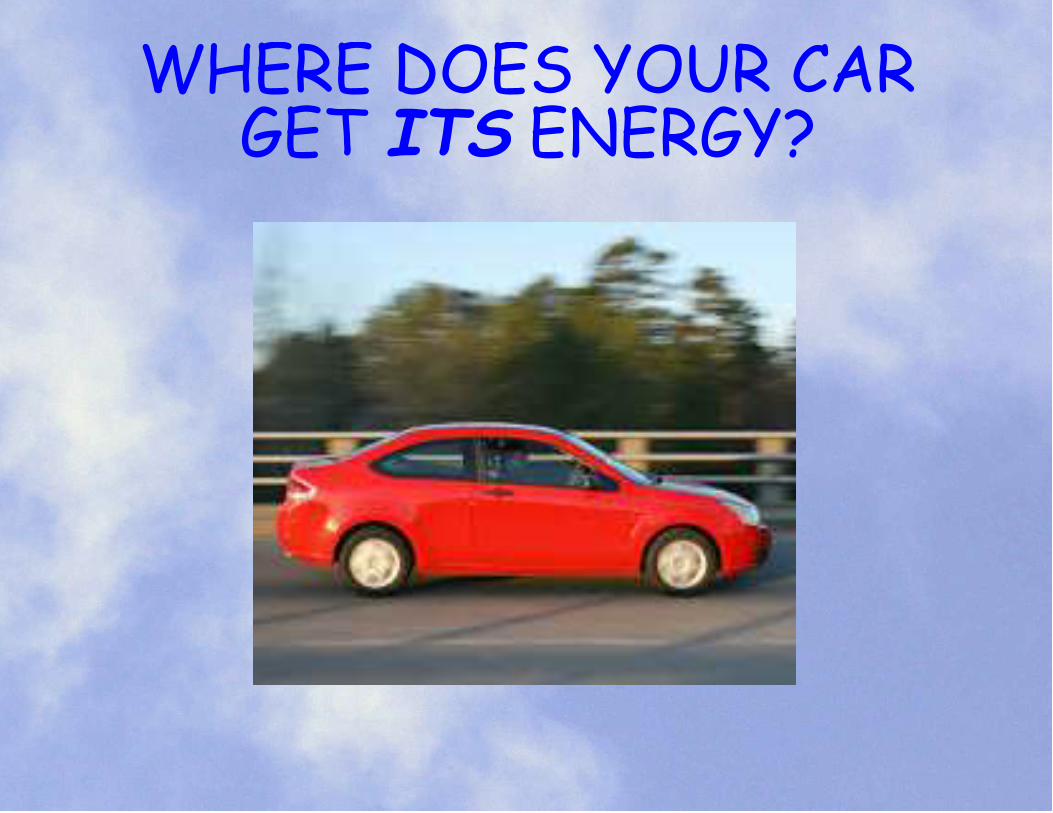
WHERE DOES YOUR CARGET ITS ENERGY?
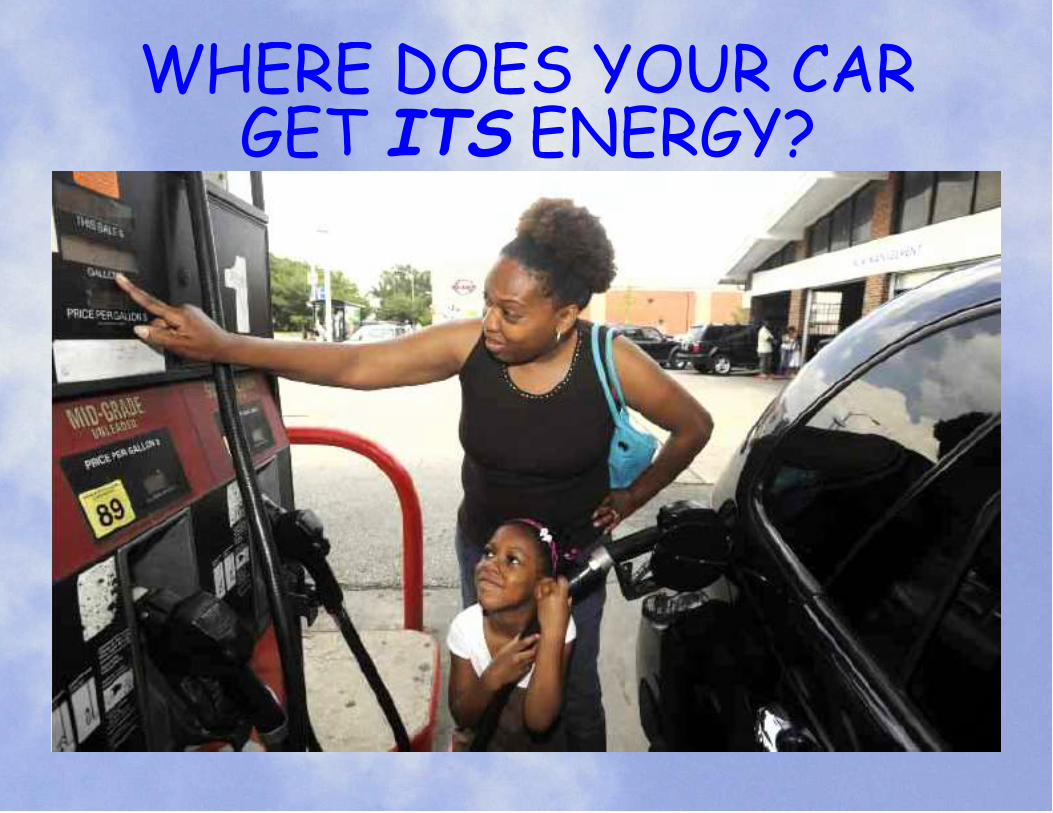
WHERE DOES YOUR CARGET ITS ENERGY?
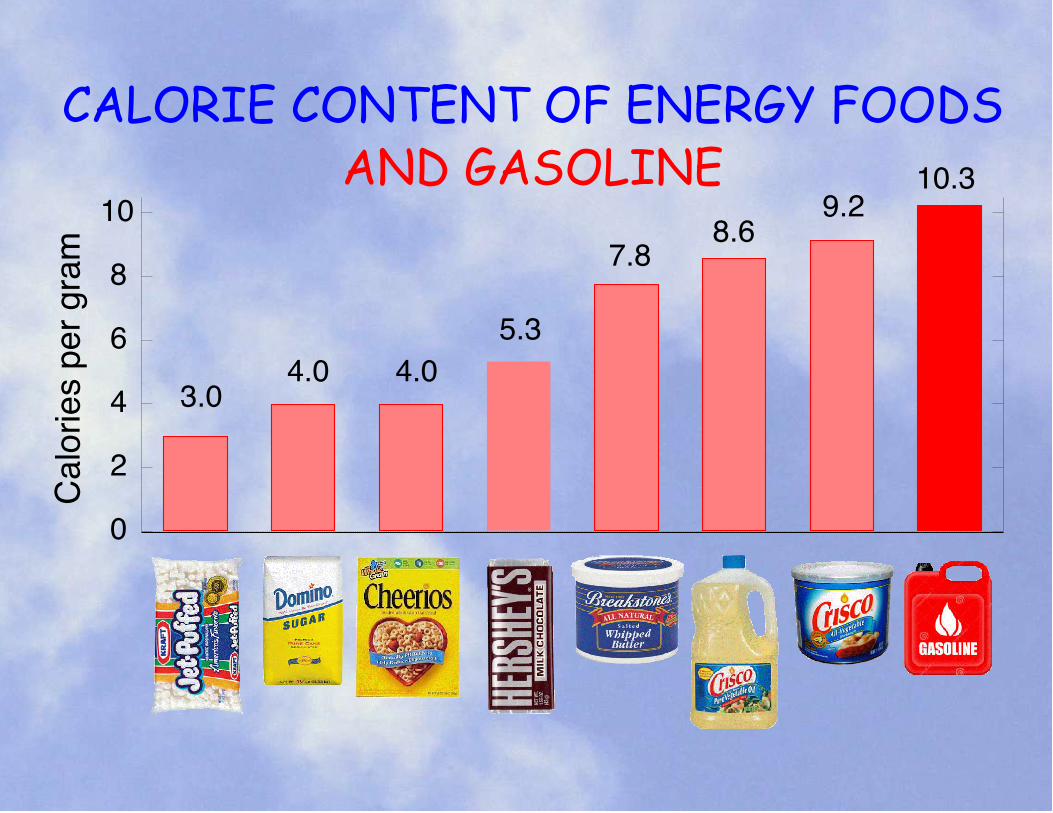
CALORIE CONTENT OF ENERGY FOODS
10
8
6
4
2
0
marg rep seirolaC
10.39.2
8.67.8
5.30.4 0.4
3.0
AND GASOLINE
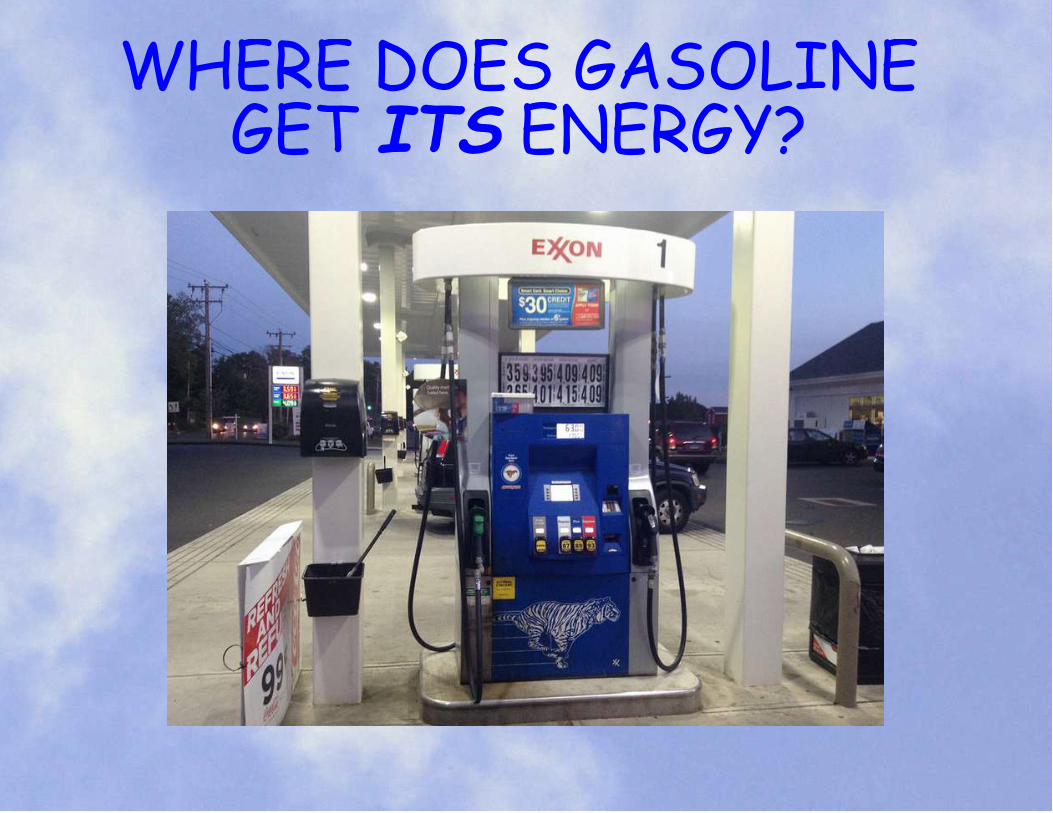
WHERE DOES GASOLINEGET ITS ENERGY?
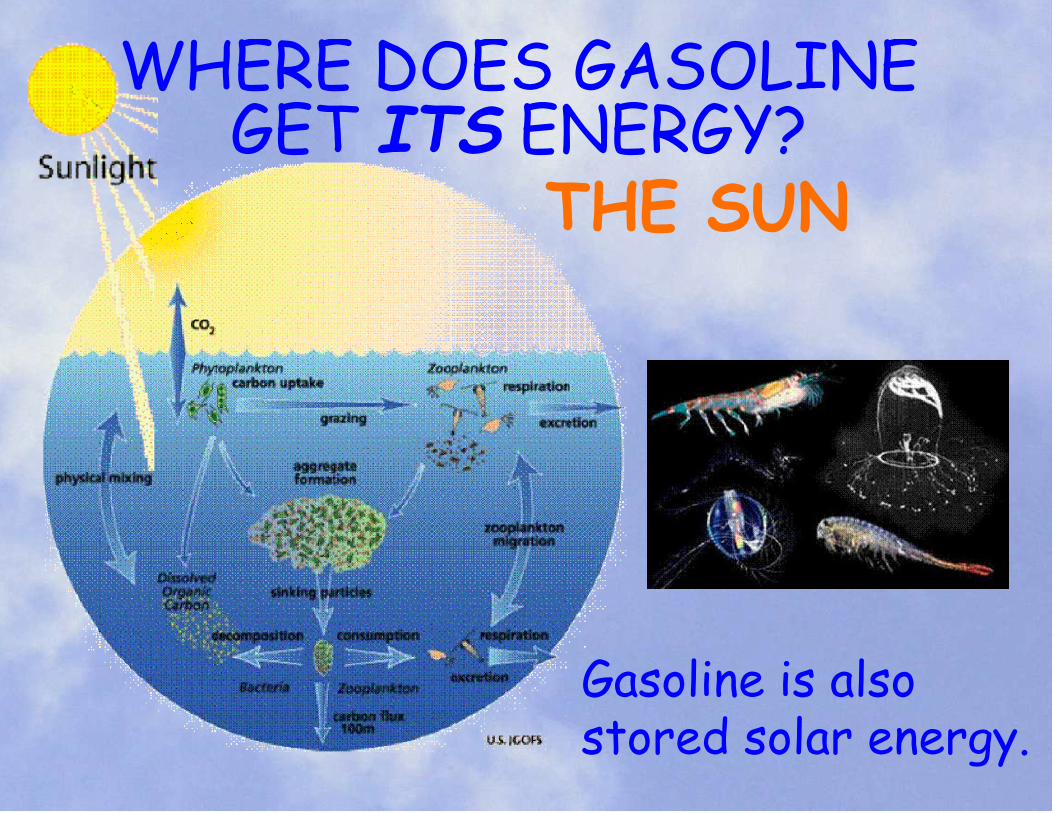
WHERE DOES GASOLINEGET ITS ENERGY?
Gasoline is alsostored solar energy.
THE SUN
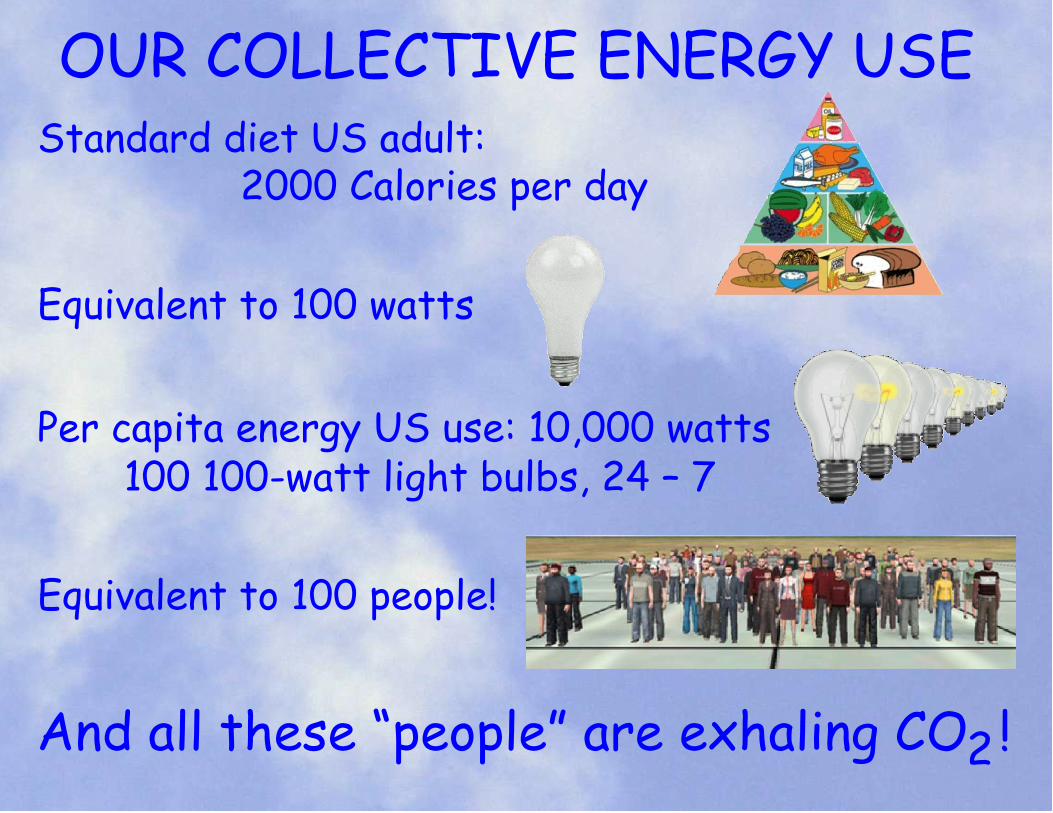
OUR COLLECTIVE ENERGY USE
Equivalent to 100 watts
Standard diet US adult: 2000 Calories per day
Equivalent to 100 people!
Per capita energy US use: 10,000 watts
And all these “people” are exhaling CO !2
100 100-watt light bulbs, 24 – 7
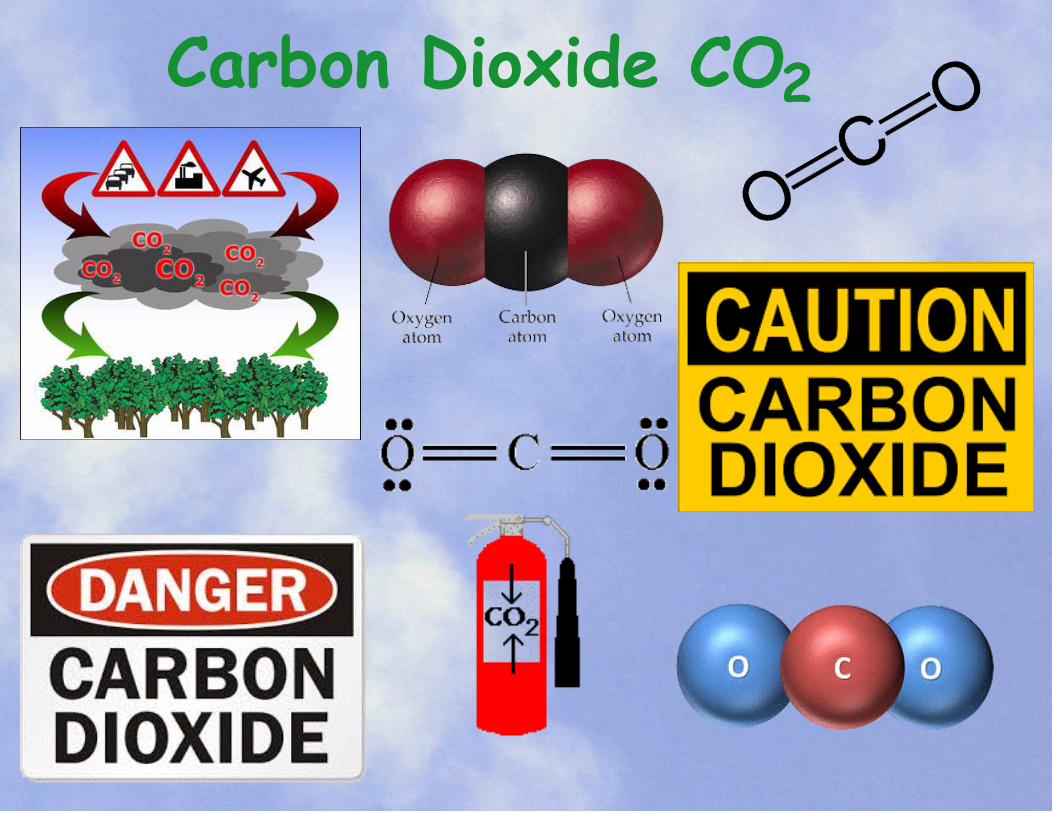
Carbon Dioxide CO2
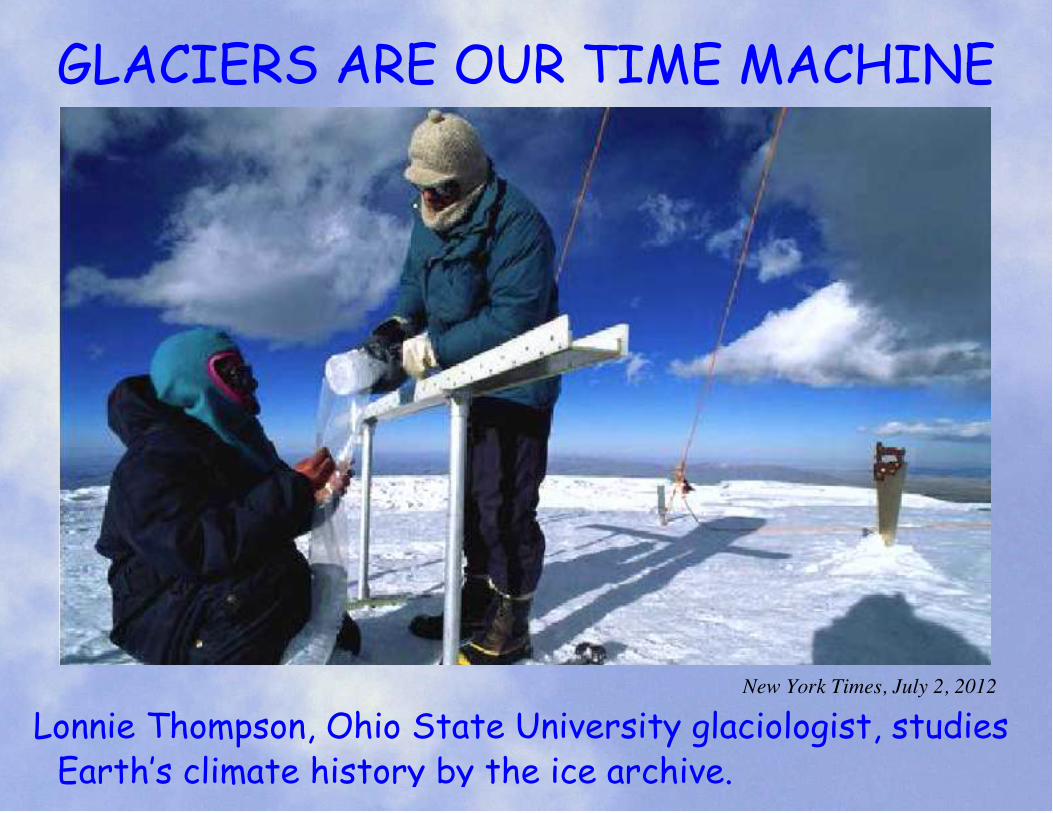
GLACIERS ARE OUR TIME MACHINE
New York Times, July 2, 2012
Lonnie Thompson, Ohio State University glaciologist, studies Earth‛s climate history by the ice archive.
CO
2co
ncen
tratio
n (p
pm)
180200220240260280300320340360380
800 1000 1200 1400 1600 1800 2000
Law DomeAdelie LandSipleSouth Pole
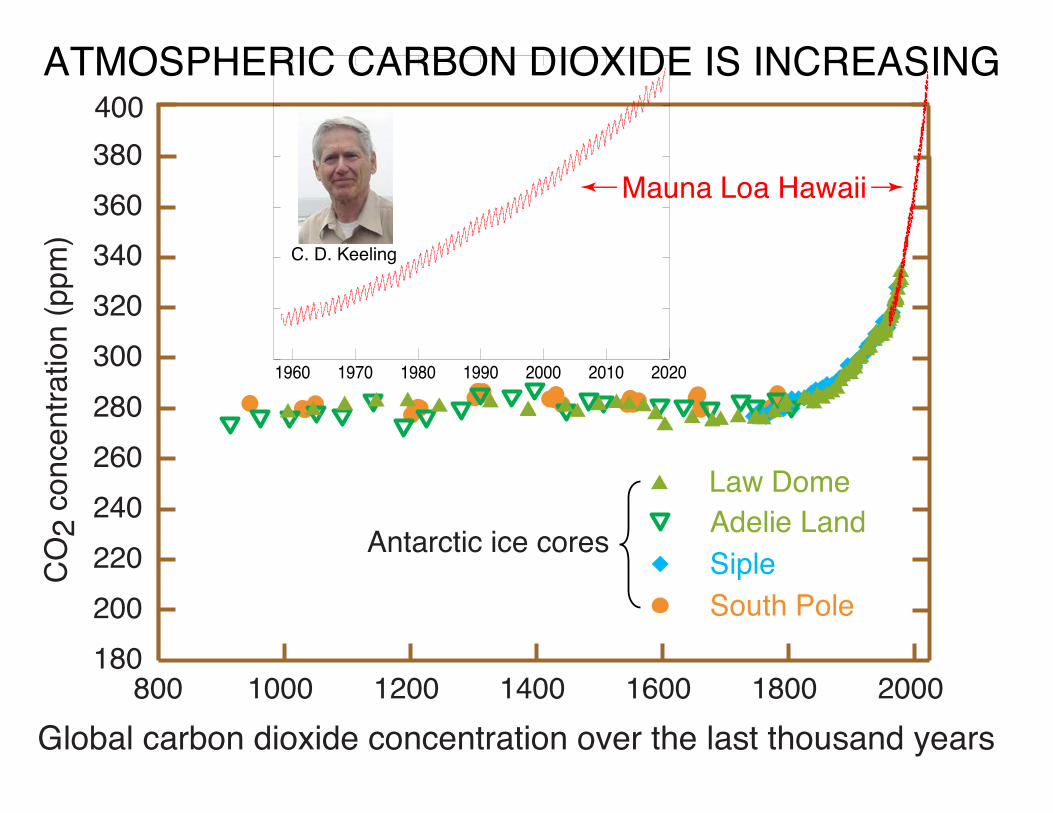
ATMOSPHERIC CARBON DIOXIDE IS INCREASING
Global carbon dioxide concentration over the last thousand years
Antarctic ice cores
400
C. D. Keeling
Mauna Loa Hawaii
2020201020001990198019701960

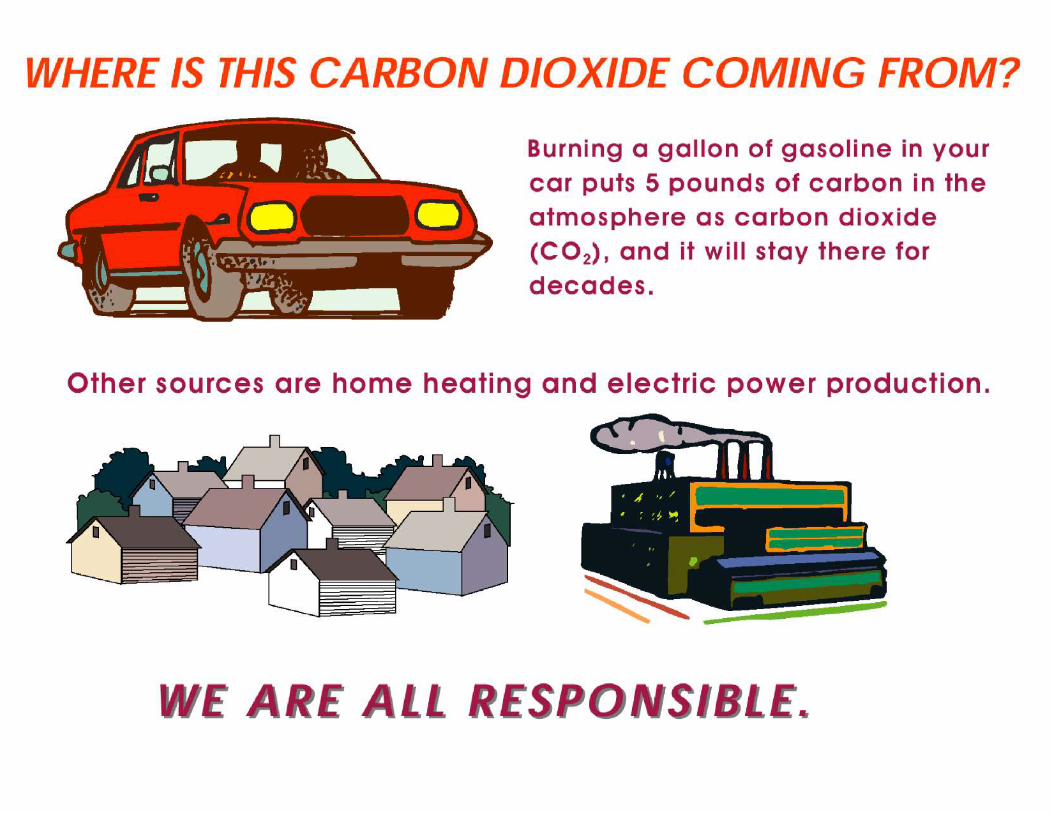
WHERE IS ALL
COMING FROM?THIS CO 2
WHO IS RESPONSIBLE?
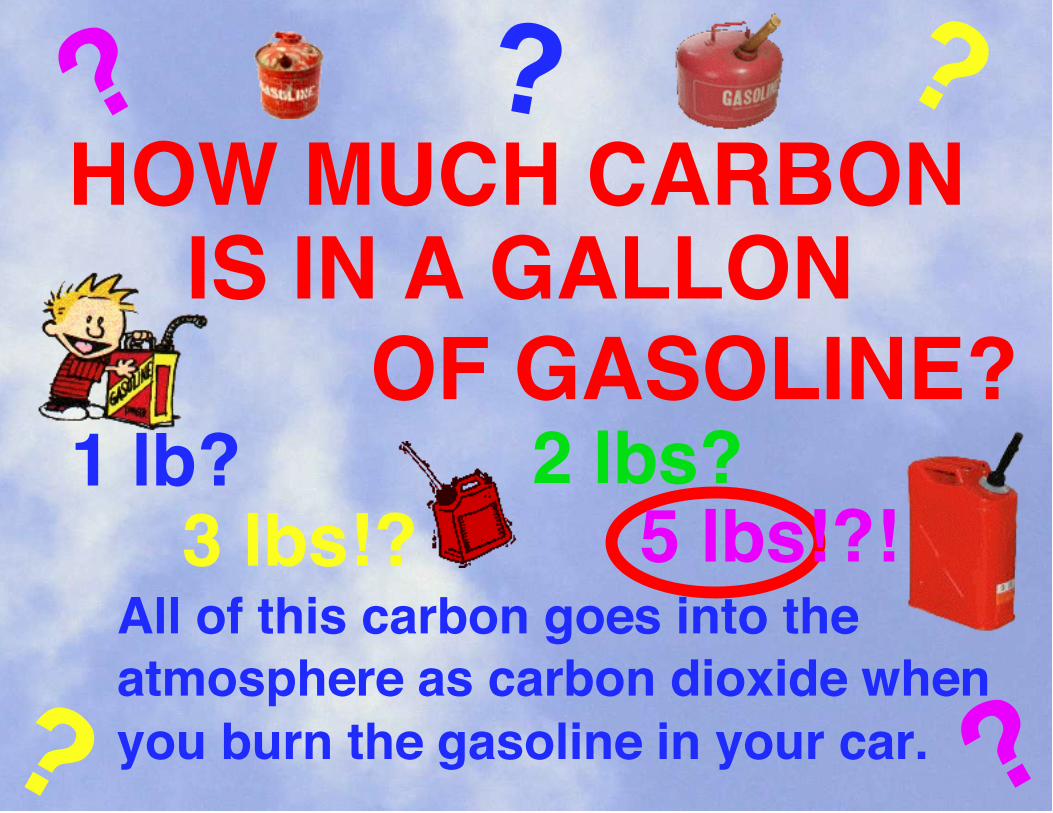
HOW MUCH CARBONIS IN A GALLON
OF GASOLINE?
? ??
? ?
1 lb? 2 lbs?3 lbs!? 5 lbs!?!
All of this carbon goes into the atmosphere as carbon dioxide whenyou burn the gasoline in your car.
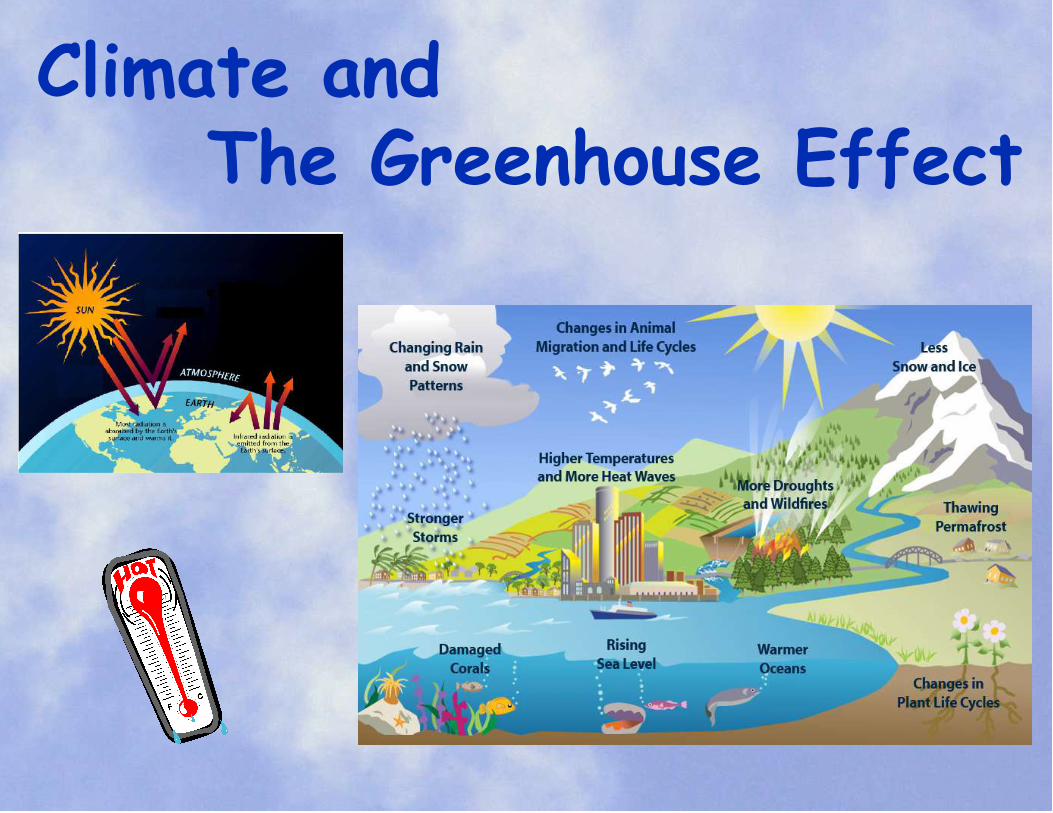
Climate andThe Greenhouse Effect

NOT TO SCALE
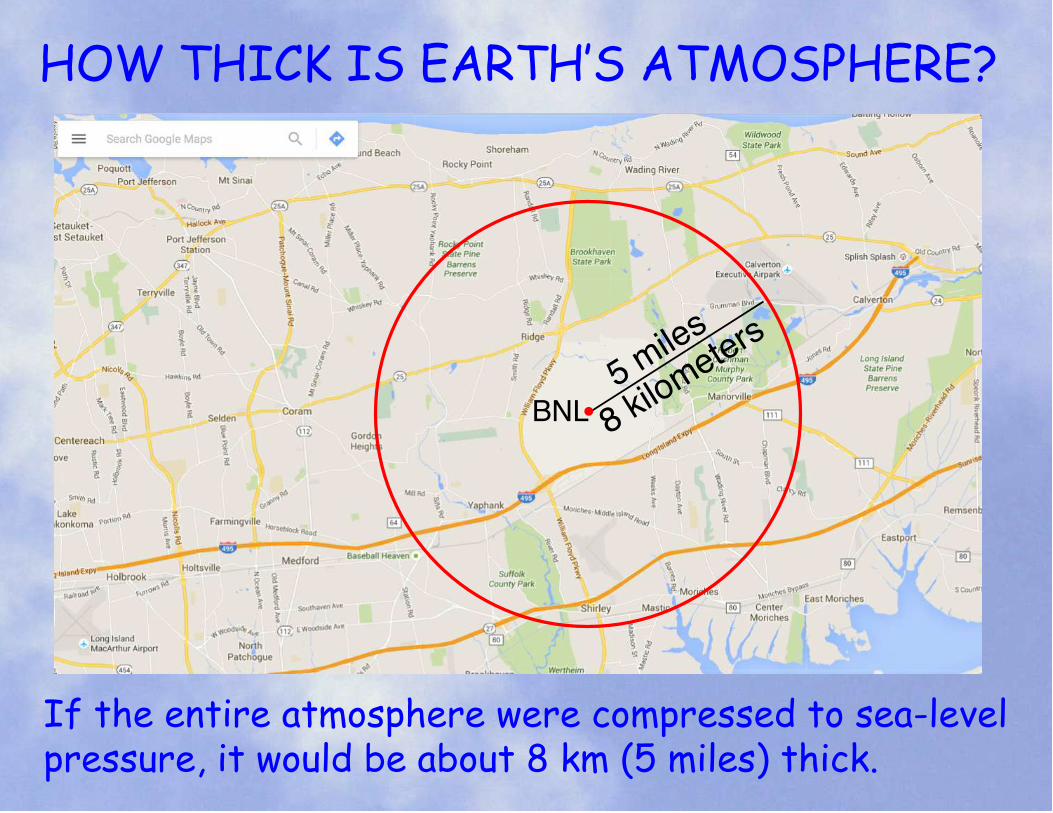
5 miles
8 kilometers
HOW THICK IS EARTH‛S ATMOSPHERE?
If the entire atmosphere were compressed to sea-level pressure, it would be about 8 km (5 miles) thick.
BNL

HOW THICK IS EARTH‛S ATMOSPHERE?
Like a coat of paint on a soccer ball

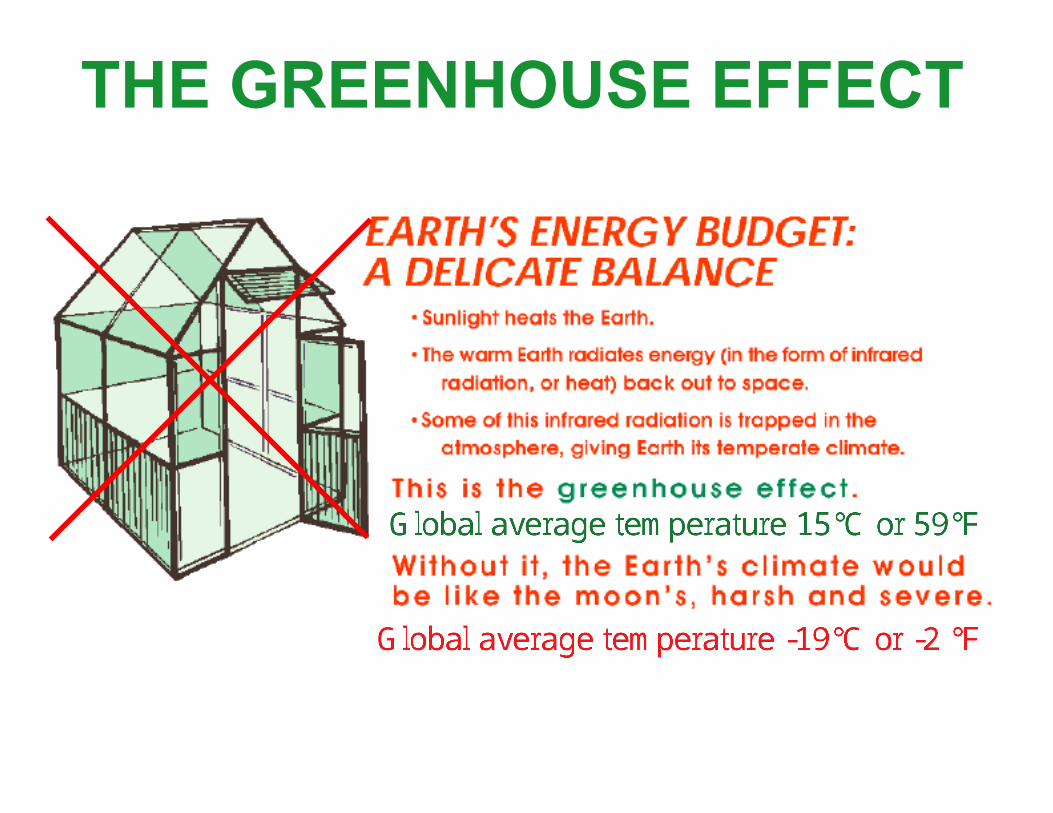
THE GREENHOUSE EFFECT
CO
2co
ncen
tratio
n (p
pm)
180200220240260280300320340360380
800 1000 1200 1400 1600 1800 2000
Law DomeAdelie LandSipleSouth Pole
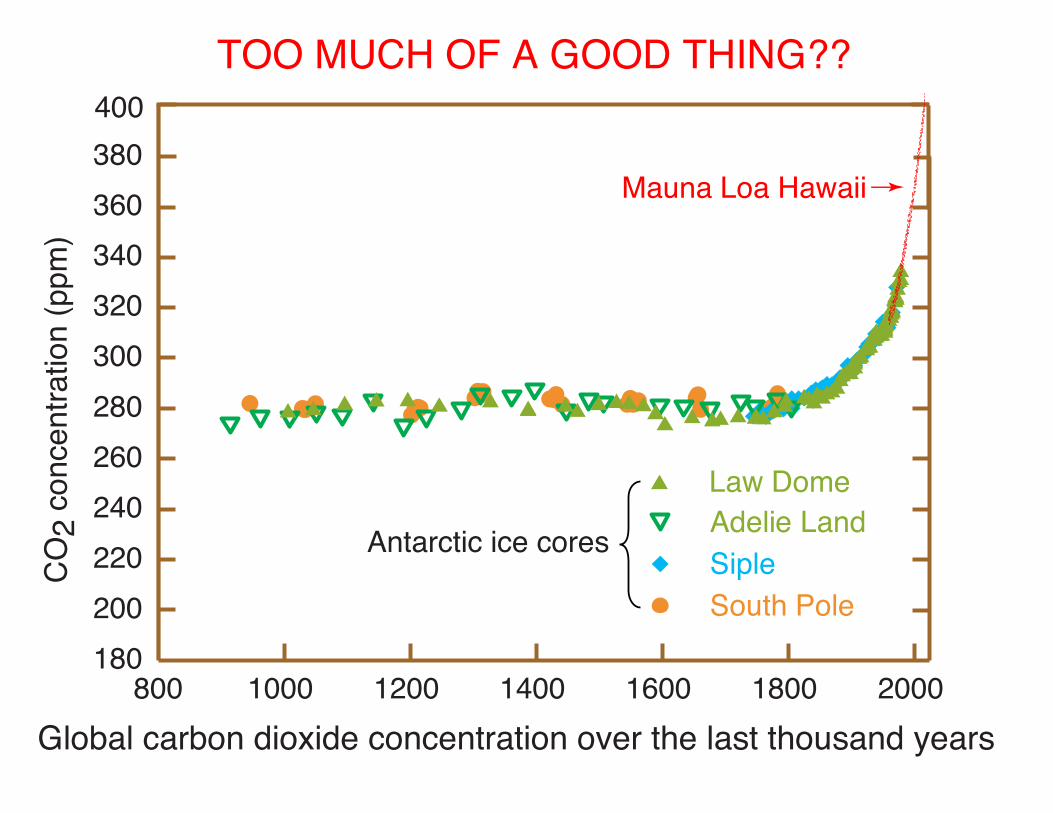
TOO MUCH OF A GOOD THING??
Global carbon dioxide concentration over the last thousand years
Antarctic ice cores
400
Mauna Loa Hawaii
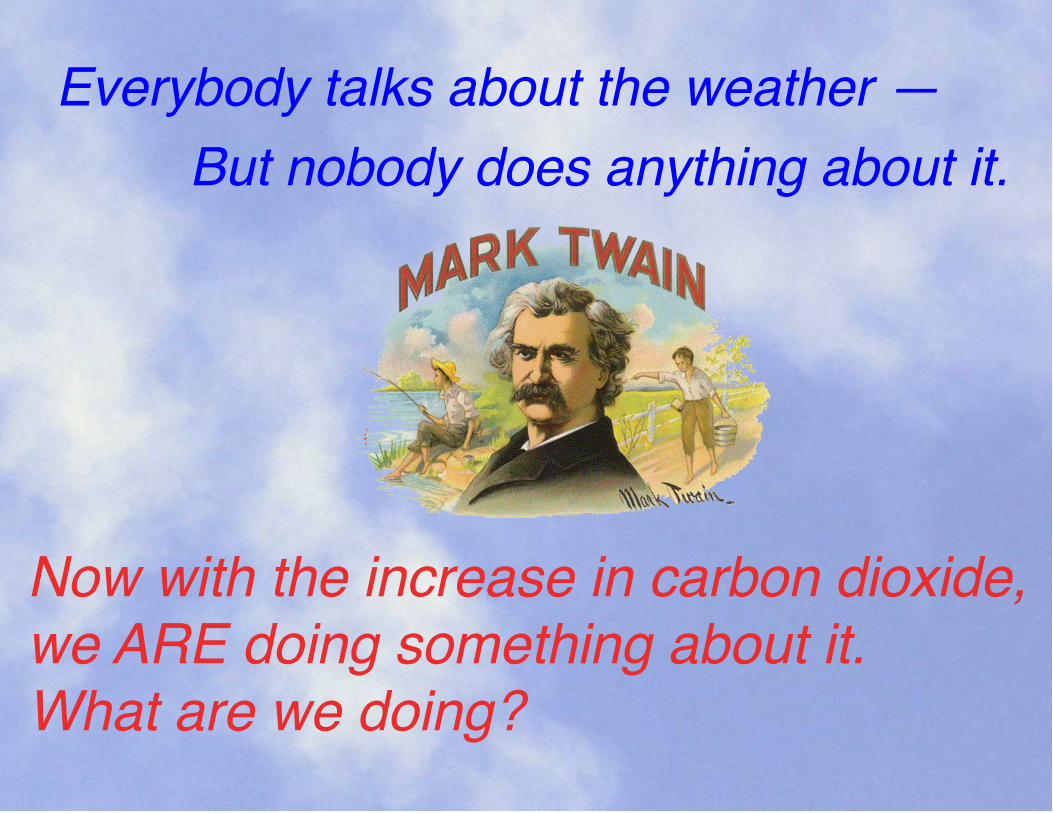
Everybody talks about the weather — But nobody does anything about it.
Now with the increase in carbon dioxide, we ARE doing something about it. What are we doing?
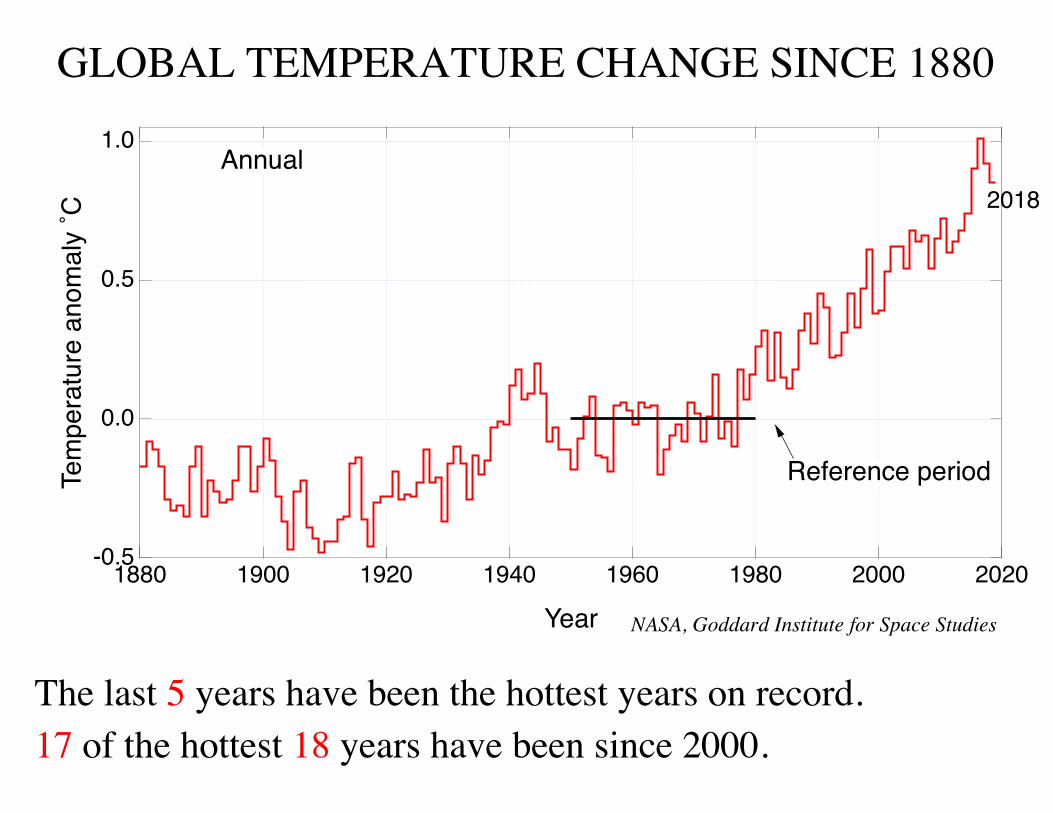
GLOBAL TEMPERATURE CHANGE SINCE 1880
NASA, Goddard Institute for Space Studies
The last 5 years have been the hottest years on record. 17 of the hottest 18 years have been since 2000.
Annual1.0
0.5
0.0
-0.5
TC˚ yla
mona erutarepme
20202000198019601940192019001880
Year
2018Annual
Reference period
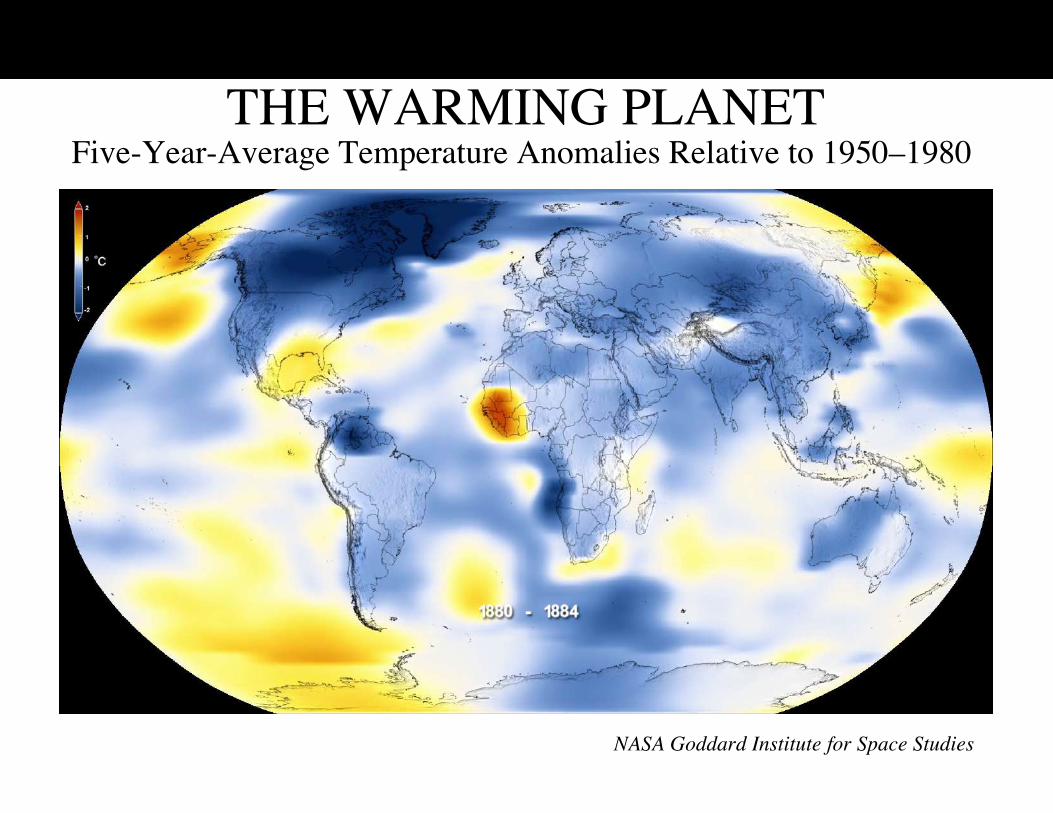
THE WARMING PLANETFive-Year-Average Temperature Anomalies Relative to 1950–1980
NASA Goddard Institute for Space Studies
Temperature ˚F32 131
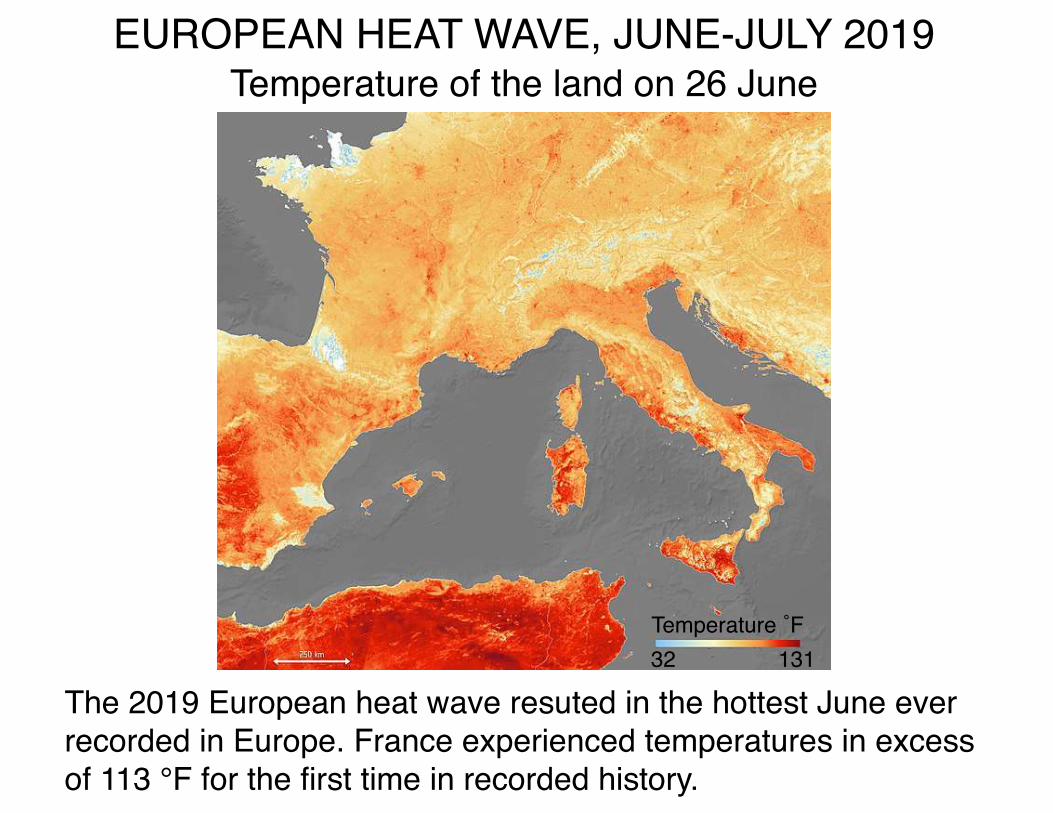
EUROPEAN HEAT WAVE, JUNE-JULY 2019Temperature of the land on 26 June
The 2019 European heat wave resuted in the hottest June ever recorded in Europe. France experienced temperatures in excess of 113 °F for the first time in recorded history.
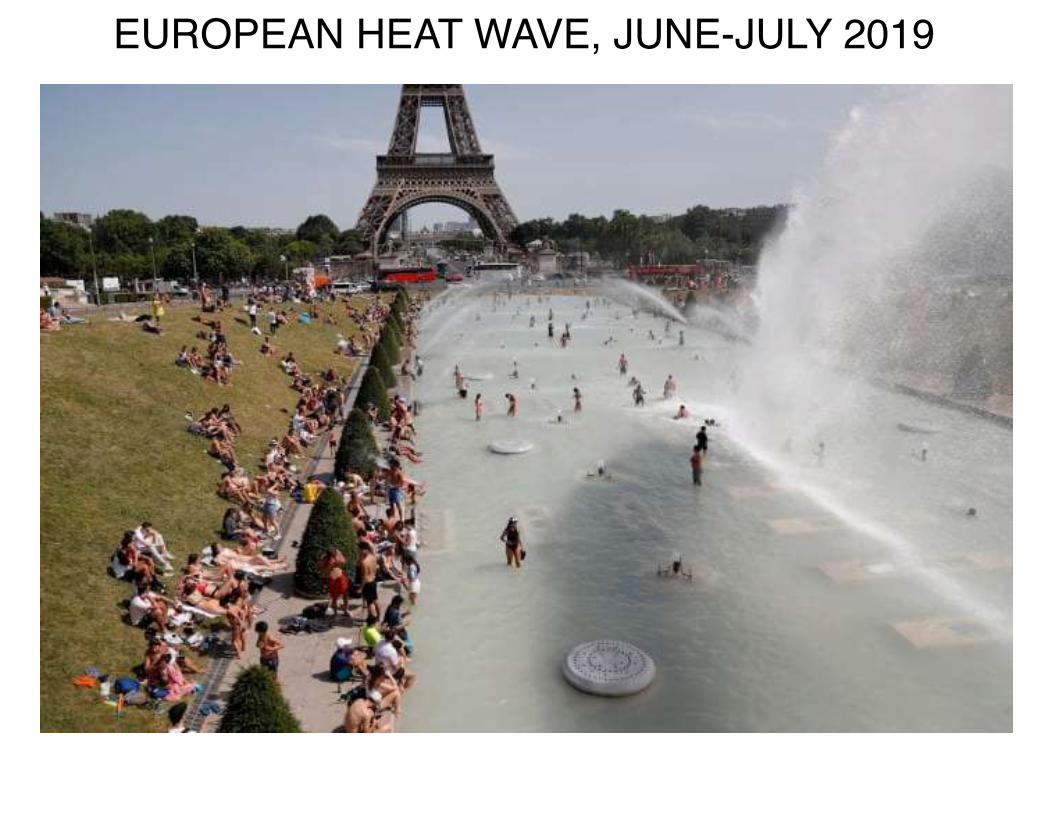
EUROPEAN HEAT WAVE, JUNE-JULY 2019
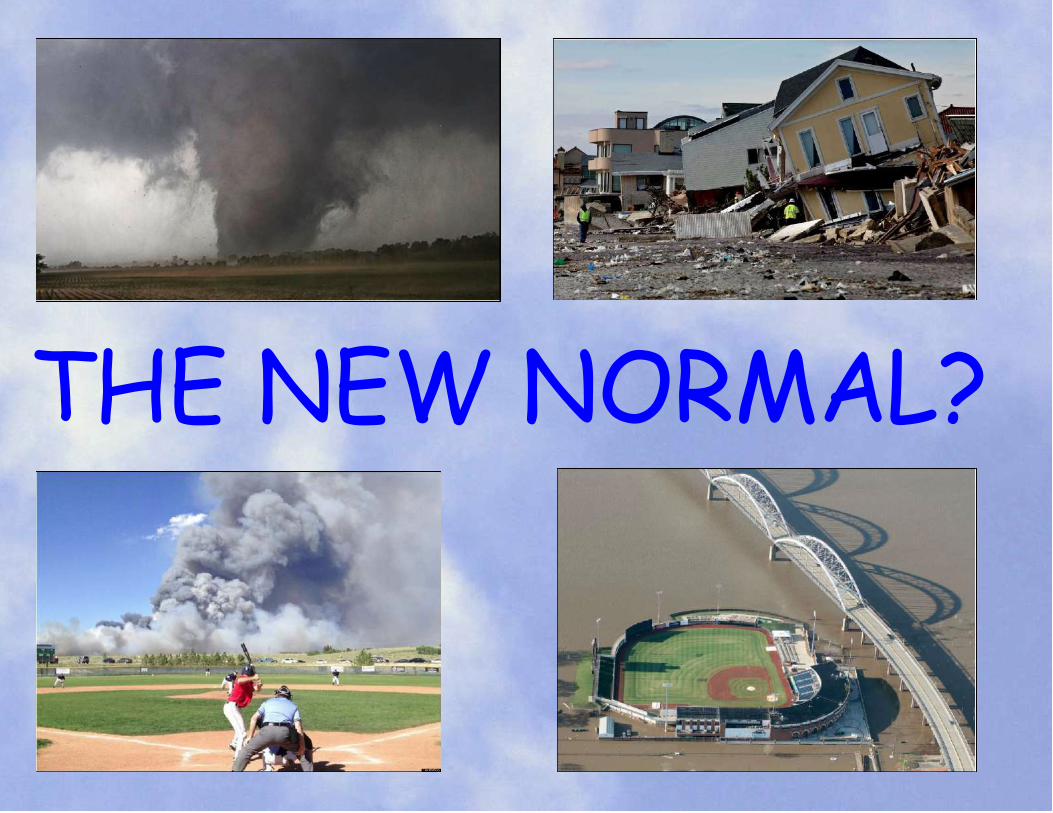
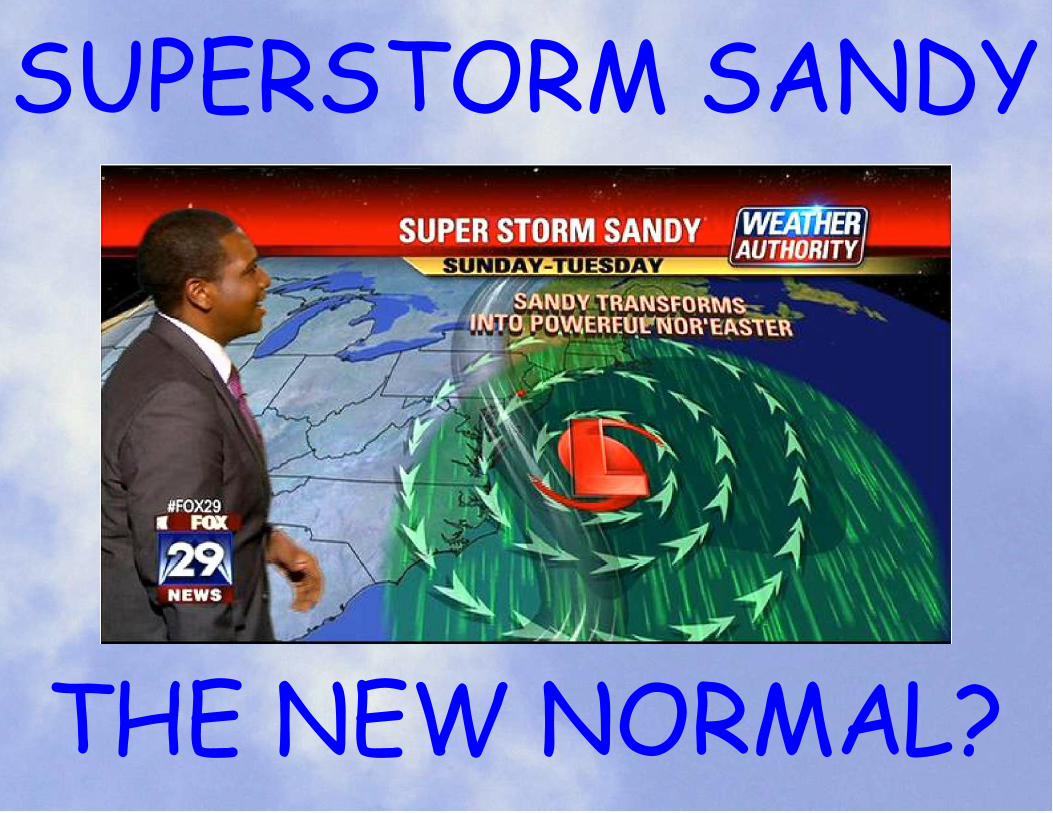
THE NEW NORMAL?
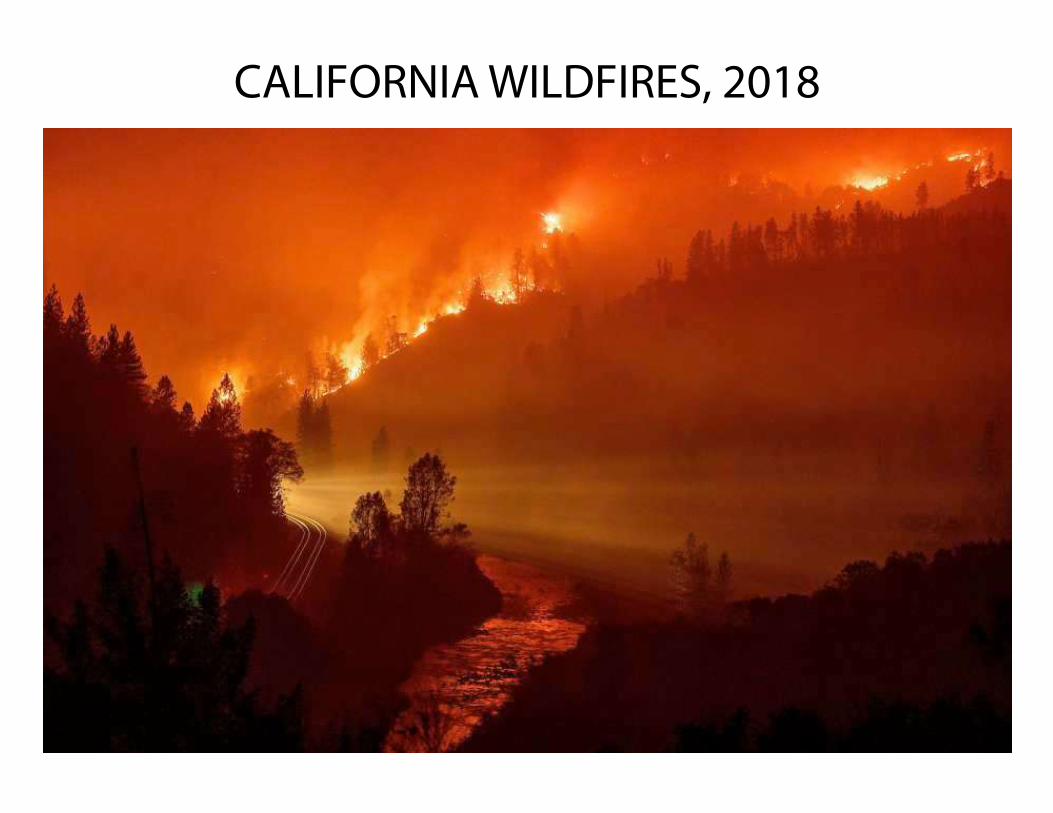
CALIFORNIA WILDFIRES, 2018

CALIFORNIA WILDFIRESSatellite image August 1, 2018
The 2018 wildfire season was the deadliest and most destructive wildfire season on record in California, with a total of 8,527 fires burning an area of almost 2 million acres, the largest area of burned acreage recorded in a fire season.

MIDWEST USAFLOODS
2019
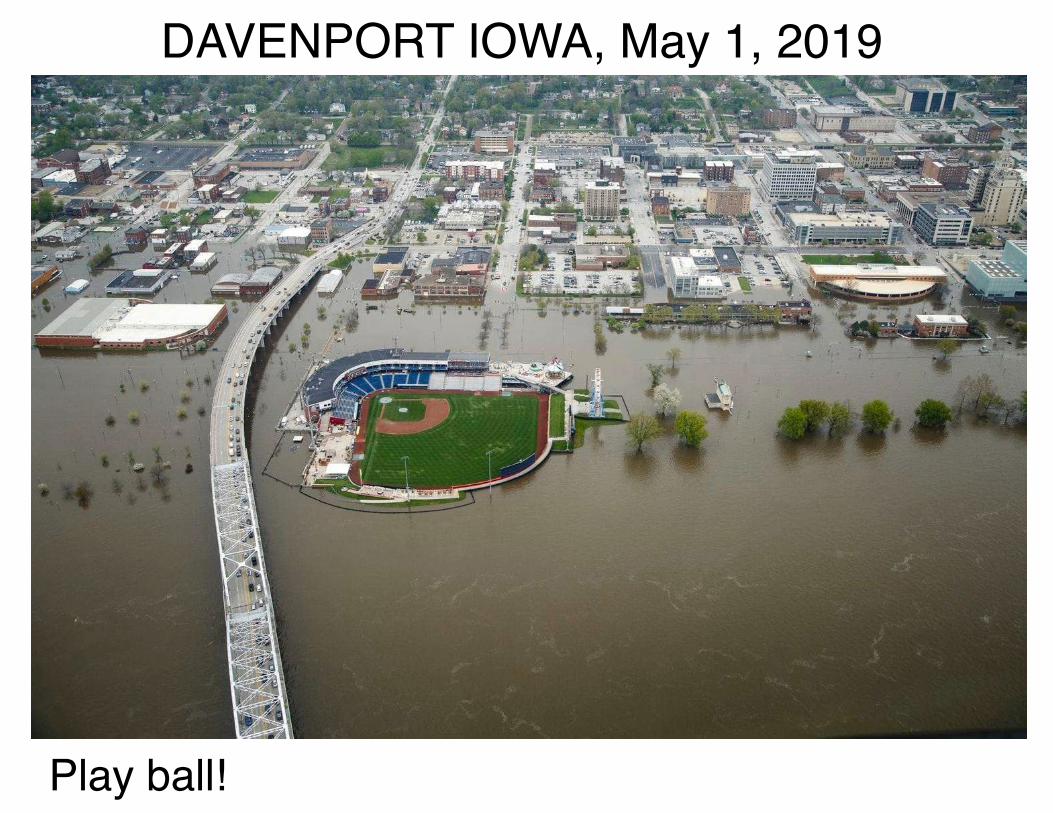
DAVENPORT IOWA, May 1, 2019
Play ball!
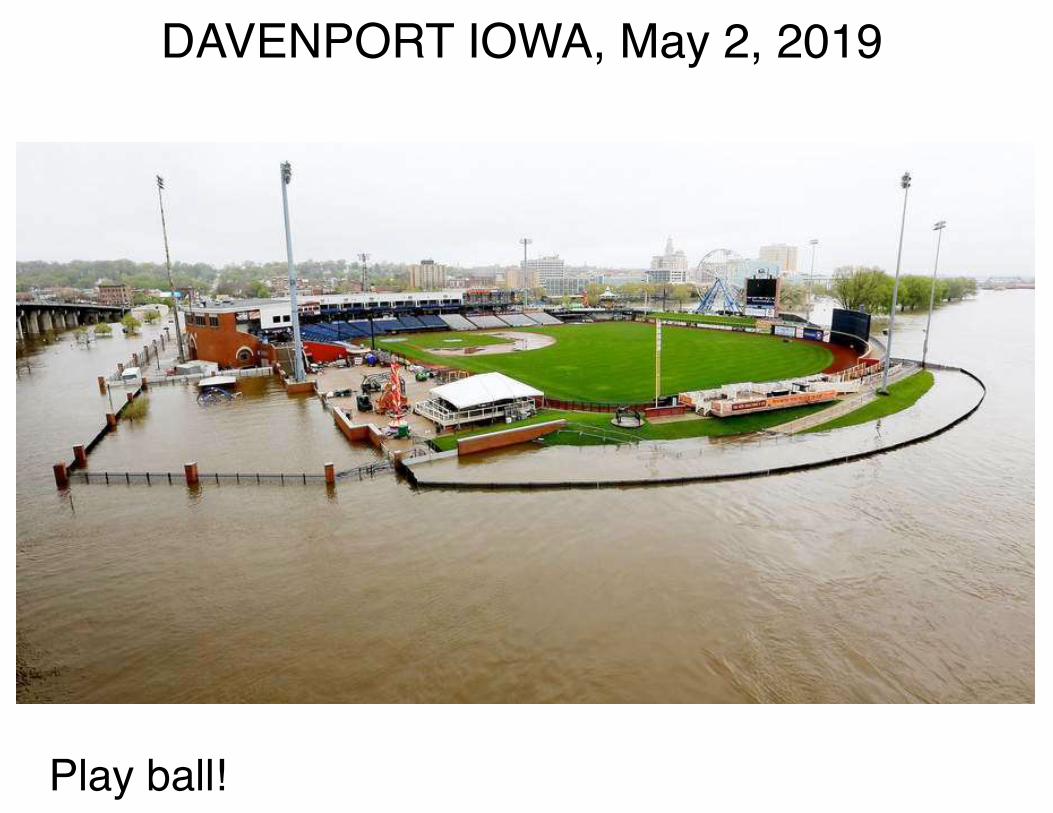
DAVENPORT IOWA, May 2, 2019
Play ball!

DAVENPORT IOWA, July 5, 2019
Play ball!

SAND SPRINGS, OKLAHOMA, May 28, 2019

SAND SPRINGS, OKLAHOMA, May 29, 2019
Highway flooding along Arkansas River
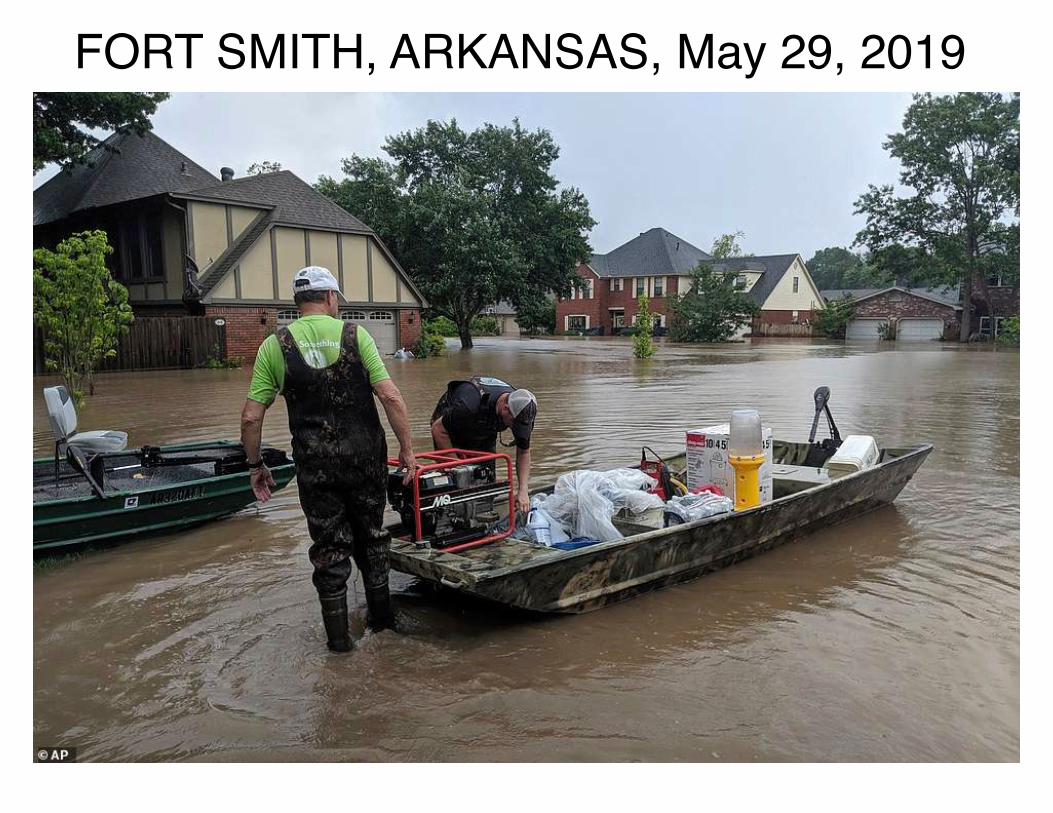
FORT SMITH, ARKANSAS, May 29, 2019
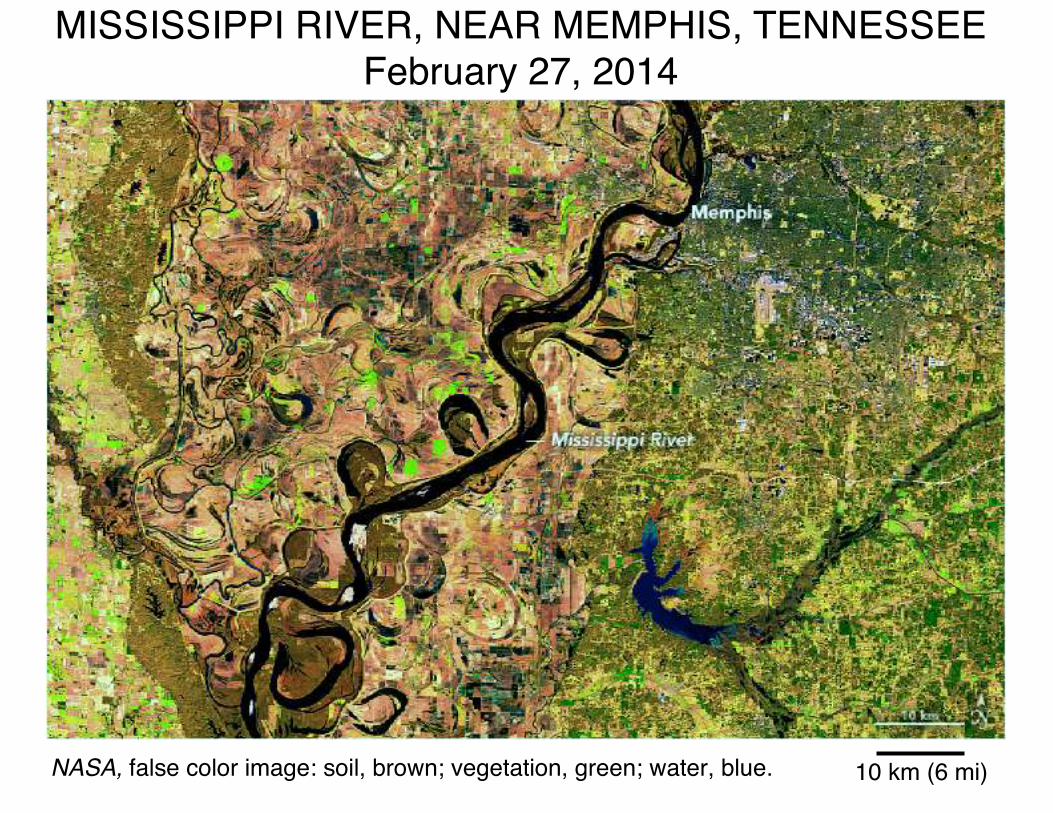
February 27, 2014MISSISSIPPI RIVER, NEAR MEMPHIS, TENNESSEE
10 km (6 mi)NASA, false color image: soil, brown; vegetation, green; water, blue.
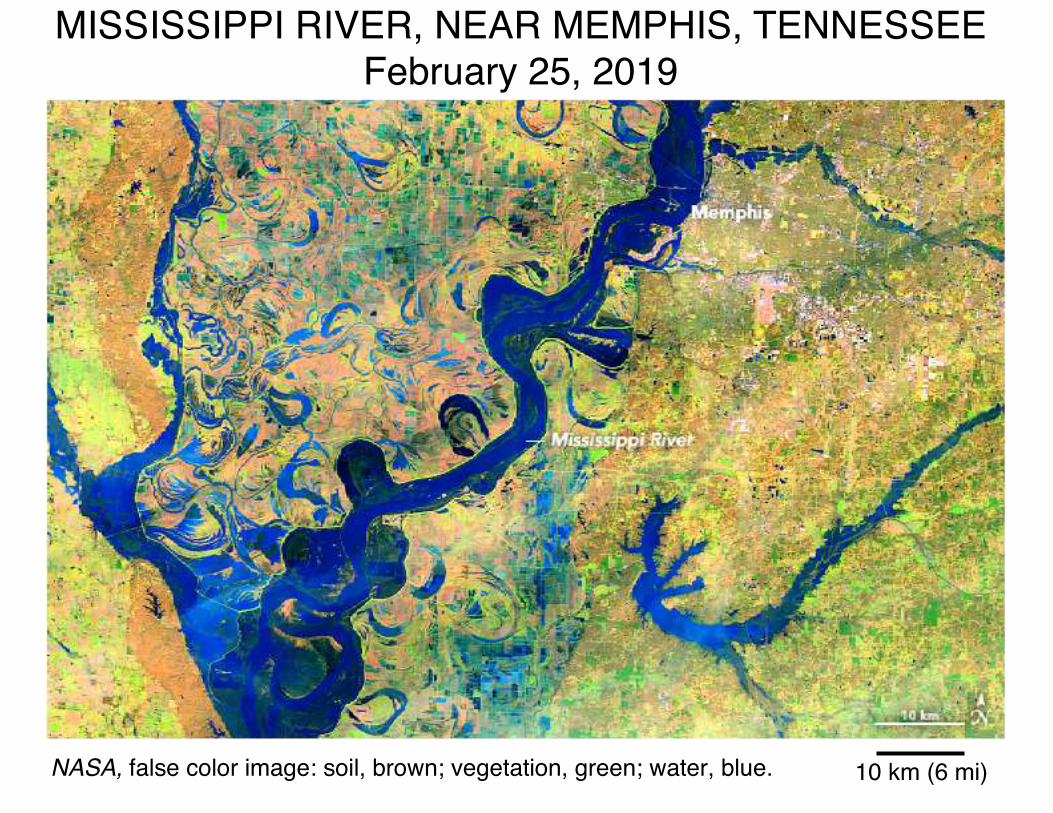
February 25, 2019MISSISSIPPI RIVER, NEAR MEMPHIS, TENNESSEE
10 km (6 mi)NASA, false color image: soil, brown; vegetation, green; water, blue.
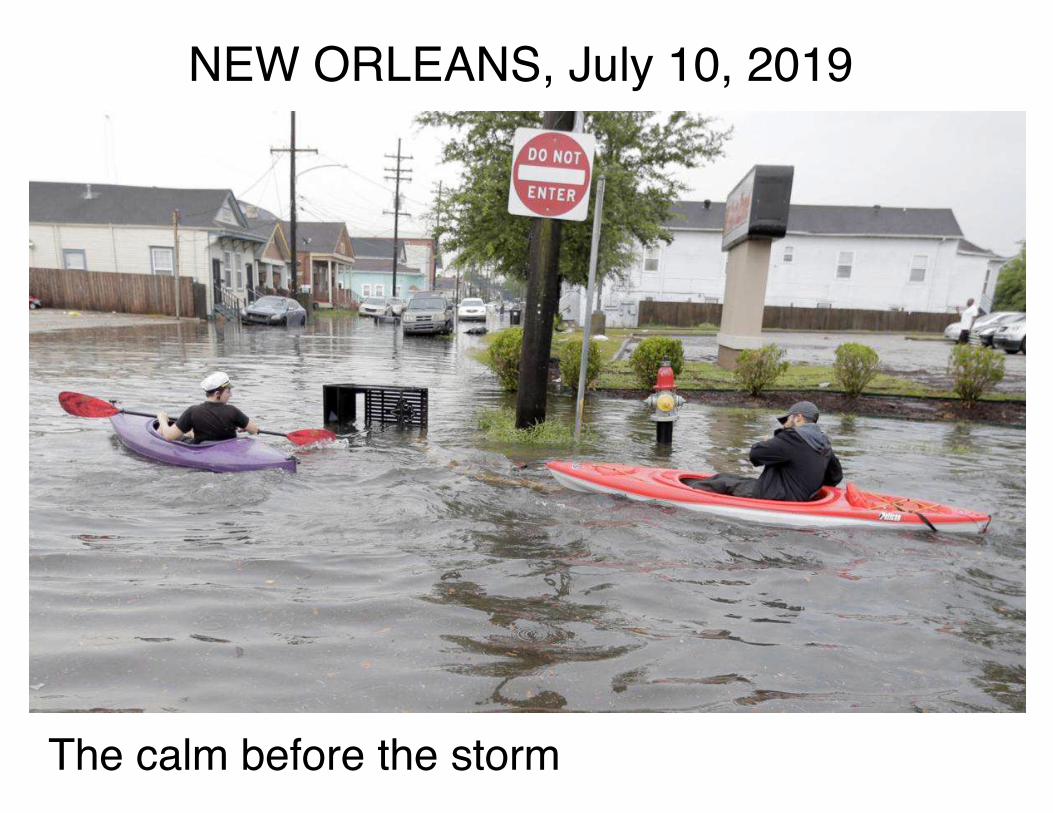
NEW ORLEANS, July 10, 2019
The calm before the storm
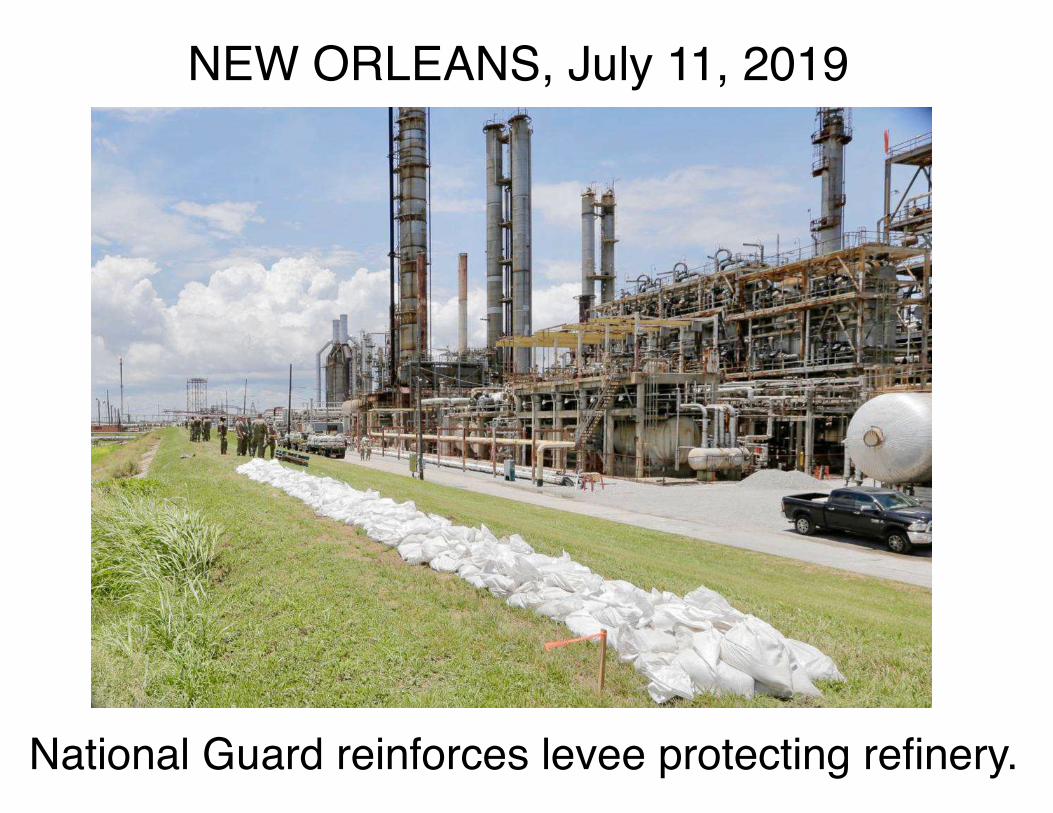
NEW ORLEANS, July 11, 2019
National Guard reinforces levee protecting refinery.

NEW ORLEANS, July 11, 2019
Lines to tank up before the storm.
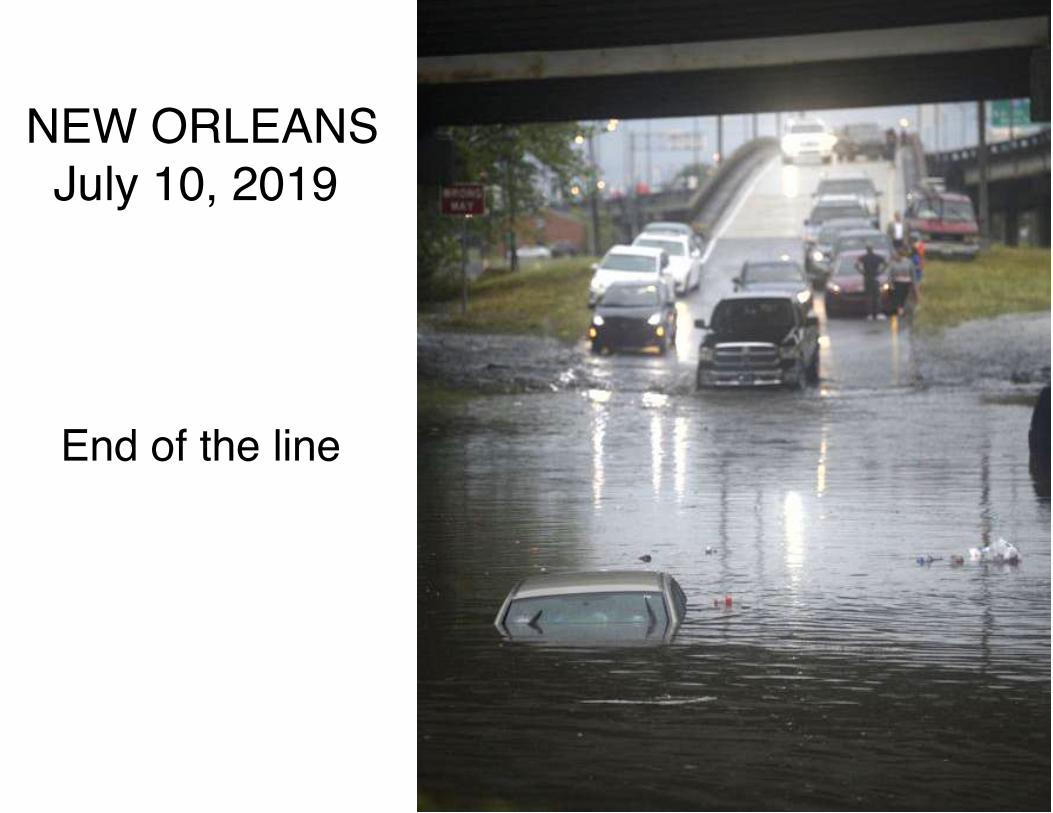
NEW ORLEANSJuly 10, 2019
End of the line

NEW ORLEANS, July 13, 2019
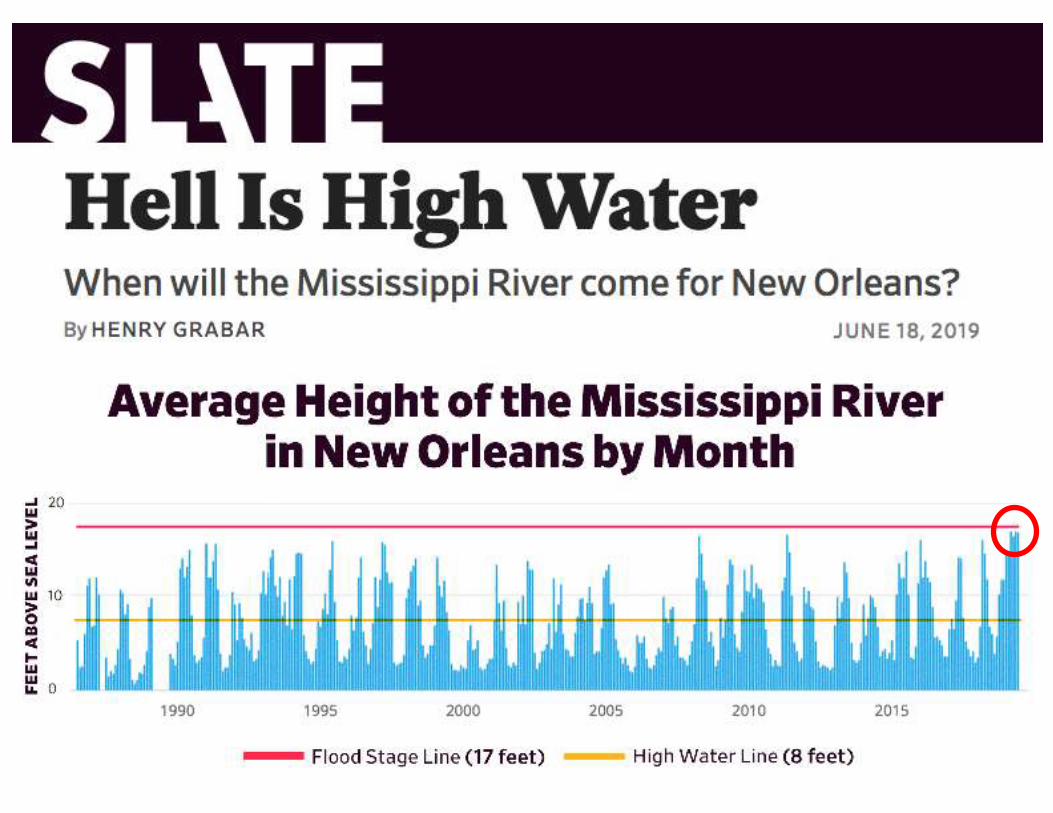

What has happened is the weather changed. The 12 months ending in April were the wettest yearlong period in the United States and caused devastating flooding across the watersheds of the Mississippi. This is not explicitly a product of climate change, but it does align with our expectation of how the warmer atmosphere will alter—and is already altering—precipitation patterns. One of the most unnerving aspects of this year’s record high water is that it now coincides with the start of hurricane season.For now, that is an unlikely event that should not keep the 1.275 million people in Greater New Orleans up at night. Big hurricanes don’t typically arrive in the gulf until late August and September.
THE NEW NORMAL?
SUPERSTORM SANDY
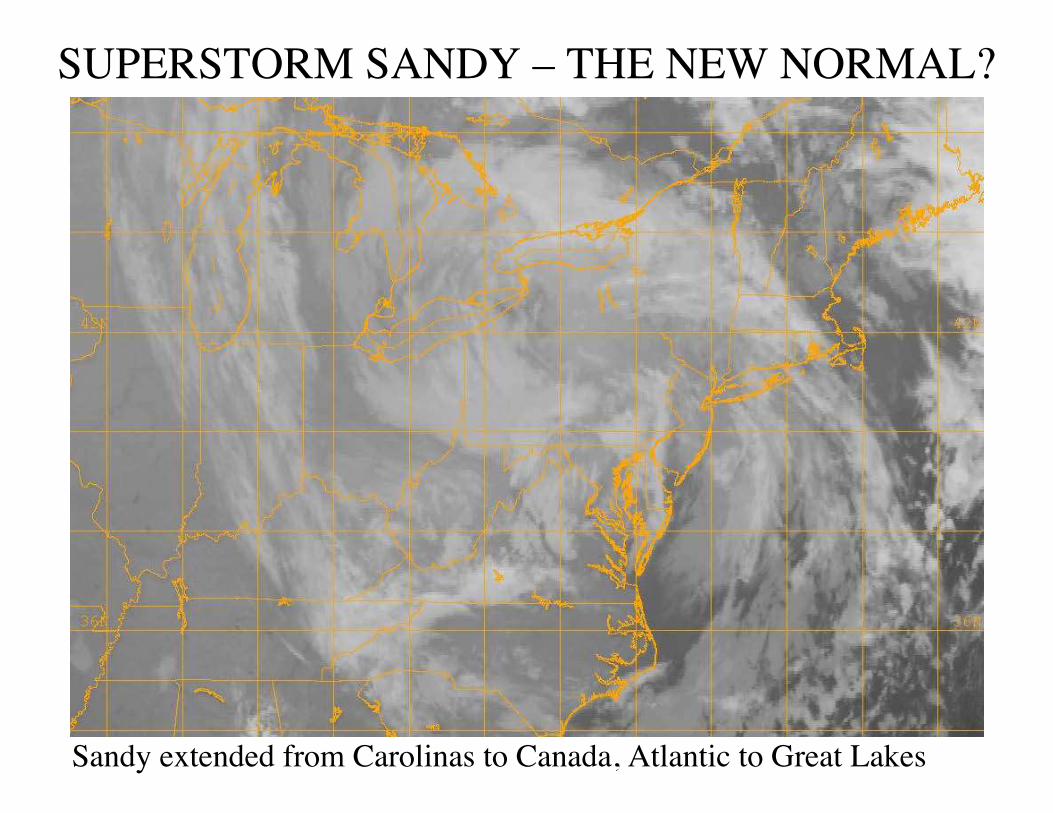
SUPERSTORM SANDY – THE NEW NORMAL?
Sandy extended from Carolinas to Canada, Atlantic to Great Lakes
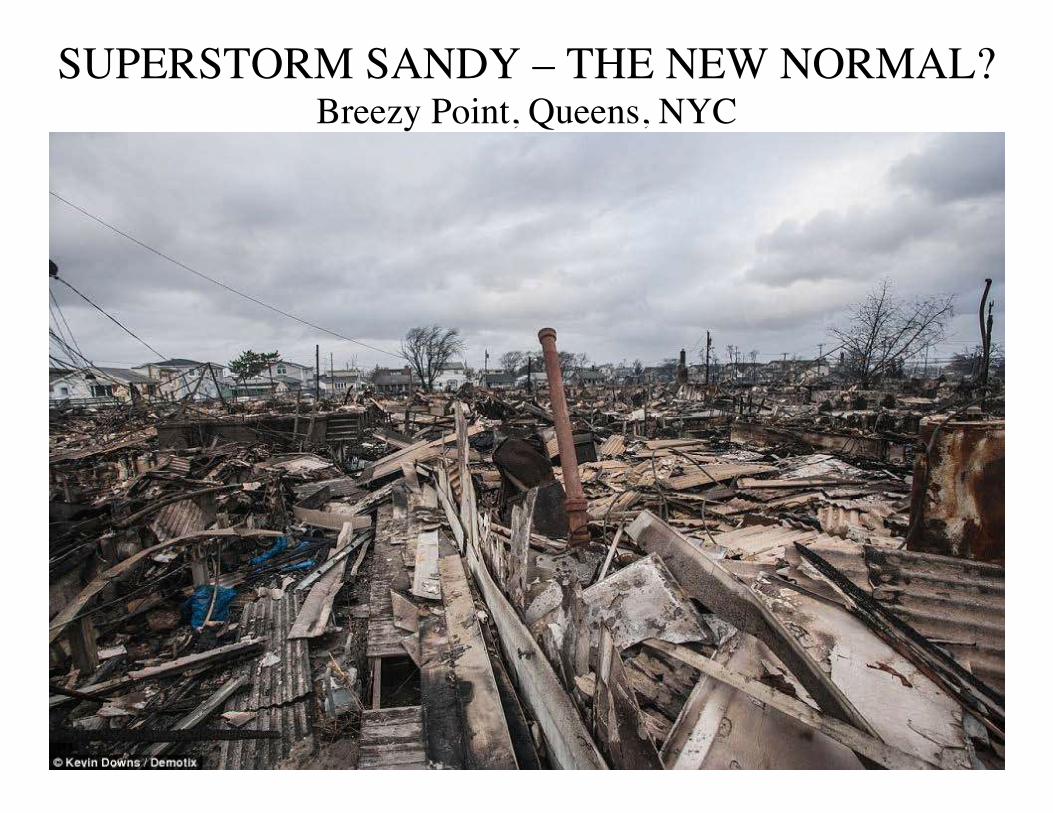
SUPERSTORM SANDY – THE NEW NORMAL? Breezy Point, Queens, NYC
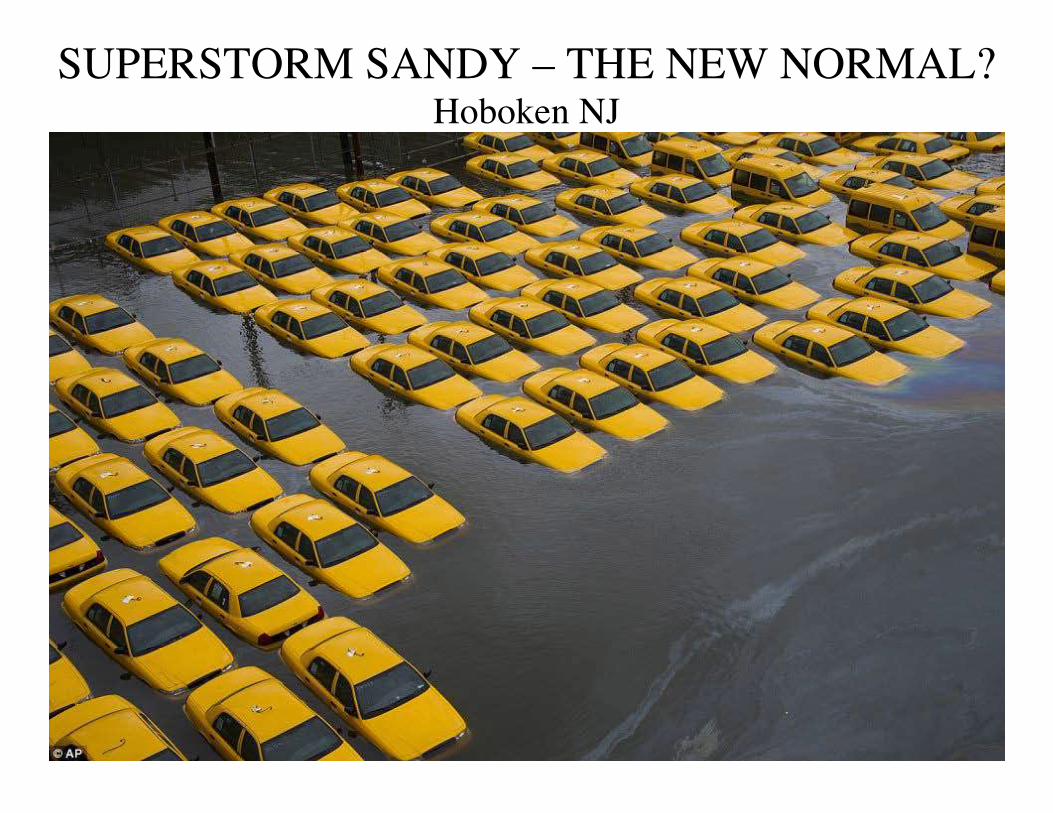
SUPERSTORM SANDY – THE NEW NORMAL? Hoboken NJ
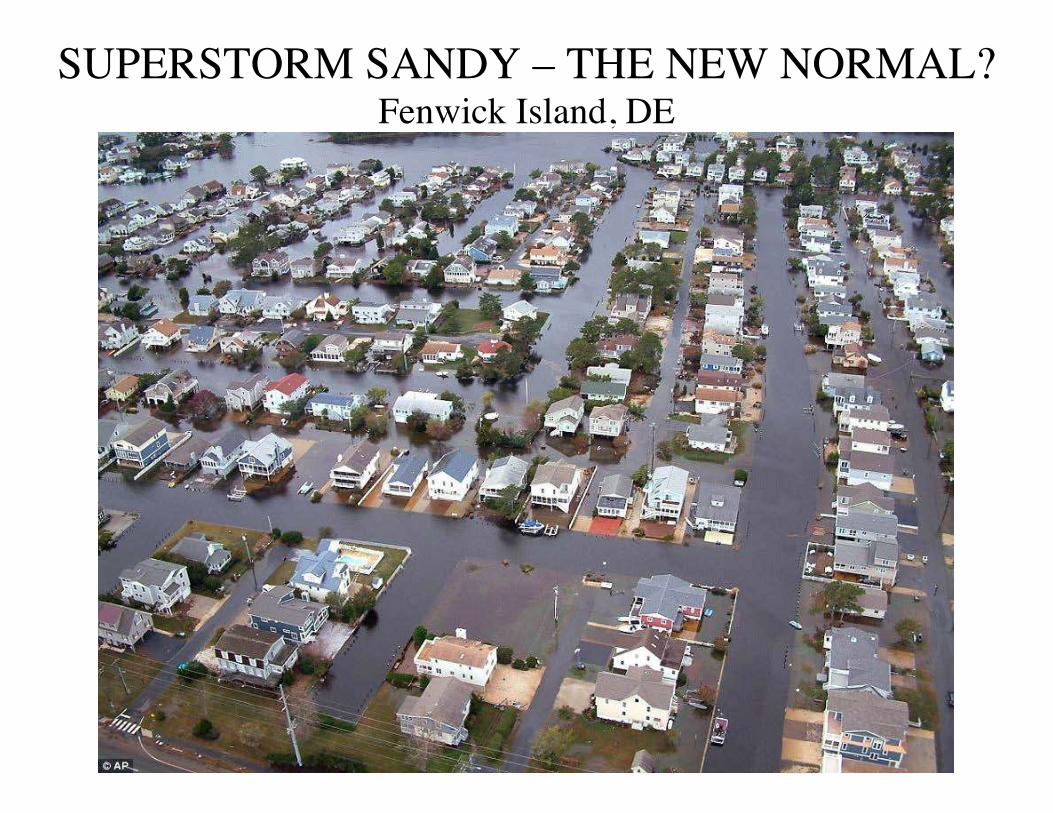
SUPERSTORM SANDY – THE NEW NORMAL? Fenwick Island, DE
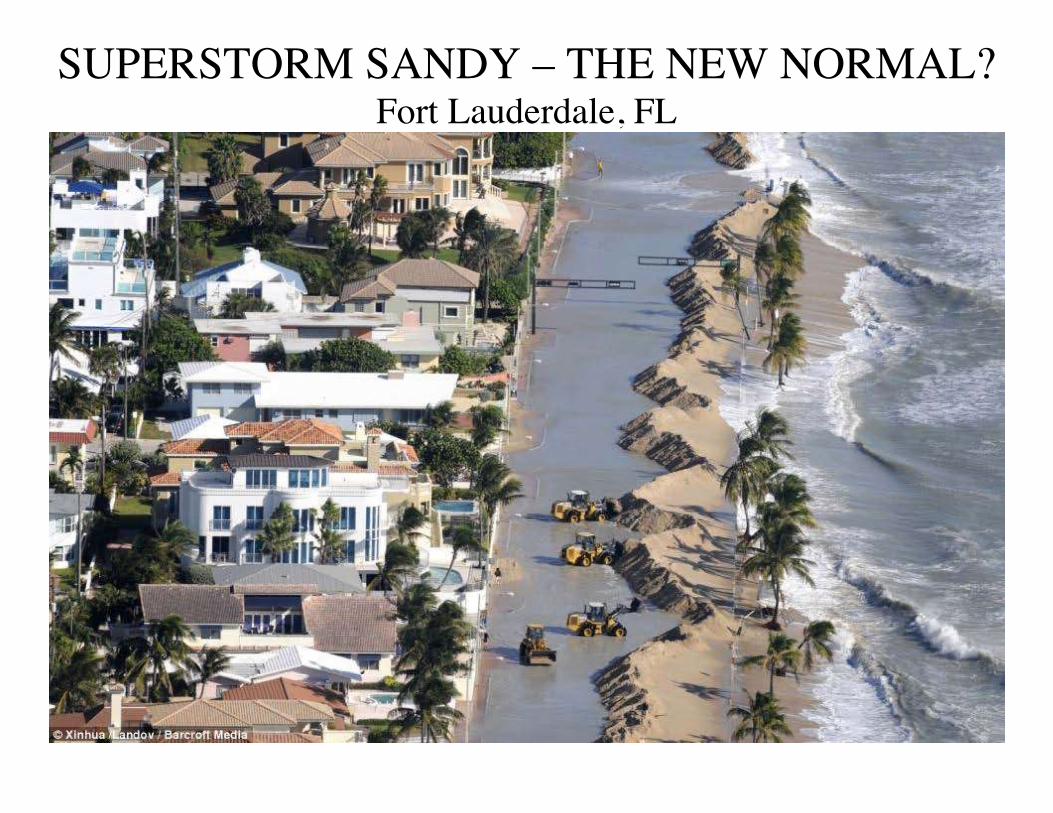
SUPERSTORM SANDY – THE NEW NORMAL? Fort Lauderdale, FL
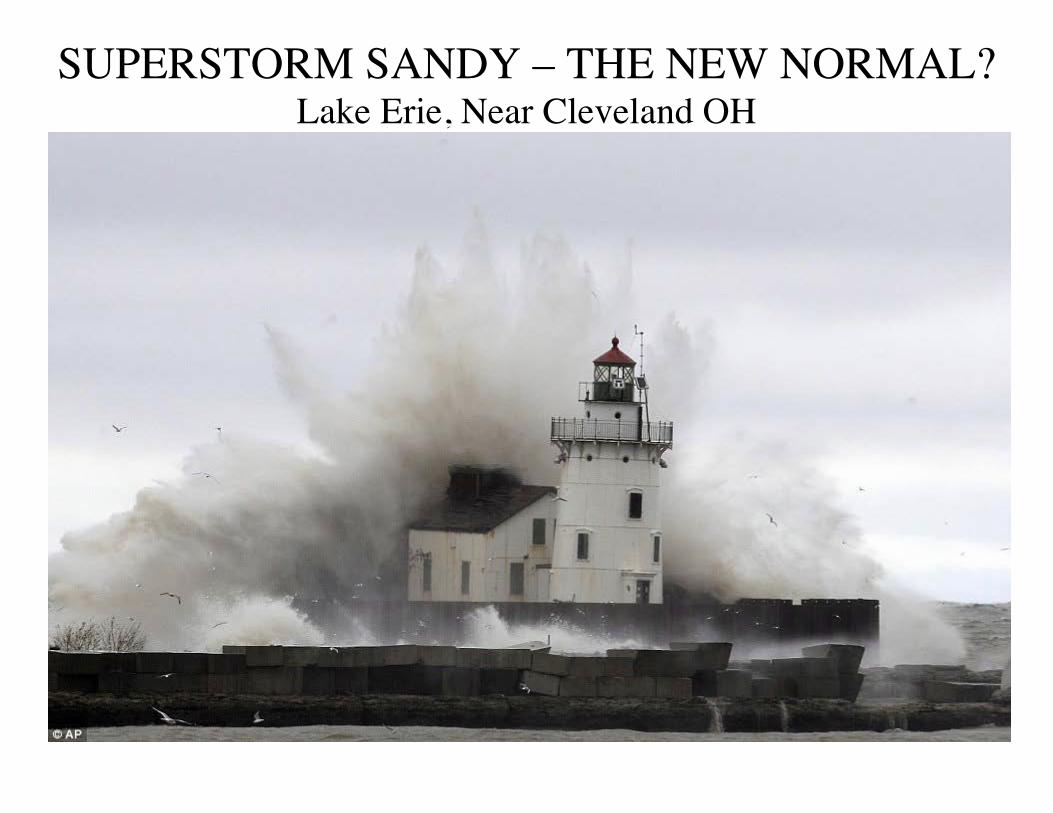
SUPERSTORM SANDY – THE NEW NORMAL? Lake Erie, Near Cleveland OH
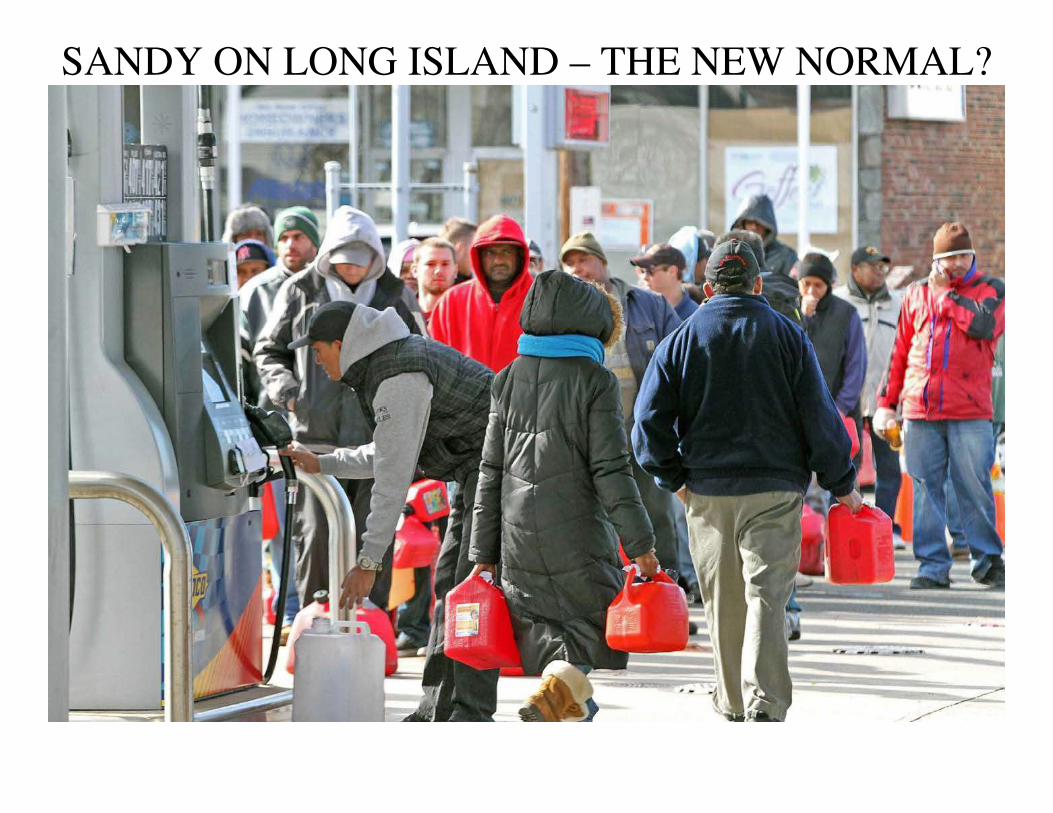
SANDY ON LONG ISLAND – THE NEW NORMAL?
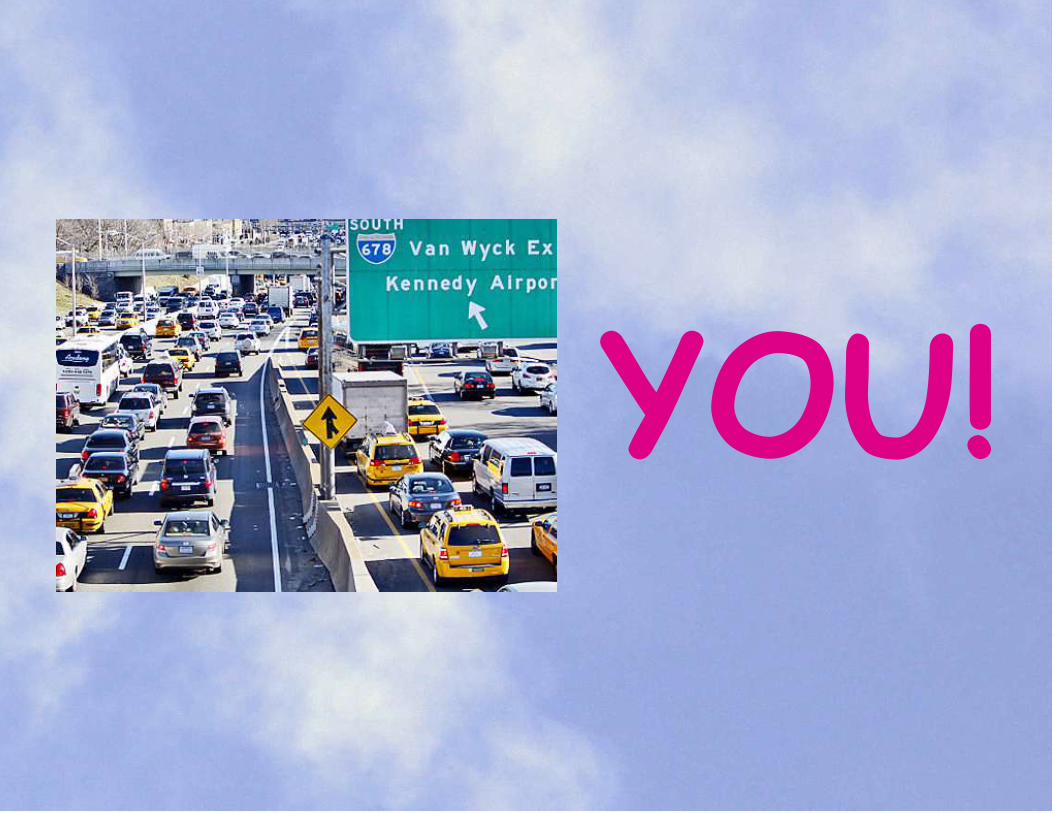
YOU!
WHO IS RESPONSIBLE?
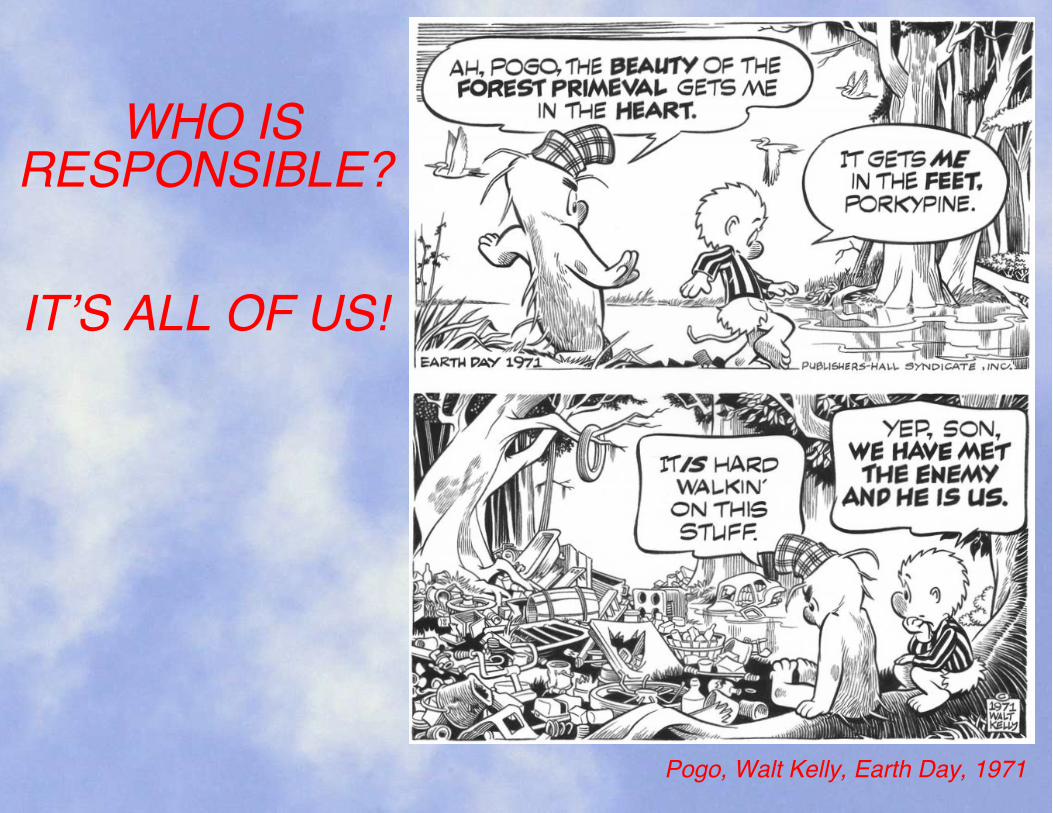
WHO ISRESPONSIBLE?
IT’S ALL OF US!
Pogo, Walt Kelly, Earth Day, 1971

IS THERE ANYTHING WE CAN DO?

Julyy, 2019
This would require reforestation of an area equal to that of the continental United States!

SOLAR PHOTOVOLTAIC ENERGY Decrease your carbon legacy by generating your own electricity
Decrease your electric bill, too; maybe even to zero!
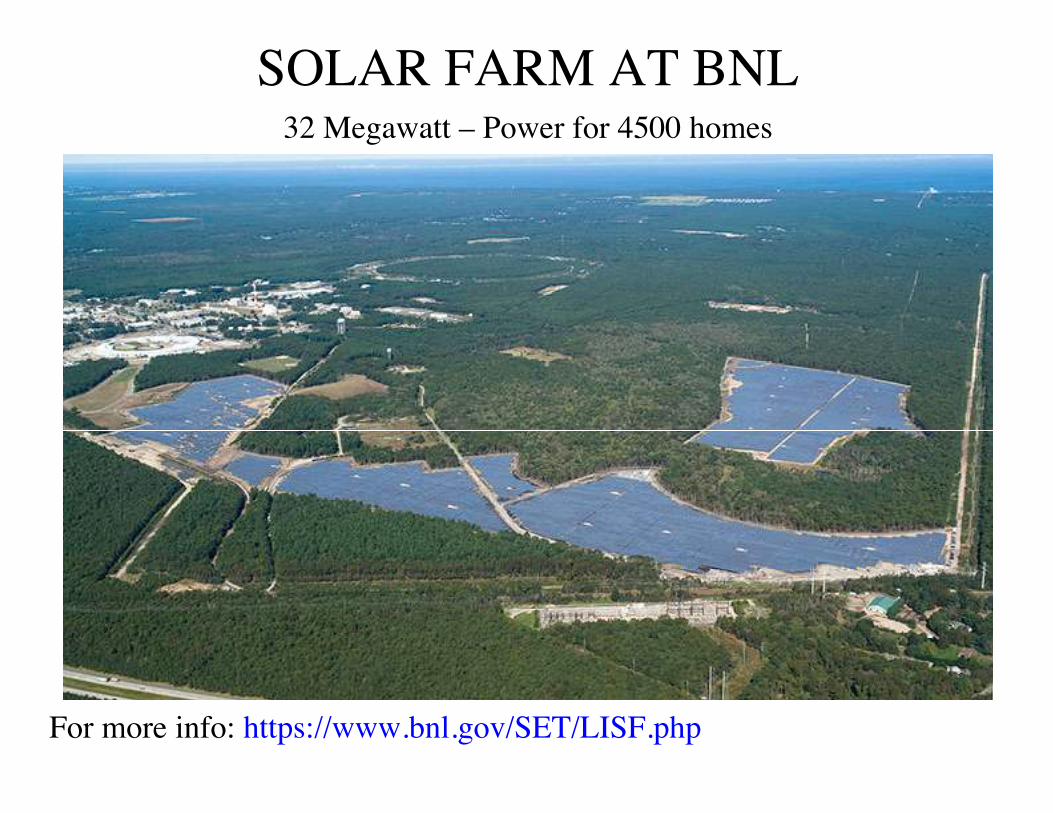
SOLAR FARM AT BNL32 Megawatt – Power for 4500 homes
For more info: https://www.bnl.gov/SET/LISF.php
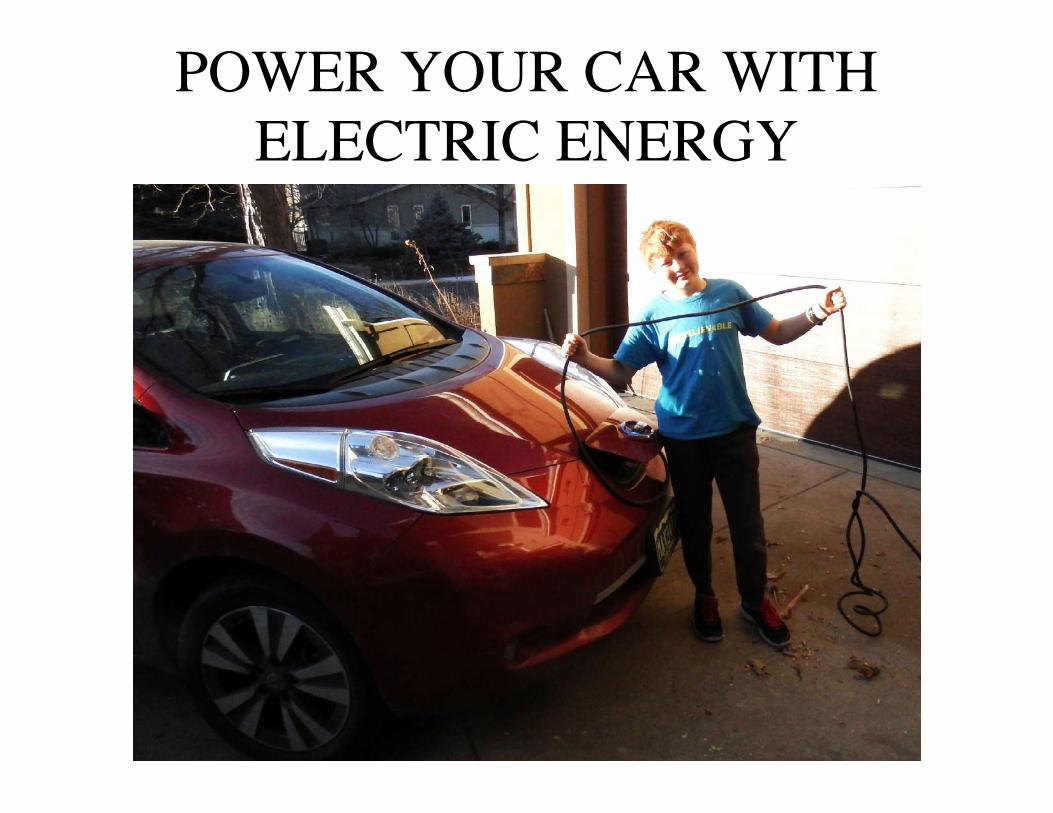
POWER YOUR CAR WITH ELECTRIC ENERGY
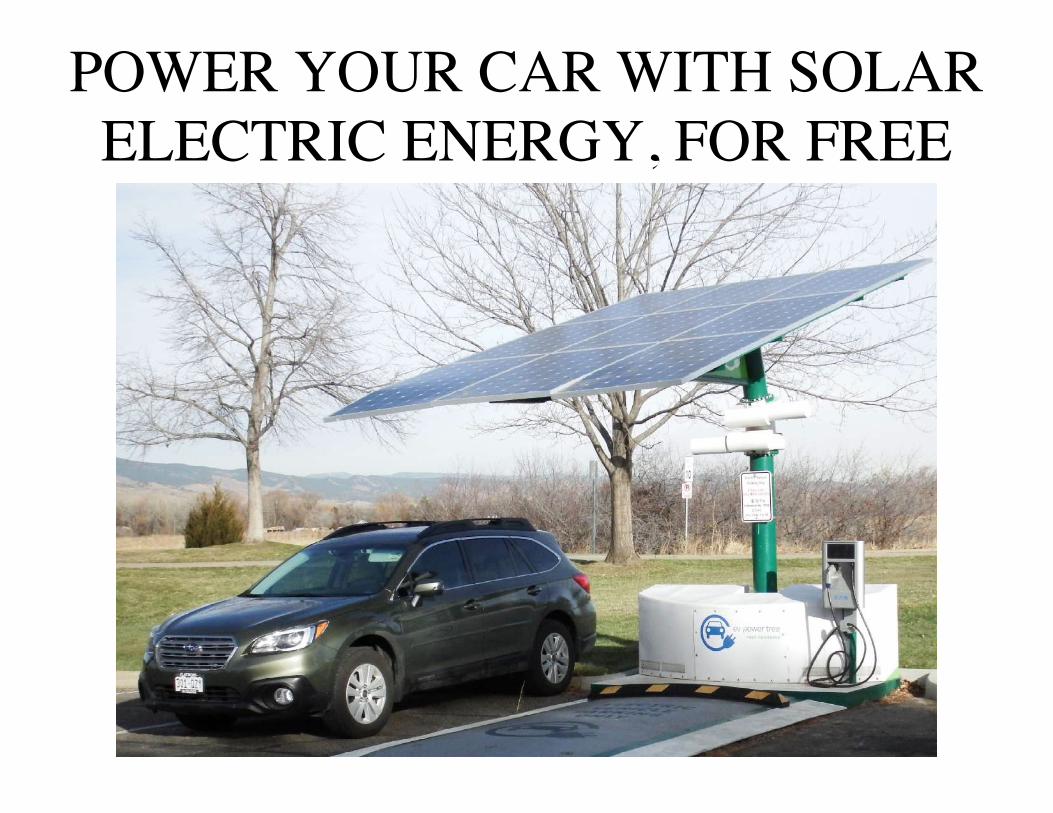
POWER YOUR CAR WITH SOLAR ELECTRIC ENERGY, FOR FREE
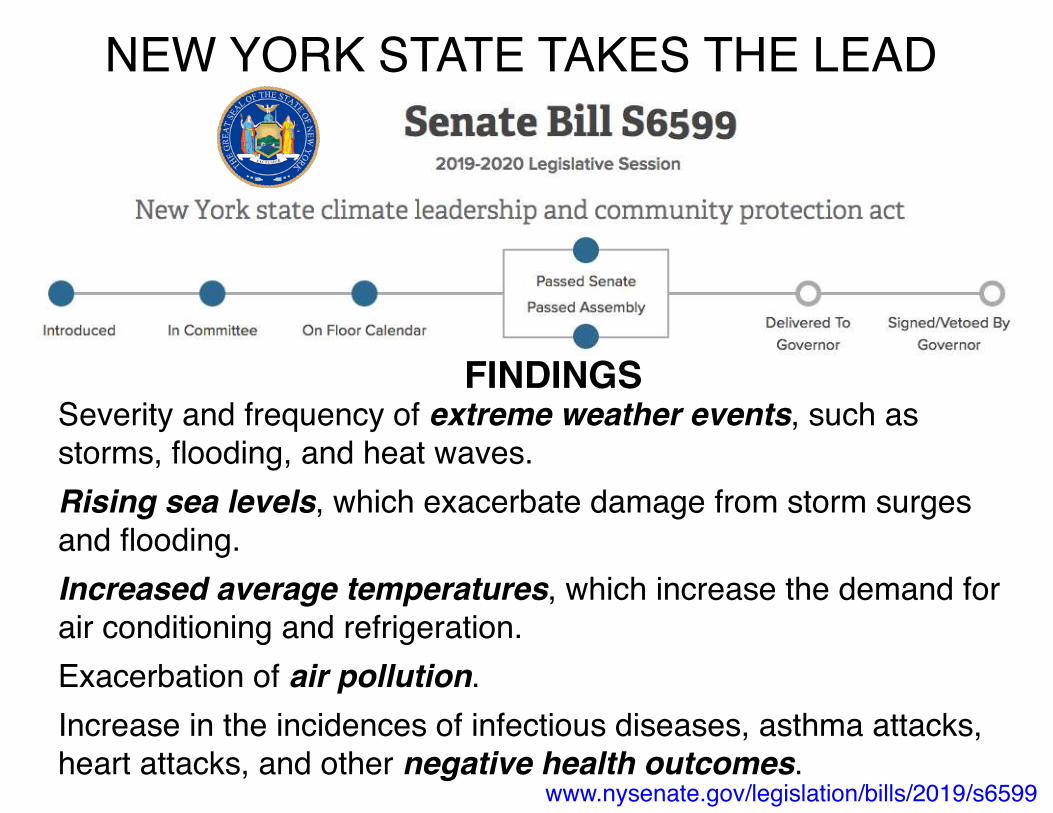
NEW YORK STATE TAKES THE LEAD
Severity and frequency of extreme weather events, such as storms, flooding, and heat waves.Rising sea levels, which exacerbate damage from storm surges and flooding.Increased average temperatures, which increase the demand for air conditioning and refrigeration. Exacerbation of air pollution.Increase in the incidences of infectious diseases, asthma attacks, heart attacks, and other negative health outcomes.
FINDINGS
www.nysenate.gov/legislation/bills/2019/s6599
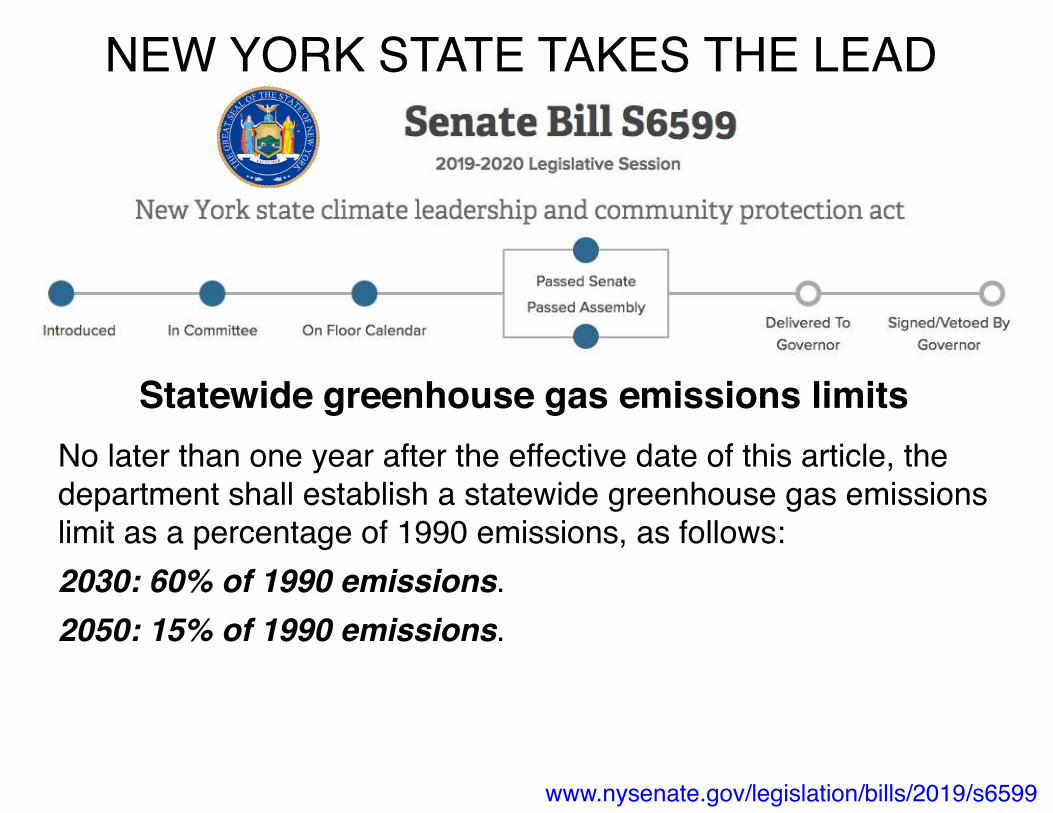
NEW YORK STATE TAKES THE LEAD
No later than one year after the effective date of this article, the department shall establish a statewide greenhouse gas emissions limit as a percentage of 1990 emissions, as follows:2030: 60% of 1990 emissions.2050: 15% of 1990 emissions.
Statewide greenhouse gas emissions limits
www.nysenate.gov/legislation/bills/2019/s6599
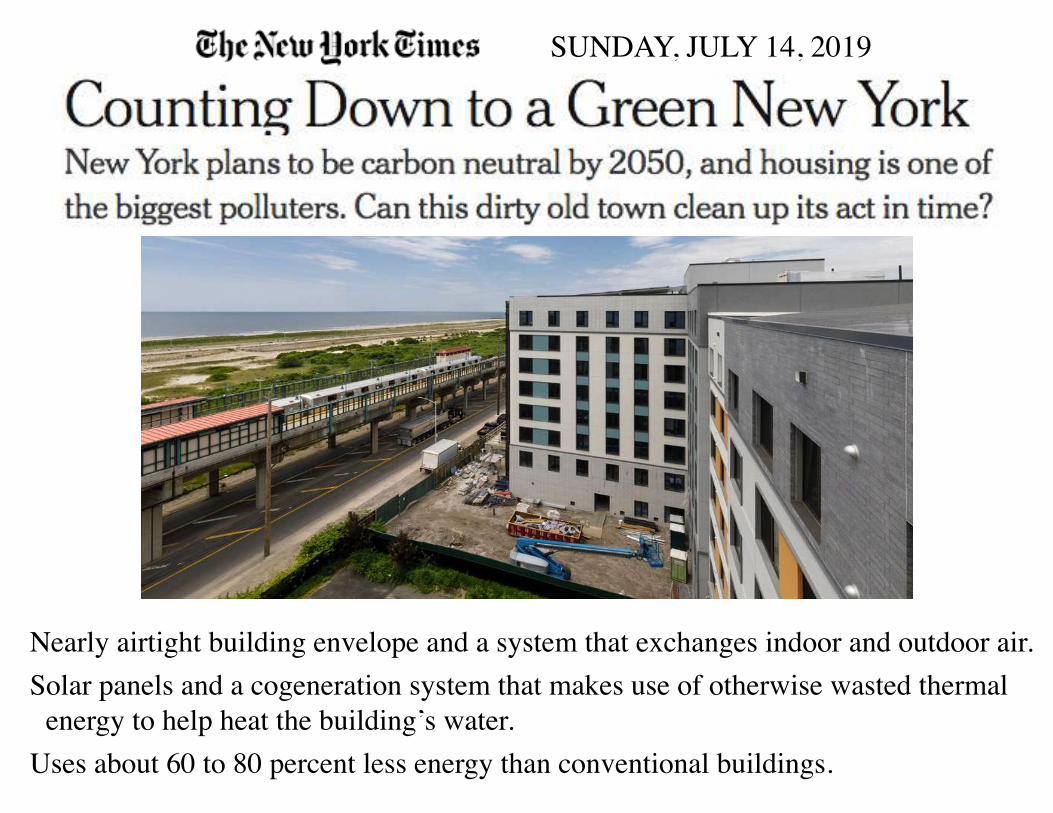
SUNDAY, JULY 14, 2019
Nearly airtight building envelope and a system that exchanges indoor and outdoor air.Solar panels and a cogeneration system that makes use of otherwise wasted thermal
energy to help heat the building’s water.Uses about 60 to 80 percent less energy than conventional buildings.
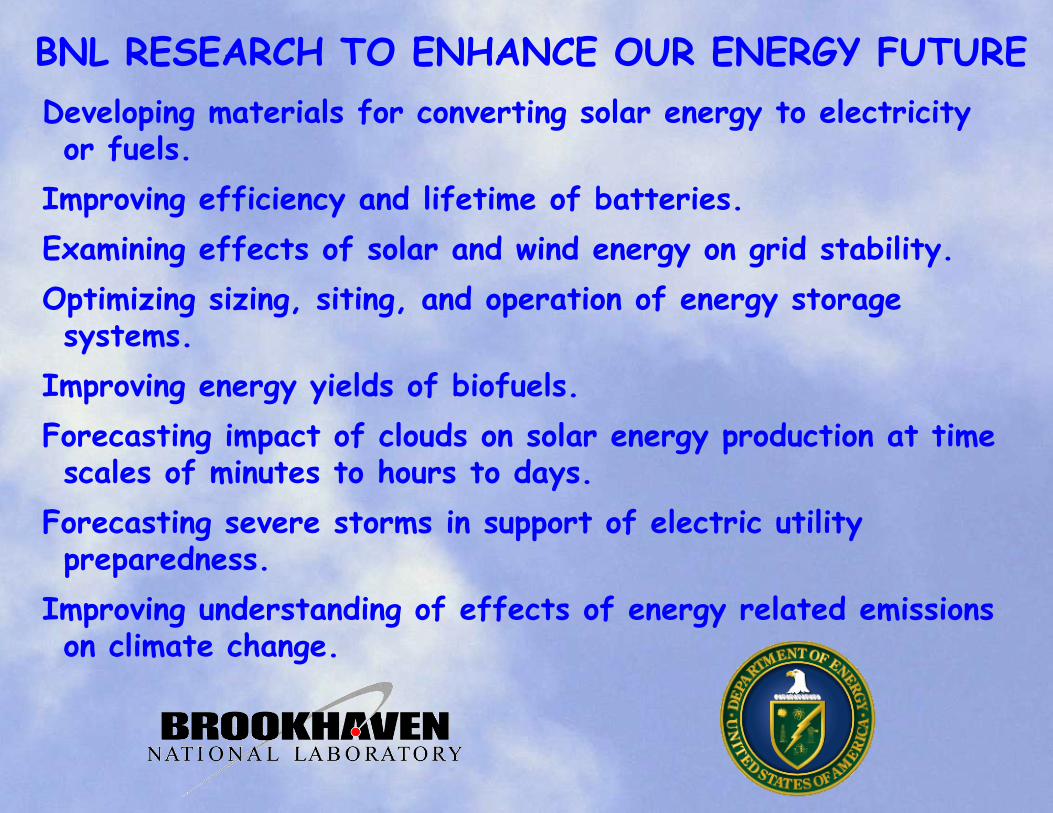
Developing materials for converting solar energy to electricity or fuels.
Improving efficiency and lifetime of batteries.Examining effects of solar and wind energy on grid stability. Optimizing sizing, siting, and operation of energy storage systems.
Improving energy yields of biofuels.Forecasting impact of clouds on solar energy production at time scales of minutes to hours to days.
Forecasting severe storms in support of electric utility preparedness.
Improving understanding of effects of energy related emissions on climate change.
BNL RESEARCH TO ENHANCE OUR ENERGY FUTURE

BNL RESEARCH IS HELPINGTO ANSWER THESE QUESTIONS.
THANK YOU !
Dr. Steve (Stephen E. Schwartz)www.bnl.gov/envsci/schwartz
Recent popular lectures