engeomap - tutorial for application: basic minerals and...
TRANSCRIPT

EnGeoMAP Tutorial for Application: Basic minerals
and rare earth elements mapping
EnMAP Technical Report
Nina Boesche; Christian Mielke, Christian Rogass
15.04.2016

Recommended citation:
Boesche, N.; Mielke, C.; Rogass; C. (2016) EnGeoMAP - Tutorial for Application: Basic minerals and rare earth elements mapping. EnMAP Technical Report, GFZ Data Services. DOI: http://doi.org/10.2312.enmap.2016.003
Imprint
EnMAP Consortium
GFZ Data Services
Telegrafenberg D-14473 Potsdam
Published in Potsdam, Germany April 2016
http://doi.org/10.2312.enmap.2016.003
EnGeoMAP
Tutorial for Application: Basic minerals and rare earth elements mapping
Last manual update
15.04.2016
Authors
Nina Boesche ([email protected]), Christian Mielke ([email protected]), Christian Rogass ([email protected])
EnMAP Technical Report EnGeoMAP – doi:10.2312/enmap.2016.003 2
Contents
1 Concept of EnGeoMAP ........................................................................... 3
2 Background .......................................................................................... 5
3 User Guide ........................................................................................... 6
Data import ............................................................................................ 6
EnGeoMAP Base ...................................................................................... 7
EnGeoMAP REE ...................................................................................... 10
4 References ......................................................................................... 13
Terms of Use EnGeoMAP 2.0 ...................................................................... 15
EnMAP Technical Report EnGeoMAP – doi:10.2312/enmap.2016.003 3
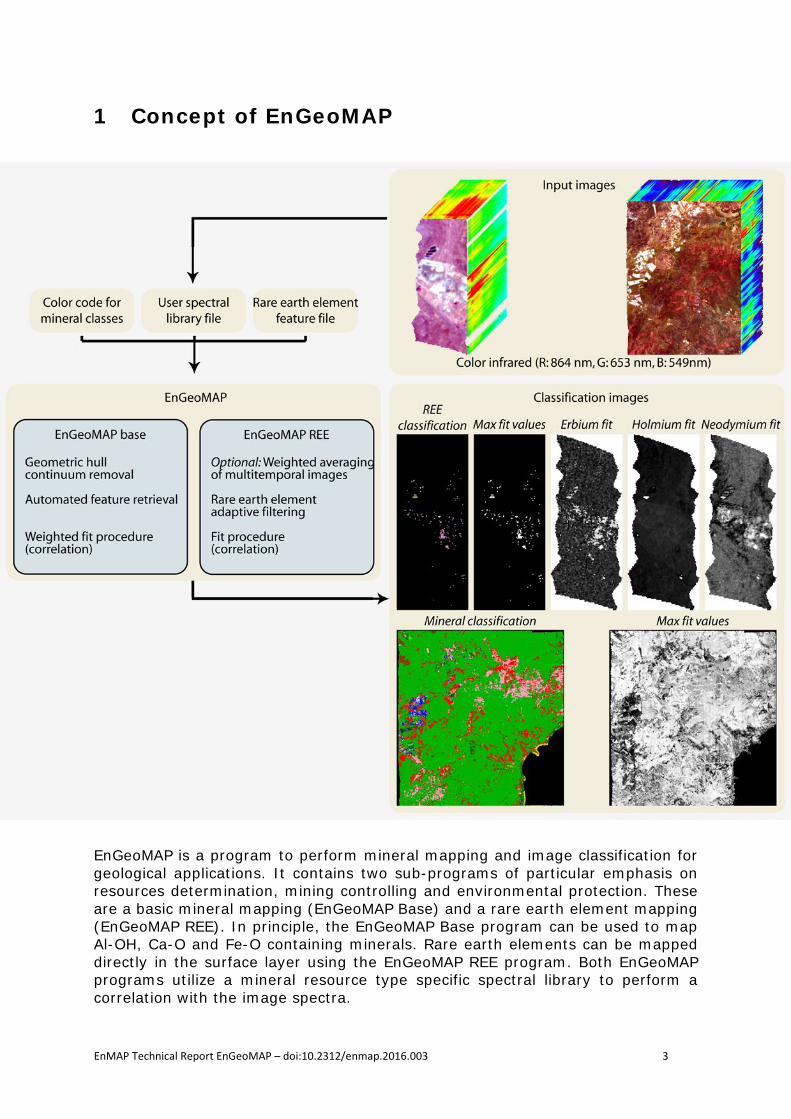
1 Concept of EnGeoMAP
EnGeoMAP is a program to perform mineral mapping and image classification for geological applications. It contains two sub-programs of particular emphasis on resources determination, mining controlling and environmental protection. These are a basic mineral mapping (EnGeoMAP Base) and a rare earth element mapping (EnGeoMAP REE). In principle, the EnGeoMAP Base program can be used to map Al-OH, Ca-O and Fe-O containing minerals. Rare earth elements can be mapped directly in the surface layer using the EnGeoMAP REE program. Both EnGeoMAP programs utilize a mineral resource type specific spectral library to perform a correlation with the image spectra.
EnMAP Technical Report EnGeoMAP – doi:10.2312/enmap.2016.003 4
The spectral library for the EnGeoMAP Base program mainly contains a variety of spectra suitable to classify hydrothermal deposits, such as epigenetic and sedimentary hydrothermal deposits (copper, gold, iron, lead, zinc bearing). The spectral library for the EnGeoMAP REE program contains synthetic produced spectra of around 1% of a specific rare earth element in a calcitic matrix. In addition, user specific spectral libraries can be imported into both EnGeoMAP programs. The main difference between both EnGeoMAP programs is the pre-processing of the spectral libraries and satellite input images, as well as the absorption feature definition. EnGeoMAP Base retrieves the feature information automatically by automatic continuum removal (geometric hull) and a signal-to-noise ratio adapted feature definition and retrieval (Mielke et al., 2016). Subsequently, the extracted features are weighted according to their shape and handed over to the correlation step.
The EnGeoMAP REE program consists of a signal-to-noise-ratio weighted averaging of multitemporal acquired images and an adaptive filtering for the rare earth element related absorption bands (Boesche et al., 2015a, Boesche et al., 2015b). In this program the feature retrieval is knowledge based and can be modified by the user.

EnMAP Technical Report EnGeoMAP – doi:10.2312/enmap.2016.003 5
2 Background Minerals, or more specifically, ore minerals contain economically valuable elements (mainly metals), which are essential to modern industry and therefore to the development of society. The constantly changing demand of ores and the criticality to the producing industry causes perennial re-evaluations of existing occurrences, deposits and mines, and the global detection and validation of new deposits. Among geophysical and geochemical field surveys, hyperspectral remote sensing surveys are increasingly applied to exploration investigations.
The basic principle of hyperspectral remote sensing for mineral detection is the mathematical description and statistical analysis of material characteristic signals in the spectral ranges of the visible and infrared wavelength range (Clark et al., 2003; Hunt, 1977; Mielke et al., 2016; Swayze et al., 2014; van der Meer, 2004; van der Meer et al., 2012). These characteristic signals (absorption bands) are physically Based on electronic transitions in the d- or f-orbitals of the elements (e.g. transitions into the valence band for Fe, and crystal field transitions for rare earth elements), or vibrational motions and their overtones in the molecular bonds (e.g. Fe-OH and Mg-OH in amphiboles, Al-OH in clay minerals, CO3 in calcium carbonates) (Dieke & Crosswhite, 1963; Hunt, 1977; Mielke et al., 2016; Swayze et al., 2014).
Mineral mapping programs (e.g. the USGS Tetracorder and its successor MICA, and the EnGeoMAP) and image analysis software (e.g. EnMAP-Box, and ENVI-Exelis Visual Information Solutions) utilize the mineral characteristic absorption bands to spectroscopically characterize and map surface materials (Clark et al., 2003; Mielke et al., 2016; van der Linden et al., 2015). The characteristic absorption bands of hyperspectral identifiable minerals serve as a proxy for the lithological units of the different deposit types. These proxy minerals include for example, alunite, chlorite, dickite, epidote, jarosite, kaolinite, and sericite. They serve as key indicators representative for epigenetic and sedimentary hydrothermal deposits (copper, gold, iron, lead, zinc bearing) (Mielke et al., 2016; Swayze et al., 2014).
Carbonatite-alkaline igneous related deposits (rare earth element, lithium, tantalum, niobium bearing) can be mapped using the ankerite, calcite, dolomite, epidote, rare earth element absorption bands, and the clay mineral/carbonates ratio (Boesche, 2015; Boesche et al., 2015a; 2015b; D. J. Turner et al, 2014a; 2014b). In this manner proxy minerals can be found for most deposit types and thus their occurrences can be mapped. In addition to mineral mapping for resource detection, mining monitoring, natural erosion and environmental pollution as well as Earth’s crust forming processes (e.g. volcanic activities) can be assessed using the aforementioned mineral mapping methodologies.
EnMAP Technical Report EnGeoMAP – doi:10.2312/enmap.2016.003 6
3 User Guide Data import
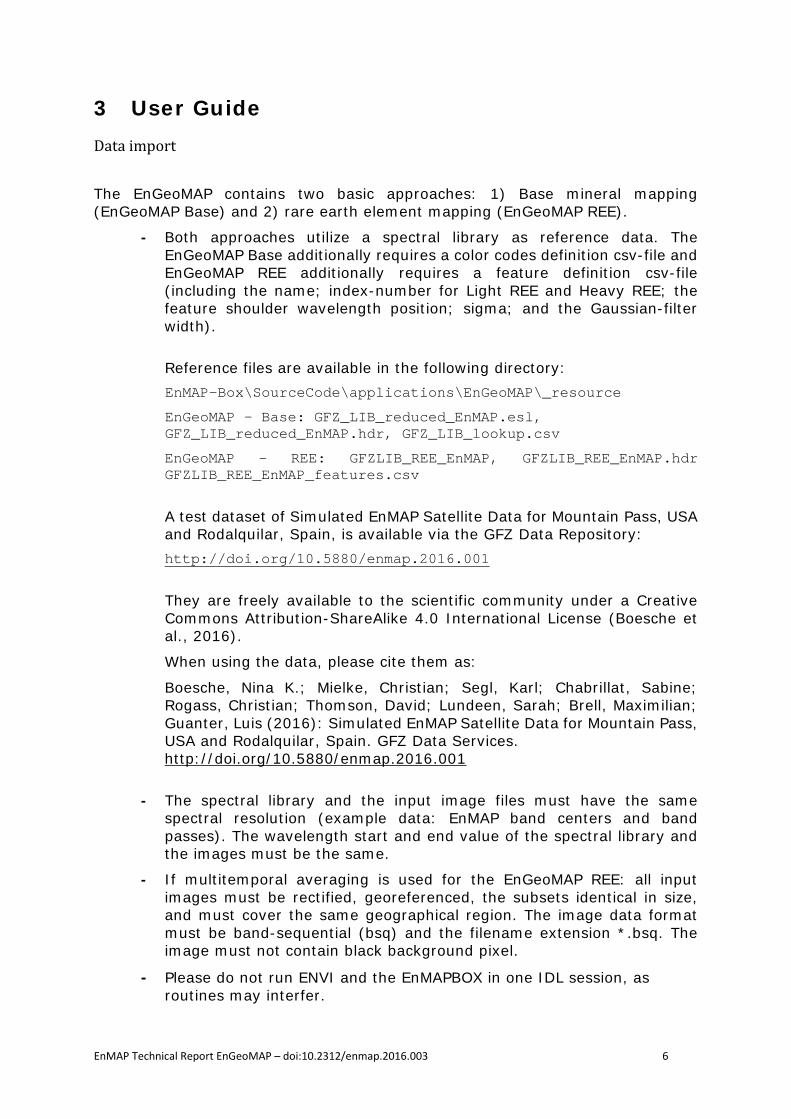
The EnGeoMAP contains two basic approaches: 1) Base mineral mapping (EnGeoMAP Base) and 2) rare earth element mapping (EnGeoMAP REE).
- Both approaches utilize a spectral library as reference data. The EnGeoMAP Base additionally requires a color codes definition csv-file and EnGeoMAP REE additionally requires a feature definition csv-file (including the name; index-number for Light REE and Heavy REE; the feature shoulder wavelength position; sigma; and the Gaussian-filter width).
Reference files are available in the following directory: EnMAP-Box\SourceCode\applications\EnGeoMAP\_resource
EnGeoMAP – Base: GFZ_LIB_reduced_EnMAP.esl, GFZ_LIB_reduced_EnMAP.hdr, GFZ_LIB_lookup.csv
EnGeoMAP – REE: GFZLIB_REE_EnMAP, GFZLIB_REE_EnMAP.hdr GFZLIB_REE_EnMAP_features.csv
A test dataset of Simulated EnMAP Satellite Data for Mountain Pass, USA and Rodalquilar, Spain, is available via the GFZ Data Repository: http://doi.org/10.5880/enmap.2016.001
They are freely available to the scientific community under a Creative Commons Attribution-ShareAlike 4.0 International License (Boesche et al., 2016).
When using the data, please cite them as:
Boesche, Nina K.; Mielke, Christian; Segl, Karl; Chabrillat, Sabine; Rogass, Christian; Thomson, David; Lundeen, Sarah; Brell, Maximilian; Guanter, Luis (2016): Simulated EnMAP Satellite Data for Mountain Pass, USA and Rodalquilar, Spain. GFZ Data Services. http://doi.org/10.5880/enmap.2016.001
- The spectral library and the input image files must have the same spectral resolution (example data: EnMAP band centers and band passes). The wavelength start and end value of the spectral library and the images must be the same.
- If multitemporal averaging is used for the EnGeoMAP REE: all input images must be rectified, georeferenced, the subsets identical in size, and must cover the same geographical region. The image data format must be band-sequential (bsq) and the filename extension *.bsq. The image must not contain black background pixel.
- Please do not run ENVI and the EnMAPBOX in one IDL session, as routines may interfer.

EnMAP Technical Report EnGeoMAP – doi:10.2312/enmap.2016.003 7
EnGeoMAP Base
The EnGeoMAP Base program was developed as application for mapping the surface mineralogy from EnMAP. It is based on the geometric hull technique (Mielke et al., 2015; 2016), which allows the extraction of absorption features without any a priori knowledge on absorption feature positions, shape, or the overall shape of the reflectance spectrum itself. The feature definition can either be calculated using the original EnMAP spectral resolution (1 nm precision=No => Faster, Default Option) or a generic 1 nm interpolated spectrum (1 nm precision= Yes => Slower Option).
Users are additionally encouraged to exclude any characteristic absorption features by setting the left and right shoulder positions of the atmospheric water vapor absorption features in the “Exclusion of Atmospheric absorption features” dialogue. Otherwise absorption features that fall within these ranges will also be used in the weighted fitting process! The feature definitions are then used to compute the feature area, feature depth and feature width of the reference features as weights for both, the unknown image spectrum and the library reference spectra. Hence, EnGeoMAP Base uses the 𝑓𝑓𝑓𝑓𝑓𝑓𝑓𝑓𝑓𝑓𝑓𝑓𝑓𝑓 𝑑𝑑𝑓𝑓𝑑𝑑𝑓𝑓ℎ ∙𝑓𝑓𝑓𝑓𝑓𝑓𝑓𝑓𝑓𝑓𝑓𝑓𝑓𝑓 𝑓𝑓𝑓𝑓𝑓𝑓𝑓𝑓
𝑓𝑓𝑓𝑓𝑓𝑓𝑓𝑓𝑓𝑓𝑓𝑓𝑓𝑓 𝑤𝑤𝑤𝑤𝑑𝑑𝑓𝑓ℎ in the weighted fit procedure.

EnMAP Technical Report EnGeoMAP – doi:10.2312/enmap.2016.003 8
Next, the modified spectral angle mapper (MSAM) (Oshigami et al., 2013; Rogass et al., 2013) is used for calculating the fit in case of EnGeoMAP. The resultant data are the weighted fit values of the image pixel spectrum to the reference library entries. A best weighted fit map is produced with the GFZ spectral reference library (Papenfuß, 2015) using the color codes defined in the GFZ_LIB_lookup.csv, which were derived from the color codes of the USGS MICA application (Kokaly, 2012). Additionally, users may conduct a bounded value least squares unmixing on a per pixel basis using only those material entries of the reference library that were detected in the previous best weighted fit step. This might be useful if small material gradients have to be detected.
Select Applications > Geological Applications > EnGeoMAP Base.
Choose the Input Image and the reference Library File. Both files need to be presented in the same spectral resolution.
Optional: A binary Mask File can be supplied e.g. to mask out water bodies or vegetation.
Choose the Output File.
Choose Flags:
- Choose if the Geometric Hull Continuum Removal should be carried out on a generic 1 nm resolution (Yes => Slower) or at the sensors native spectral resolution (No => Faster). Comment: Sensors with very heterogeneous band passes (e.g. HyMAP) may deliver unsatisfactory results if the geometric hull is not calculated at the 1 nm generic resolution.
- BVLS unmixing (bounded value constrained linear least-squares minimization) at pixel level may be calculated using only those endmembers that have been detected in the weighted fitting process (Default is off). Comment: The material with the highest bvls score will

EnMAP Technical Report EnGeoMAP – doi:10.2312/enmap.2016.003 9
likely be the material with the largest absorption bands (e.g. iron bearing minerals or vegetation).
- Choose if the GFZ Library is used (default Yes) then a color coded classification result can be computed Based on the color codes in the accompanying lookup table. Comment: The GFZ_LIB_lookup.csv must be saved in the output folder.
The Exclusion of Atmospheric Absorption Features is recommended by supplying the left and right shoulders of the atmospheric water vapor absorption features. Otherwise features found in these spectral regions by the geometric hull will also be used in the weighted fitting process. If necessary, please also remove all residual atmospheric features that fall in the wavelength range before 1250 nm by using sphere interpolation.
For spiky image spectra it is recommended to use a smoothing filter prior to EnGEOMAP – Base.
Choose a weighted Fitting Threshold (0-1) in order to exclude low correlation values.

EnMAP Technical Report EnGeoMAP – doi:10.2312/enmap.2016.003 10
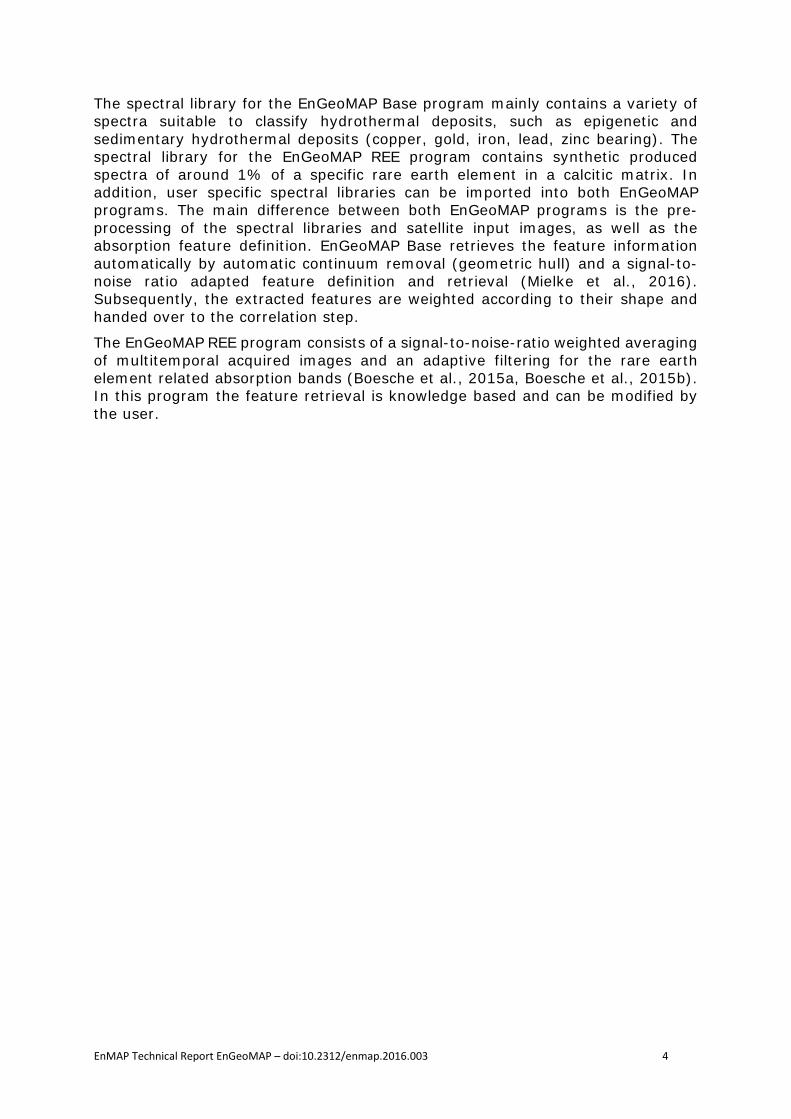
EnGeoMAP REE
Flowchart of EnGEOMAP – REE, after (Nina K. Boesche, 2015)
The EnGeoMAP REE was developed as an additional program to the EnGeoMAP. It separates rare earth element related signatures from noise and absorption features of other minerals. Its advantage is that it finds small absorption features even if they do not dominantly occur as isolated features or are superimposed by noise ( Boesche et al., 2015a, Boesche et al., 2015b; Rowan et al., 1986).
The first step of EnGeoMAP REE is a reduction of noise by using a weighted averaging of multi-temporal acquired images. The averaging factor is based on the image signal-to-noise-ratio of homogenous and dark pixels of the input image. These pixels are determined using a “pan-quantization” of the input image (Boesche, 2015). To do that, a spectral subset was extracted that contains only the spectral range covered by the rare earth element that is investigated. The pan image is estimated as a sum over all bands within this subset. Next, the pan image is quantized, which give this step its name. The two first quantiles will then be reduced in size and handed over to determine the signal-to-noise-ratio for low albedos, which serves as the weighting factor for the multitemporal averaging.
The second step of EnGeoMAP REE is an adaptive filtering of every input image spectrum for rare earth related signals (Boesche, 2015, Boesche et al., 2015a, Boesche et al., 2015b). Filtering is performed using the Richardson-Lucy Deconvolution. For that a filter kernel is defined to perform a two-step deconvolution on the spectrum, see equation (1) and (2). The filter has a Gaussian shape, because it represents the normal distributed probability of orbital energy levels that are involved in the absorption processes (electronic field transitions)
EnMAP Technical Report EnGeoMAP – doi:10.2312/enmap.2016.003 11
(Sunshine & Pieters, 1993). The Gaussian shape is defined by a sigma value that is a function of the width of the studied rare earth element absorption band. To avoid aliasing, sigma is defined to be at least twice the frequency equivalent to the investigated REE related absorption band.
𝐻𝐻 = 𝐻𝐻(𝑥𝑥,𝑦𝑦, 𝜆𝜆) =ℱ{S0}
ℱ{S𝑤𝑤 ∗ 𝑓𝑓}𝑓𝑓 (1)
𝑆𝑆𝑤𝑤+1 = S𝑤𝑤 ∘ 𝐻𝐻(𝑥𝑥,𝑦𝑦, 𝜆𝜆) (2)
The adaptive filtering is applied to the unknown image spectrum and the library spectrum. In the third and final step, the filtered image spectra are correlated to the filtered spectral library spectra and the fit values saved in the REE_fit_values.bsq file. The REE_max_fit.bsq file contains for every pixel the maximum fit value of all rare earth element fit values. The REE_class.bsq file is a classification file, which contains the assorted rare earth element class for every pixel. The color coding is random and can be modified by the user.
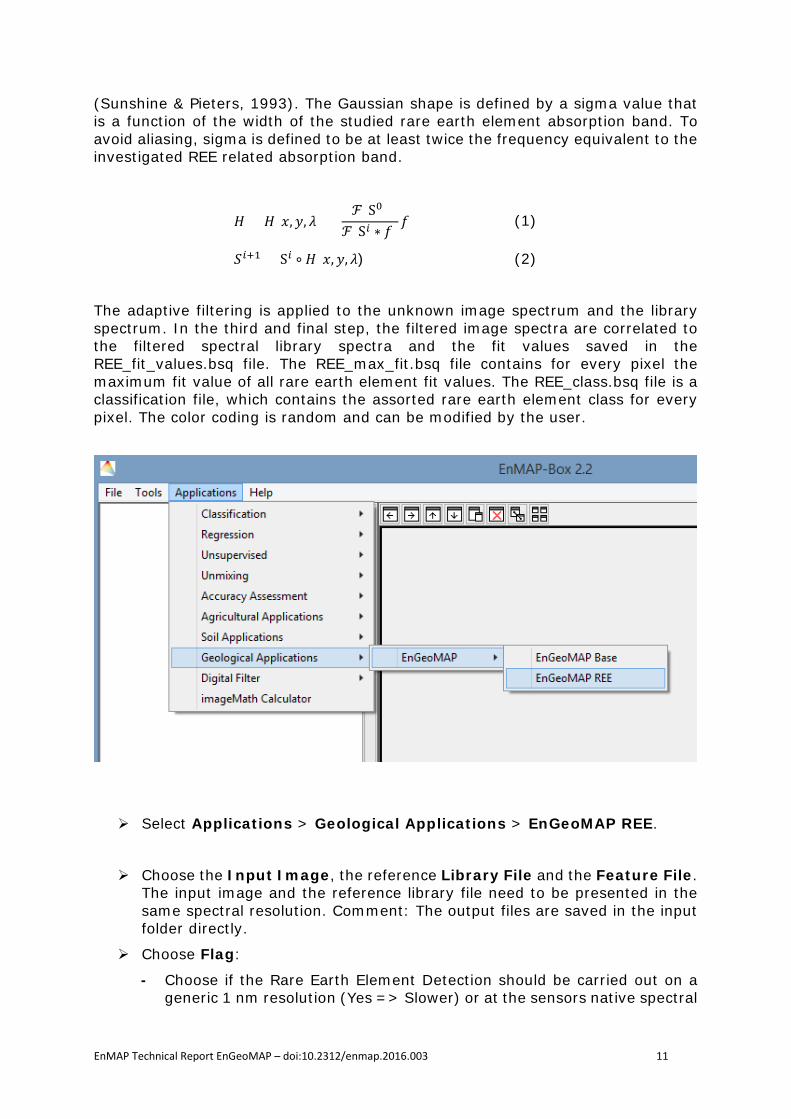
Select Applications > Geological Applications > EnGeoMAP REE.
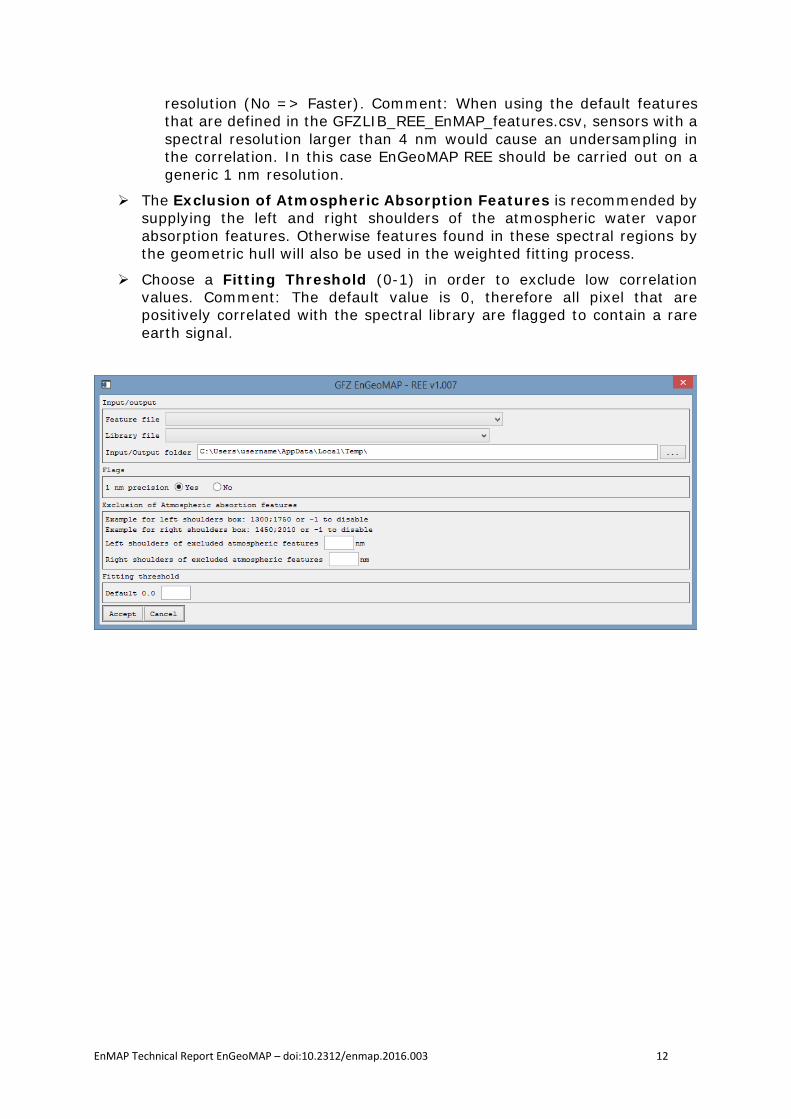
Choose the Input Image, the reference Library File and the Feature File. The input image and the reference library file need to be presented in the same spectral resolution. Comment: The output files are saved in the input folder directly.
Choose Flag:
- Choose if the Rare Earth Element Detection should be carried out on a generic 1 nm resolution (Yes => Slower) or at the sensors native spectral
EnMAP Technical Report EnGeoMAP – doi:10.2312/enmap.2016.003 12
resolution (No => Faster). Comment: When using the default features that are defined in the GFZLIB_REE_EnMAP_features.csv, sensors with a spectral resolution larger than 4 nm would cause an undersampling in the correlation. In this case EnGeoMAP REE should be carried out on a generic 1 nm resolution.
The Exclusion of Atmospheric Absorption Features is recommended by supplying the left and right shoulders of the atmospheric water vapor absorption features. Otherwise features found in these spectral regions by the geometric hull will also be used in the weighted fitting process.
Choose a Fitting Threshold (0-1) in order to exclude low correlation values. Comment: The default value is 0, therefore all pixel that are positively correlated with the spectral library are flagged to contain a rare earth signal.

EnMAP Technical Report EnGeoMAP – doi:10.2312/enmap.2016.003 13
4 References Boesche, N. K. (2015). Detection of Rare Earth Elements and Rare Earth Oxides with Hyperspectral Spectroscopy - Near-field and Spaceborne Investigations in Preparation of the EnMAP Mission. Mathematisch-Naturwissenschaftlichen Fakultät Der Universität Potsdam.
Boesche, N. K., Rogass, C., Lubitz, C, Brell, M., Herrmann, S., Mielke, C., Kaufmann, H. (2015a). Hyperspectral REE (Rare Earth Element) Mapping of Outcrops—Applications for Neodymium Detection. Remote Sensing, 7(5), 5160–5186. http://doi.org/10.3390/rs70505160
Boesche, N. K., Rogass, C., Mielke, C., Herrmann, S., Körting, F. K., Papenfuß, A., Altenberger, U. (2015b). Hyperspectral Rare Earth Element Mapping of three Outcrops at the Fen Complex, Norway: Calcitic, Dolomitic, and Ankeritic Carbonatites. In Rare Earths Industry, Technological, Economic, and Environmental Implications (1 edition). Elsevier.
Boesche, Nina K.; Mielke, Christian; Segl, Karl; Chabrillat, Sabine; Rogass, Christian; Thomson, David; Lundeen, Sarah; Brell, Maximilian; Guanter, Luis (2016): Simulated EnMAP Satellite Data for Mountain Pass, USA and Rodalquilar, Spain. GFZ Data Services. http://doi.org/10.5880/enmap.2016.001
Clark, R. N., Swayze, G. A., Livo, K. E., Kokaly, R. F., Sutley, S. J., Dalton, J. B., … Gent, C. A. (2003). Imaging spectroscopy: Earth and planetary remote sensing with the USGS Tetracorder and expert systems. Journal of Geophysical Research, 108(E12), 5131. http://doi.org/10.1029/2002JE001847
Dieke, G. H., & Crosswhite, H. M. (1963). The Spectra of the Doubly and Triply Ionized Rare Earths. Appl. Opt., 2(7), 675–686. http://doi.org/10.1364/AO.2.000675
Hunt, G., R. (1977). Spectral signatures of particulate minerals in the visible and near infrared. Geophysics, 42(3), 501–513. http://doi.org/10.1190/1.1440721
Kokaly, R. F. (2012). Spectroscopic remote sensing for material identification, vegetation characterization, and mapping. In Proceedings of the SPIE 8390, Algorithms and Technologies for Multispectral, Hyperspectral and Ultraspectral Imagery XVIII (Vol. 8390, pp. 839014-839014–12). Baltimore Marryland. http://doi.org/10.1117/12.919121
Mielke, C. Boesche, N. K., Rogass, C., Kaufmann, H., & Gauert, C. (2015). New geometric hull continuum removal algorithm for automatic absorption band detection from spectroscopic data. Remote Sensing Letters, 6(2), 97–105. http://doi.org/10.1080/2150704X.2015.1007246
Mielke, C, Rogass, C., Boesche, N., Segl, K., & Altenberger, U. (2016). EnGeoMAP 2.0—Automated Hyperspectral Mineral Identification for the German EnMAP Space Mission. Remote Sensing, 8(2), 127. http://doi.org/10.3390/rs8020127
Oshigami, S., Yamaguchi, Y., Uezato, T., Momose, A., Arvelyna, Y., Kawakami, Y., … Nguno, A. (2013). Mineralogical mapping of southern Namibia by application of continuum-removal MSAM method to the HyMap data. International Journal of

EnMAP Technical Report EnGeoMAP – doi:10.2312/enmap.2016.003 14
Remote Sensing, 34(15), 5282–5295. http://doi.org/10.1080/01431161.2013.789147
Papenfuß, A. (2015). Detection of Copper Deposits Based on a New Spectral Library Using Imaging Spectroscopy (MSc). Universität Potsdam, Potsdam, Germany.
Rogass, C., Segl, K., Mielke, C., & Fuchs, Y. (2013). EnGeoMAP - A geological mapping tool applied to the EnMAP mission. EARSeL eProceedings, 12(2), 94–100.
Rowan, L. C., Kingston, M. J., & Crowley, J. K. (1986). Spectral reflectance of carbonatites and related alkalic igneous rocks; selected samples from four North American localities. Economic Geology, 81(4), 857–871. http://doi.org/10.2113/gsecongeo.81.4.857
Sunshine, J. M., & Pieters, C. M. (1993). Estimating modal abundances from the spectra of natural and laboratory pyroxene mixtures using the modified Gaussian model. Journal of Geophysical Research: Planets, 98(E5), 9075–9087. http://doi.org/10.1029/93JE00677
Swayze, G. A., Clark, R. N., Goetz, A. F. H., Livo, K. E., Breit, G. N., Kruse, F. A., … Ashley, R. P. (2014). Mapping Advanced Argillic Alteration at Cuprite, Nevada, Using Imaging Spectroscopy. Economic Geology, 109(5), 1179–1221. http://doi.org/10.2113/econgeo.109.5.1179
Turner, D. J., Rivard, B., & Groat, L. A. (2014a). Visible and short-wave infrared reflectance spectroscopy of REE fluorocarbonates. American Mineralogist, 99(7), 1335–1346. http://doi.org/10.2138/am.2014.4674
Turner, D., Rivard, B., & Groat, L. (2014b). Rare earth element ore grade estimation of mineralized drill core from hyperspectral imaging spectroscopy. In Geoscience and Remote Sensing Symposium (IGARSS), 2014 IEEE International (pp. 4612–4615). http://doi.org/10.1109/IGARSS.2014.6947520
van der Linden, S., Rabe, A., Held, M., Jakimow, B., Leitão, P. J., Okujeni, A., … Hostert, P. (2015). The EnMAP-Box—A Toolbox and Application Programming Interface for EnMAP Data Processing. Remote Sensing, 7(9), 11249–11266. http://doi.org/10.3390/rs70911249
van der Meer, F. (2004). Analysis of spectral absorption features in hyperspectral imagery. International Journal of Applied Earth Observation and Geoinformation, 5(1), 55–68. http://doi.org/10.1016/j.jag.2003.09.001
van der Meer, F. D., van der Werff, H. M. A., van Ruitenbeek, F. J. A., Hecker, C. A., Bakker, W. H., Noomen, M. F., … Woldai, T. (2012). Multi- and hyperspectral geologic remote sensing: A review. International Journal of Applied Earth Observation and Geoinformation, 14(1), 112–128. http://doi.org/10.1016/j.jag.2011.08.002

EnMAP Technical Report EnGeoMAP – doi:10.2312/enmap.2016.003 15
Terms of Use EnGeoMAP 2.0 © Copyright EnGeoMAP Version 2.0
DISCLAIMER 1. With this License the copyright holder Helmholtz-Centre Potsdam GFZ
German Research Centre for Geosciences grants you permission to copy, install and use the Software only for non-commercial purposes provided that you accept this License. Therefore, by copying, installing and using of the Software, you indicate your acceptance of this License. License for commercial purposes is given on demand subject to a separate License Agreement.
2. Helmholtz-Centre Potsdam GFZ German Research Centre for Geosciences reserves all rights not expressly granted to you in this License. Any attempt otherwise to copy, install and use of the Software is void, and will automatically terminate your rights under this License as well as the attempt to modify, sublicense, distribute, rent, lease, lend or provide commercial hosting services.
3. You may not reverse engineer, decompile, or disassemble the Software, except and only to the extent that such activity is expressly permitted by applicable law notwithstanding this limitation. Access to Source code is given on demand subject to a separate License Agreement.
4. TO THE EXTENT PERMITTED BY APPLICABLE LAW THERE IS NO WARRANTY FOR THE PROGRAM. THE PROGRAM IS PROVIDED "AS IS" WITHOUT WARRANTY OF ANY KIND, EITHER EXPRESSED OR IMPLIED, INCLUDING, BUT NOT LIMITED TO, THE IMPLIED WARRANTIES OF MERCHANTABILITY AND FITNESS FOR A PARTICULAR PURPOSE. THE ENTIRE RISK AS TO THE QUALITY AND PERFORMANCE OF THE PROGRAM IS WITH YOU. SHOULD THE PROGRAM PROVE DEFECTIVE, YOU ASSUME THE COST OF ALL NECESSARY SERVICING, REPAIR OR CORRECTION.
5. IN NO EVENT UNLESS REQUIRED BY APPLICABLE LAW OR AGREED TO IN WRITING WILL ANY COPYRIGHT HOLDER, OR ANY OTHER PARTY WHO MAY MODIFY AND/OR REDISTRIBUTE THE PROGRAM AS PERMITTED ABOVE, BE LIABLE TO YOU FOR DAMAGES, INCLUDING ANY GENERAL, SPECIAL, INCIDENTAL OR CONSEQUENTIAL DAMAGES ARISING OUT OF THE USE OR INABILITY TO USE THE PROGRAM (INCLUDING BUT NOT LIMITED TO LOSS OF DATA OR DATA BEING RENDERED INACCURATE OR LOSSES SUSTAINED BY YOU OR THIRD PARTIES OR A FAILURE OF THE PROGRAM TO OPERATE WITH ANY OTHER PROGRAMS), EVEN IF SUCH HOLDER OR OTHER PARTY HAS BEEN ADVISED OF THE POSSIBILITY OF SUCH DAMAGES.
6. If any portion of this License is held invalid or unenforceable under any particular circumstance, the balance of the License is intended to apply and the License as a whole is intended to apply in other circumstances.
7. This License shall be governed by and construed and enforced in accordance with the laws of the Federal Republic of Germany.

EnMAP Technical Report EnGeoMAP – doi:10.2312/enmap.2016.003 16
Authors: Helmholtz Centre Potsdam GFZ German Research Centre for Geosciences Public Law Foundation Nina Boesche Christian Mielke Dr. Christian Rogass Telegrafenberg 14473 Potsdam / Germany Tel.: +49 331 288 28775/1763/1820 http://www.gfz-potsdam.de/en/section/remote-sensing/projects/enmap/ [email protected] [email protected] [email protected] Copyright (c) 2016, by Helmholtz Centre Potsdam GFZ German Research Centre for Geosciences All rights reserved.