engineering of human brain organoids with a functional vascular …10.1038/s41592-019-058… ·...
TRANSCRIPT

Articleshttps://doi.org/10.1038/s41592-019-0586-5
Engineering of human brain organoids with a functional vascular-like systemBilal Cakir 1,12, Yangfei Xiang1,12, Yoshiaki Tanaka1, Mehmet H. Kural2, Maxime Parent3, Young-Jin Kang4,5, Kayley Chapeton6, Benjamin Patterson1, Yifan Yuan2, Chang-Shun He7, Micha Sam B. Raredon2,7, Jake Dengelegi8, Kun-Yong Kim1, Pingnan Sun1, Mei Zhong9, Sangho Lee10, Prabir Patra1,8, Fahmeed Hyder3,7, Laura E. Niklason2,7, Sang-Hun Lee 4,5, Young-Sup Yoon10,11 and In-Hyun Park 1*
1Department of Genetics, Yale Stem Cell Center, Yale School of Medicine, New Haven, CT, USA. 2Department of Anesthesiology, Yale School of Medicine, New Haven, CT, USA. 3Department of Radiology and Biomedical Imaging, Yale School of Medicine, New Haven, CT, USA. 4Department of Neurology, University of Arkansas for Medical Sciences, Little Rock, AR, USA. 5Department of Neuroscience, College of Medicine, University of Kentucky, Lexington, KY, USA. 6Department of Electrical Engineering, University of Bridgeport, Bridgeport, CT, USA. 7Department of Biomedical Engineering, Yale University, New Haven, CT, USA. 8Department of Biomedical Engineering, University of Bridgeport, Bridgeport, CT, USA. 9Department of Cell Biology, Yale Stem Cell Center, Yale School of Medicine, New Haven, CT, USA. 10Department of Medicine, Division of Cardiology, Emory University, Atlanta, GA, USA. 11Severance Biomedical Science Institute, Yonsei University College of Medicine, Seoul, South Korea. 12These authors contributed equally: Bilal Cakir, Yangfei Xiang. *e-mail: [email protected]
SUPPLEMENTARY INFORMATION
In the format provided by the authors and unedited.
NaTuRE METHoDS | www.nature.com/naturemethods
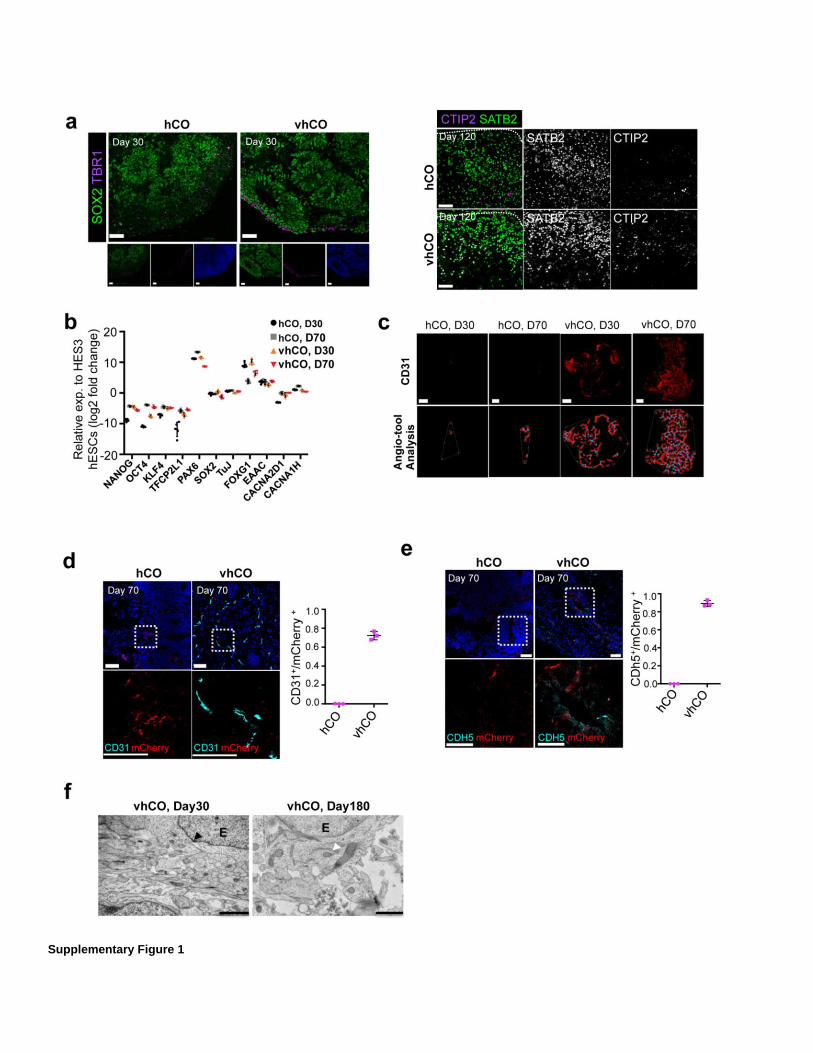
Supplementary Figure 1

Characterization of ETV2-induced cells in hCOs. a) Left, immunostaining for SOX2 and TBR1 in control hCOs and vhCOs (30-day old). Right, immunostaining for CTIP2 and SATB2 in120-day old control and vhCOs. Data are representative images of 5 organoids from three independent experiments. (b) Expression of pluripotency and neural genes from control hCOs and vhCOs (30- and 70-day old). Gene expression was measured relative to HES3 hESCs and normalized to β-Actin. Data represent the mean ± SEM (n=5, from three independent batches). (c). Quantification of vascularization in vhCOs and control hCOs at different time points. CD31 labeled row shows the projections of z-stacks of CD31 stained red whole mount images. Angiotool analysis of the CD31 projections, thick red lines show the vascular paths, blue dots represent vascular junction points and the thin white line demonstrate the entire area over which vascular structures formed within organoid. Data represent the mean ± SEM (n=3, from three independent batches). (d-e) Co-immunostaining for CD31 and mCherry (d), CDH5 and mCherry (e) in 70-day old hCOs. Data are representative images of three independent experiments. (f) Representative electron microscopy images of vhCO at day 30 and 180. The E represents the endothelial cells, black arrowhead points at tight junction and white arrowhead indicates the astrocytic end feet. (n=2, from two independent batches). The scale bar represents 50 μm in a, c and d, and 100 μm in e, and 2 and 1 μm at day 30 and 180, respectively in f.
Supplementary Figure 2
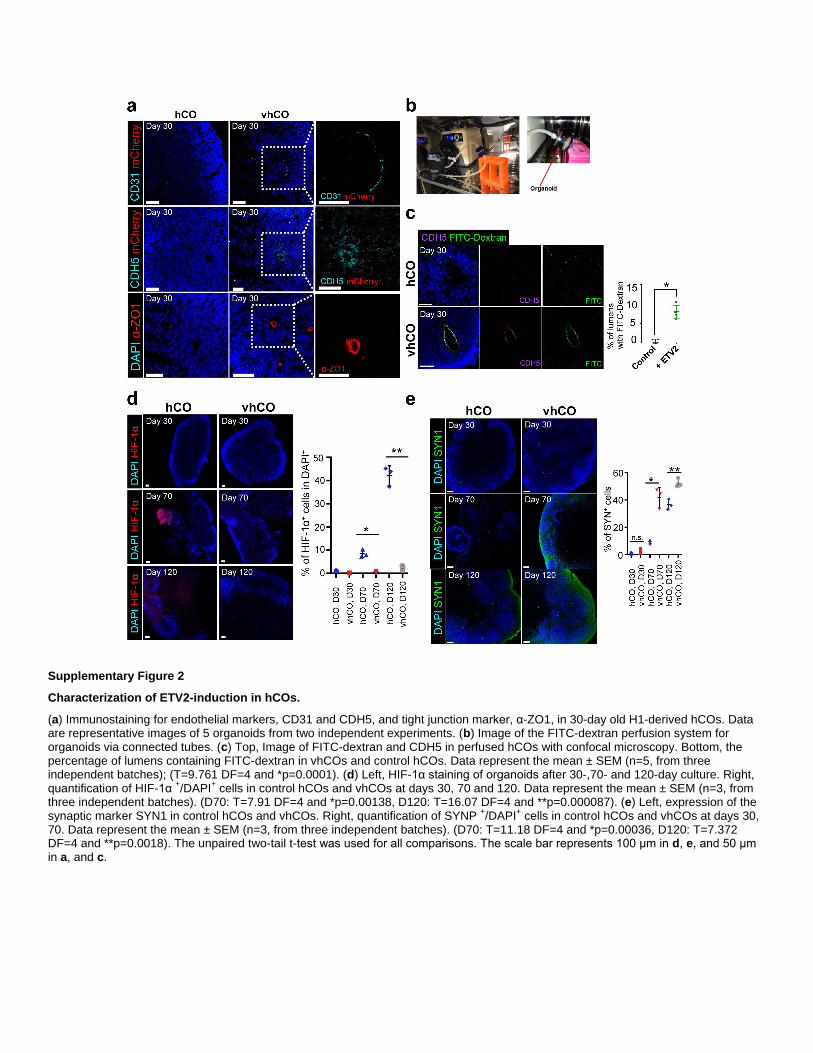
Characterization of ETV2-induction in hCOs.
(a) Immunostaining for endothelial markers, CD31 and CDH5, and tight junction marker, α-ZO1, in 30-day old H1-derived hCOs. Data are representative images of 5 organoids from two independent experiments. (b) Image of the FITC-dextran perfusion system for organoids via connected tubes. (c) Top, Image of FITC-dextran and CDH5 in perfused hCOs with confocal microscopy. Bottom, the percentage of lumens containing FITC-dextran in vhCOs and control hCOs. Data represent the mean ± SEM (n=5, from three independent batches); (T=9.761 DF=4 and *p=0.0001). (d) Left, HIF-1α staining of organoids after 30-,70- and 120-day culture. Right, quantification of HIF-1α
+/DAPI
+ cells in control hCOs and vhCOs at days 30, 70 and 120. Data represent the mean ± SEM (n=3, from
three independent batches). (D70: T=7.91 DF=4 and *p=0.00138, D120: T=16.07 DF=4 and **p=0.000087). (e) Left, expression of the synaptic marker SYN1 in control hCOs and vhCOs. Right, quantification of SYNP
+/DAPI
+ cells in control hCOs and vhCOs at days 30,
70. Data represent the mean ± SEM (n=3, from three independent batches). (D70: T=11.18 DF=4 and *p=0.00036, D120: T=7.372DF=4 and **p=0.0018). The unpaired two-tail t-test was used for all comparisons. The scale bar represents 100 μm in d, e, and 50 μm in a, and c.


Supplementary Figure 3
Classification, annotation and evaluation of cell clusters from vhCOs.
(a) tSNE plot of single cells colored by functional clusters. Data are representative of 20026 cells. (b) Schematic representation of
cluster annotation. (c) Expression patterns of genes related with neuronal growth cone, early neurogenesis, proteoglycans and EMT.
Data are representative of 20026 cells. (d) Comparison of total UMI counts, mitochondria-derived reads, GO enrichment and unique
markers for lineage commitment and cellular event among clusters. (e) Exclusive expression pattern of TBR1 and GFAP genes in
single cells. Cells co-expressing both genes (colored by blue) were considered doublets. (f) Histogram of gene expression related to
vasculogenesis. Two-sided t-test p-value=1.91e-02 (VTN) and 2.2e-16 (HAND1). Data are representative of 2257 cells.

Supplementary Figure 4
Functional characterization of vhCOs.
(a) Immunostaining for α-ZO1 in hCOs and vhCOs at day 70. (b-d) Immunostaining for β-Catenin (b), OCLN and KDR (c), and GFAP and S100β (d) in 30-day old hCOs and vhCOs. Arrows show co-localization of OCLN and KDR in vhCOs. Data are representative images of 5 organoids from three independent experiments in a, b, c, and d. (e) Co-immunostaining for GFAP and PDGFRβ in control and vhCOs (day 70). Arrows indicate regions where pericytes and astrocytes are in close juxtaposition. (n=2, from two independent batches) (f) Expression of tight junctions and transporters with and without Aβ1-42-oligo treatment of vhCOs. Gene expressions were measured relative to control hCOs and normalized to β-Actin. Data represent the mean ± SEM (n=3, from three independent batches). The scale bar represents 50 μm in a, b, c, d and e.

Generation of vascularized human brain organoids
Note: This protocol was not part of the peer review process.
Procedure:
1. Maintenance of hESCs
Human embryonic stem cells (hESCs) are cultured on Matrigel coated tissue
culture plates.
hESC colonies are passaged every 6 to 7 days when they achieve around 80%
confluence.
All cultures are checked regularly for mycoplasma and chromosomal
abnormalities.
2. Generation of hESCs expressing inducible ETV2
1. To generate hESCs expressing inducible ETV2, doxycycline-inducible (BC4)
dCAS9-mCherry and rTTA (addgene plasmid # 73497) cassette was introduced
into the AAVS1 locus of HES-3 NKX2-1GFP/w.
a. 2 million HES-3 NKX2-1GFP/w hESCs were electroporated with 8 µg donor
plasmid, 1 µg AAVS1 TALEN-L and 1 µg AAVS1 TALEN-R by using Amaxa
nucleofector device (AAB-1001, Lonza, program A-023).
b. Cells were seeded in mTeSR1 plus ROCK inhibitor Y-27632 (10 µM).
c. After 3 days, G-418 (Thermo Fisher Scientific) was applied for 7 days (400
µg/ml for the first 3 days and 300 µg/ml for the next 4 days) to obtain stable
colonies.
d. A single isogenic colony was picked and expanded. This hESC line was
named BC4-hESCs.
2. After generating the tetracycline-inducible lentivirus for ETV2 (FUW-tetO-ETV2 6),BC4-hESCs were infected with the virus at multiplicity of infection (MOI) 4.
3. 24 hours later, infected hESCs were washed with 1X PBS three times. Then, fresh
mTeSR1 media (Stem Cell Technologies) was added and cells were cultured for
5 more days.
3. Formation of embryoid bodies (EBs) and induction of neural differentiation and
ETV2 expression

Cortical organoids (hCOs) with vasculature were generated by mixing ETV2-infected
BC4 and non-infected parental HES3 hESCs (differentiation scheme is shown in Figure
1).
1. Aspirating the media and washing cells once with 1 ml DMEM-F12 medium was
followed by the addition of 1 ml of 1x Accutase.
2. After 10 minutes of incubation at 37 C, single cell suspension was confirmed
under a microscope and transferred into a 15ml-falcon tube containing 5 ml
DMEM-F12.
3. Cells were collected by centrifugation for 3 min at 1100 rpm.
4. After aspirating the supernatant, cells were resuspended in 1 ml neural induction
medium (DMEM-F12, 15% (v/v) KSR, 1% (v/v) Glutamax, 1% (v/v) MEM-NEAA,
100 µM β-Mercaptoethanol, 10 µM SB-431542, 100 nM LDN-193189, 2 µM XAV-
939).
5. Live cells were counted using a hematocytometer.
6. Cells were diluted with neural induction media to a final concentration of 9000
cells/150 l (7200 parental HES-3 hESC cells and 1800 ETV2 infected hESC
cells were combined for each 150 l). Then, 50 µM ROCK inhibitor Y27632 and
5% (v/v) heat-inactivated FBS (Life Technologies) were added.
7. 150 l of single cell suspension was added into each well of a U-bottom-ultra-low
attachment 96-well plate (Day 0 of differentiation).
8. Basal activation of ETV2 was started on day 2 by adding 0.5 µM dox, whereas
FBS and Y27632 were removed on days 2 and 4, respectively.
9. On days 4, 6, and 8, the neural induction media was replenished via removing 125
l media and adding 150 l fresh media.
4. Patterning of cortical organoids with functional vascular-like network
1. At day 10, organoids were transferred to ultra-low-attachment 6-well plates in hCO
patterning media with minus vitamin A (1:1 mixture of DMEM-F12 and Neurobasal
media, 0.5% (v/v) N2 supplement, 1% (v/v) B27 supplement without vitamin A,
0.5% (v/v) MEM-NEAA, 1% (v/v) Glutamax, 50 µM β-Mercaptoethanol, 1% (v/v)
Penicillin/Streptomycin and 0.025% Insulin) for spinning culture and the media
was changed every other day. Basal activation of ETV2 was preserved by adding
0.5 µM dox.
2. On day 10, 12, 14, and 16, 2.4 ml medium was removed from each well and 2.5
ml hCO patterning media with 0.5 µM dox was added.
3. The spinning culture was started by placing the plate on an orbital shaker at 80
rpm inside the incubator.
4. Maturation of vascularized cortical organoids

1. After day 18, the media was changed to hCO maturation media (1:1 mixture of
DMEM-F12 and Neurobasal media, 0.5% (v/v) N2 supplement, 1% (v/v) B27
supplement with vitamin A, 0.5% (v/v) MEM-NEAA, 1% (v/v) Glutamax, 50 µM β-
Mercaptoethanol, 1% (v/v) Penicillin/Streptomycin, 0.025% Insulin, 20 ng/ml BDNF
and 200 µM ascorbic acid).
2. Final activation of ETV2 expression was performed from day 18 by adding 2 µM
dox continuously in the media.
3. Media was changed every 4 days after day 18.
Timing Generation of stable cell line: 30 days
Viral infection and transduction: 7 days
Suspension of hESC cell colonies to form EB: 10 days
Neural specification: 8 days
Neural maturation/ vascular characterization: 12 days
Notes: Differentiated cells may interrupt the neural induction and the following
differentiation process.
The starting size of cell number to generate embryoid bodies can be cell line-
dependent and should be preferentially titrated according to specific cell lines to
be used.
Transfer the embryonic bodies cautiously, to avoid damaging the samples.
During induction and patterning stages, media changes should be performed
gently.
ETV2 virus titer is critical for the generation of vascularization inside the organoid.
Troubleshooting Low efficiency of directed differentiation and vascular network formation:
hESCs colonies should be checked for quality control for a successful organoid
generation. Differentiated colonies should be removed before generating a
single cell suspension. After the infection of the ETV2 lentivirus, colonies
showing differentiation should be removed. Lentivirus titer and quality are
critical for the generation of endothelial cells inside the organoid.
EB formation: EBs should form 24 hours after plating single cell suspension.
Check the quality of hESC colonies, amount of ROCK inhibitor, and duration of
Accutase treatment, if EBs fail to form.
Failure of long-term development of organoid: Initially, extra growth factors
were not added. However, these factors, FGF2 or EGF, may benifit organoid
development.

Figure1: Schematic and recipes for the generation of vascularized cortical
organoids

Equipment:
U-bottom ultra-low-attachment 96-
well plate
Corning CLS7007-24EA
Ultra-low-attachment 6-well plate Corning CLS3471-24EA
Orbital shaker IKA KS260
Experimental Models: Cell Lines
HES-3 NKX2-1GFP/w Elefanty lab https://www.ncbi.nlm.
nih.gov/pubmed/2142
5409

Reagents
REAGENT or RESOURCE SOURCE IDENTIFIER
Chemicals, Peptides, and Recombinant Proteins
mTeSR1 Stem Cell
Technologies
Cat# 05875
DMEM-F12 Life Technologies Cat# 11330057
Neurobasal Media Life Technologies Cat# 2110349
FBS Life Technologies Cat# 10437028
Amino acids, non-essential Life Technologies Cat# 11140050
Penicillin/Streptomycin Life Technologies Cat# 15140-122
Glutamax Life Technologies Ca# 35050
Insulin Sigma Ca# I9278
β-Mercaptoethanol Sigma Ca# M7522
N2 Life Technologies Cat# 17502-048
B27 Life Technologies Cat# 17504-044
B27 supplement without vitamin A Life Technologies Cat# 12587010
bFGF Millipore Cat# GF003AF
KnockOut Serum Replacement Life Technologies Cat# 10828-028
Matrigel BD Cat# 354230
Y-27632 Stem Cell
Technologies
Cat# 72304
Dispase (100ml) Stem Cell
Technologies
Cat# 07913
Accutase (100ml) Stem Cell
Technologies
Cat# AT104
LDN-193189 Sigma Cat# SML0559
SB431542 Abcam Cat# ab120163
XAV939 Sigma Cat# X3004
BDNF Prepotech Cat# 450-02
Ascorbic acid Sigma Cat# A92902

References: 1 Lancaster, M. A. et al. Cerebral organoids model human brain development and
microcephaly. Nature 501, 373-379, doi:10.1038/nature12517 (2013). 2 Pasca, S. P. The rise of three-dimensional human brain cultures. Nature 553,
437-445, doi:10.1038/nature25032 (2018). 3 Lancaster, M. A. & Knoblich, J. A. Generation of cerebral organoids from human
pluripotent stem cells. Nat Protoc 9, 2329-2340, doi:10.1038/nprot.2014.158 (2014).
4 Yin, X. et al. Engineering Stem Cell Organoids. Cell Stem Cell 18, 25-38, doi:10.1016/j.stem.2015.12.005 (2016).
5 Mansour, A. A. et al. An in vivo model of functional and vascularized human brain organoids. Nat Biotechnol 36, 432-441, doi:10.1038/nbt.4127 (2018).
6 Lee, S. et al. Direct Reprogramming of Human Dermal Fibroblasts Into Endothelial Cells Using ER71/ETV2. Circ Res 120, 848-861, doi:10.1161/CIRCRESAHA.116.309833 (2017).
Supplementary Results and Discussion
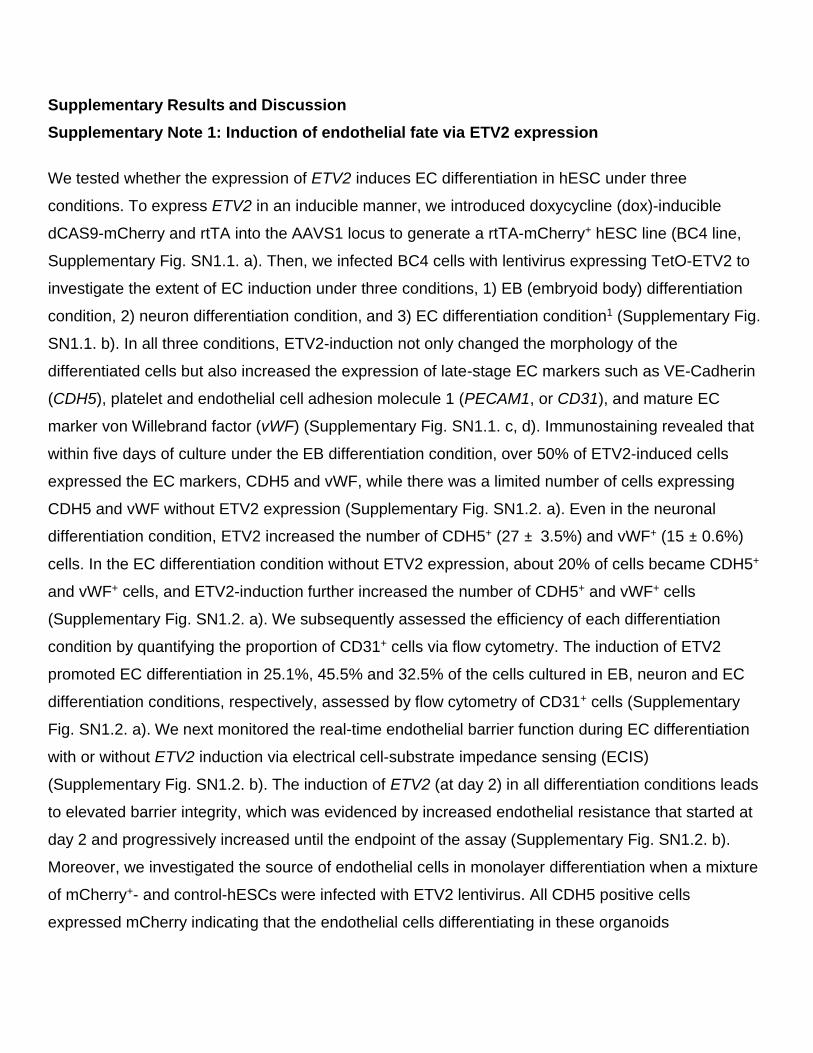
Supplementary Note 1: Induction of endothelial fate via ETV2 expression
We tested whether the expression of ETV2 induces EC differentiation in hESC under three
conditions. To express ETV2 in an inducible manner, we introduced doxycycline (dox)-inducible
dCAS9-mCherry and rtTA into the AAVS1 locus to generate a rtTA-mCherry+ hESC line (BC4 line,
Supplementary Fig. SN1.1. a). Then, we infected BC4 cells with lentivirus expressing TetO-ETV2 to
investigate the extent of EC induction under three conditions, 1) EB (embryoid body) differentiation
condition, 2) neuron differentiation condition, and 3) EC differentiation condition1 (Supplementary Fig.
SN1.1. b). In all three conditions, ETV2-induction not only changed the morphology of the
differentiated cells but also increased the expression of late-stage EC markers such as VE-Cadherin
(CDH5), platelet and endothelial cell adhesion molecule 1 (PECAM1, or CD31), and mature EC
marker von Willebrand factor (vWF) (Supplementary Fig. SN1.1. c, d). Immunostaining revealed that
within five days of culture under the EB differentiation condition, over 50% of ETV2-induced cells
expressed the EC markers, CDH5 and vWF, while there was a limited number of cells expressing
CDH5 and vWF without ETV2 expression (Supplementary Fig. SN1.2. a). Even in the neuronal
differentiation condition, ETV2 increased the number of CDH5+ (27 ± 3.5%) and vWF+ (15 ± 0.6%)
cells. In the EC differentiation condition without ETV2 expression, about 20% of cells became CDH5+
and vWF+ cells, and ETV2-induction further increased the number of CDH5+ and vWF+ cells
(Supplementary Fig. SN1.2. a). We subsequently assessed the efficiency of each differentiation
condition by quantifying the proportion of CD31+ cells via flow cytometry. The induction of ETV2
promoted EC differentiation in 25.1%, 45.5% and 32.5% of the cells cultured in EB, neuron and EC
differentiation conditions, respectively, assessed by flow cytometry of CD31+ cells (Supplementary
Fig. SN1.2. a). We next monitored the real-time endothelial barrier function during EC differentiation
with or without ETV2 induction via electrical cell-substrate impedance sensing (ECIS)
(Supplementary Fig. SN1.2. b). The induction of ETV2 (at day 2) in all differentiation conditions leads
to elevated barrier integrity, which was evidenced by increased endothelial resistance that started at
day 2 and progressively increased until the endpoint of the assay (Supplementary Fig. SN1.2. b).
Moreover, we investigated the source of endothelial cells in monolayer differentiation when a mixture
of mCherry+- and control-hESCs were infected with ETV2 lentivirus. All CDH5 positive cells
expressed mCherry indicating that the endothelial cells differentiating in these organoids

originate from the ETV2 over-expressing cells (Supplementary Fig. SN1.2. c). These data suggest
that overexpression of ETV2 induces the EC formation regardless of differentiation conditions and in
the absence of growth factors (e.g., VEGF) essential for differentiating and maintaining mature
endothelial cells in culture 2,3.

Supplementary Figure SN.1.1.
Induction of endothelial fate via ETV2 expression under different conditions.
(a) Left, a construct to target the AAVS1 locus to generate rtTA-mCherry+ hESC line (BC4). Right, expression of mCherry with Doxycycline in BC4 hESCs. (b) Top, depiction of infection of ETV2 (MOI 4) under embryoid body (EB) or neuron differentiation mediafor five days. Bottom, depiction of infection of ETV2 (MOI 4) under endothelial cell (EC) differentiation protocol for five days. (c) The ETV2 induced cells under different differentiation conditions displayed different morphology compared to un-induced cells. Data are representative images of 5 samples from three independent experiments. (d) Expression of endothelial genes was measured relative to control hESCs and normalized to β-Actin. Data represent the mean ± SEM (n=3). One paired t-test was used for comparison (*p=0.017, and **p=0.0000085). The scale bar represents 100 μm in a, and c.

Supplementary Figure SN1.2.
In vitro generation of organoids expressing endothelial markers via induction of ETV2.
(a) Left, immunostaining for EC markers, CDH5 and vWF, in hESCs differentiated without or with ETV2 induction in EB, neuron, or EC differentiation media. Center, quantification of CDH5 and vWF fluorescence per DAPI fluorescence of ETV2 induced EC cells. Data represent the mean ± SEM. One paired t-test was used for comparison (n=3, *p=0.0014). Right, flow cytometry analysis indicating the expression of CD31 in hESCs converted into EC cells via ETV2 induction under EB, and neuron differentiation media and EC protocol. (b) Electric cell-substrate impedance sensing (ECIS) was used to dynamically monitor endothelial resistance change during 3 differentiation conditions in the presence and absence of ETV2 induction. Data are representative images of two independent experiments. (c) Left, immunostaining for mCherry and CDH5 in EC cells generated from hESCs with different ratios of ETV2-induced cells. Right, quantification of CDH5+/mCherry+ cells indicated that the all endothelial cells are derived from mCherry+ cells. Data represent the mean ± SEM (n=3, three independent experiments). The scale bar represents 50 μm in a, and c.

Supplementary Note 2: The ETV2 expression in hCOs.
ETV2-infected BC4 hESCs were mixed with non-infected parental HES3 hESCs in different ratios
(5%, 10%, and 20%) to generate hCOs as described previously (Supplementary Fig. SN2.1. a) 4. Two
days after forming hCOs, ETV2 was induced with a low dosage of dox (0.5 μM) to promote the early
phase of reprogramming that is critical for EC maturation. The expression of ETV2 was then fully
induced at either day 10 or day 18 (Supplementary Fig. SN2.1. a, right panel). We performed 3D
imaging of live hCOs to characterize the organization of the mCherry+ cells that express ETV2. At the
early stage of organoid formation (day 30), the control hCOs without ETV2 expression demonstrated
a scattered mCherry expression without an organized structure formation. ETV2-expressing hCOs
made tube-like structures throughout the inside of the organoids (Supplementary Fig. SN2.1. b).
Compared to organoids induced with ETV2 at day 10, those induced at day 18 contained more
mCherry+ tubular structures (Supplementary Fig. SN2.1. c). Furthermore, organoids made with 20%
ETV2-expressing hESCs had more tubular structures (Supplementary Fig. 3c). Overall, we found that
induction with 20% ETV2 cell ratio (D18-20%) hCOs yielded the most robust formation of tubular-like
structures compared to other ETV2 hCOs (Supplementary Fig. SN2.1. c). Besides, gene expression
analysis showed a direct correlation between the amount of ETV2 expression in hCOs and the levels
of EC gene expression (Supplementary Fig. SN2.1. d). Furthermore, the endothelial progenitor
marker CD34 was also increased in both D10-20% ETV2 and D18-20% ETV2 organoids. D18-20%
ETV2 hCOs showed a sharp increase in expression of CD31 compared to D10-20% ETV2 hCOs,
while other EC genes (e.g., CDH5, KDR, TEK, vWF and CD34) were expressed at similar levels in
both conditions (Supplementary Fig. SN2.1. d). Collectively, these results suggest that hCOs with
20% ETV2 induced at day 18 start to form vascular-like structures, identified by EC markers. We
named the hCOs with the vascular-like structure, as vascularized hCOs (vhCOs).

Supplementary Figure SN2.1.
Schematic of ETV2 expression in hCOs.
(a) Top, generation of Dox-inducible ETV2 expression in BC4 hESCs, and dosage and timing of ETV2 expression in BC4 mixed with control HES-3 hESC line. Bottom, depiction of culture protocol for generation of cortical organoids containing different ratios of ETV2-induced cells. Organoids were developed with a low level of ETV2 induction beginning at day 2 and higher induction at either at day 10 or day 18. (b) Representative images demonstrating mCherry+ cells expressing ETV2 that form tube-like structures. Z stack confocal imaging was performed (~ 40-50 μm). (c) Quantification of mCherry fluorescence per unit area (µm2) of control hCOs and vhCOs. The scale bar represents 50 μm. Data represent the mean ± SEM (n=3, three independent experiments). (d) Expression of endothelial genes from organoids at day 30 generated by expressing ETV2 at different dosage and duration. Gene expression was measured relative to control organoids and normalized to β-Actin. Data represent the mean ± SEM (n=5, from three independent batches).

Supplementary Note 3: Evaluation of cell clusters from vhCOs.
As observed previously 4,5, we identified unique cell clusters that are distinguishable from neurons
and astrocytes and express genes for specific cellular structures (Fig. 2b and c). In particular,
proteoglycan-expressing cells (PGC) demonstrated expression of specific proteoglycans (BGN and
DCN) (Supplementary Fig. 3c) and a slight enrichment of endothelial gene signatures (Fig. 2c). These
same proteoglycans were also highly expressed in endothelial-like cells (Supplementary Fig. 3c). To
understand the derivation of these clusters, we constructed a differentiation trajectory from the single-
cell transcriptome profile. Interestingly, PGCs were grouped into one branch with endothelial-like
cells, suggesting that PGCs may have the potential to differentiate toward the endothelial lineage
(Fig. 2h). The other unknown clusters, such as cilium-bearing cells (CBC) and BMP-related cells
(BRC), belonged to a branch related glial cell development.
To further understand the effects of vascularization on lineage commitment in brain organoids, we
compared transcriptome profiles between vhCOs and control hCOs. We found that vhCOs showed
significant up-regulation of HOX genes, which are essential for regionalized neuronal identity
(Supplementary Fig. SN3.1. a and b). Furthermore, mitochondria transcripts, hypoxic response
genes, and apoptotic signaling genes were significantly downregulated in vhCOs (Supplementary Fig.
SN3.1. a and b). Overall, these results support our observation that vhCOs attenuate cell damage by
improved nutrition or oxygen supplementation to internal organoid regions through the vasculature.

Supplementary Figure SN3.1.
Classification, annotation and evaluation of cell clusters from vhCOs.
(a) Volcano plot showing differential expression between total vhCO- and control hCO-derived cells. Mitochondria genes and HOX with
p<1e-50 were colored by cyan and salmon color, respectively. Two-sided T test was used for comparison. All 25622 genes are shown in gray color. (b) GO analysis for differentially-expressed genes between total vhCO- and control hCO-derived cells.

Supplementary Methods
Note 4: Data processing of scRNA-seq
Briefly, cell clusters were classified into neuronal and non-neuronal clusters by the expression pattern
of genes involved in the development of neuronal growth cone (STMN2, GAP43, and DCX) and early
neurogenesis (VIM, HES1 and SOX2). One cluster was a mixture of STMN2/GAP43/DCX high and
VIM/HES1/SOX2 high cells and labeled as intermediate. The neuronal clusters were further
separated into excitatory cortical neurons (CN) and inhibitory interneurons (IN) by vGLUT1, GAD1,
and GAD2 expression. One neuronal cluster lacking these markers was assigned as immature
neurons. Among non-neuronal clusters expressing biglycan and decorin, four clusters displayed
significant enrichment of “endothelial cell proliferation (GO:0001935)” and were labeled as
endothelial-like cells (EN). One of the endothelial clusters showed high expression of cell cycle-
related genes and was labeled as endothelial-like progenitors (ENP). Glia cells were assigned from
eight non-neuronal clusters with the significance of “glia cell differentiation (GO:0010001)”. Among
glia cell clusters, three clusters were labeled as astrocytes (AS) and one cluster as radial glial cells
(RGC) by their unique markers. One cluster with high expression of cilium assembly-related genes
was defined as cilium- bearing cells (CBC). Three clusters without these markers and cilium-related
genes were annotated as glia progenitor cells (GPC).
Two non-glia clusters highly expressed cell cycle genes and were labeled as neuronal
progenitor cells (NPC). One non-glia cluster was characterized with genes involved in BMP signaling
pathways and was labeled as BMP-related cells (BPC). The one remaining cluster was characterized
as “response to unfolded protein (GO:0006986)” and “ERAD signaling (GO:0036503)” and annotated
as an unfolded protein-related cells (UPRC). One cluster with high expression of genes involved in
epithelial-to-mesenchymal transition was labeled as EMT-related cells (EMT).
The assignment of cell types was verified by enrichment analysis of the cell type-specific gene
signatures. The gene signatures for neurons, NPCs, astrocytes, oligodendrocytes, and endothelial
cells were obtained from public single-cell RNA-seq of human fetal and adult brains (SRP057196) 6
and processed as described previously 4. The gene set enrichment analysis (GSEA) was performed
by GSEAPY software (v0.9.3) with options ‘‘–max-size 50000–min-size 0 -n 1000’’ to each cell, in
which genes were sorted by relative expression to the average of all cells. Doublet frequency was
estimated by the co-existence of TBR1 and GFAP genes, which were exclusively expressed in
neuron and glial cells 4.

Maturation states of neurons in the vascularized organoids were estimated by comparing the
transcriptome profile with the developing human brain (GSE104276) 7. Differentially-expressed genes
between vhCO- and control hCO-derived neurons were identified with 1.25-fold change and p<0.05
by two-sided T-test. Then, the enrichment of these genes was calculated in each gestational week by
GSEA software (v2.2.2) with 1,000 permutations of gene sets, weighted enrichment statistic and
signal-to-noise separation metric.
Differentiation trajectory was predicted by monocle (v2.99.3) in Bioconductor package 8.
Instead of the normalization in monocle tool, we used CCA aligned space from Seurat output as
normalized data projection. To construct the trajectory, the dimensionality was reduced by Uniform
Manifold Approximation and Projection (UMAP). After partitioning cells into supergroups by
approximate graph abstraction, the principal graph was learned by SimplePPT method. We note that
most of the cells were classified into one major supergroup. Cells in the other minor supergroup were
not used for subsequent analyses. Finally, cells were ordered by Pseudotime according to the graph
by selecting cells in NPC clusters as starting points.
REFERENCES
1 Patsch, C. et al. Generation of vascular endothelial and smooth muscle cells from human pluripotent stem cells. Nature cell biology 17, 994 (2015).
2 Lee, S., Kim, J. E., Johnson, B. A., Andukuri, A. & Yoon, Y.-S. (Future Medicine, 2017). 3 Morita, R. et al. ETS transcription factor ETV2 directly converts human fibroblasts into
functional endothelial cells. Proceedings of the National Academy of Sciences 112, 160-165 (2015).
4 Xiang, Y. et al. Fusion of Regionally Specified hPSC-Derived Organoids Models Human Brain Development and Interneuron Migration. Cell Stem Cell 21, 383-398 e387, doi:10.1016/j.stem.2017.07.007 (2017).
5 Xiang, Y. et al. hESC-Derived Thalamic Organoids Form Reciprocal Projections When Fused with Cortical Organoids. Cell Stem Cell 24, 487-497 e487, doi:10.1016/j.stem.2018.12.015 (2019).
6 Darmanis, S. et al. A survey of human brain transcriptome diversity at the single cell level. Proc Natl Acad Sci U S A 112, 7285-7290, doi:10.1073/pnas.1507125112 (2015).
7 Zhong, S. et al. A single-cell RNA-seq survey of the developmental landscape of the human prefrontal cortex. Nature 555, 524-528, doi:10.1038/nature25980 (2018).
8 Cao, J. et al. The single-cell transcriptional landscape of mammalian organogenesis. Nature 566, 496-502, doi:10.1038/s41586-019-0969-x (2019).