enhance the core. expand the footprint. extend the brand
TRANSCRIPT
FiFiscscalal yyeaear r 20201616 wwasas aa yyeaear r ofof cconontitit nunueded ssucuccecessss aandnd ggrrowtwthh fofor r ththe e CrCracackekerr BaBarrrrelel OOldldd CCouountntryry SStotot rere®® brbranand.d. IItt wawass a a yeyearar oof facaccocompmplilishshmementntss asas wwelelll asas cchahallllenengeges.s WWe e reremamaineded ffococo ususeded oon n exexececcututining g ouour r bubusisinenessss sstrtratategegy,y, ddelelivivererining g aa sisigngnifiificacantntt incncrereasase e inin oourur GAGAAPAP aandnd aadjdjusustetedd eaearnrniningsgs pperer ddililututeded sshaharere aandnd ddririvivingng cconontitinunueded sshaharerehoholdlderer rretetururnsns..
Sttraatet giic PrP ioritit eseInIn 2201012,2, wwe e ououtltlinineded oourur sstrtratategegicic pplalan:n:
FiFinan ncnccciaial Perfrforo mamancnceeWeWe bbelelieieveve oourur fifiscscalal 2201016 6 finfinanncicialal rresesulu tsts rrefleflecectt ouuour r cocommmmiti mementnt tto o gegeneneraratit ngng ppososititivive ee reretuturnrnss fofoor yoyou, oourur sshaharerehoholdlderers.s. TThrhrououghgh ththee fofocucus ofof oourur mmananagagememenentt teteamam, , wewe remmaia nenedd ststrorongng, dedeeliveverered d poposisititiveve ccomompapararablble ee ststororree rereststauaurarant and rretetaiail sasaleles reesusultts s in eeeveveryrr ququara teter r ofof tthehe yyeaear,r, aandnn ccononseseququenenntltly y ououtptpererfofooormrmmmedd tthe ccasasuauall didinining iinddusustrtry.y
WeWe ggrerew w ouour r rerevevenunuess bby y 2.2 5%5% ttoo $2$2.9.911 bibilll ioion,n, wwwitith h cocompmpararababablee sstotorere rresestataururanant t sas lees s inncrcreaee singn 222.2.2% andd cocompm arrababa lele store rretetaiaillsasaleless inincrcreaeasisingng 22.77%.% Addd ittioonaaallly,y,y, oourur GGAAAAP P opopo ere atatining mamargrginin impmproroveveedd to 99.6.6%% ofof rrevevenueu ffroromm 9.9 0%0% iinn ththe prp ioor r fisfiscacal yeeearar; ; anan
EEEnnnnhhhaaannnccee ttthhhee CCooorrreeee.. Expaand tthe Footpriint. EExxtteenndd tthhheee BBrrraanndd.. WiWithth tthahat t plplplanan aas s ouour r roroadadmamap,p, wwe e crcreaeatetedd anannunualal bbususininesess s prprioorirititieses tthahat t hahaveve gguiu dededd ouour r r acactitionons s anandd dedecicisisionons.s. AAss a a reresusultlt oof f ouourr didiscscipiplilinened d fofocucus s anandd exexececututioion,n, wwwe e exexceceedededed mmananyy ofof oourur tthrhreeee-y-yeaearr finfinanancicialal ttarargegeg tsts iinn 20201616. .
OuOur r firfirstst sstrtratategegicic ppririororititty,y, tttoo EnEnE hahah ncncnce e e ththt e e e CoCoorerere bbususininesess,s, eencncomompapasssseses oourur kkeyey ssalaleses aandnd ttraraffiffic c drdriviverers,s, iincncluludid ngngn memenunu iinnnnovovatatioion,n, rretetaiaill memercrchahandndisisining,g aandnd mmara keketitingng pprorogrgramams,s, aass wewellll aas s ouour r mamanyny ccosost-t-sasavivingng iininititiatativiveses.. InIn fifiscscalal 20201616,, asas pparart t ofof oourur sseaeasosonanal l memeenunu ffeaeatuturere pproroduductcts,s, wwe e ofoffeferered d seseveveraral l nenew w liliiiimimiteted-d-titimeme mmenenu u ititememms,s aas s wewellll aas sshihighghlilighghtitingng oourur ccorore e memenunu ggueuestst ffavavororititeses. . WeWe bbelelieieveve tthehesese sseaeasosonanal l memenunu ooffffereriningsgs, , susuchch aass ouour r CaCampmpfirfiree ChChicickekenn anannd d CaCampmpfirfire e BeBeefef eentntrereeses, , drdrovove e inincrcrememenentatal l imimprprovovvememenentsts tto o ouour r sasaleles s mimix.x.x
OuOur r fisfiscacal l 20201616 mmararkeketitingng pprorogrgramamss ininclclududeded iincncrereasaseded uusese ooooof f nanatitiononalal ccabablele aadvdverertitisisingng, anannn eexpxpx anansisionon oof f ouour r mumusisiccarartitistst pparartntnerershshipips,s, aandnd ggrorowtwthh inin oourur dddigigittalal aandnd ssocociaiall memedidid a a chchanannenelsls. WeWe aalslso o cocontntininueue tto o grgrowow oourur ccorore e guguesest t babasese ththrorougugh h SpSpananisish-h-lalangnguauagege ttelelevevisisioionn anandd raradidio o adadvevertrtisisining.g.g WWee bebelilievevee ththeee mamarkrkete inngg plplanan eexexecucutitionono ssupuppoportrteded oourur ououtptpererfoformrmmananaa cece ooff ththee cacasusualal ddinininingg inini duduststryryryyy..
FuFurtrtheher r drdrivivining g poposisititiveve ssalaleses ggrorowtwth,h, aandnd iimpmporortatantnt tto o ththe e auauththenentitic c CrCracackeker r BaBarrrrelel®® exexpepep ririenencece,, wewe mmererchchana didisesed d ouour r ststororeses wwitithh didiststininctctivive e anandd nonoststalalgigic c reretataili pproroduductcts,s, llikke e ouour r rerefrfresshihingng nnosostatalglgicic ssododasas ccururatateded ffroomm ala l l papartrts s ofof thehe cocoununtrtry.y. WWe e sosoururceced d cocollllececectitionons s wiwithth bbroroadad mmululultiti-g-genenereratatioionanall apappepeala aandnd ddisistitincnctitiveve pproroduductct aassssorortmtmenentstst ,, susuchch aas s ouour“S“Sumummemer r FuFun”n” tthehememe mmererchchanandidisese,, whwhicich h ininclclududeded aa vvararieietytyt oof f clclotothihingng,, acaccecessssororieies,s aandnd hhomome e dédécocor r ititememss ththatat wwe e bebelilieveve e apappepealaleded tto o gugueseststs oof f alall agagesese .
InIn oourur oongngoioingng eefffforo tsts tto imimprprovovee opopereratatioonsns aandnd eenhnhanancece tthehe ggueuestst aandnd eempmplolooyeyee e exexpeperirienencece,, wewe rrememmaiainened d fofocucusesedd onon imimplplememenentitingng ssevevereralal ccosost-t-sasavivingng iininititiatativiveses. DuDuriringng fififiscscalal 2201016 6 6 wewee ddeleliviverereded cconontitinunueded mmarargiginn imimprprovovememenent t inin mmanany y arareaeas,s, iincncluludidingng llababoror aandnd ooththerer rrelelatateded eexpxpenenseses s anand d mumultltipiplele ooththerer oopeperaratitingngn eexpxpenensese linineses.. CoContntriribubub titingng ttoo ththisis wwerereeouour r LELEDD LiLighghtitiingng, , TaTargrggeteteded FFoooodd MaMananagegemementnt ssysysy tetem,m, aandnd nnewew FFoooodd PrPrococesessosorr r ininititiaiatitiveves.
OuOur r sesecocondnd ssstrtratattegegicc ppririoro itty y isis too Expand theh Footprint wwititth h nenew w ststororee opopeneniningsgs ooututsisideded ooof f ouour r cocorere mmararkeketsts. .ThThrorougugh h ththeee ususe e ofof ooourur rrefiefinenedd sisitete sselelecectitionon ttoooolsls,, ththhe e imimmplplememenentatatitionon off mamarkrketet-b-basasa eded ppriricicingng ttieiersrs, ananndd opopereratatiningg cocostst rereduductctioionsns rreaealilizezed d ththrorougughh ouour r FuFusisionon pprorotototytypepe, , wewe hhavave e bebegugun n toto ddelelivverer oon n ththesessee plplanans.s. WWe e opopeneneded oourur fifirsrstt NeNevavadada ststororree inin fifiscscalal 2201016 6 anand d haaveve aaddddititioionanal l sisitetes s inin NNevevadada a anandd OrOregegonon iinn ouour r nenew w ststororeee pipipepelilinene..
OuOur r ththirirdd ststraratetegigic c prprioorirityty iis s toto ExExtetendnd tthehe BBrarandnd ooututsisidede oooof f ththee CrC acackekeer r BaBarrrrelel sstotorere. DuDuD riringng fifiscscalal 2201016,6,6 tthahat t ininclclududeded a a fofocucuss onon ddevevelelopopiningg anand d brbriningigingng ttoo mamarkrketet aa nnewew ccononceceptpt,, HoHoH llllerer &&& DDasash h BiBiscscuiuiu t t HoHousuuseeTMTM, toto llevevereragage e ththe e ststrerengngthth oof fththe e CrCracackeker r BaBarrrrelel bbrarandnd wwhihilele pproroovividid ngng aaa nnewew ttypype e ofof ggueuestt eexpxpx ererieiencnce.e. WWitith h itits s bbiscscuiuit-t-innspspirireded mmenenuu ththatat ppayayss trribibutute etoto tthehe SSououthth iin n anan iinnnnn ovovvatativivee anandd momodedernrn wwayaya ,, HoHolll erer && DDasashh wawas s crc eaeateteted too eextxtenend d ouour r rereacachh inintoto mmororee memetrtropopololititanan loloocacatitiononss anand d atattrtrt acactt neneww guguesststs. ThThhe e teteamam cconontitinun eses tto o dodod aa ggrereata jjobob ggrorowiwingg tthehe bbrarandnd,, anandd ththe e ininititiaial l gug esestt rerespspononsese hahass bebeenen eexcxcepeptitiononalal. WeWeWe ddo o nonot t exexpepectct iit t toto hhavavee a a mamaaatetet ririala fifinanancnciaiall imimpapactct iinn ththee nenearar tterermm,mm bbutut bbelelieieveve iit t prprovovidideses atattrtracactitiveve oopppporortutuninititieses ttoo exextetendndd aandnd ddiviverersisisifyfy oourur rreaeachch..
inncrcreaeasese oof f 6060 bbasasisis ppoointnts,s, oor r 5050 bbasasisis ppoiointnts s whwhenen aadjd ususteted d toto eexcxcluludee aa fifiscscalal 2201015 5 lilititigagatitionon aaccccrurualal. OuOurr opopereratatininggg inincocomeme ggroroowtwth h wawas s drdrivivenen bby y cocommmmododitity y dedeflaflatitionon, , immmmplplememenentatatitionon oof f cocostst-s-savavining g ininititiaiatitiveves s inin tthhehe ccururrerentnt aandnd ppririoror fifiscscalal yyeaearsrs, , anand d d ththt e e cocontntn ininueueddcocommmmititmementnt oof f ouourr momorere tthahann 7070,0,00000 eempmploloyeyeeses tto o sts ayay ttrurue e toto oourur mmisissisionon oof f “P“Pleeasasining g PePeopoplele.”.”
DuDuriringng fifiscscala 2201010 6,6, wwe e gegeneneraratetedd ovoverer $$27270 0 mimillllioionn inin oopeperaratitingng ccasash h floflow,w, wwhihichch aalllll owoweded uus s toto:: •• prprovovidide e inincoomeme fforo iinvnvesestit ngng in n ououur r fufututurere tthrhrououghgh ccapapiti alal eexpxpenendiditutureres,s•• inincrcreaeasese oourur mmosost t rerececentnt qquauartrtererlyly ddivivididdenene d d paaidid tto o shshararehehololdedersrs ttoo $1$1$ .115,5, aandnd,,•• susupppporort t a a spspececiaiall didivividedendnd oof f $3$3$3$ .2.25.5.
WeWe bbelelieieveve oourur fifiscscalal 2201016 6 finfinananciciaal rresesulultsts rrefleflecect t ououo r cocommmmititmementnt tto o gegeneneraratitiingng ppososoo ititivive e reretuturnrnss fofor r yoyou,u, oourur sshaharerehoholdldddderere s.s.
PlPleaeasisingngn PPPeoeoe plplee®®
InIn aaddddititioion n toto oourur fifinanancnciaial l acachihievevememenentsts, ththe e susuccccesess s ofof ooourur eefffforortsts is s clcleaear r inin wwhahat t ouour r gugueseststs aandnd eempmplooyeyeeses ssayay aaboboutut uus.s. TThihis s yeyearar,wew ttooookk totopp hohononorsrsr aas s papartrt oof f ththe e NaNatitionon’s’s RResestataururanant t NeNewswsw ’’ 20201616 CCCononsusumemem r r PiPickcks s rerepopoortrt, chchososenen aas s ththee BeBestst FFamamilli y-y-DiDiininingng RResestataururanannt.t ThThisis mmararrkeked d ouourr fofoururthth yyeaearr toto rrececeieiveve ttopop hhononororss inin ttthehe NNatatioion’n’s s ReReststauaua rarantnt NNewews’s’ CCononsusuuumemerr PiPickcks’s ssixix-y-yeaear r hihiststorory.y.
CrCracackeker r BaBarrrrelel wwassas aalslso o nanamemed d AmAmerericica’a s s FaFaF vovoriritete CCasasuauall DiDininingng RResestataururanant t inin aa sstutudydy bby y MaMarkrketet FFororcece IInfnforormamatitionon®® babasesed d onon tttthehe sasatitisfsfacactitionon rratatatinngsgs ooff coconsnsumumererss reregagardrdining g ththheieir rr momoostst rrececee enent t didininingngg eexpxpererieiencnce.e. CCrarackckererr BBararrerel l alalsoso rranankekeddd ththe e hihighghesestt inin tthehe ggenenererralal memenunu ccatategegorory,y, aas ssss wewellll aas s leled ddd ininnnnn tthehe aattttriribubutetess ofof VValalueue, FrFrieiendn lyly SSerervivicece, , anannd d FaFastst SSerervivicece.
FuFurtrthehermrmorore,e, CCrarackckerer BBara rerel l wawas s rerecocogngnizizeded aas s ththe e wiw nnerer aamoomongng ffululll seservrvicice e rereststauaurarantntss inin tthehe VValalueue TThrhrououo ghgh SSerervivicece ccatategegorory y byby TeTeechchnonomimic®c®,, a a leleadadining g coconsnsulultitingng aandnd rreseseaearcrchh firfirm m seservrviining g ththe e fofoododdd iindndddusustrtry.y. TThihiss mamarkrkeded oourur tthihirdrd CChahainin RRRResestataururanantt CoConsnsumumerers’s’ CChohoicice e AwAwarardd wiwin.n.
WeWe aarere hhumumblbleded bby y ththesese e rerecocogngnititioiooonsnsnn , asas eeacaca hh ofof tthehesese aawawardrds s rereprpresesenentstst tthehe vvoioiceceee aandnd vvototeses oof f coconsnsumumerers.s. HHHowoweveverer, wewe kknonow w ththatat whwhene oourur eempmpmploloyeyeeses aaarere eengngagageded aaandnd ccomommimitttteded tto o ouour r mimissssioion,n, tthehey y wiwilll ddo o ththheieir bebestst ttoo tatakeke ccarare e ofof oourur ggueueststs.s. TThehererefoforere, itit wwasas aa spspececiaial l hohononor totott bbbe e nanamemedd asas aa 2201010 6 6 ToTop p WoWorkrkplp acace ee bybyy ThThe e TeTennnnesesseeseanan® nnewewspspapaperer.. CrCracackeker r BaBarrrrelele eempmploloyeyeeses ffroromm ththee MiMiddddlele ®®TeTennnnn esessesee e arareaea pprorovivideded d fefeededbabackck oonn ththee CoCoC mpmpanany’y’s s ororgaganinizazatitionononala hheae ltlth h anand d woworkrkplplacacee enenene gagagegemementnt ttoo ann indndepepenendedentnt rreseseaearcrchh firfirm,m, whwho o nanamemedd CrCracackeker r BaBarrrrelel aa wwininniningng oorgrgananizizatatioion.n. II aam veveryry ppleleasaseded wwitithh eaeaee chch ooff ththesese e prpresestitigigiouousss rerecocogngnititioionsns ffrorom m ouour r ememplployoyo eeeess ananddguguesestss.
WhWhililee 20201616 wwas aa cchahallllenengigingng yyeaear r wiwiththinin ttheheheh rresestataururanana t t ininduduststryry, , II amam vverery y prprououd d ofofo oourur mmorore e e ththanan 770,0,0 00000 00 ememplployoyeees s fofor reremamaininininggfofocucusesedd onon eexexecucutitingng oooourur sstrtratategegicic pplalansnss aandnd ddelelivivereriningg onon oourur ““PlPleaeasis ngng PPeoeoplple”e” mmmisissisionon.. AsAs wwwe e bebegigig nn ouour r nenew w fisfiscacal l yeyearar,, ouour r fofocucus s isss onon ddelelivivereriningg cocontntininueued d poosis titiveve rresesulultsts aandnd ddririiiviviv ngnng vvalalueue tto o ouour r shshararehehololdedersrs aaandndd ggueueststs.s
ThThanank k yoyouu fofor r yoyourur intntereresestt in aandnd ccomommimitmtmenene t t toto oourur bbraraandnd,
SaSaS ndndrara BB. CoCochchrarannPrPresesididenent t anand d ChChieief f ExExececututivive e OfOfficficerer
OpOpereratatining g inincocomeme aandnd EEPSPS ddeteterermiminened d inin aaccccorordadancncce e wiwithth GGAAAAAP PP wewerere $$28280.0.5 5 5 mimillllioion n anand d $7$7.8.86 6 peer r shsharare e fofor r 202016166 aandndndndnd $$$25254.4 9 9 mimillllioion n anand d $6$6.8.882 2 peer r shsharare fofor r 20201515, rerespspecectitivevelyly. ThThe e GAGAAPAP aamomoununt t fofor r 20201616 iincncluludedes s a a a rereduductctioion n ofofff ccerrtatainin pproroviviiiisisisss onons s fofooor r ununcececc rtrtaiain n tatax x poposisititionons s anand d ththe e reretrtroaoactctivive e reeininststattememenent t ofof tthehe WWorork k OpOOppoportrtununitity y TaTax x CrCrededitit iin n fisfiscacal l 202016166,,, anand d ththe ee GAGAAPAP aamomounnt t fofor 20201515 incncluludedes s exexpepensnseses aassssocociaiai teted d wiwithth tthehe llititigigatation n unundeder rththe e FaFair LLababoror SStatandndarardsds AActcttt aandnd tthehe rretetroroacactitive reiinsnstatatetemementnt oof f ththe e WoWorkrk OOppppp orortutunityty TTax Creedid t t inin fifiscscalal 22201015.5 AA rrece ononcicililiatatioion n ofo tthehe CComompapanyny’s finfinanancicialal rresesulultsts ddeteterermiminened d d inin aaccccorordadancnce e wiwithth GGAAAAP P toto ccerere tatainin nnonon-G-GAAAAP P finfinananciialal mmmmmeae susureres ususeded hhererreiee n n hahas s bebeenen ppproovivideded d d onon ppagage e 7979.

CRACKER BARREL OLD COUNTRY STORE, INC.
Directors
Thomas H. Barr President of Sono Bello; former Vice President, Global Coffee at
Starbucks Corporation
Glenn A. Davenport President of G.A. Food Service, Inc.;
former Chairman and CEO of Morrison Management Specialists
William W. McCarten Retired; former Chairman of the
board of directors of DiamondRock Hospitality Company
James W. Bradford Chairman of the Board; Retired; former Dean and Professor for the Practice of Management at Vanderbilt University’s Owen Graduate School of Management
Richard J. Dobkin Retired; former Managing Partner of theTampa, FL office of Ernst & Young, LLP
Coleman H. Peterson President and CEO of Hollis Enterprises,
LLC; former Chief People Officer ofWal-Mart Stores, Inc.
Sandra B. Cochran President and CEO of
Cracker Barrel Old Country Store, Inc.
Norman E. Johnson Retired; former Executive Chairman
and CEO of CLARCOR, Inc.
Andrea M. Weiss President and CEO of Retail
Consulting, Inc.; former President of dELiA*s Corp.
UNITED STATES SECURITIES AND EXCHANGE COMMISSION
WASHINGTON, D.C. 20549
FORM 10-K
(Mark One) [x] Annual Report Pursuant to Section 13 or 15(d) of the Securities Exchange Act of 1934
For the fiscal year ended July 29, 2016
OR
[ ] Transition report pursuant to Section 13 or 15(d) of the Securities Exchange Act of 1934 For the transition period from to
Commission file number: 000-25225
Cracker Barrel Old Country Store, Inc. (Exact name of registrant as specified in its charter)
Tennessee
(State or other jurisdiction of incorporation or organization)
62-0812904 (I.R.S. Employer Identification Number)
305 Hartmann Drive Lebanon, Tennessee (Address of principal executive offices)
37087-4779 (Zip code)
Registrant's telephone number, including area code: (615) 444-5533
Securities registered pursuant to Section 12(b) of the Act:
Title of each class Common Stock (Par Value $.01) Rights to Purchase Series A Junior Participating Preferred Stock (Par Value $0.01)
Name of each exchange on which registered The NASDAQ Stock Market LLC (NASDAQ Global Select Market)
Securities registered pursuant to Section 12(g) of the Act: None
Indicate by check mark if the registrant is a well-known seasoned issuer, as defined in Rule 405 of the
Securities Act. Yes No
Indicate by check mark if the registrant is not required to file reports pursuant to Section 13 or Section 15(d) of the Act. Yes No
Indicate by check mark whether the registrant (1) has filed all reports required to be filed by Section 13 or 15(d) of the Securities Exchange Act of 1934 during the preceding 12 months (or for such shorter period that the registrant was required to file such reports) and (2) has been subject to such filing requirements for the past 90 days. Yes No
2
Indicate by check mark whether the registrant has submitted electronically and posted on its corporate Web site, if any, every Interactive Data File required to be submitted and posted pursuant to Rule 405 of Regulation S-T (§ 232.405 of this chapter) during the preceding 12 months (or for such shorter period that the registrant was required to submit and post such files). Yes No
Indicate by check mark if disclosure of delinquent filers pursuant to Item 405 of Regulation S-K (§ 229.405 of
this chapter) proxy or information statements incorporated by reference in Part III of this Form 10-K or any amendment to this Form 10-K.
Indicate by check mark whether the registrant is a large accelerated filer, an accelerated filer, a non-
-2 of the Exchange Act. Large accelerated filer Accelerated filer Non-accelerated filer Smaller reporting company
Indicate by check mark whether the registrant is a shell company (as defined in Rule 12b-2 of the Act). Yes No The aggregate market value of voting stock held by nonaffiliates of the registrant as of January 29, 2016 (the
) was $3,109,756,667.
As of September 19, 2016, there were 24,028,896 shares of common stock outstanding.
Documents Incorporated by Reference
Document from which Portions are Incorporated by Reference
Part of Form 10-K into which incorporated
1. Proxy Statement for Annual Meeting of Part III
Shareholders to be held November 17, 2016 2016
3
PAGE
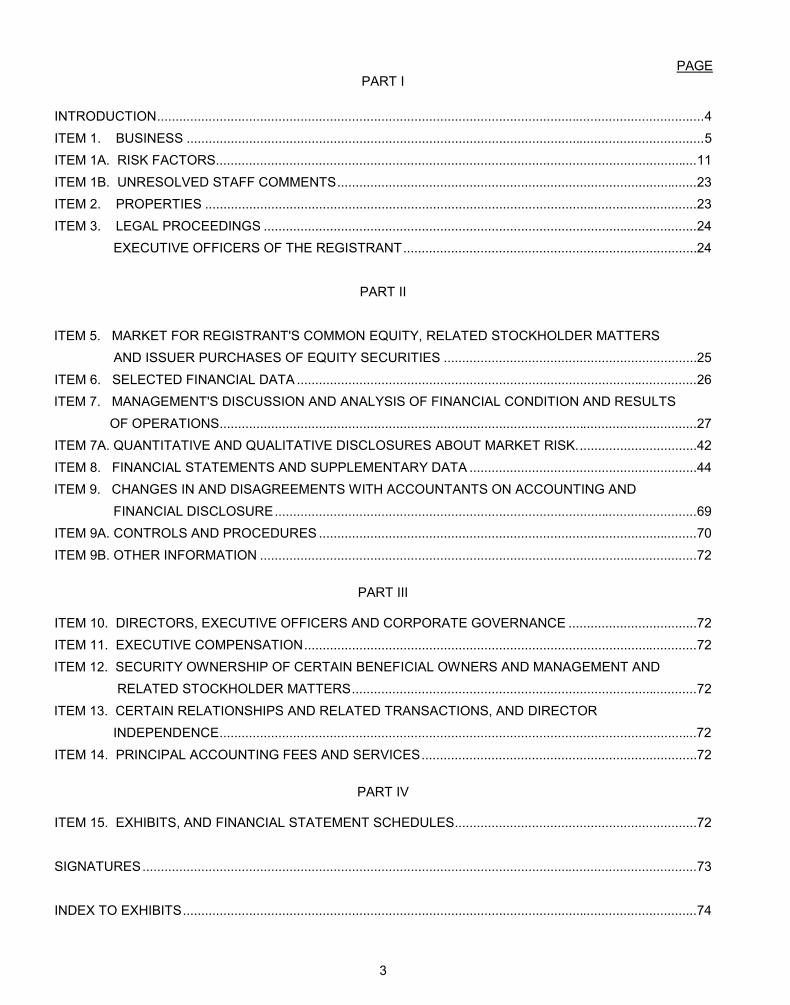
PART I INTRODUCTION ..................................................................................................................................................... 4ITEM 1. BUSINESS ............................................................................................................................................. 5ITEM 1A. RISK FACTORS ................................................................................................................................... 11ITEM 1B. UNRESOLVED STAFF COMMENTS .................................................................................................. 23ITEM 2. PROPERTIES ...................................................................................................................................... 23ITEM 3. LEGAL PROCEEDINGS ...................................................................................................................... 24 EXECUTIVE OFFICERS OF THE REGISTRANT ................................................................................ 24
PART II
ITEM 5. MARKET FOR REGISTRANT'S COMMON EQUITY, RELATED STOCKHOLDER MATTERS AND ISSUER PURCHASES OF EQUITY SECURITIES ..................................................................... 25ITEM 6. SELECTED FINANCIAL DATA ............................................................................................................. 26ITEM 7. MANAGEMENT'S DISCUSSION AND ANALYSIS OF FINANCIAL CONDITION AND RESULTS OF OPERATIONS.................................................................................................................................. 27ITEM 7A. QUANTITATIVE AND QUALITATIVE DISCLOSURES ABOUT MARKET RISK. ................................ 42ITEM 8. FINANCIAL STATEMENTS AND SUPPLEMENTARY DATA .............................................................. 44ITEM 9. CHANGES IN AND DISAGREEMENTS WITH ACCOUNTANTS ON ACCOUNTING AND
FINANCIAL DISCLOSURE ................................................................................................................... 69ITEM 9A. CONTROLS AND PROCEDURES ....................................................................................................... 70ITEM 9B. OTHER INFORMATION ....................................................................................................................... 72
PART III
ITEM 10. DIRECTORS, EXECUTIVE OFFICERS AND CORPORATE GOVERNANCE ................................... 72ITEM 11. EXECUTIVE COMPENSATION ........................................................................................................... 72ITEM 12. SECURITY OWNERSHIP OF CERTAIN BENEFICIAL OWNERS AND MANAGEMENT AND RELATED STOCKHOLDER MATTERS .............................................................................................. 72
ITEM 13. CERTAIN RELATIONSHIPS AND RELATED TRANSACTIONS, AND DIRECTOR INDEPENDENCE ..................................................................................................................................72ITEM 14. PRINCIPAL ACCOUNTING FEES AND SERVICES ........................................................................... 72
PART IV
ITEM 15. EXHIBITS, AND FINANCIAL STATEMENT SCHEDULES.................................................................. 72
SIGNATURES ....................................................................................................................................................... 73
INDEX TO EXHIBITS ............................................................................................................................................ 74
4
INTRODUCTION General
This report contains references to years 2016, 2015 and 2014, which represent our fiscal years ended July 29, 2016, July 31, 2015 and August 1, 2014, respectively. All of the discussion in this report should be read with, and is qualified in its entirety by, the Consolidated Financial Statements and the notes thereto. All amounts other than share and certain statistical information (e.g., number of stores) are in thousands unless the context clearly indicates otherwise. Similarly, references to a year or quarter are to our fiscal year or quarter unless expressly noted or the context clearly indicates otherwise.
Forward-Looking Statements/Risk Factors
Except for specific historical information, many of the matters discussed in this Annual Report on Form 10-K, as well as other documents incorporated herein by reference, may express or imply projections of items such as revenues or expenditures, estimated capital expenditures, compliance with debt covenants, plans and objectives for future operations, store economics, inventory shrinkage, growth or initiatives, expected future economic performance or the expected outcome or impact of pending or threatened litigation. These and similar statements
in the future are forward-looking statements that, by their nature, involve risks, uncertainties and other factors which may cause our actual results and performance to differ materially from those expressed or implied by such forward-looking statements. All forward-looking information is provided pursuant to the safe harbor established under the Private Securities Litigation Reform Act of 1995 and should be evaluated in the context of these risks, uncertainties and other factors. Forward-looking statements generally can be identified by the use of forward-looking terminology such
- -
the negative or other derivatives of each of these terms) or similar terminology. We believe the assumptions underlying any forward-looking statements are reasonable; however, any of the assumptions could be inaccurate, and therefore, actual results may differ materially from those projected in or implied by the forward-looking statements. In addition to the risks of ordinary business operations, and those discussed or described in this report or in information incorporated by reference into this report, factors and risks that may result in actual results differing from this forward-looking information include, but are not limited to, those contained in Part I, Item 1A of
of this report releases and other communications.
Readers are cautioned not to place undue reliance on forward-looking statements made in this report, since the statements speak only as of the report’s date. Except as may be required by law, we have no obligation or intention to publicly update or revise any of these forward-looking statements to reflect events or circumstances occurring after the date of this report or to reflect the occurrence of unanticipated events. Readers are advised, however, to consult any future public disclosures that we may make on related subjects in reports that we file with or furnish to the SEC or in our other public disclosures.
5
PART I ITEM 1. BUSINESS OVERVIEW
Company, which reference, unless the context requires otherwise, also includes our direct and indirect wholly-owned subsidiaries), is principally engaged in the
We are headquartered in Lebanon, Tennessee and were originally founded in 1969. We are organized under the laws of the State of Tennessee.
We maintain a website at crackerbarrel.com. We make available free of charge through our website our
periodic and other reports filed with or furnished to the SEC pursuant to the Securities Exchange Act of 1934, as amended , as soon as reasonably practicable after we file such material with, or furnish it to, the SEC. Information on our website is not deemed to be incorporated by reference into this Annual Report on Form 10-K or any other filings that we make from time to time with the SEC. OPERATIONS Cracker Barrel Old Country Store
As of September 19, 2016, we operated 640 Cracker Barrel stores in 43 states. None of our stores are franchised. Our stores are intended to appeal to both the traveler and the local customer, and we believe they have consistently been a consumer favorite. We pride ourselves on our consistent quality, value and friendly service. The dedication and commitment of our operating teams continues to be broadly recognized by consumers. Nation’s Restaurant News 2016 Consumer Picks survey named Cracker Barrel Old Country Store® the Best Family-Dining Restaurant in America. Furthermore, Cracker Barrel was recognized in 2016 as the winner among full service restaurants in the Value Through Service category by Technomic, Inc., a leading consulting and research firm serving the food industry. We believe these recognitions reaffirm the affinity guests have for our brand, as each of these awards represents the voice and votes of consumers.
Store Format: The format of our stores consists of a trademarked rustic old country-store design offering a full-
service restaurant menu that features home-style country food and a wide variety of decorative and functional items such as rocking chairs, holiday and seasonal gifts and toys, apparel, cookware and foods. All stores are freestanding buildings. Store interiors are subdivided into a dining room occupying approximately 27% of the total interior store space, a gift shop occupying approximately 23% of such space and the balance primarily consisting of kitchen, storage and training areas. Our stores have stone fireplaces and are decorated with antique-style furnishings and other authentic and nostalgic items, reminiscent of and similar to those found and sold in the past in traditional old country stores. The front porch of each store features rows of the signature Cracker Barrel rocking chairs that can be used by guests while waiting for a table in our dining room or after enjoying a meal and are sold by the gift shop. The kitchens contain modern food preparation and storage equipment allowing for flexibility in menu variety and development.
Products: Our restaurants, which generated approximately 80% of our total revenue in 2016, offer home-style country cooking featuring many of our own recipes that emphasize authenticity and quality. Except for Christmas Day, when they are closed, and Christmas Eve, when they close at 2:00 p.m., our restaurants serve breakfast, lunch and dinner daily between the hours of 6:00 a.m. and 10:00 p.m. (closing at 11:00 p.m. on Fridays and Saturdays). Menu items are moderately priced. The restaurants do not serve alcoholic beverages.
6
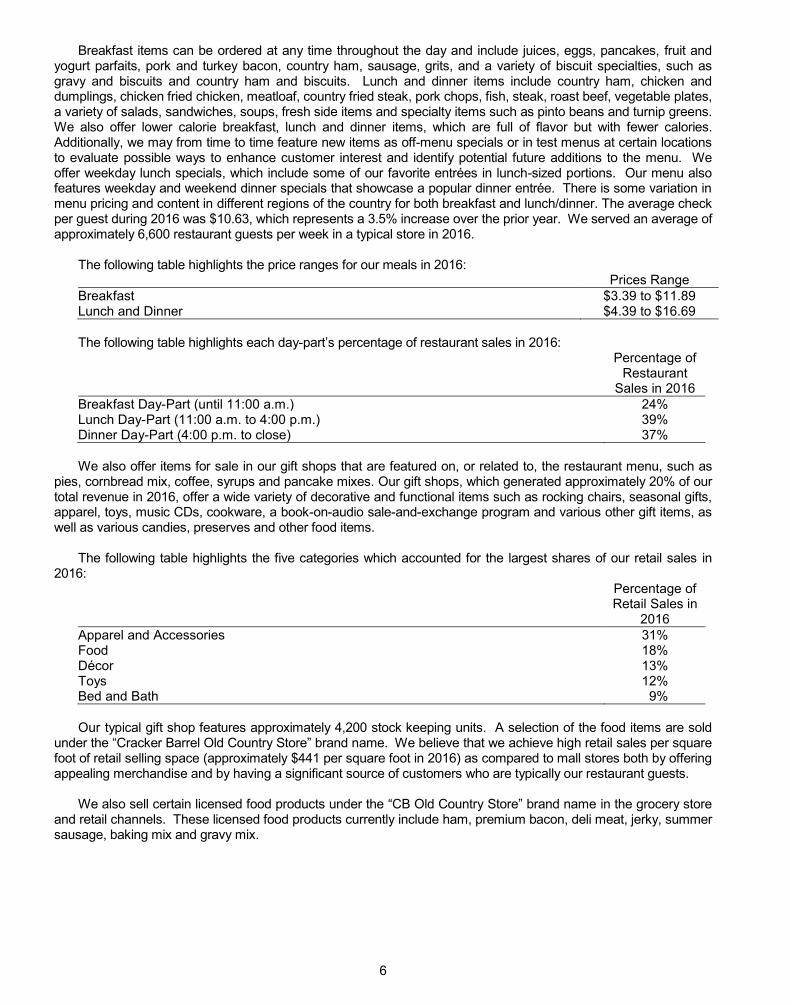
Breakfast items can be ordered at any time throughout the day and include juices, eggs, pancakes, fruit and yogurt parfaits, pork and turkey bacon, country ham, sausage, grits, and a variety of biscuit specialties, such as gravy and biscuits and country ham and biscuits. Lunch and dinner items include country ham, chicken and dumplings, chicken fried chicken, meatloaf, country fried steak, pork chops, fish, steak, roast beef, vegetable plates, a variety of salads, sandwiches, soups, fresh side items and specialty items such as pinto beans and turnip greens. We also offer lower calorie breakfast, lunch and dinner items, which are full of flavor but with fewer calories. Additionally, we may from time to time feature new items as off-menu specials or in test menus at certain locations to evaluate possible ways to enhance customer interest and identify potential future additions to the menu. We offer weekday lunch specials, which include some of our favorite entrées in lunch-sized portions. Our menu also features weekday and weekend dinner specials that showcase a popular dinner entrée. There is some variation in menu pricing and content in different regions of the country for both breakfast and lunch/dinner. The average check per guest during 2016 was $10.63, which represents a 3.5% increase over the prior year. We served an average of approximately 6,600 restaurant guests per week in a typical store in 2016.
The following table highlights the price ranges for our meals in 2016: Prices Range
Breakfast $3.39 to $11.89 Lunch and Dinner $4.39 to $16.69
The following table highlights each day- 2016: Percentage of
Restaurant Sales in 2016
Breakfast Day-Part (until 11:00 a.m.) 24% Lunch Day-Part (11:00 a.m. to 4:00 p.m.) 39% Dinner Day-Part (4:00 p.m. to close) 37%
We also offer items for sale in our gift shops that are featured on, or related to, the restaurant menu, such as
pies, cornbread mix, coffee, syrups and pancake mixes. Our gift shops, which generated approximately 20% of our total revenue in 2016, offer a wide variety of decorative and functional items such as rocking chairs, seasonal gifts, apparel, toys, music CDs, cookware, a book-on-audio sale-and-exchange program and various other gift items, as well as various candies, preserves and other food items.
The following table highlights the five categories which accounted for the largest shares of our retail sales in
2016: Percentage of
Retail Sales in 2016
Apparel and Accessories 31% Food 18% Décor 13% Toys 12% Bed and Bath 9%
Our typical gift shop features approximately 4,200 stock keeping units. A selection of the food items are sold
foot of retail selling space (approximately $441 per square foot in 2016) as compared to mall stores both by offering appealing merchandise and by having a significant source of customers who are typically our restaurant guests.
We also sell certain licensed food products under the in the grocery store and retail channels. These licensed food products currently include ham, premium bacon, deli meat, jerky, summer sausage, baking mix and gravy mix.
7
Product Development and Merchandising: We maintain a product development department, which develops new and improved menu items either in response to shifts in customer preferences or to create customer interest. We use a formal development and testing process, which includes guest research and in-store market tests to ensure products brought to market have a greater likelihood of meeting our goals. Menu-driven growth is built through three areas: enhancements to our current core menu offerings, the addition of new core menu offerings and limited time offer promotions we call seasonal events. Our merchandising department selects and develops products for our gift shop. We are focused on driving retail sales by converting those customers who come to us for a restaurant visit. Our assortment includes core and seasonal themes. Our seasonal themes are designed to create interest and excitement in our stores by providing our guests with additional choices. Our licensees develop new licensed food products under our direction for consideration and approval. We intend to add additional licensees and licensed food products in the future.
Store Management and Quality Controls: At each store, our store management typically consists of one
general manager, four associate managers and one retail manager. Our store management is responsible for an average of 105 employees operating two shifts. The relative complexity of operating one of our stores requires an effective management team at the individual store level. To motivate store managers to improve sales and operational performance, we maintain bonus plans designed to provide store managers with an opportunity to share in the profits of their store. The bonus plans also reward managers who achieve specific operational targets. Each store is assigned to both a restaurant and a retail district manager. We employ ninety-two restaurant district managers and ten restaurant regional vice presidents. Each restaurant district manager oversees seven to nine stores and each restaurant regional vice president oversees eight to ten district managers. Each restaurant district manager is assigned to a restaurant regional vice president. We also employ fifty-two retail district managers, two retail regional directors and four retail regional vice presidents. Each retail district manager oversees ten to fifteen retail stores. Each retail director oversees four district managers. Each retail regional vice president oversees eight to thirteen retail district managers. Two of the retail regional vice presidents each oversee one of the two regional directors. The various levels of restaurant and retail management work closely together to allow our stores to deliver a unique, integrated employee and guest experience.
To ensure that individual stores are operated at a high level of quality, we focus significant attention on the
selection and training of store managers. The store management recruiting and training program begins with an evaluation and screening process. In addition to multiple interviews and verification of background and experience, we conduct assessments designed to identify those applicants most likely to be best suited to manage store operations. Candidates who successfully pass this screening process are then required to complete a training program. The restaurant manager training program consists of three weeks of training at our home office and five weeks of in-store training. The retail manager training program consists of two weeks of training at our home office and three weeks of in-store training. We believe that our training programs develop managers who can effectively deliver a great employee and guest experience through the leadership and execution of our operating systems. These programs allow new managers the opportunity to become familiar with our operations, culture, management objectives, controls and evaluation criteria before assuming management responsibility. We provide our managers and hourly employees with ongoing training through various development courses taught through a blended learning approach, including a mix of hands-on, traditional classroom, written and cloud-based training. Each store is equipped with dedicated training computers and cloud-based proprietary eLearning instruction programs. Additionally, each store typically has an employee training coordinator who oversees the hourly employees.
Purchasing and Distribution: We negotiate directly with food vendors as to specification, price and other material terms of most food purchases. We have a contract with an unaffiliated distributor with custom distribution centers in Lebanon, Tennessee; McKinney, Texas; Gainesville, Florida; Elkton, Maryland; Kendalville, Indiana; and Ft. Mill, South Carolina. We purchase the majority of our food products and restaurant supplies on a cost-plus basis through this unaffiliated distributor. The distributor is responsible for placing food orders, warehousing and delivering food products to our stores. Deliveries are generally made once per week to individual stores. Produce is purchased through a national program and is delivered three times a week through a network of approximately fifty independent produce suppliers. Fluid dairy is delivered three times a week through approximately fifty regional dairies, the majority of which are under the ownership of two separate companies.
8
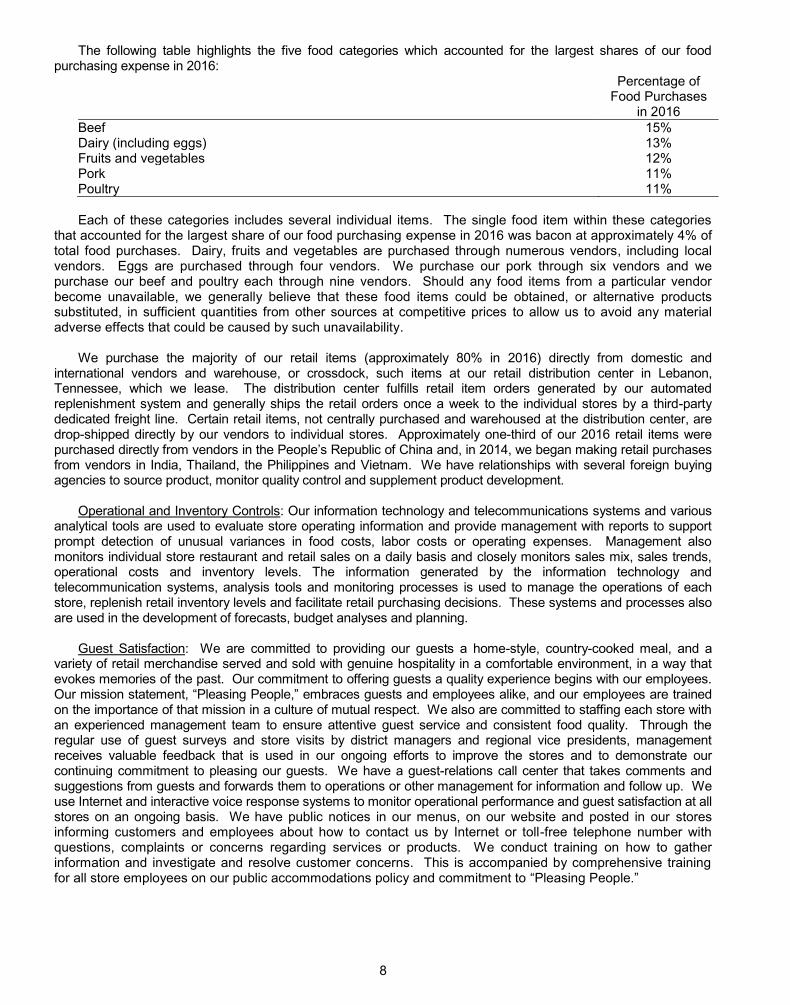
The following table highlights the five food categories which accounted for the largest shares of our food purchasing expense in 2016:
Percentage of Food Purchases
in 2016 Beef 15% Dairy (including eggs) 13% Fruits and vegetables 12% Pork 11% Poultry 11% Each of these categories includes several individual items. The single food item within these categories
that accounted for the largest share of our food purchasing expense in 2016 was bacon at approximately 4% of total food purchases. Dairy, fruits and vegetables are purchased through numerous vendors, including local vendors. Eggs are purchased through four vendors. We purchase our pork through six vendors and we purchase our beef and poultry each through nine vendors. Should any food items from a particular vendor become unavailable, we generally believe that these food items could be obtained, or alternative products substituted, in sufficient quantities from other sources at competitive prices to allow us to avoid any material adverse effects that could be caused by such unavailability.
We purchase the majority of our retail items (approximately 80% in 2016) directly from domestic and international vendors and warehouse, or crossdock, such items at our retail distribution center in Lebanon, Tennessee, which we lease. The distribution center fulfills retail item orders generated by our automated replenishment system and generally ships the retail orders once a week to the individual stores by a third-party dedicated freight line. Certain retail items, not centrally purchased and warehoused at the distribution center, are drop-shipped directly by our vendors to individual stores. Approximately one-third of our 2016 retail items were purchased directly from vendors in the Pe and, in 2014, we began making retail purchases from vendors in India, Thailand, the Philippines and Vietnam. We have relationships with several foreign buying agencies to source product, monitor quality control and supplement product development.
Operational and Inventory Controls: Our information technology and telecommunications systems and various analytical tools are used to evaluate store operating information and provide management with reports to support prompt detection of unusual variances in food costs, labor costs or operating expenses. Management also monitors individual store restaurant and retail sales on a daily basis and closely monitors sales mix, sales trends, operational costs and inventory levels. The information generated by the information technology and telecommunication systems, analysis tools and monitoring processes is used to manage the operations of each store, replenish retail inventory levels and facilitate retail purchasing decisions. These systems and processes also are used in the development of forecasts, budget analyses and planning.
Guest Satisfaction: We are committed to providing our guests a home-style, country-cooked meal, and a variety of retail merchandise served and sold with genuine hospitality in a comfortable environment, in a way that evokes memories of the past. Our commitment to offering guests a quality experience begins with our employees.
employees are trained on the importance of that mission in a culture of mutual respect. We also are committed to staffing each store with an experienced management team to ensure attentive guest service and consistent food quality. Through the regular use of guest surveys and store visits by district managers and regional vice presidents, management receives valuable feedback that is used in our ongoing efforts to improve the stores and to demonstrate our continuing commitment to pleasing our guests. We have a guest-relations call center that takes comments and suggestions from guests and forwards them to operations or other management for information and follow up. We use Internet and interactive voice response systems to monitor operational performance and guest satisfaction at all stores on an ongoing basis. We have public notices in our menus, on our website and posted in our stores informing customers and employees about how to contact us by Internet or toll-free telephone number with questions, complaints or concerns regarding services or products. We conduct training on how to gather information and investigate and resolve customer concerns. This is accompanied by comprehensive training for all store employees on our public accommodations policy and commitment to Pleasing People.
9
Marketing: We employ multiple mediums to reach and engage our guests. Outdoor advertising (i.e., billboards and state department of transportation signs) is the largest advertising vehicle we use to reach our traveling and local guests. In 2016, we had over 1,700 billboards and this expenditure accounted for 37% of our total advertising spend. Outdoor advertising is also expected to represent approximately 34% of advertising expenditures in 2017. We believe we are among the top billboard advertisers in the restaurant industry. Our use of non-billboard media has increased in recent years as we look to build market awareness for local occasions. This increased support has used broadcast television, national cable and digital support. In 2016, we ran media in each quarter. We continue to increase our efforts in the digital space to drive preference and engagement with the brand. We now have properties on multiple social media sites, including a customer relationship management program, an e-commerce platform and our brand site. Our exclusive music program drives awareness for the brand and builds cultural relevance and affinity with our guests. We continue to have multiple releases each year with specific promotional support for each release. In 2017, we plan to spend approximately 2.9% of our revenues on advertising compared to 2.7% of revenues in 2016.
Store Development: We opened four new stores and closed two stores in 2016. We plan to open seven or eight new stores during 2017. As of September 19, 2016, approximately 83% of our stores are located along interstate highways. Our remaining stores are located off-interstate or near tourist destinations. We believe we should pursue development of both interstate locations and off-interstate locations to capitalize on the strength of our brand associated with travelers on the interstate highway system and by locating in certain local markets where our guests live and work, including locations outside of our existing core markets and in states where we currently do not operate.
Of the 640 stores open as of September 19, 2016, we own the land and buildings for 416, while the other 224 properties are either ground leases or ground and building leases. Building, site improvement, furniture, equipment and related development costs for stores opened during 2016 averaged $3,587. Pre-opening costs averaged $494 per store in 2016.
Our current store prototype is approximately 9,000 square feet, including approximately 2,100 square feet
of retail selling space, and has dining room seating for 180 guests. Our capital investment in new stores may differ in the future due to changes in our store prototype, building design specifications, site location and site characteristics.
Holler & Dash
In 2016, the Company launched its new fast casual concept, Holler & Dash Biscuit HouseTM. The concept offers biscuit-inspired entrées and a unique portfolio of alcoholic and non-alcoholic beverage options. At both July 29, 2016 and September 19, 2016, two Holler & Dash locations were open - both leased properties in Alabama. The new concept is a smaller footprint and has operating hours limited to the breakfast and lunch day parts.
EMPLOYEES
As of July 29, 2016, we employed approximately 73,000 people, of whom 501 were in advisory and supervisory capacities, 3,733 were in-store management positions and 37 were officers. Many store personnel are employed on a part-time basis. None of our employees is represented by any union, and management considers its employee relations to be good.
10
COMPETITION
The restaurant and retail industries are intensely competitive with respect to the type and quality of food, retail merchandise, price, service, location, personnel, concept, attractiveness of facilities and effectiveness of advertising and marketing. We compete with a significant number of national and regional restaurant and retail chains, some of which have greater resources than us, as well as locally owned restaurants and retail stores. We also face
entrées and side dishes from the deli section; fast casual restaurants; quick-service restaurants; and highly promotional casual and family dining restaurants. We expect competition to continue in all of these areas, which could cause consumers to choose less expensive alternatives. The restaurant and retail businesses are also often affected by changes in consumer taste and preference; national, regional or local economic conditions; demographic trends; traffic and weather patterns; the type, number and location of competing restaurants and retailers; and con . In addition, factors such as inflation, increased food, labor and benefits costs and the lack of experienced management and hourly employees may adversely affect the restaurant and retail industries in general and our stores in particular. We believe we compete effectively and have successfully differentiated ourselves from many of our competitors in the restaurant and retail industries through a unique brand and guest experience, which offers a diversified full service menu and a large variety of nostalgic and unique retail items. For further information regarding competition, see Item 1A. Risk Factors. RAW MATERIALS SOURCES AND AVAILABILITY
Essential restaurant supplies and raw materials are generally available from several sources. Generally, we are not dependent upon single sources of supplies or raw materials. However, in our stores, certain branded items are single source products or product lines. Our ability to maintain consistent quality throughout our store system depends in part upon our ability to acquire food products and related items from reliable sources. When the supply of certain products is uncertain or prices are expected to rise significantly, we may enter into purchase contracts or purchase bulk quantities for future use.
Adequate alternative sources of supply, as well as the ability to adjust menus if needed, are believed to exist for substantially all of our restaurant products. Our retail supply chain generally involves longer lead-times and, often,
ina, and most of our retail product is distributed to our stores through a single distribution center. Although disruption of our retail supply chain could be difficult to overcome, we continuously evaluate the potential for disruptions and ways to mitigate such disruptions should they occur. ENVIRONMENTAL MATTERS
Federal, state and local environmental laws and regulations have not historically had a significant impact on our operations; however, we cannot predict the effect of possible future environmental legislation or regulations on our operations. TRADEMARKS
We deem the various Cracker Barrel trademarks and service marks that we own to be of substantial value. Our policy is to obtain federal registration of trademarks and other intellectual property whenever possible and to pursue vigorously any infringement of our trademarks and service marks. RESEARCH AND DEVELOPMENT
While research and development is important to us, these expenditures have not been material due to the nature of the restaurant and retail industries.
11
SEASONAL ASPECTS
Historically, our revenue and profits have been lower in the first and third fiscal quarters and higher in the second and fourth fiscal quarters. We attribute these variations primarily to the Christmas holiday shopping season and the summer vacation and travel season. Our gift shop sales, which are made substantially to our restaurant guests, historically have been highest in our second quarter, which includes the Christmas holiday shopping season. Historically, interstate tourist traffic and the propensity to dine out have been much higher during the summer months, thereby generally contributing to higher profits quarter. We also generally open additional new stores throughout the year. Therefore, the results of operations for any interim period cannot be considered indicative of the operating results for an entire year. WORKING CAPITAL
In the restaurant industry, substantially all sales are either for cash or third-party credit card. Therefore, like many restaurant companies, we are able to, and often do operate with negative working capital. Restaurant inventories purchased through our principal food distributor are on terms of net zero days, while other restaurant inventories purchased locally generally are financed through trade credit at terms of 30 days or less. Because of our gift shop, which has a lower product turnover than the restaurant, we carry larger inventories than many other companies in the restaurant industry. Retail inventories are generally financed through trade credit at terms of 60 days or less. These various trade terms are aided by rapid product turnover of the restaurant inventory. Employees generally are paid on weekly or semi-monthly schedules in arrears of hours worked except for bonuses that are paid either quarterly or annually in arrears. Many other operating expenses have normal trade terms and certain expenses, such as certain taxes and some benefits, are deferred for longer periods of time. ITEM 1A. RISK FACTORS
Investing in our securities involves a degree of risk. Persons buying our securities should carefully consider the risks described below and the other information contained in this Annual Report on Form 10-K and other filings that we make from time to time with the SEC, including our consolidated financial statements and accompanying notes. If any of the following risks actually occurs, our business, financial condition, results of operations or cash flows could be materially adversely affected. In any such case, the trading price of our securities could decline and you could lose all or part of your investment. General economic, business and societal conditions as well as those specific to the restaurant or retail industries that are largely out of our control may adversely affect our business, financial condition and results of operations.
Our business results depend on a number of industry-specific and general economic factors, many of which are beyond our control. These factors include consumer income, interest rates, inflation, consumer credit availability, consumer debt levels, tax rates and policy, unemployment trends and other matters that influence consumer confidence and spending. The full-service dining sector of the restaurant industry and the retail industry are affected by changes in national, regional and local economic conditions, seasonal fluctuation of sales volumes, consumer preferences, including changes in consumer tastes and dietary habits and the level of consumer acceptance of our restaurant concept and retail merchandise, and consumer spending patterns.
Discretionary consumer spending, which is critical to our success, is influenced by general economic conditions and the availability of discretionary income. Global economic factors and a weak economic recovery have posable income. A deterioration in the economy or other economic conditions affecting disposable consumer income, such as unemployment levels, reduced home values, investment losses, inflation, business conditions, fuel and other energy costs, consumer debt levels, lack of available credit, consumer confidence, interest rates, tax rates and changes in tax laws, may adversely affect our business by reducing overall consumer spending or by causing customers to reduce the frequency with which they shop and dine out or to shift their spending to our competitors or to products sold by us that are less profitable than other product choices, all of which could result in lower revenues, decreases in inventory turnover, greater markdowns on inventory, and a reduction in profitability due to lower margins.
12
In addition, many of the factors discussed above, along with the current economic environment and the related impact on available credit, may affect us and our suppliers and other business partners, landlords, and customers in an adverse manner, including, but not limited to, reducing access to liquid funds or credit (including through the loss of one or more financial institutions that are a part of our revolving credit facility), increasing the cost of credit, limiting our ability to manage interest rate risk, increasing the risk of bankruptcy of our suppliers, landlords or counterparties to or other financial institutions involved in our revolving credit facility and our derivative and other contracts, increasing the cost of goods to us, and other adverse consequences which we are unable to fully anticipate.
We also cannot predict the effects of actual or threatened armed conflicts or terrorist attacks, efforts to combat terrorism, military action against any foreign state or group located in a foreign state or heightened security requirements on the economy or consumer confidence in the United States. Any of these events could also affect consumer sentiment and confidence that in turn affect consumer spending patterns or result in increased costs for us due to security measures.
Unfavorable changes in the factors described above or in other business and economic conditions affecting our customers could increase our costs, reduce traffic in some or all of our locations or impose practical limits on pricing, any of which could lower our profit margins and have a material adverse effect on our financial condition and results of operations.
There can be no assurance that the economic conditions that have adversely affected the restaurant and
retail industries, and the capital, credit and real estate markets generally or us in particular will remain static in 2017, or thereafter, in which case we could experience declines in revenues and profits, and could face capital and liquidity constraints or other business challenges. We face intense competition, and if we are unable to continue to compete effectively, our business, financial condition and results of operations would be adversely affected.
The restaurant and retail industries are intensely competitive, and we face many well-established competitors. We compete within each market with national and regional restaurant and retail chains and locally-owned restaurants and retailers. Competition from other regional or national restaurant and retail chains typically represents the more important competitive influence, principally because of their significant marketing and financial resources. We also face competition as a result of the convergence of grocery, deli, retail and restaurant services, particularly in the supermarket industry. Moreover, our competitors can harm our business even if they are not successful in their own operations by taking away customers or employees through aggressive and costly advertising, promotions or hiring practices. We compete primarily on the quality, variety and perceived value of menu and retail items. The number and location of stores, the growth of e-commerce, type of concept, quality and efficiency of service, attractiveness of facilities and effectiveness of advertising and marketing programs also are important factors. We anticipate that intense competition will continue with respect to all of these factors. We also compete with other restaurant chains and other retail businesses for quality site locations, management and hourly employees, and competitive pressures could affect both the availability and cost of these important resources. If we are unable to continue to compete effectively, our business, financial condition and results of operations would be adversely affected.
13
The price and availability of food, ingredients, retail merchandise and utilities used by our stores could adversely affect our revenues and results of operations.
We are subject to the general risks of inflation, and our operating profit margins and results of operations depend significantly on our ability to anticipate and react to changes in the price, quality and availability of food and other commodities, ingredients, retail merchandise, utilities and other related costs over which we have limited control. Fluctuations in economic conditions, weather, demand and other factors affect the availability, quality and cost of the ingredients and products that we buy. Some climatologists predict that the long-term effects of climate change may result in more severe, volatile weather, which could result in greater volatility in product supply and price. Furthermore, many of the products that we use and their costs are interrelated. Changes in global demand for corn, wheat and dairy products could cause volatility in the feed costs for poultry and livestock. The effect of, introduction of, or changes to tariffs or exchange rates on imported retail products or food products could increase our costs and possibly affect the supply of those products. In addition, food safety concerns, widespread outbreaks of livestock and poultry diseases, such as, among other things, the Avian Flu, and product recalls, all of which are out of our control, and, in many instances, unpredictable, could also increase our costs and possibly affect the supply of livestock and poultry products. Our operating margins are also affected, whether as a result of general inflation or otherwise, by fluctuations in the price of utilities such as natural gas and electricity, on which our locations depend for much of their energy supply. Our inability to anticipate and respond effectively to one or more adverse changes in any of these factors could have a significant adverse effect on our results of operations. In addition, because we provide a moderately-priced product, we may not seek to or be able to pass along price increases to our customers sufficient to completely offset cost increases. Our plans depend significantly on our strategic priorities and business initiatives designed to enhance our menu and retail offerings, support our brand, improve operating margins and improve the efficiencies and effectiveness of our operations. Failure to achieve or sustain these plans could adversely affect our results of operations.
We have had, and expect to continue to have, priorities and initiatives in various stages of testing, evaluation and implementation, upon which we expect to rely to improve our results of operations and financial condition. These priorities and initiatives include, but are not limited to, tiered menu pricing, evolving our marketing messaging to support the brand, improving the quality and breadth of retail assortments, re-engineering store processes to reduce costs and improve store margins, applying technology to improve the employee and guest experience, expanding our store footprint, focusing on our new fast casual concept, and extending the brand beyond our existing stores, including initiatives to sell licensed products through grocery and other retail channels and through evaluating strategic transactions such as joint ventures and acquisitions. It is possible that our focus on these priorities and initiatives and constantly changing consumer preferences could cause unintended changes to our current results of operations. Additionally, many of these initiatives are inherently risky and uncertain in their application to our business in general, even when tested successfully on a more limited scale. It is possible that successful testing can result partially from resources and attention that cannot be duplicated in broader implementation. Testing and general implementation also can be affected by other risk factors described herein that reduce the results expected. Successful system-wide implementation across hundreds of stores and involving tens of thousands of employees relies on consistency of training, stability of workforce, ease of execution and the absence of offsetting factors that can adversely influence results. Failure to achieve successful implementation of our initiatives could adversely affect our results of operations. We are dependent upon attracting and retaining qualified employees while also controlling labor costs.
Our performance is dependent on attracting and retaining a large and growing number of qualified store employees. Availability of staff varies widely from location to location. Many staff members are in entry-level or part-time positions, typically with high rates of turnover. Even though recent trends in employee turnover have been favorable, if store management and staff turnover were to increase, we could suffer higher direct costs associated with recruiting, training and retaining replacement personnel. Management turnover as well as general shortages in the labor pool can cause our stores to be operated with reduced staff, which negatively affects our ability to provide appropriate service levels to our customers. Competition for qualified employees exerts upward pressure on wages paid to attract such personnel, resulting in higher labor costs, together with greater recruiting and training expenses.
14
Our ability to meet our labor needs while controlling our costs is subject to external factors such as unemployment levels, minimum wage legislation, health care legislation, payroll taxes and changing demographics. Many of our employees are hourly workers whose wages are affected by increases in the federal or state minimum wage or changes to tip credits. Tip credits are the amounts an employer is permitted to assume an employee receives in tips when wage compliance purposes. Increases in minimum wage levels and changes to the tip credit have been made and continue to be proposed at both federal and state levels. As minimum wage rates increase, we may need to increase not only the wages of our minimum wage employees but also the wages paid to employees at wage rates that are above minimum wage. If competitive pressures or other factors prevent us from offsetting increased labor costs by increases in prices, our profitability may decline. Our reliance on certain significant vendors, particularly for foreign-sourced retail products, subjects us to numerous risks, including possible interruptions in supply, which could adversely affect our business.
Our ability to maintain consistent quality throughout our operations depends in part upon our ability to
acquire specified food and retail products and supplies in sufficient quantities. Partly because of our size, finding qualified vendors and accessing food, retail products, supplies and certain outsourced services in a timely and efficient manner is a significant challenge that typically is more difficult with respect to goods or services sourced outside the United States. In some cases, we may have only one supplier for a product or service. Our dependence on single-source suppliers subjects us to the possible risks of shortages, interruptions and price fluctuations, and possible litigation when we change vendors because of performance issues. Global economic factors and the weak economic recovery continue to put significant pressure on suppliers, with some suppliers facing financial distress and others attempting to rebuild profitability, all of which tends to make the supply environment more expensive. If any of these vendors is unable to fulfill its obligations, or if we are unable to find replacement suppliers in the event of a supply disruption, we could encounter supply shortages and/or incur higher costs to secure adequate supplies, either of which could materially harm our business.
Additionally, we use a number of products that are or may be manufactured in a number of foreign
countries. In addition to the risk presented by the possible long lead times to source these products, our results of operations may be materially affected by risks such as:
fluctuating currency exchange rates; foreign government regulations; foreign currency exchange control regulations; import/export restrictions and product testing regulations; foreign political and economic instability; disruptions due to labor stoppages, strikes or slowdowns, or other disruptions, involving our vendors or the
transportation and handling industries; and tariffs, trade barriers and other trade restrictions by the U.S. government on products or components
shipped from foreign sources.
Possible shortages or interruptions in the supply of food items, retail merchandise and other supplies to our stores caused by inclement weather, natural disasters such as droughts, floods and earthquakes, the inability of our vendors to obtain credit in a tightened credit market or other conditions beyond our control could adversely affect the availability, quality and cost of the items we buy and the operations of our stores. Our inability to effectively manage supply chain risk could increase our costs and limit the availability of products that are critical to our store operations. If we temporarily close a store or remove popular items from a store or retail product assortment, that store may experience a significant reduction in revenue during the time affected by the shortage or thereafter as a result of our customers changing their dining and shopping habits.
15
Our risks are heightened because of our single retail distribution facility and our potential inability or failure to execute on a comprehensive business continuity plan following a major disaster at or near our corporate facility could adversely affect our business.
The majority of our retail inventory is shipped into, stored at and shipped out of a single warehouse located in Lebanon, Tennessee. All of the decorative fixtures used in our stores are shipped into, stored at and shipped out of a separate warehouse that is also located in Lebanon, Tennessee. A natural disaster affecting either of these warehouses could materially adversely affect our business. Additionally, our corporate systems and processes and support for our restaurant and retail operations are centralized on one campus in Tennessee. We have disaster recovery procedures and business continuity plans in place to address most events and back up and offsite locations for recovery of electronic and other forms of data and information. However, if we are unable to implement our disaster recovery and business continuity plans, we may experience delays in recovery of data, failure to support field operations, tardiness in required reporting and compliance and the inability to perform vital corporate functions which could adversely affect our business. Our ability to manage our retail inventory levels and changes in merchandise mix may adversely affect our business.
The long lead times required for a substantial portion of our retail merchandise and the risk of product damages or non-compliance with required specifications could affect the amount of inventory we have available for sale. Additionally, our success depends on our ability to anticipate and respond in a timely manner to changing consumer demand and preferences for merchandise. If we misjudge the market, we may overstock unpopular products and be forced to take significant markdowns, which could reduce our gross margin. Conversely, if we underestimate demand for our merchandise we may experience inventory shortages resulting in lost revenues. Any of these factors could have an adverse effect on our results of operations, cash flows from operations and our financial condition.
A material disruption in our information technology, network infrastructure and telecommunication systems could adversely affect our business and results of operations.
We rely extensively on our information technology across our operations, including, but not limited to, point of sales processing, supply chain management, retail merchandise allocation and distribution, labor productivity and expense management Our business depends significantly on the reliability and capacity of our information technology systems to process these transactions, summarize results, manage and report on our business and our supply chain. Our information technology systems are subject to damage or interruption from power outages, computer, network, cable system, Internet and telecommunications failures, computer viruses, security breaches, catastrophic events such as fires, floods, earthquakes, tornadoes, hurricanes, acts of war or terrorism, and usage errors by our employees. If our information technology and telecommunication systems are damaged or cease to function properly, we may have to make a significant investment to repair or replace them, and we could suffer loss of critical data and interruptions or delays in our operations in the interim. Any material interruption in our information technology and telecommunication systems could adversely affect our business or results of operations. Our capital structure contains substantial indebtedness, which may decrease our flexibility, increase our borrowing costs and adversely affect our liquidity. In addition, we cannot provide any guaranty of future cash dividend payments or that we will be able to actively repurchase our common stock pursuant to a share repurchase program.
Our consolidated indebtedness and our leverage ratio may have the effect, among other things, of reducing our flexibility to respond to changing business and economic conditions and increasing borrowing costs. There are various financial covenants and other restrictions in our revolving credit facility. If we fail to comply with any of these requirements, the related indebtedness (and other unrelated indebtedness) could become due and payable prior to its stated maturity. A default under our credit agreement may also significantly affect our ability
the revolving credit facility is dependent upon our compliance with these covenants and restrictions.
16
Our ability to make scheduled interest payments or to refinance our obligations with respect to indebtedness will depend on our operating and financial performance, which, in turn, is subject to prevailing economic conditions and to financial, business and other factors beyond our control. Our inability to refinance our indebtedness when necessary or to do so upon attractive terms would materially and adversely affect our liquidity and results of operations.
In recent years, we have increased the quarterly cash dividends on our common stock and, in 2015 and
2016, we also declared special dividends on our common stock. Any determination to pay cash dividends on our common stock in the future will be based primarily upon our financial condition, results of operations, business requirements and our Board of Directors conclusion that the declaration of cash dividends is in the best interest of our shareholders and is in compliance with all laws and agreements applicable to the payment of dividends. Furthermore, there can be no assurance that we will be able to actively repurchase our common stock and we may discontinue plans to repurchase common stock at any time. Our advertising is heavily dependent on billboards, which are highly regulated; and our evolving marketing strategy involves increased advertising and marketing costs that could adversely affect our results of operations.
Historically, we have relied upon billboards as our principal method of advertising. A number of states in
which we operate restrict highway signage and billboards. Because many of our stores are located on the interstate highway system, our business is highly related to highway travel. Thus, signage or billboard restrictions or loss of existing signage or billboards could adversely affect our visibility and ability to attract customers.
Additionally, as we continue to evolve our marketing strategy, we are increasingly utilizing more traditional
and higher cost methods of advertising, such as national cable television, radio and online and digital media. These types of advertising, their effects upon our revenues and, in turn, our profits, are uncertain. Additionally, if our competitors increased their spending on advertising and promotions, we could be forced to substantially increase our advertising, media or marketing expenses. If we did so or if our current advertising and promotion programs become less effective, we could experience a material adverse effect on our results of operations.
A privacy breach could adversely affect our business.
The protection of customer, employee and company data is critical to us. We are subject to laws relating to information security, privacy, cashless payments, consumer credit, and fraud. Additionally, an increasing number of government and industry groups have established laws and standards for the protection of personal and health information. The regulatory environment surrounding information security and privacy is increasingly demanding, with the frequent imposition of new and constantly changing requirements. Compliance with these requirements may result in cost increases due to necessary system changes and the development of new administrative processes. In addition, customers and employees have a high expectation that we will adequately protect their personal information. For example, in connection with credit and debit card sales, we transmit confidential card information. Third parties may have the technology or know-how to breach the security of this customer information, and our security measures and those of our technology vendors may not effectively prohibit others from obtaining improper access to this information. If we fail to comply with the laws and regulations regarding privacy and security or experience a security breach, we could be exposed to risks of data loss, fines, a loss of the ability to process credit and debit card payments, litigation and serious disruption of our operations. Additionally, any resulting negative publicity could significantly harm our reputation.
17
If we fail to execute our business strategy, which includes our ability to find new store locations and open new stores that are profitable, our business could suffer.
One of the means of achieving our growth objectives is opening and operating new and profitable stores. This strategy involves numerous risks, and we may not be able to open all of our planned new stores and the new stores that we open may not be profitable or as profitable as our existing stores.
A significant risk in executing our business strategy is locating, securing and profitably operating an adequate supply of suitable new store sites. Competition for suitable store sites and operating personnel in our target markets is intense, and there can be no assurance that we will be able to find sufficient suitable locations, or negotiate suitable purchase or lease terms, for our planned expansion in any future period. Recently, our target markets have been expanded to include markets that are outside of our existing core markets and in states where we currently do not have existing operations, which increases the risk of executing our business strategy. The recession and current economic conditions have reduced commercial development activity and limited the availability of attractive sites for new stores. New stores typically experience an adjustment period before sales levels and operating margins normalize, and even sales at successful newly-opened stores generally do not make a significant contribution to profitability in their initial months of operation. Our ability to open and operate new stores successfully also depends on numerous other factors, some of which are beyond our control, including, among other items discussed in other risk factors, the following: our ability to control construction and development costs of new stores; our ability to manage the local, state or other regulatory approvals and permits, zoning and licensing processes in a timely manner; our ability to appropriately train employees and staff the stores; consumer acceptance of our stores in new markets; our ability to manage construction delays related to the opening of a new store. Delays or failures in opening new stores, or achieving lower than expected sales in new stores, or drawing a greater than expected proportion of sales in new stores from existing stores, could materially adversely affect our business strategy and could have an adverse effect on our business and results of operations. Our business is somewhat seasonal and also can be affected by extreme weather conditions and natural disasters.
Historically, our highest sales and profits have occurred during the second and fourth quarters, which include the Christmas holiday shopping season and the summer vacation and travel season. Retail sales historically have been seasonally higher between Thanksgiving and Christmas. Therefore, the results of operations for any quarter or period of less than one year cannot be considered indicative of the operating results for an entire year.
Additionally, extreme weather conditions in the areas where our stores are located can adversely affect our
business. For example, frequent or unusually heavy snowfall, ice storms, rain storms, floods, droughts or other extreme weather conditions over a prolonged period could make it difficult for our customers to travel to our stores and can disrupt deliveries of food and supplies to our stores and thereby reduce our sales and profitability. Our business is also susceptible to unseasonable weather conditions. For example, extended periods of unseasonably warm temperatures during the winter season or cool weather during the summer season could render a portion of our retail inventory incompatible with those unseasonable conditions. Reduced sales from extreme or prolonged unseasonable weather conditions could adversely affect our business. These risks may be exacerbated in the future as some climatologists predict that the long-term effects of climate change may result in more severe, volatile weather.
In addition, natural disasters such as hurricanes, tornadoes and earthquakes, or a combination of these or other factors, could severely damage or destroy one or more of our stores, warehouses or suppliers located in the affected areas, thereby disrupting our business operations for a more extended period of time.
18
We outsource certain business processes to third-party vendors that subject us to risks, including disruptions in business and increased costs; our use of third party technologies has increased and if we are unable to maintain our rights to these technologies our business may be harmed.
Some of our business processes are currently outsourced to third parties. Such processes include
distribution of food and retail products to our store locations, credit and debit card authorization and processing, gift card tracking and authorization, employee payroll card services, insurance claims processing, wage and related tax credit documentation and approval, guest satisfaction survey programs, employee engagement surveys and externally hosted business software applications. We cannot ensure that all providers of outsourced services are observing proper internal control practices, such as redundant processing facilities, and there are no guarantees that failures will not occur. Failure of third parties to provide adequate services could have an adverse effect on our financial condition and results of operations.
We rely on certain technology licensed from third parties and may be required to license additional
technology in the future for use in managing our Internet sites and providing services to our guests and employees. These third-party technology licenses may not continue to be available to us on acceptable terms or at all. The inability to enter into and maintain these technology licenses could adversely affect our business. Health concerns, government regulation relating to the consumption of food products and widespread infectious diseases could affect consumer preferences and could negatively affect our results of operations.
The sale of food and prepared food products for human consumption involves the risk of injury to our customers. Such injuries may result from tampering by unauthorized third parties, product contamination or spoilage, including the presence of foreign objects, substances, chemicals, other agents, or residues introduced during the growing, storage, handling and transportation phases. Additionally, many of the food items on our menu contain beef and chicken. The preferences of our customers toward beef and chicken could be affected by health concerns about the consumption of beef or chicken or health concerns and publicity concerning food quality, illness and injury generally. In recent years there has been publicity concerning E. coli bacteria,
-and- salmonella, the bird/Avian Flu, peanut and other food allergens, and other public health concerns affecting the food supply, including beef, chicken, pork, dairy and eggs. In addition, if a regional or global health pandemic occurs, depending upon its location, duration and severity, our business could be severely affected. In the event a health pandemic occurs, customers might avoid public places, and local, regional or national governments might limit or ban public gatherings to halt or delay the spread of disease. A regional or global health pandemic might also adversely affect our business by disrupting or delaying production and delivery of materials and products in our supply chain and by causing staffing shortages in our stores. In addition, government regulations or the likelihood of government regulation could increase the costs of obtaining or preparing food products. A decrease in guest traffic to our stores, a change in our mix of products sold or an increase in costs as a result of these health concerns either in general or specific to our operations, could result in a decrease in sales or higher costs to our stores that would materially harm our business. Unfavorable publicity could harm our business. In addition, our failure to recognize, respond to and effectively manage the impact of social media could materially impact our business.
Multi-unit businesses such as ours can be adversely affected by publicity resulting from complaints or litigation alleging poor food quality, poor service, food-borne illness, product defects, personal injury, adverse health effects (including obesity) or other concerns stemming from one or a limited number of our stores. Even when the allegations or complaints are not valid, unfavorable publicity relating to a limited number of our stores, or only to a single store, could adversely affect public perception of the entire brand. Additionally, negative publicity from online social network postings may also result from actual or alleged incidents taking place in our stores. Adverse publicity and its effect on overall consumer perceptions of food safety or customer service could have a material adverse effect on our business, financial condition and results of operations.
19
Individual store locations are affected by local conditions that could change and adversely affect the carrying value of those locations.
The success of our business depends on the success of individual locations, which in turn depends on stability of or improvements in operating conditions at and around those locations. Our revenues and expenses can be affected significantly by the number and timing of the opening of new stores and the closing, relocating and remodeling of existing stores. We incur substantial pre-opening expenses each time we open a new store and other expenses when we close, relocate or remodel existing stores. The expenses of opening, closing, relocating or remodeling any of our stores may be higher than anticipated. An increase in such expenses could have an adverse effect on our results of operations. Also, as demographic and economic patterns (e.g., highway or roadway traffic patterns, concentrations of general retail or hotel activity, local population densities or increased competition) change, current locations may not continue to be attractive or profitable. Possible declines in neighborhoods where our stores are located or adverse economic conditions in areas surrounding those neighborhoods could result in reduced revenues in those locations. The occurrence of one or more of these events could have a material adverse effect on our revenues and results of operations as well as the carrying value of our individual locations. Our expansion into new geographic markets may present increased risks due to our relative unfamiliarity with these markets.
Some of our new store locations may be located in areas where we have lower market presence and, as a result, less or no meaningful business experience than in our traditional, existing markets. Those new markets may have different competitive conditions, consumer tastes and discretionary spending patterns than our traditional, existing markets, which may cause our new store locations to be less successful than restaurants in our existing markets. An additional risk of expanding into new markets is the potential for lower or lacking market awareness of our brand in those areas. Stores opened in new markets may open at lower average weekly sales volumes than stores opened in existing markets and may have higher store-level operating expense ratios than in existing markets. Sales at stores opened in new markets may take longer to reach average unit volume and margins, if at all, thereby affecting our overall profitability. We are subject to a number of risks relating to federal, state and local regulation of our business, including the areas of minimum wage increases, health care reform and environmental matters, and an insufficient or ineffective response to government regulation may increase our costs and decrease our profit margins.
The restaurant industry is subject to extensive federal, state and local laws and regulations, including those relating to food safety, minimum wage and other labor issues (such as unionization), health care, menu labeling and building and zoning requirements and those relating to the preparation and sale of food as well as certain retail products. The development and operation of our stores depend to a significant extent on the selection and acquisition of suitable sites, which are subject to zoning, land use, environmental, traffic and other regulations and requirements. We are also subject to licensing and regulation by state and local authorities relating to health, sanitation, safety and fire standards, federal and state laws governing our relationships with employees (including the Fair Labor Standards Act of 1938, the Immigration Reform and Control Act of 1986, the Patient Protection and Affordable Care Act, the Health Care and Education Reconciliation Act of 2010 and applicable requirements concerning minimum wage, overtime, healthcare coverage, family leave, medical privacy, tip credits, working conditions, safety standards and immigration status), federal and state laws which prohibit discrimination and other laws regulating the design and operation of facilities, such as the Americans With Disabilities Act of 1990. In addition, we are subject to a variety of federal, state and local laws and regulations relating to the use, storage, discharge, emission and disposal of hazardous materials. We also face risks from new and changing laws and regulations relating to gift cards, nutritional content, nutritional labeling, product safety and menu labeling. Compliance with these laws and regulations can be costly and can increase our exposure to litigation or governmental investigations or proceedings.
Increases in state or federal minimum wage rates, including recent proposals to increase state or federal minimum wage rates and index future increases to inflation, or other changes in these laws could increase our labor costs. Our ability to respond to minimum wage increases by increasing menu prices will depend on the responses of our competitors and customers. Our distributors and suppliers also may be affected by higher minimum wage and benefit standards and tracking costs, which could result in higher costs for goods and services supplied to us.
20
The Patient Protection and Affordable Care Act and the Health Care and Education Affordability
Reconciliation Act of 2010, was enacted in 2010 and, in June 2012, the U.S. Supreme Court upheld the constitutionality of the law except for certain parts related to the expansion of Medicaid. Although we cannot predict with certainty the financial and operational impacts the law will have on us, such changes could affect our business, financial condition and results of operations. The law requires restaurant companies such as ours to disclose calorie information on their menus. We do not expect to incur any material costs from compliance with this provision of the law, but cannot anticipate the changes in guest behavior that could result from the implementation of this provision, which could have an adverse effect on our sales or results of operations.
There also has been increasing focus by U.S. and foreign governmental authorities on environmental matters, such as climate change, the reduction of greenhouse gases and water consumption. This increased focus may lead to new initiatives directed at regulating an as yet unspecified array of environmental matters,
carbon emissions. Legislative, regulatory or other efforts to combat climate change or other environmental concerns could result in future increases in taxes, the cost of raw materials, transportation and utilities, which could decrease our operating profits and necessitate future investments in facilities and equipment.
The impact of current laws and regulations, the effect of future changes in laws or regulations that impose additional requirements and the consequences of litigation relating to current or future laws and regulations could increase our compliance and other costs of doing business and therefore have an adverse effect on our results of operations. Failure to comply with the laws and regulatory requirements of federal, state and local authorities could result in, among other things, revocation of required licenses, administrative enforcement actions, fines and civil and criminal liability. Compliance with these laws and regulations can be costly and can increase our exposure to litigation or governmental investigations or proceedings. Also, the failure to obtain and maintain required licenses, permits and approvals could adversely affect our operating results. Typically, licenses must be renewed annually and may be revoked, suspended or denied renewal for cause at any time if governmental authorities determine that our conduct violates applicable regulations, which could adversely affect our business and results of operations. Failure to maximize or to successfully assert our intellectual property rights could adversely affect our business and results of operations.
We rely on trademark, trade secret and copyright laws to protect our intellectual property rights. We cannot guarantee that these intellectual property rights will be maximized or that they can be successfully asserted. There is a risk that we will not be able to obtain and perfect our own, or, where appropriate, license intellectual property rights necessary to support new product introductions or other brand extensions. We cannot be sure that these rights, if obtained, will not be invalidated, circumvented or challenged in the future. Our failure to perfect or successfully assert our intellectual property rights could make us less competitive and could have an adverse effect on our business and results of operations. Litigation may adversely affect our business, financial condition and results of operations.
Our business is subject to the risk of litigation by employees, guests, suppliers, shareholders, governmental agencies, competitors or others through private actions, class actions, administrative proceedings, regulatory actions or other litigation. These actions and proceedings may involve allegations of illegal, unfair or inconsistent employment practices, including wage and hour violations and employment discrimination; guest discrimination; food safety issues, including poor food quality, food-borne illness, food tampering, food contamination, and adverse health effects from consumption of various food products or high-calorie foods (including obesity); other personal injury; trademark and patent infringement; violation of the federal securities laws; or other concerns. The outcome of litigation, particularly class action lawsuits and regulatory actions, is difficult to assess or quantify. Plaintiffs in these types of lawsuits may seek recovery of very large or indeterminate amounts and the magnitude of the potential loss relating to such lawsuits may remain unknown for substantial periods of time. The cost to defend future litigation may be significant. There may also be adverse publicity associated with litigation that could decrease guest or consumer acceptance of our brand, regardless of whether the allegations are valid or we ultimately are found liable. Litigation could adversely impact our operations and our ability to expand our brand in other ways as well. As a result, litigation may adversely affect our business, financial condition and results of operations.
21
The loss of key executives or difficulties in recruiting and retaining qualified personnel could jeopardize our future growth and success.
We have assembled a senior management team which has substantial background and experience in the restaurant and retail industries. Our future growth and success depends substantially on the contributions and abilities of our senior management and other key personnel, and we design our compensation programs to attract and retain key personnel and facilitate our ability to develop effective succession plans. If we fail to attract or retain senior management or other key personnel, our succession planning and operations could be materially and adversely affected. We must continue to recruit, retain and motivate management and other employees sufficiently to maintain our current business and support our projected growth. A loss of key employees or a significant shortage of high quality store employees could jeopardize our ability to meet our business goals. Our current insurance programs may expose us to unexpected costs, which could have a material adverse effect on our financial condition and results of operations.
Our insurance coverage is structured to include deductibles, self-insured retentions, limits of liability, stop loss limits and similar provisions that we believe prudent based on our operations. However, there are types of losses we may incur against which we cannot be insured or which we believe are not economically reasonable to insure, such as losses due to acts of terrorism and some natural disasters, including floods. If we incur such losses, our business could suffer. In addition, we self-insure a significant portion of expected losses under our
actuarial assumptions and management estimates underlying our reserves for these losses, including unexpected increases in medical and indemnity costs, could result in materially different amounts of expense than expected under these programs. Our annual and quarterly operating results may fluctuate significantly and could fall below the expectations of investors and securities analysts due to a number of factors, some of which are beyond our control, resulting either in volatility or a decline in the price of our securities.
Our business is not static it changes periodically as a result of many factors, including, among other items discussed in other risk factors, the following: increases and decreases in average weekly sales, restaurant and retail sales and restaurant profitability; the rate at which we open new stores, the timing of new store openings and the related high initial operating
costs; changes in advertising and promotional activities and expansion into new markets; and impairment of long-lived assets and any loss on store closures.
Our quarterly operating results and restaurant and retail sales may fluctuate as a result of any of these or
other factors. Accordingly, results for any one quarter are not necessarily indicative of results to be expected for any other quarter or for any year, and restaurant and retail sales for any particular future period may decrease. In the future, operating results may fall below the expectations of securities analysts and investors. In such event, the price of our securities could fluctuate dramatically over time or could decrease generally.
22
Failure of our internal control over financial reporting could adversely affect our business and financial results.
Our management is responsible for establishing and maintaining effective internal control over financial reporting. Internal control over financial reporting is a process to provide reasonable assurance regarding the reliability of financial reporting for external purposes in accordance with the United States generally accepted
GAAP . Because of its inherent limitations, internal control over financial reporting is not intended to provide absolute assurance that we would prevent or detect a misstatement of our financial statements or fraud. Any failure to maintain an effective system of internal control over financial reporting could limit our ability to report our financial results accurately and timely or to detect and prevent fraud. The identification of a material weakness could indicate a lack of controls adequate to generate accurate financial statements that, in turn, could cause a loss of investor confidence and decline in the market price of our common stock. We cannot assure you that we will be able to timely remediate any material weaknesses that may be identified in future periods or maintain all of the controls necessary for continued compliance. Likewise, we cannot assure you that we will be able to retain sufficient skilled finance and accounting personnel, especially in light of the increased demand for such personnel among publicly traded companies. Our reported results can be affected adversely and unexpectedly by the implementation of new, or changes in the interpretation of existing, accounting principles or financial reporting requirements.
Our financial reporting complies with GAAP, and GAAP is subject to change over time. If new rules or interpretations of existing rules require us to change our financial reporting (including the upcoming lease accounting changes and the proposed adoption of international financial reporting standards in the United States), our reported results of operations and financial condition could be affected substantially, including requirements to restate historical financial reporting. Our business could be negatively affected as a result of actions of activist shareholders.
The Lion Fund II, L.P., an affiliate of , the owner of Steak N Shake and Western is currently the beneficial owner of approximately 19.7% of our outstanding common stock.
In the past, BH and its affiliates have nominated candidates for election to our board of directors at our annual meetings of shareholders, resulting in proxy contests, and called publicly for special meetings of shareholders to consider other proposals. While BH and its affiliates have not nominated director candidates for election at our 2016 Annual Meeting of Shareholders, the actions of BH and its affiliates or another activist shareholder in the future could adversely affect our business because: responding to public proposals, special meeting requests and other actions by activist shareholders can
disrupt our operations, be costly and time-consuming, and divert the attention of our management and employees;
perceived uncertainties as to our future direction may result in the loss of potential business opportunities, and may make it more difficult to attract and retain qualified personnel and business partners; and
pursuit of agenda may adversely affect our ability to effectively implement our business strategy and create additional value for our shareholders.
Provisions in our charter, Tennessee law and our shareholder rights plan may discourage potential acquirers of the Company.
Our charter documents contain provisions that may have the effect of making it more difficult for a third party to acquire or attempt to acquire control of the Company. In addition, we are subject to certain provisions of Tennessee law that limit, in some cases, our ability to engage in certain business combinations with significant shareholders. In addition, we have adopted a shareholder rights plan, which provides, among other things, that when specified events occur, our shareholders will be entitled to purchase from us shares of junior preferred stock. The shareholder rights plan will expire on April 9, 2018. The preferred stock purchase rights are triggered ten days after the date of a public announcement that a person or group acting in concert has acquired, or obtained the right to acquire, beneficial ownership of 20% or more of our outstanding common stock. The preferred stock purchase rights would cause dilution to a person or group that attempts to acquire the Company on terms that do not satisfy the requirements of a qualifying offer under the shareholder rights plan or are otherwise not approved by our Board of Directors.
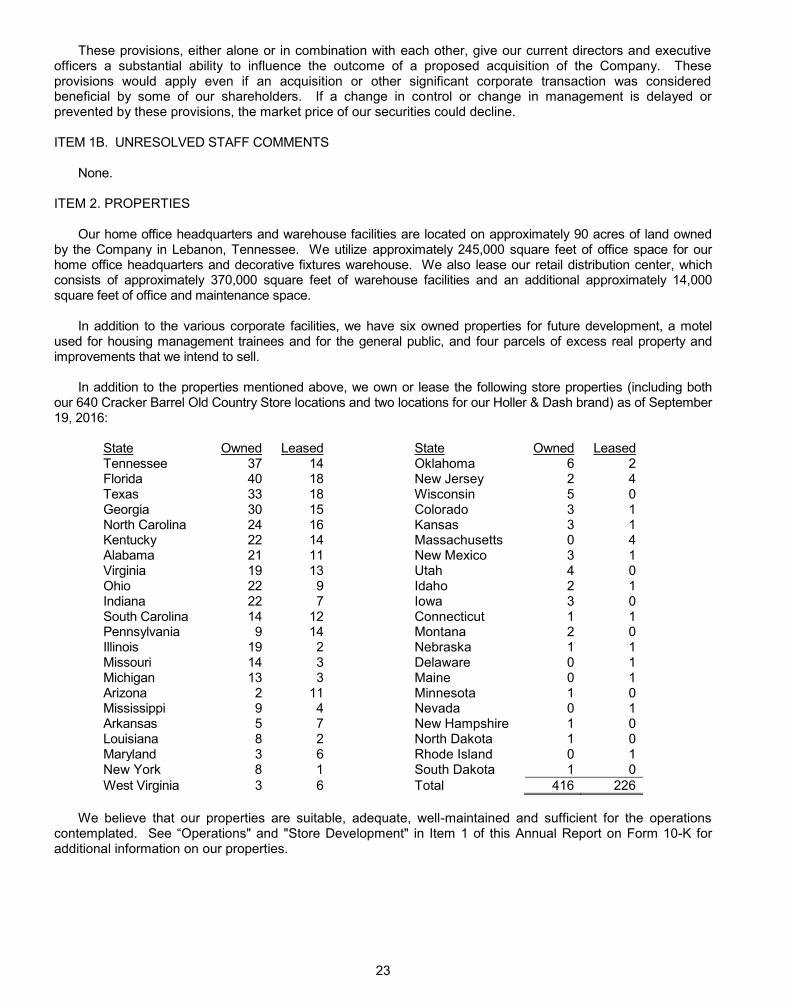
23
These provisions, either alone or in combination with each other, give our current directors and executive officers a substantial ability to influence the outcome of a proposed acquisition of the Company. These provisions would apply even if an acquisition or other significant corporate transaction was considered beneficial by some of our shareholders. If a change in control or change in management is delayed or prevented by these provisions, the market price of our securities could decline. ITEM 1B. UNRESOLVED STAFF COMMENTS
None. ITEM 2. PROPERTIES
Our home office headquarters and warehouse facilities are located on approximately 90 acres of land owned by the Company in Lebanon, Tennessee. We utilize approximately 245,000 square feet of office space for our home office headquarters and decorative fixtures warehouse. We also lease our retail distribution center, which consists of approximately 370,000 square feet of warehouse facilities and an additional approximately 14,000 square feet of office and maintenance space.
In addition to the various corporate facilities, we have six owned properties for future development, a motel used for housing management trainees and for the general public, and four parcels of excess real property and improvements that we intend to sell.
In addition to the properties mentioned above, we own or lease the following store properties (including both our 640 Cracker Barrel Old Country Store locations and two locations for our Holler & Dash brand) as of September 19, 2016:
State Owned Leased State Owned Leased Tennessee 37 14 Oklahoma 6 2 Florida 40 18 New Jersey 2 4 Texas 33 18 Wisconsin 5 0 Georgia 30 15 Colorado 3 1 North Carolina 24 16 Kansas 3 1 Kentucky 22 14 Massachusetts 0 4 Alabama 21 11 New Mexico 3 1 Virginia 19 13 Utah 4 0 Ohio 22 9 Idaho 2 1 Indiana 22 7 Iowa 3 0 South Carolina 14 12 Connecticut 1 1 Pennsylvania 9 14 Montana 2 0 Illinois 19 2 Nebraska 1 1 Missouri 14 3 Delaware 0 1 Michigan 13 3 Maine 0 1 Arizona 2 11 Minnesota 1 0 Mississippi 9 4 Nevada 0 1 Arkansas 5 7 New Hampshire 1 0 Louisiana 8 2 North Dakota 1 0 Maryland 3 6 Rhode Island 0 1 New York 8 1 South Dakota 1 0 West Virginia 3 6 Total 416 226
We believe that our properties are suitable, adequate, well-maintained and sufficient for the operations contemplated. Store Development" in Item 1 of this Annual Report on Form 10-K for additional information on our properties.
24
ITEM 3. LEGAL PROCEEDINGS
The Company and its subsidiaries are party to various legal and regulatory proceedings and claims incidental to their business in the ordinary course. In the opinion of management, based upon information currently available, the ultimate liability with respect to these proceedings and claims will not materially affect the Company's consolidated results of operations or financial position.
Pursuant to Instruction 3 to Item 401(b) of Regulation S-K and General Instruction G(3) to Form 10-K, the following information is included in Part I of this Form 10-K. Executive Officers of the Registrant The following table sets forth certain information concerning our executive officers: Name Age Position with the Company Sandra B. Cochran 58 President and Chief Executive Officer Jill M. Golder 54 Senior Vice President and Chief Financial Officer Beverly K. Carmichael 57 Senior Vice President and Chief People Officer Christopher A. Ciavarra 45 Senior Vice President, Marketing Laura A. Daily 52 Senior Vice President, Retail Nicholas V. Flanagan 50 Senior Vice President, Operations Doug Couvillion 52 Vice President, Supply Chain and Quality Assurance Jeffrey M. Wilson 41 Vice President, Corporate Controller and Principal Accounting Officer Michael J. Zylstra
50
Vice President, General Counsel and Secretary
The following information summarizes the business experience of each of our executive officers for at least the
past five years:
Ms. Cochran has been employed with us since 2009 and assumed her current position as President and Chief Executive Officer in September 2011, when she also became a member of our Board of Directors. Prior to September 2011, Ms. Cochran served as our President and Chief Operating Officer since November 2010 and as our Executive Vice President and Chief Financial Officer from April 2009 to November 2010. Before joining us in April 2009, she was the Chief Executive Officer of Books-A-Million, Inc. Ms. Cochran has 23 years of experience in the retail industry and seven years of experience in the restaurant industry.
Ms. Golder has been employed with us since April 2016 and assumed the responsibilities of Senior Vice
President and Chief Financial Officer in June 2016. Prior to April 2016, she served as Executive Vice President and Chief Financial Officer of Ruby Tuesday, Inc. since June 2014, and as Senior Vice President, Finance from April 2013 to June 2014. Prior to her tenure with Ruby Tuesday, Inc., she was Chief FinWinery & Restaurants from December Ms. Golder spent 23 years at Darden Restaurants, Inc., where she held progressively more responsible positions in finance, including Senior Vice President of Finance. Ms. Golder has almost 30 years of experience in the restaurant industry.
Ms. Carmichael has been employed with us in her current capacity since January 2014. She most recently was with Frisco, Texas-based Star HR LLC, a human resource consulting firm, which she founded in 2010 and served as President. From 2009 to 2011, she served as an adjunct professor and advisor in the masters of business administration program in the Price College of Business for the University of Oklahoma. Ms. Carmichael was Executive Vice President Human Resources and Chief People Officer of Ticketmaster from 2006 to 2009. She has over 20 years of human resources leadership experience.
25
Mr. Ciavarra has been employed with us since 2008 and assumed his current position in 2010. Prior to 2010, Mr. Ciavarra served as Vice President, Brand and Menu Strategy since 2008. Before joining us in 2008, he was the Director of Marketing for Aramark Corporation from 2005 to 2008. Mr. Ciavarra has over 16 years of experience in the restaurant industry and over 11 years of experience in the retail industry.
Ms. Daily has been employed with us as Senior Vice President, Retail since May 2012. Prior to May 2012, she served as Vice President for Ballard Designs, an Internet and catalog home furnishings retailer that is part of HSN, Inc., where she was in charge of all merchandising and trends for the company. She has over 23 years of experience as a merchant with a number of retail organizations.
Mr. Flanagan has been employed with us since 2004 and assumed his current position in November 2010.
From 2004 to 2010, he served in various capacities including Vice President of Restaurant Operations. Mr. Flanagan has over 27 years of experience in the restaurant industry.
Mr. Couvillion has been employed with us since 2001 and assumed his current position in June 2015. From
2001 to 2015, he served in various capacities including Vice President, Corporate Controller and Principal Accounting Officer. Mr. Couvillion has 22 years of experience in the restaurant industry and 15 years of experience in the retail industry.
Mr. Wilson has been employed with us since 2007 and assumed his current position in June 2015. From 2007 to 2015, he served in various capacities including Vice President, Operations Analysis. Mr. Wilson has 19 years of experience in the restaurant industry and five years of experience in the retail industry.
Mr. Zylstra has been employed with us in various capacities since 1992 and assumed his current position in January 2012 after serving as Vice President, Associate General Counsel and Assistant Corporate Secretary since 1999. Mr. Zylstra has 25 years of experience in the restaurant and retail industries, all with Cracker Barrel Old Country Store, Inc.
PART II ITEM 5. MARKET FOR REGISTRANT'S COMMON EQUITY, RELATED STOCKHOLDER MATTERS AND ISSUER PURCHASES OF EQUITY SECURITIES
Our common stock is traded on the NASDAQ Global Select CBRL. There were 7,835 shareholders of record as of September 19, 2016.
The following table indicates the high and low sales prices of our common stock, as reported by Nasdaq,
and dividends declared and paid for the quarters indicated. Fiscal Year 2016 Fiscal Year 2015 Prices Dividends
Declared Dividends Prices Dividends
Declared Dividends
High Low Paid High Low Paid First $155.97 $117.95 $1.10 $4.10 $116.34 $96.50 $1.00 $1.00 Second 141.94 118.01 1.10 1.10 142.49 114.94 1.00 1.00 Third 156.65 124.80 1.10 1.10 159.94 121.89 1.00 1.00 Fourth 172.89 144.00 4.40 4.35 162.33 131.21 4.10 1.00
See Note 5 to Consolidated Financial Statements with respect to dividend restrictions.
Information 2016 Proxy Statement, incorporated by reference in Part III, Item 12 of this Annual Report on Form 10-K.
Part III, Item 12 of this Annual Report on Form 10-K is incorporated herein by this reference. Unregistered Sales of Equity Securities
There were no equity securities sold by the Company during the period covered by this Annual Report on Form 10-K that were not registered under the Securities Act of 1933, as amended.
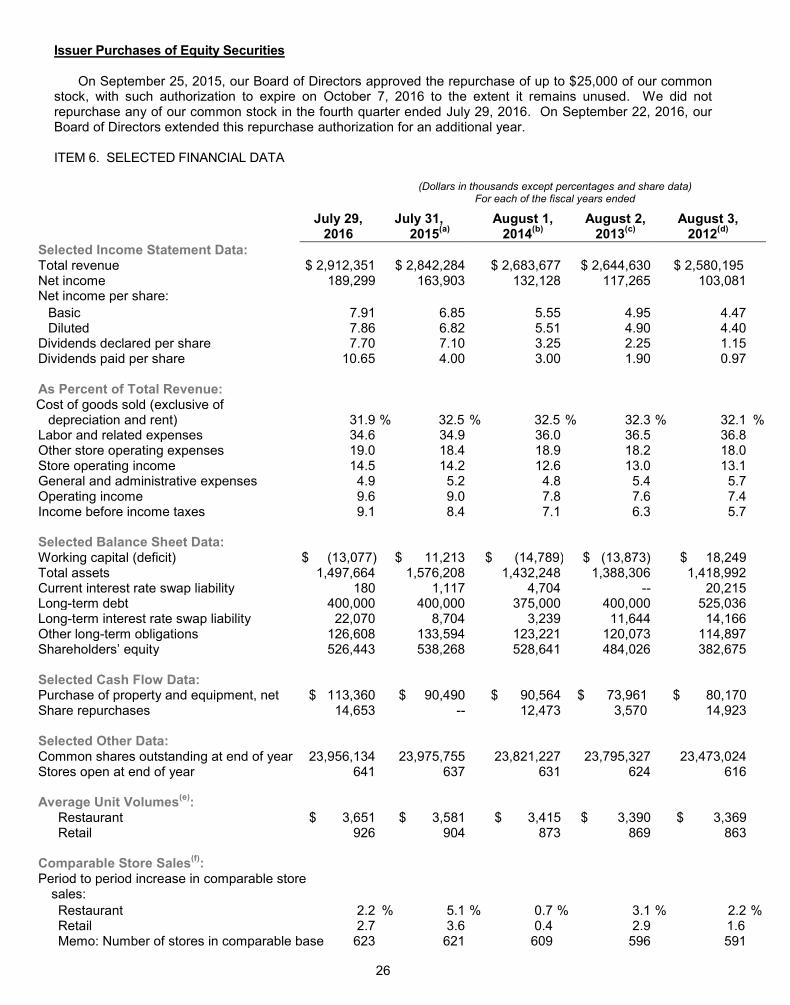
26
Issuer Purchases of Equity Securities
On September 25, 2015, our Board of Directors approved the repurchase of up to $25,000 of our common stock, with such authorization to expire on October 7, 2016 to the extent it remains unused. We did not repurchase any of our common stock in the fourth quarter ended July 29, 2016. On September 22, 2016, our Board of Directors extended this repurchase authorization for an additional year. ITEM 6. SELECTED FINANCIAL DATA
(Dollars in thousands except percentages and share data) For each of the fiscal years ended
July 29, 2016
July 31, 2015(a)
August 1, 2014(b)
August 2, 2013(c)
August 3, 2012(d)
Selected Income Statement Data: Total revenue $ 2,912,351 $ 2,842,284 $ 2,683,677 $ 2,644,630 $ 2,580,195 Net income 189,299 163,903 132,128 117,265 103,081 Net income per share:
Basic 7.91 6.85 5.55 4.95 4.47 Diluted 7.86 6.82 5.51 4.90 4.40
Dividends declared per share 7.70 7.10 3.25 2.25 1.15 Dividends paid per share 10.65 4.00 3.00 1.90 0.97
As Percent of Total Revenue: Cost of goods sold (exclusive of
depreciation and rent) 31.9
%
32.5
%
32.5
%
32.3
%
32.1
% Labor and related expenses 34.6 34.9 36.0 36.5 36.8 Other store operating expenses 19.0 18.4 18.9 18.2 18.0 Store operating income 14.5 14.2 12.6 13.0 13.1 General and administrative expenses 4.9 5.2 4.8 5.4 5.7 Operating income 9.6 9.0 7.8 7.6 7.4 Income before income taxes 9.1 8.4 7.1 6.3 5.7
Selected Balance Sheet Data: Working capital (deficit) $ (13,077) $ 11,213 $ (14,789) $ (13,873) $ 18,249 Total assets 1,497,664 1,576,208 1,432,248 1,388,306 1,418,992 Current interest rate swap liability 180 1,117 4,704 -- 20,215 Long-term debt 400,000 400,000 375,000 400,000 525,036 Long-term interest rate swap liability 22,070 8,704 3,239 11,644 14,166 Other long-term obligations 126,608 133,594 123,221 120,073 114,897
526,443 538,268 528,641 484,026 382,675
Selected Cash Flow Data: Purchase of property and equipment, net $ 113,360 $ 90,490 $ 90,564 $ 73,961 $ 80,170 Share repurchases 14,653 -- 12,473 3,570 14,923
Selected Other Data: Common shares outstanding at end of year 23,956,134 23,975,755 23,821,227 23,795,327 23,473,024 Stores open at end of year 641 637 631 624 616
Average Unit Volumes(e):
Restaurant $ 3,651 $ 3,581 $ 3,415 $ 3,390 $ 3,369 Retail 926 904 873 869 863
Comparable Store Sales(f): Period to period increase in comparable store
sales:
Restaurant 2.2 % 5.1 % 0.7 % 3.1 % 2.2 % Retail 2.7 3.6 0.4 2.9 1.6 Memo: Number of stores in comparable base 623 621 609 596 591
27
(a) We incurred approximately $3,500 in costs related to a litigation matter, which are included in general and administrative expenses. Our debt refinancing in the second quarter of fiscal 2015 resulted in additional interest expense of $412 related to the write-off of deferred financing costs.
(b) We incurred $4,313 in costs related to the November 2013 proxy contest and April 2014 special
(c) We incurred $4,111 in costs related to the November 2012 proxy contest, which are included in general and administrative expenses.
(d) Fiscal 2012 consisted of 53 weeks while all other periods presented consisted of 52 weeks. The estimated impact of the additional week was to increase consolidated fiscal 2012 results as follows: total revenue, $51,059; store operating income, 0.2% of total revenue; operating income, 0.2% of total revenue; net income, 0.2% of total revenue; and diluted net income per share, $0.27. As part of our restructuring of our field organization in April 2012, we incurred severance charges of $1,660, which are included in general and administrative expenses. We also incurred $5,203 in costs related to the December 2011 proxy contest, which are also included in general and administrative expenses.
(e) Average unit volumes include sales of all stores. Fiscal 2012 included a 53rd week while all other periods presented consisted of 52 weeks.
(f) Comparable store sales consist of sales of stores open at least six full quarters at the beginning of the year and are measured on comparable calendar weeks.
ITEM 7. MANAGEMENT'S DISCUSSION AND ANALYSIS OF FINANCIAL CONDITION AND RESULTS OF OPERATIONS
ysis of Financial Condition and Results of Operations
our consolidated results of operations and financial condition. MD&A should be read in conjunction with the Consolidated Financial Statements and notes thereto. Readers also should carefully review the information
amounts (other than per share amounts) reported or discussed in this MD&A are shown in thousands. References in MD&A to a year or quarter are to our fiscal year or quarter unless expressly noted or the context clearly indicates otherwise.
This overview summarizes the MD&A, which includes the following sections:
Executive Overview a general description of our business, the restaurant and retail industries, our key performance indicators 2016.
Results of Operations an analysis of our consolidated statements of income for the three years presented in our Consolidated Financial Statements.
Liquidity and Capital Resources an analysis of our primary sources of liquidity, capital expenditures and material commitments.
Critical Accounting Estimates a discussion of accounting policies that require critical judgments and estimates.
EXECUTIVE OVERVIEW
company that, through its operations and those of certain subsidiaries, is principally engaged in the operation Each Cracker Barrel
store consists of a restaurant with a gift shop. The restaurants serve breakfast, lunch and dinner. The gift shop area offers a variety of decorative and functional items specializing in rocking chairs, holiday gifts, toys, apparel and foods. As of September 19, 2016, the Company operated 640 Cracker Barrel stores located in 43 states.
28
Restaurant and Retail Industries
Our stores operate in both the restaurant and retail industries in the United States. The restaurant and retail industries are highly competitive with respect to quality, variety and price of the food products and retail merchandise offered. We compete with a significant number of national and regional restaurant and retail chains. Additionally, there are many segments within the restaurant industry, such as family dining, casual dining, full-service, fast casual and quick service, which often overlap and provide competition for widely diverse restaurant concepts. We operate in the full-service segment of the restaurant industry. Competition also exists in securing prime real estate locations for new stores, in hiring qualified employees, in advertising, in the attractiveness of facilities and with competitors having similar menu offerings or convenience. The restaurant and retail industries are often affected by changes in consumer taste and preference; national, regional or local economic conditions; demographic trends; traffic patterns; the type, number and location of competing restaurants and retailers etionary purchasing power.
Additionally, economic, seasonal and weather conditions affect the restaurant and retail industries. Adverse economic conditions and unemployment rates affect consumer discretionary income and dining and shopping habits. Historically, interstate tourist traffic and the propensity to dine out have been much higher during the summer months, thereby contributing to higher profits in our fourth quarter. Retail sales, which are made substantially to our restaurant guests, are strongest in the second quarter, which includes the Christmas holiday shopping season. Severe weather also affects restaurant and retail sales adversely from time to time.
Key Performance Indicators
Management uses a number of key performance measures to evaluate our operational and financial performance, including the following:
Comparable store restaurant and retail sales and restaurant guest traffic consist of sales and calculated number of guests, respectively, of stores open at least six full quarters at the beginning of the year and are measured on comparable calendar weeks. This measure excludes the impact of new store openings.
Retail conversion is the percentage of restaurant guest traffic that make a retail purchase. Management uses retail conversiooccasion.
Average check per guest is an indicator which management uses to analyze the dollars spent per guest in our stores on restaurant purchases. This measure aids management in identifying trends in guest preferences as well as the effectiveness of menu price increases and other menu changes.
Store operating margins are defined as total revenue less cost of goods sold (exclusive of depreciation and rent), labor and other related expenses and other store operating expenses, all as a percentage of total revenue. Management uses this indicator as a primary measure of operating profitability.
Company Performance in 2016
Management believes that the Cracker Barrel brand remains one of the strongest and most differentiated brands in the restaurant industry.
Our long-term strategy includes the following:
Enhancing the Ctraffic and sales in both restaurant and retail, implementing geographic pricing tiers to optimize average check and re-engineering store processes to increase operating margins;
Expanding the Footprint through continued use of our proven site selection tools, introducing a new and more efficient building and equipment prototype and the selective entry into new markets; and
Extending the Brand by building on the initial success of our licensing business, leveraging our brand strengths into a new fast casual concept and growing our retail business into an omni-channel business.
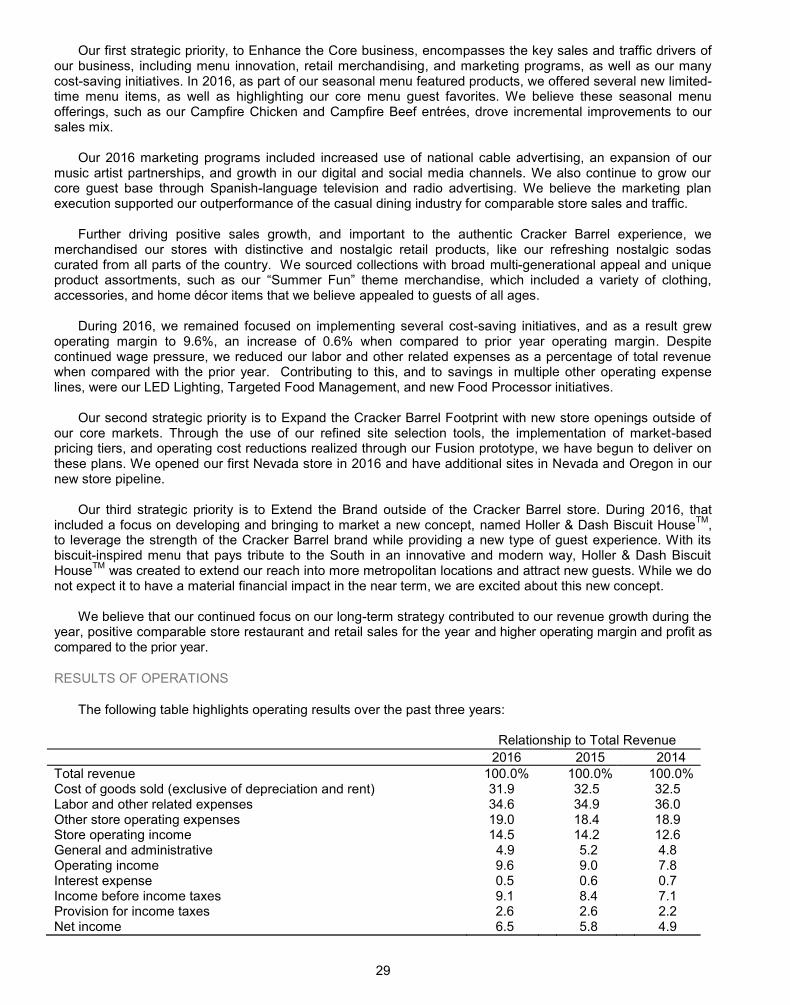
29
Our first strategic priority, to Enhance the Core business, encompasses the key sales and traffic drivers of our business, including menu innovation, retail merchandising, and marketing programs, as well as our many cost-saving initiatives. In 2016, as part of our seasonal menu featured products, we offered several new limited-time menu items, as well as highlighting our core menu guest favorites. We believe these seasonal menu offerings, such as our Campfire Chicken and Campfire Beef entrées, drove incremental improvements to our sales mix.
Our 2016 marketing programs included increased use of national cable advertising, an expansion of our music artist partnerships, and growth in our digital and social media channels. We also continue to grow our core guest base through Spanish-language television and radio advertising. We believe the marketing plan execution supported our outperformance of the casual dining industry for comparable store sales and traffic.
Further driving positive sales growth, and important to the authentic Cracker Barrel experience, we merchandised our stores with distinctive and nostalgic retail products, like our refreshing nostalgic sodas curated from all parts of the country. We sourced collections with broad multi-generational appeal and unique product assortments, such as our Summer Fun theme merchandise, which included a variety of clothing, accessories, and home décor items that we believe appealed to guests of all ages.
During 2016, we remained focused on implementing several cost-saving initiatives, and as a result grew operating margin to 9.6%, an increase of 0.6% when compared to prior year operating margin. Despite continued wage pressure, we reduced our labor and other related expenses as a percentage of total revenue when compared with the prior year. Contributing to this, and to savings in multiple other operating expense lines, were our LED Lighting, Targeted Food Management, and new Food Processor initiatives.
Our second strategic priority is to Expand the Cracker Barrel Footprint with new store openings outside of our core markets. Through the use of our refined site selection tools, the implementation of market-based pricing tiers, and operating cost reductions realized through our Fusion prototype, we have begun to deliver on these plans. We opened our first Nevada store in 2016 and have additional sites in Nevada and Oregon in our new store pipeline.
Our third strategic priority is to Extend the Brand outside of the Cracker Barrel store. During 2016, that included a focus on developing and bringing to market a new concept, named Holler & Dash Biscuit HouseTM, to leverage the strength of the Cracker Barrel brand while providing a new type of guest experience. With its biscuit-inspired menu that pays tribute to the South in an innovative and modern way, Holler & Dash Biscuit HouseTM was created to extend our reach into more metropolitan locations and attract new guests. While we do not expect it to have a material financial impact in the near term, we are excited about this new concept.
We believe that our continued focus on our long-term strategy contributed to our revenue growth during the year, positive comparable store restaurant and retail sales for the year and higher operating margin and profit as compared to the prior year.
RESULTS OF OPERATIONS
The following table highlights operating results over the past three years: Relationship to Total Revenue 2016 2015 2014 Total revenue 100.0% 100.0% 100.0% Cost of goods sold (exclusive of depreciation and rent) 31.9 32.5 32.5 Labor and other related expenses 34.6 34.9 36.0 Other store operating expenses 19.0 18.4 18.9 Store operating income 14.5 14.2 12.6 General and administrative 4.9 5.2 4.8 Operating income 9.6 9.0 7.8 Interest expense 0.5 0.6 0.7 Income before income taxes 9.1 8.4 7.1 Provision for income taxes 2.6 2.6 2.2 Net income 6.5 5.8 4.9
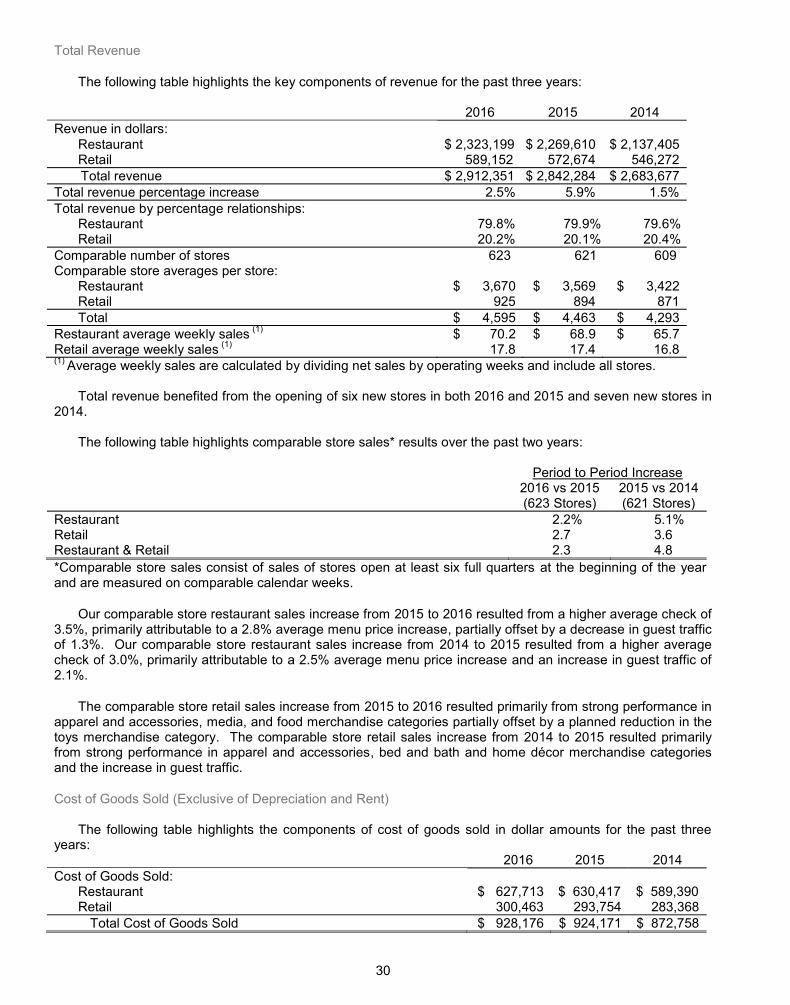
30
Total Revenue
The following table highlights the key components of revenue for the past three years:
2016 2015 2014 Revenue in dollars:
Restaurant $ 2,323,199 $ 2,269,610 $ 2,137,405 Retail 589,152 572,674 546,272
Total revenue $ 2,912,351 $ 2,842,284 $ 2,683,677 Total revenue percentage increase 2.5% 5.9% 1.5% Total revenue by percentage relationships:
Restaurant 79.8% 79.9% 79.6% Retail 20.2% 20.1% 20.4%
Comparable number of stores 623 621 609 Comparable store averages per store:
Restaurant $ 3,670 $ 3,569 $ 3,422 Retail 925 894 871 Total $ 4,595 $ 4,463 $ 4,293
Restaurant average weekly sales (1) $ 70.2 $ 68.9 $ 65.7 Retail average weekly sales (1) 17.8 17.4 16.8 (1) Average weekly sales are calculated by dividing net sales by operating weeks and include all stores.
Total revenue benefited from the opening of six new stores in both 2016 and 2015 and seven new stores in
2014. The following table highlights comparable store sales* results over the past two years:
Period to Period Increase
2016 vs 2015 2015 vs 2014 (623 Stores) (621 Stores) Restaurant 2.2% 5.1% Retail 2.7 3.6 Restaurant & Retail 2.3 4.8 *Comparable store sales consist of sales of stores open at least six full quarters at the beginning of the year and are measured on comparable calendar weeks.
Our comparable store restaurant sales increase from 2015 to 2016 resulted from a higher average check of 3.5%, primarily attributable to a 2.8% average menu price increase, partially offset by a decrease in guest traffic of 1.3%. Our comparable store restaurant sales increase from 2014 to 2015 resulted from a higher average check of 3.0%, primarily attributable to a 2.5% average menu price increase and an increase in guest traffic of 2.1%.
The comparable store retail sales increase from 2015 to 2016 resulted primarily from strong performance in apparel and accessories, media, and food merchandise categories partially offset by a planned reduction in the toys merchandise category. The comparable store retail sales increase from 2014 to 2015 resulted primarily from strong performance in apparel and accessories, bed and bath and home décor merchandise categories and the increase in guest traffic.
Cost of Goods Sold (Exclusive of Depreciation and Rent)
The following table highlights the components of cost of goods sold in dollar amounts for the past three years: 2016 2015 2014 Cost of Goods Sold:
Restaurant $ 627,713 $ 630,417 $ 589,390 Retail 300,463 293,754 283,368 Total Cost of Goods Sold $ 928,176 $ 924,171 $ 872,758
31
The following table highlights restaurant cost of goods sold as a percentage of restaurant revenue for the past three years: 2016 2015 2014
Restaurant Cost of Goods Sold 27.0% 27.8% 27.6% The decrease from 2015 to 2016 was the result of food commodity deflation of 0.4% and our menu price
increase referenced above partially offset by a shift to higher cost menu items. Higher cost menu items accounted for 0.1% in restaurant cost of goods sold as a percentage of restaurant revenue. The modest increase from 2014 to 2015 was the result of food commodity inflation of 2.7% and a shift to higher cost menu items partially offset by our menu price increase referenced above and lower food waste. Higher cost menu items and lower food waste accounted for 0.2% and 0.1%, respectively, in restaurant cost of goods sold as a percentage of restaurant revenue.
We presently expect the rate of commodity deflation to be approximately 2.0% to 3.0% in 2017 as
compared to 2016.
The following table highlights retail cost of goods sold as a percentage of retail revenue for the past three years: 2016 2015 2014
Retail Cost of Goods Sold 51.0% 51.3% 51.9% The decrease in retail cost of goods sold as a percentage of retail revenue in 2016 as compared to 2015
resulted from higher initial margin and lower freight costs partially offset by higher markdowns and an increase in the provision for obsolete inventory.
2015 to 2016
(Decrease) Increase as a Percentage of Total Revenue
Higher initial margin (0.8%) Freight (0.1%) Markdowns 0.5% Provision for obsolete inventory 0.1%
The decrease in retail cost of goods sold as a percentage of retail revenue in 2015 as compared to 2014
resulted primarily from lower markdowns and lower freight expense.
2014 to 2015 (Decrease) as a Percentage
of Total Revenue Markdowns (0.3%) Freight (0.2%)
Labor and Related Expenses
Labor and other related expenses include all direct and indirect labor and related costs incurred in store operations. The following table highlights labor and other related expenses as a percentage of total revenue for the past three years: 2016 2015 2014
Labor and other related expenses 34.6% 34.9% 36.0% The year-to-year percentage change from 2015 to 2016 resulted from the following:
2015 to 2016
(Decrease) as a Percentage of Total Revenue
Store bonus expense (0.2%) Payroll taxes (0.1%)
32
Lower store bonus expense in 2016 as compared to 2015 was driven by lower performance against financial objectives in 2016 as compared to the prior year.
The decrease in payroll tax expense as a percentage of total revenue in 2016 as compared to 2015 resulted primarily from lower unemployment tax rates.
The year-to-year percentage change from 2014 to 2015 resulted primarily from the following:
2014 to 2015 (Decrease) Increase as a
Percentage of Total Revenue Store hourly labor (0.6%) Employee health care expenses (0.3%) Store management compensation (0.3%) Payroll taxes (0.2%) Store bonus expense 0.4%
The decrease in store hourly labor costs as a percentage of total revenue from 2014 to 2015 resulted from
menu price increases being greater than wage inflation and improved productivity driven by the successful implementation of labor savings initiatives in 2015.
The decrease in our employee health care expenses as compared to the prior year resulted primarily from a reduction in premiums associated with our transition of a majority of our plans from fully insured to self-insured for the plan year ending December 31, 2015 and lower plan enrollment.
The decrease in store management compensation expense as a percentage of total revenue in 2015 as compared to 2014 resulted primarily from lower staffing levels in 2015 as compared to 2014.
The decrease in payroll tax expense as a percentage of total revenue in 2015 as compared to 2014 resulted primarily from a reduction in state unemployment tax rates.
Higher store bonus expense in 2015 as compared to 2014 was driven by better performance against financial objectives in 2015 as compared to the prior year.
Other Store Operating Expenses
Other store operating expenses include all store-level operating costs, the major components of which are utilities, operating supplies, repairs and maintenance, depreciation and amortization, advertising, rent, credit card fees, real and personal property taxes, general insurance and costs associated with our store manager conference. The following table highlights other store operating expenses as a percentage of total revenue for the past three years: 2016 2015 2014
Other store operating expenses 19.0% 18.4% 18.9%
The year-to-year percentage change from 2015 to 2016 resulted from the following:
2015 to 2016 Increase (Decrease) as a
Percentage of Total Revenue Advertising 0.3% Maintenance 0.2% Supplies 0.1% Depreciation 0.1% Store manager conference expense 0.1% Utilities (0.2%)
33
The increase in advertising expense as a percentage of total revenue for 2016 as compared to 2015 is consistent with our planned increase in advertising spend for 2016. In 2017, we plan to spend approximately 2.9% of our revenues on advertising compared to 2.7% of revenues in 2016.
Higher maintenance expense as a percentage of total revenue for 2016 as compared to 2015 resulted
primarily from expenses associated with the preventative maintenance and related repair of certain building components and kitchen equipment.
The increase in supplies expense as a percentage of total revenue for 2016 as compared to 2015 resulted
primarily from a higher volume of purchases in certain categories. The increase in depreciation expense as a percentage of total revenue for 2016 as compared to 2015
resulted from higher capital expenditures in 2016 as compared to 2015.
In the first quarter of 2016, we held a bi-annual manager conference and training event which was attended
and we expect to hold our next conference in the first quarter of 2018. The decrease in utilities expense from 2015 to 2016 resulted primarily from lower natural gas prices and
usage and lower electricity costs. Lower electricity costs resulted primarily from our LED lighting installation initiative.
The year-to-year percentage change from 2014 to 2015 resulted from the following:
2014 to 2015 (Decrease) as a Percentage
of Total Revenue Maintenance (0.2%) Utilities (0.2%) Store manager conference expense (0.1%)
Lower maintenance expense as a percentage of total revenue for 2015 as compared to 2014 resulted
primarily from cost saving initiatives. The decrease in utilities expense from 2014 to 2015 resulted primarily from milder winter weather and lower
natural gas prices.
In the first quarter of 2014, we held a manager conference which was attended by our store operations management team.
General and Administrative Expenses
The following table highlights general and administrative expenses as a percentage of total revenue for the
past three years: 2016 2015 2014
General and administrative expenses 4.9% 5.2% 4.8% The year-to-year percentage change from 2015 to 2016 resulted primarily from lower incentive
compensation. Lower incentive compensation in 2016 as compared to 2015 was driven by lower performance against financial objectives as compared to the prior year.
The year-to-year percentage change from 2014 to 2015 resulted from the following:
2014 to 2015 Increase (Decrease) as a
Percentage of Total Revenue Incentive compensation expense 0.5% Litigation accrual 0.1% Proxy contest expenses in the prior year (0.2%)
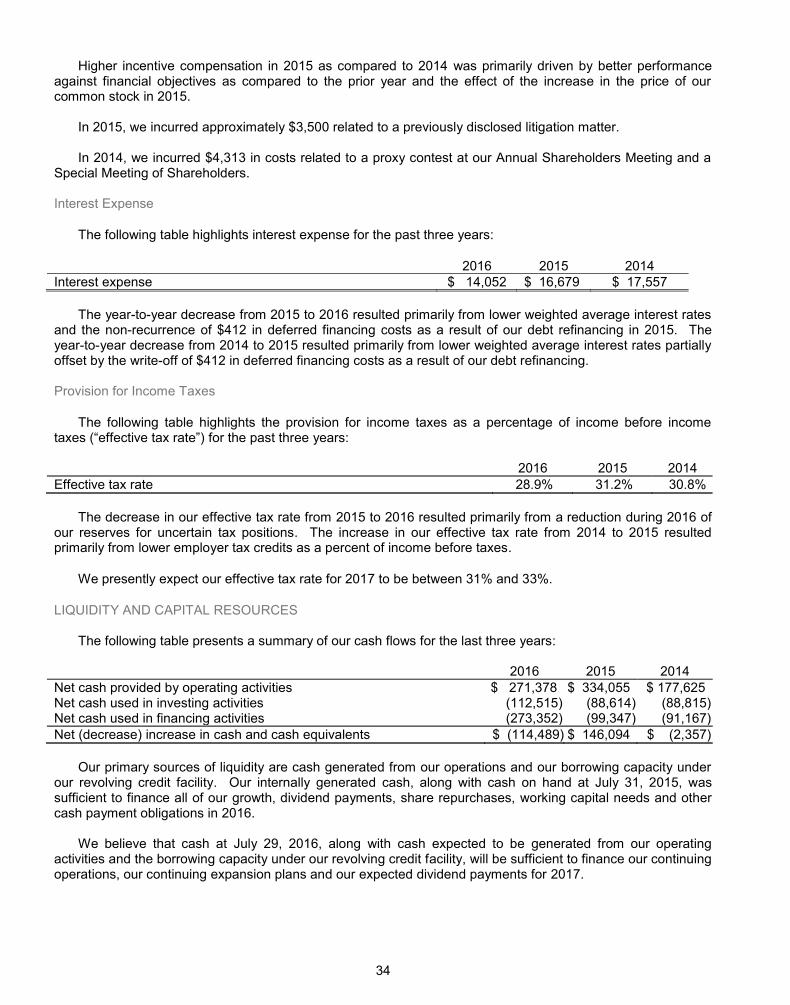
34
Higher incentive compensation in 2015 as compared to 2014 was primarily driven by better performance
against financial objectives as compared to the prior year and the effect of the increase in the price of our common stock in 2015.
In 2015, we incurred approximately $3,500 related to a previously disclosed litigation matter. In 2014, we incurred $4,313 in costs related to a proxy contest at our Annual Shareholders Meeting and a
Special Meeting of Shareholders. Interest Expense
The following table highlights interest expense for the past three years:
2016 2015 2014 Interest expense $ 14,052 $ 16,679 $ 17,557
The year-to-year decrease from 2015 to 2016 resulted primarily from lower weighted average interest rates
and the non-recurrence of $412 in deferred financing costs as a result of our debt refinancing in 2015. The year-to-year decrease from 2014 to 2015 resulted primarily from lower weighted average interest rates partially offset by the write-off of $412 in deferred financing costs as a result of our debt refinancing.
Provision for Income Taxes
The following table highlights the provision for income taxes as a percentage of income before income for the past three years:
2016 2015 2014 Effective tax rate 28.9% 31.2% 30.8%
The decrease in our effective tax rate from 2015 to 2016 resulted primarily from a reduction during 2016 of
our reserves for uncertain tax positions. The increase in our effective tax rate from 2014 to 2015 resulted primarily from lower employer tax credits as a percent of income before taxes.
We presently expect our effective tax rate for 2017 to be between 31% and 33%.
LIQUIDITY AND CAPITAL RESOURCES
The following table presents a summary of our cash flows for the last three years:
2016 2015 2014 Net cash provided by operating activities $ 271,378 $ 334,055 $ 177,625 Net cash used in investing activities (112,515) (88,614) (88,815) Net cash used in financing activities (273,352) (99,347) (91,167) Net (decrease) increase in cash and cash equivalents $ (114,489) $ 146,094 $ (2,357)
Our primary sources of liquidity are cash generated from our operations and our borrowing capacity under our revolving credit facility. Our internally generated cash, along with cash on hand at July 31, 2015, was sufficient to finance all of our growth, dividend payments, share repurchases, working capital needs and other cash payment obligations in 2016.
We believe that cash at July 29, 2016, along with cash expected to be generated from our operating
activities and the borrowing capacity under our revolving credit facility, will be sufficient to finance our continuing operations, our continuing expansion plans and our expected dividend payments for 2017.
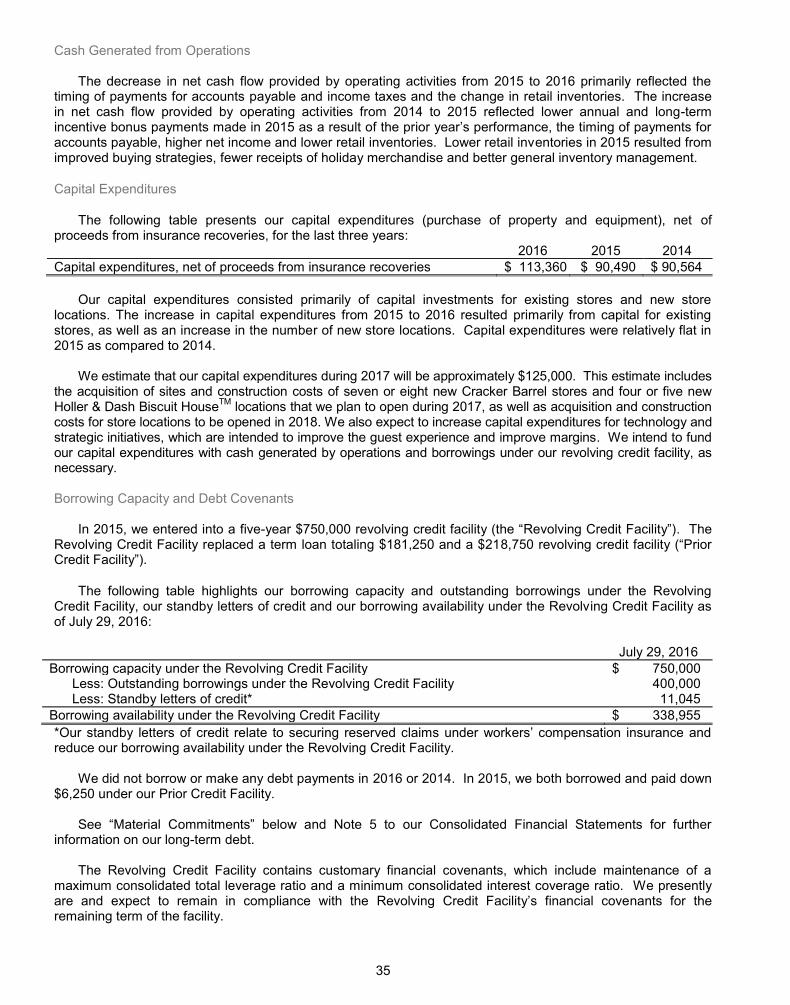
35
Cash Generated from Operations
The decrease in net cash flow provided by operating activities from 2015 to 2016 primarily reflected the timing of payments for accounts payable and income taxes and the change in retail inventories. The increase in net cash flow provided by operating activities from 2014 to 2015 reflected lower annual and long-term
accounts payable, higher net income and lower retail inventories. Lower retail inventories in 2015 resulted from improved buying strategies, fewer receipts of holiday merchandise and better general inventory management.
Capital Expenditures
The following table presents our capital expenditures (purchase of property and equipment), net of proceeds from insurance recoveries, for the last three years: 2016 2015 2014 Capital expenditures, net of proceeds from insurance recoveries $ 113,360 $ 90,490 $ 90,564
Our capital expenditures consisted primarily of capital investments for existing stores and new store
locations. The increase in capital expenditures from 2015 to 2016 resulted primarily from capital for existing stores, as well as an increase in the number of new store locations. Capital expenditures were relatively flat in 2015 as compared to 2014.
We estimate that our capital expenditures during 2017 will be approximately $125,000. This estimate includes
the acquisition of sites and construction costs of seven or eight new Cracker Barrel stores and four or five new Holler & Dash Biscuit HouseTM locations that we plan to open during 2017, as well as acquisition and construction costs for store locations to be opened in 2018. We also expect to increase capital expenditures for technology and strategic initiatives, which are intended to improve the guest experience and improve margins. We intend to fund our capital expenditures with cash generated by operations and borrowings under our revolving credit facility, as necessary. Borrowing Capacity and Debt Covenants
In 2015, we entered into a five-year $750,000 revolving Revolving . The Revolving Credit Facility replaced a term loan totaling $181,250 and a $21
The following table highlights our borrowing capacity and outstanding borrowings under the Revolving Credit Facility, our standby letters of credit and our borrowing availability under the Revolving Credit Facility as of July 29, 2016:
July 29, 2016 Borrowing capacity under the Revolving Credit Facility $ 750,000
Less: Outstanding borrowings under the Revolving Credit Facility 400,000 Less: Standby letters of credit* 11,045
Borrowing availability under the Revolving Credit Facility $ 338,955
reduce our borrowing availability under the Revolving Credit Facility.
We did not borrow or make any debt payments in 2016 or 2014. In 2015, we both borrowed and paid down $6,250 under our Prior Credit Facility.
information on our long-term debt.
The Revolving Credit Facility contains customary financial covenants, which include maintenance of a maximum consolidated total leverage ratio and a minimum consolidated interest coverage ratio. We presently are and expect to remain in compliance with the Revolving nants for the remaining term of the facility.
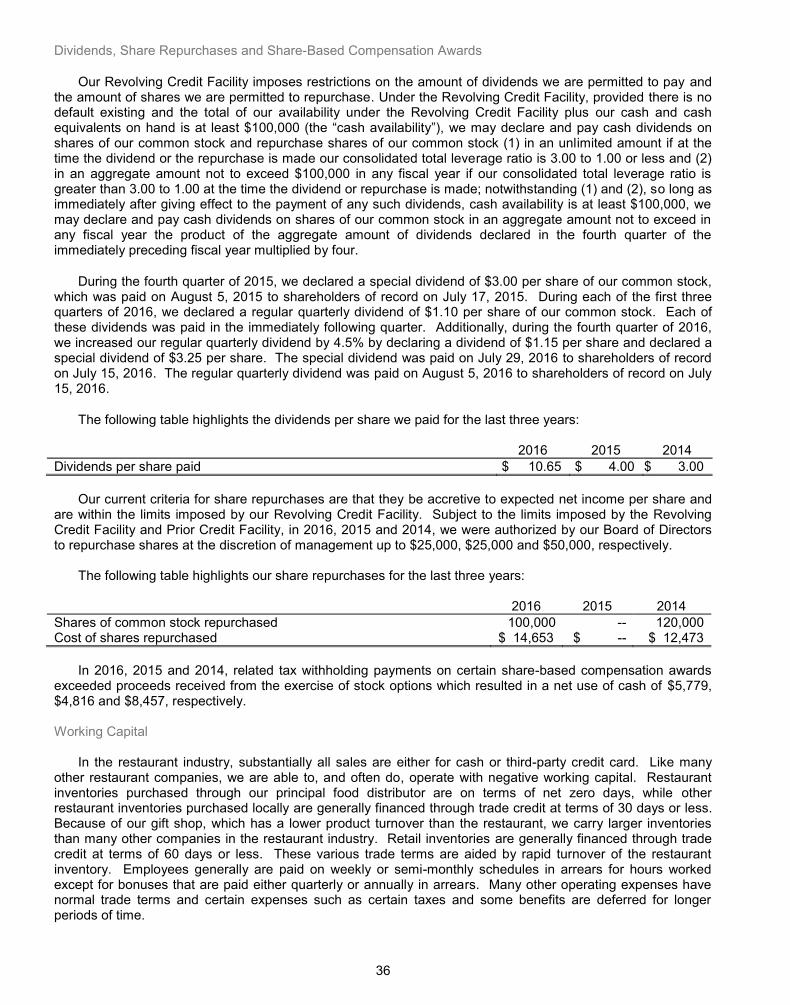
36
Dividends, Share Repurchases and Share-Based Compensation Awards
Our Revolving Credit Facility imposes restrictions on the amount of dividends we are permitted to pay and the amount of shares we are permitted to repurchase. Under the Revolving Credit Facility, provided there is no default existing and the total of our availability under the Revolving Credit Facility plus our cash and cash equivalents on hand is at least $100, we may declare and pay cash dividends on shares of our common stock and repurchase shares of our common stock (1) in an unlimited amount if at the time the dividend or the repurchase is made our consolidated total leverage ratio is 3.00 to 1.00 or less and (2) in an aggregate amount not to exceed $100,000 in any fiscal year if our consolidated total leverage ratio is greater than 3.00 to 1.00 at the time the dividend or repurchase is made; notwithstanding (1) and (2), so long as immediately after giving effect to the payment of any such dividends, cash availability is at least $100,000, we may declare and pay cash dividends on shares of our common stock in an aggregate amount not to exceed in any fiscal year the product of the aggregate amount of dividends declared in the fourth quarter of the immediately preceding fiscal year multiplied by four.
During the fourth quarter of 2015, we declared a special dividend of $3.00 per share of our common stock, which was paid on August 5, 2015 to shareholders of record on July 17, 2015. During each of the first three quarters of 2016, we declared a regular quarterly dividend of $1.10 per share of our common stock. Each of these dividends was paid in the immediately following quarter. Additionally, during the fourth quarter of 2016, we increased our regular quarterly dividend by 4.5% by declaring a dividend of $1.15 per share and declared a special dividend of $3.25 per share. The special dividend was paid on July 29, 2016 to shareholders of record on July 15, 2016. The regular quarterly dividend was paid on August 5, 2016 to shareholders of record on July 15, 2016.
The following table highlights the dividends per share we paid for the last three years:
2016 2015 2014 Dividends per share paid $ 10.65 $ 4.00 $ 3.00
Our current criteria for share repurchases are that they be accretive to expected net income per share and are within the limits imposed by our Revolving Credit Facility. Subject to the limits imposed by the Revolving Credit Facility and Prior Credit Facility, in 2016, 2015 and 2014, we were authorized by our Board of Directors to repurchase shares at the discretion of management up to $25,000, $25,000 and $50,000, respectively.
The following table highlights our share repurchases for the last three years:
2016 2015 2014 Shares of common stock repurchased 100,000 -- 120,000 Cost of shares repurchased $ 14,653 $ -- $ 12,473
In 2016, 2015 and 2014, related tax withholding payments on certain share-based compensation awards
exceeded proceeds received from the exercise of stock options which resulted in a net use of cash of $5,779, $4,816 and $8,457, respectively. Working Capital
In the restaurant industry, substantially all sales are either for cash or third-party credit card. Like many
other restaurant companies, we are able to, and often do, operate with negative working capital. Restaurant inventories purchased through our principal food distributor are on terms of net zero days, while other restaurant inventories purchased locally are generally financed through trade credit at terms of 30 days or less. Because of our gift shop, which has a lower product turnover than the restaurant, we carry larger inventories than many other companies in the restaurant industry. Retail inventories are generally financed through trade credit at terms of 60 days or less. These various trade terms are aided by rapid turnover of the restaurant inventory. Employees generally are paid on weekly or semi-monthly schedules in arrears for hours worked except for bonuses that are paid either quarterly or annually in arrears. Many other operating expenses have normal trade terms and certain expenses such as certain taxes and some benefits are deferred for longer periods of time.
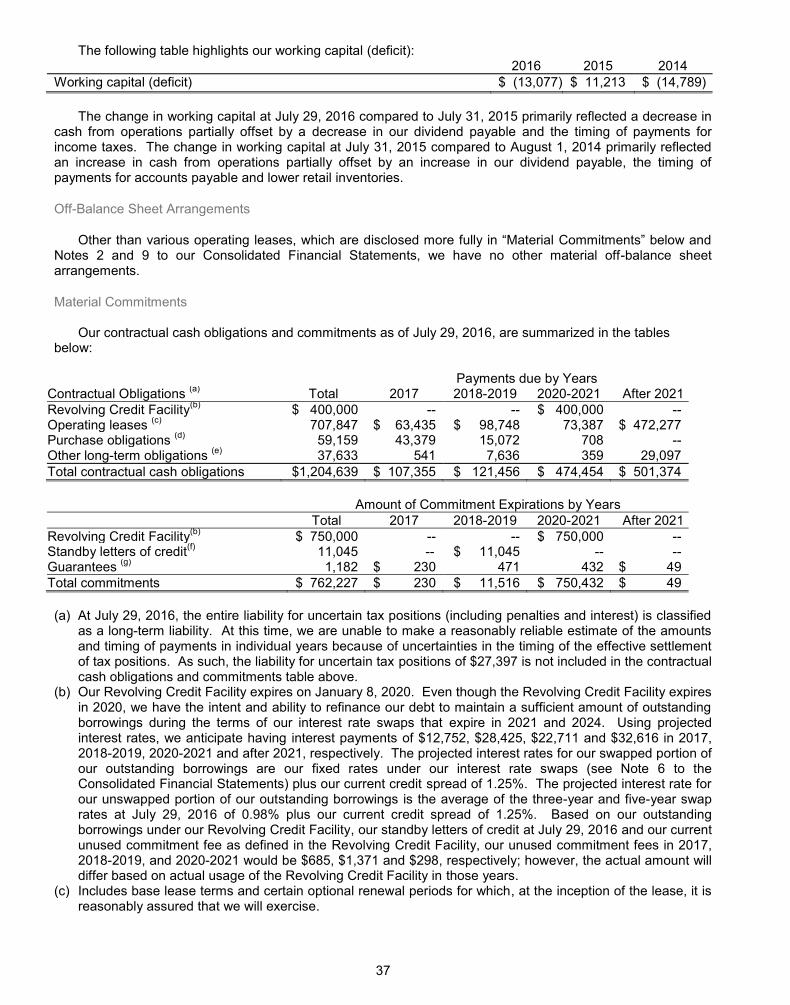
37
The following table highlights our working capital (deficit): 2016 2015 2014 Working capital (deficit) $ (13,077) $ 11,213 $ (14,789)
The change in working capital at July 29, 2016 compared to July 31, 2015 primarily reflected a decrease in
cash from operations partially offset by a decrease in our dividend payable and the timing of payments for income taxes. The change in working capital at July 31, 2015 compared to August 1, 2014 primarily reflected an increase in cash from operations partially offset by an increase in our dividend payable, the timing of payments for accounts payable and lower retail inventories.
Off-Balance Sheet Arrangements
Notes 2 and 9 to our Consolidated Financial Statements, we have no other material off-balance sheet arrangements.
Material Commitments
Our contractual cash obligations and commitments as of July 29, 2016, are summarized in the tables below: Payments due by Years
Contractual Obligations (a) Total 2017 2018-2019 2020-2021 After 2021 Revolving Credit Facility(b) $ 400,000 -- -- $ 400,000 -- Operating leases (c) 707,847 $ 63,435 $ 98,748 73,387 $ 472,277 Purchase obligations (d) 59,159 43,379 15,072 708 -- Other long-term obligations (e) 37,633 541 7,636 359 29,097 Total contractual cash obligations $1,204,639 $ 107,355 $ 121,456 $ 474,454 $ 501,374 Amount of Commitment Expirations by Years
Total 2017 2018-2019 2020-2021 After 2021 Revolving Credit Facility(b) $ 750,000 -- -- $ 750,000 -- Standby letters of credit(f) 11,045 -- $ 11,045 -- -- Guarantees (g) 1,182 $ 230 471 432 $ 49 Total commitments $ 762,227 $ 230 $ 11,516 $ 750,432 $ 49 (a) At July 29, 2016, the entire liability for uncertain tax positions (including penalties and interest) is classified
as a long-term liability. At this time, we are unable to make a reasonably reliable estimate of the amounts and timing of payments in individual years because of uncertainties in the timing of the effective settlement of tax positions. As such, the liability for uncertain tax positions of $27,397 is not included in the contractual cash obligations and commitments table above.
(b) Our Revolving Credit Facility expires on January 8, 2020. Even though the Revolving Credit Facility expires in 2020, we have the intent and ability to refinance our debt to maintain a sufficient amount of outstanding borrowings during the terms of our interest rate swaps that expire in 2021 and 2024. Using projected interest rates, we anticipate having interest payments of $12,752, $28,425, $22,711 and $32,616 in 2017, 2018-2019, 2020-2021 and after 2021, respectively. The projected interest rates for our swapped portion of our outstanding borrowings are our fixed rates under our interest rate swaps (see Note 6 to the Consolidated Financial Statements) plus our current credit spread of 1.25%. The projected interest rate for our unswapped portion of our outstanding borrowings is the average of the three-year and five-year swap rates at July 29, 2016 of 0.98% plus our current credit spread of 1.25%. Based on our outstanding borrowings under our Revolving Credit Facility, our standby letters of credit at July 29, 2016 and our current unused commitment fee as defined in the Revolving Credit Facility, our unused commitment fees in 2017, 2018-2019, and 2020-2021 would be $685, $1,371 and $298, respectively; however, the actual amount will differ based on actual usage of the Revolving Credit Facility in those years.
(c) Includes base lease terms and certain optional renewal periods for which, at the inception of the lease, it is reasonably assured that we will exercise.
38
(d) Purchase obligations consist of purchase orders for food and retail merchandise; purchase orders for capital expenditures, supplies, other operating needs and other services; and commitments under contracts for maintenance needs and other services. We have excluded contracts that do not contain minimum purchase obligations. We excluded long-term agreements for services and operating needs that can be cancelled within 60 days without penalty. We included long-term agreements and certain retail purchase orders for services and operating needs that can be cancelled with more than 60 days notice without penalty only through the term of the notice. We included long-term agreements for services and operating needs that only can be cancelled in the event of an uncured material breach or with a penalty through the entire term of the contract. Because of the uncertainties of seasonal demands and promotional calendar changes, our best estimate of usage for food, supplies and other operating needs and services is ratably over either the notice period or the remaining life of the contract, as applicable, unless we had better information available at the time related to each contract.
(e) Other long-term obligations include our Non-Qualified Savings Plan ($27,764, with a corresponding long-term asset to fund the liability; see Note 12 to the Consolidated Financial Statements), Deferred Compensation Plan ($1,874) and our long-term incentive plans ($7,995).
(f) reduce our borrowing availability under the Revolving Credit Facility.
(g) Consists solely of guarantees associated with lease payments for two properties. We are not aware of any non-performance under these arrangements that would result in us having to perform in accordance with the terms of these guarantees.
Recent Accounting Pronouncements Adopted and Not Yet Adopted
See Note 2 to the accompanying Consolidated Financial Statements for a discussion of recent accounting
guidance adopted and not yet adopted. The adopted accounting guidance discussed in Note 2 did not have a significant impact on our consolidated financial position or results of operations. The Company either expects that the accounting guidance not yet adopted financial position or results of operations or is currently evaluating the impact of adopting the accounting guidance.
CRITICAL ACCOUNTING ESTIMATES We prepare our Consolidated Financial Statements in conformity with GAAP. The preparation of these
financial statements requires us to make estimates and assumptions about future events and apply judgments that affect the reported amounts of assets, liabilities, revenue, expenses and related disclosures. We base our estimates and judgments on historical experience, current trends, outside advice from parties believed to be experts in such matters and on various other assumptions that are believed to be reasonable under the circumstances, the results of which form the basis for making judgments about the carrying value of assets and liabilities that are not readily apparent from other sources. However, because future events and their effects cannot be determined with certainty, actual results could differ from those assumptions and estimates, and such differences could be material.
Our significant accounting policies are discussed in Note 2 to the Consolidated Financial Statements. Judgments and uncertainties affecting the application of those policies may result in materially different amounts being reported under different conditions or using different assumptions. Critical accounting estimates are those that:
management believes are most important to the accurate portrayal of both our financial condition and
operating results; and
estimates about the effect of matters that are inherently uncertain. We consider the following accounting estimates to be most critical in understanding the judgments that are
involved in preparing our Consolidated Financial Statements:
Impairment of Long-Lived Assets and Provision for Asset Dispositions Insurance Reserves Retail Inventory Valuation Tax Provision
39
Share-Based Compensation Legal Proceedings
Management has reviewed these critical accounting estimates and related disclosures with the Audit Committee of our Board of Directors.
Impairment of Long-Lived Assets and Provision for Asset Dispositions
We assess the impairment of long-lived assets whenever events or changes in circumstances indicate that the carrying value of an asset may not be recoverable. Recoverability of assets is measured by comparing the carrying value of the asset to the undiscounted future cash flows expected to be generated by the asset. If the total expected future cash flows are less than the carrying amount of the asset, the carrying value is written down, for an asset to be held and used, to the estimated fair value or, for an asset to be disposed of, to the fair value, net of estimated costs of disposal. Any loss resulting from impairment is recognized by a charge to income. Judgments and estimates that we make related to the expected useful lives of long-lived assets and future cash flows are affected by factors such as changes in economic conditions and changes in operating performance. The accuracy of such provisions can vary materially from original estimates and management regularly monitors the adequacy of the provisions until final disposition occurs.
We have not made any material changes in our methodology for assessing impairments during the past three years and we do not believe that there is a reasonable likelihood that there will be a material change in the estimates or assumptions used by us to assess impairment of long-lived assets. However, if actual results are not consistent with our estimates and assumptions used in estimating future cash flows and fair values of long-lived assets, we may be exposed to losses that could be material.
Insurance Reserves
We self- and general liability programs. In 2014 and 2015, we purchased ed $250, $500 or $1,000 depending on the state in which the claim originates. Beginning in 2016, we purchase
s that exceed $250, $750 or $1,000 depending on the state in which the claim originated. We purchase insurance for individual general liability claims that exceed $500. d claims and for an estimate of incurred but not reported claims. These reserves and estimates of IBNR claims are based upon a full scope actuarial study which is performed annually at the end of our third quarter and is adjusted by the actuarially determined losses and actual claims payments for the fourth quarter. Additionally, we perform limited scope actuarial studies on a quarterly basis to verify and/or modify our reserves. The reserves and losses in the actuarial study represent a range of possible outcomes within which no given estimate is more likely than any other estimate. As such, we record the losses in the lower end of that range and discount them to present value using a risk-free interest rate based on projected timing of payments. We also monitor actual claims development, including incurrence or settlement of individual large claims during the interim periods between actuarial studies as another means of estimating the adequacy of our reserves.
Our group health plans combine the use of self-insured and fully-insured programs. Benefits for any individual (employee or dependents) in the self-insured group health program are limited. We record a liability for the self-insured portion of our group health program for all unpaid claims based upon a loss development analysis derived from actual group health claims payment experience. We also record a liability for unpaid prescription drug claims based on historical experience. The majority of our fully-insured health insurance plans for calendar 2013 and 2014 contained a retrospective feature which could increase or decrease premiums based on actual claims experience.
Our accounting policies regarding insurance reserves include certain actuarial assumptions and
management judgments regarding economic conditions, the frequency and severity of claims and claim development history and settlement practices. We have not made any material changes in the accounting methodology used to establish our insurance reserves during the past three years and do not believe there is a reasonable likelihood that there will be a material change in the estimates or assumptions used to calculate the insurance reserves. However, changes in these actuarial assumptions or management judgments in the future may produce materially different amounts of expense that would be reported under these insurance programs.
40
Retail Inventory Valuation
Cost of goods sold includes the cost of retail merchandise sold at our stores utilizing the retail inventory is at cost and the resulting gross margins are
calculated by applying a cost-to-retail ratio to the retail value of our inventories. Inherent in the RIM calculation are certain significant management judgments and estimates, including initial markons, markups, markdowns and shrinkage, which may significantly impact the gross margin calculation as well as the ending inventory valuation.
Inventory valuation provisions are included for retail inventory obsolescence and retail inventory shrinkage. Retail inventory is reviewed on a quarterly basis for obsolescence and adjusted as appropriate based on assumptions made by management and judgment regarding inventory aging and future promotional activities. Cost of goods sold includes an estimate of shrinkage that is adjusted upon physical inventory counts. Annual physical inventory counts are conducted throughout the third and fourth quarters based upon a cyclical inventory schedule. An estimate of shrinkage is recorded for the time period between physical inventory counts by using a three- -by-store basis.
We have not made any material changes in the methodologies, estimates or assumptions related to our merchandise inventories during the past three years and do not believe there is a reasonable likelihood that there will be a material change in the estimates or assumptions in the future. However, actual obsolescence or shrinkage recorded may produce materially different amounts than we have estimated.
Tax Provision
We must make estimates of certain items that comprise our income tax provision. These estimates include effective state and local income tax rates, employer tax credits for items such as FICA taxes paid on employee tip income and the Work Opportunity credit, as well as estimates related to certain depreciation and capitalization policies. Our estimates are made based on current tax laws, the best available information at the time of the provision and historical experience.
We recognize (or derecognize) a tax position taken or expected to be taken in a tax return in the financial statements when it is more likely than not (i.e., a likelihood of more than fifty percent) that the position would be sustained (or not sustained) upon examination by tax authorities. A recognized tax position is then measured at the largest amount of benefit that is greater than fifty percent likely of being realized upon ultimate settlement.
We file our income tax returns many months after our year end. These returns are subject to audit by various federal and state governments years after the returns are filed and could be subject to differing interpretations of the tax laws. We then must assess the likelihood of successful legal proceedings or reach a settlement with the relevant taxing authority. Although we believe that the judgments and estimates used in establishing our tax provision are reasonable, an unsuccessful legal proceeding or a settlement could result in material adjustments to our Consolidated Financial Statements and our consolidated financial position. Share-Based Compensation
Our share-based compensation primarily consists of nonvested stock awards and performance-based market MSU Grants Share-based compensation expense is recognized based on the grant date fair value and the achievement of performance conditions for certain awards. We recognize share-based compensation expense on a straight-line basis over the requisite service periodvesting period, or the date on which retirement eligibility is achieved, if shorter.
Compensation expense is recognized for only the portion of our share-based compensation awards that are expected to vest. Therefore, an estimated forfeiture rate is derived from historical employee termination behavior and is updated annually. The forfeiture rate is applied on a straight-line basis over the service (vesting) period and we update the estimated forfeiture rate to actual at each reporting period.
Beginning in 2014, our share-based compensation awards accrue dividends. Dividends will be forfeited for any share-based compensation awards that do not vest.
41
The fair value of our nonvested stock awards which accrue dividends is equal to the market price of our stock at the date of the grant. Our nonvested stock awards are time vested except for awards under our long-term incentive plans which also contain performance conditions. At each reporting period, we reassess the probability of achieving the performance conditions under our long-term incentive plans. Determining whether the performance conditions will be achieved involves judgment and the estimate of expense for nonvested stock awards may be revised periodically based on changes in our determination of the probability of achieving the performance conditions. Revisions are reflected in the period in which the estimate is changed. If any performance conditions are not met, no shares will be granted, no compensation will ultimately be recognized and, to the extent previously recognized, compensation expense will be reversed.
In addition to providing the requisite service, MSU Grants contain both a market condition, total shareholder return, and a performance condition. Total shareholder return is defined as the change in our stock price plus dividends paid during the performance period. The number of shares awarded at the end of the performance period will vary in direct proportion to a target number of shares set at the beginning of the period, up to a maximum of 150% of target, based on the change in our cumulative total shareholder return over the period. The probability of the actual shares expected to be awarded is considered in the grant date valuation; therefore, the expense will not be adjusted to reflect the actual units awarded. However, if the performance condition is not met, no shares will be granted, no compensation will ultimately be recognized and, to the extent previously recognized, compensation expense will be reversed.
The fair value of our MSU Grants was determined using the Monte-Carlo simulation model, which simulates a range of possible future stock prices and estimates the probabilities of the potential payouts. The Monte-Carlo simulation model uses the average prices for the 60-consecutive calendar days beginning 30 days prior to and ending 30 days after the first business day of the performance period. This model also incorporates the following ranges of assumptions:
The expected volatility is a blend of implied volatility based on market-traded options on our stock and
historical volatility of our stock over the period commensurate with the three-year performance period. The risk-free interest rate is based on the U.S. Treasury rate assumption commensurate with the three-year
performance period. The expected dividend yield is based on our current dividend yield as the best estimate of projected
dividend yield for periods within the three-year performance period.
We update the historical and implied components of the expected volatility assumption when new grants are made.
We have not made any material changes in our estimates or assumptions used to determine share-based
compensation during the past three years. We do not believe there is a reasonable likelihood that there will be a material change in the future estimates or assumptions used to determine share-based compensation expense. However, if actual results are not consistent with our estimates or assumptions, we may be exposed to changes in share-based compensation expense that could be material. Legal Proceedings
We are parties to various legal and regulatory proceedings and claims incidental to our business from time to time. We review outstanding claims and proceedings internally and with external counsel, as necessary and appropriate, to assess probability of loss and for the ability to estimate loss. These assessments are re-evaluated each quarter or as new information becomes available to determine whether a reserve should be established or if any existing reserve should be adjusted. The actual cost of resolving a claim or proceeding ultimately may be substantially different than the amount of the recorded reserve. Although we believe that the judgments and estimates used in establishing our legal reserves are reasonable, an unsuccessful legal proceeding or a settlement could result in material adjustments to our Consolidated Financial Statements and our consolidated financial position.
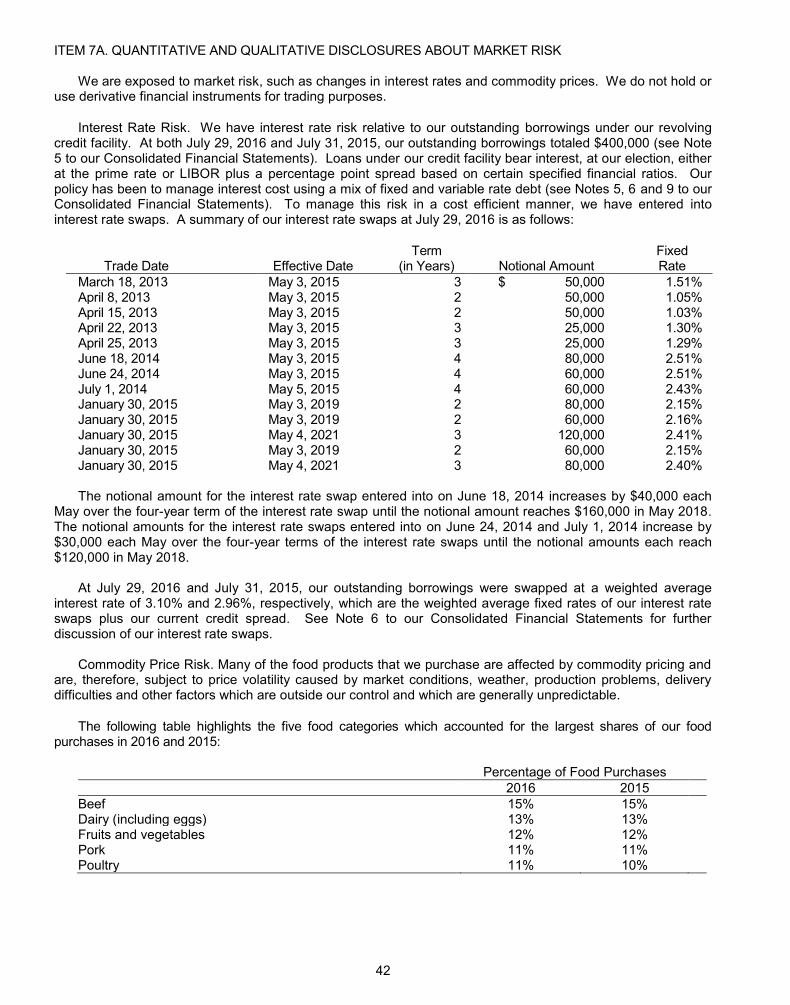
42
ITEM 7A. QUANTITATIVE AND QUALITATIVE DISCLOSURES ABOUT MARKET RISK
We are exposed to market risk, such as changes in interest rates and commodity prices. We do not hold or use derivative financial instruments for trading purposes.
Interest Rate Risk. We have interest rate risk relative to our outstanding borrowings under our revolving credit facility. At both July 29, 2016 and July 31, 2015, our outstanding borrowings totaled $400,000 (see Note 5 to our Consolidated Financial Statements). Loans under our credit facility bear interest, at our election, either at the prime rate or LIBOR plus a percentage point spread based on certain specified financial ratios. Our policy has been to manage interest cost using a mix of fixed and variable rate debt (see Notes 5, 6 and 9 to our Consolidated Financial Statements). To manage this risk in a cost efficient manner, we have entered into interest rate swaps. A summary of our interest rate swaps at July 29, 2016 is as follows:
Trade Date
Effective Date
Term (in Years)
Notional Amount
Fixed Rate
March 18, 2013 May 3, 2015 3 $ 50,000 1.51% April 8, 2013 May 3, 2015 2 50,000 1.05% April 15, 2013 May 3, 2015 2 50,000 1.03% April 22, 2013 May 3, 2015 3 25,000 1.30% April 25, 2013 May 3, 2015 3 25,000 1.29% June 18, 2014 May 3, 2015 4 80,000 2.51% June 24, 2014 May 3, 2015 4 60,000 2.51% July 1, 2014 May 5, 2015 4 60,000 2.43% January 30, 2015 May 3, 2019 2 80,000 2.15% January 30, 2015 May 3, 2019 2 60,000 2.16% January 30, 2015 May 4, 2021 3 120,000 2.41% January 30, 2015 May 3, 2019 2 60,000 2.15% January 30, 2015 May 4, 2021 3 80,000 2.40%
The notional amount for the interest rate swap entered into on June 18, 2014 increases by $40,000 each
May over the four-year term of the interest rate swap until the notional amount reaches $160,000 in May 2018. The notional amounts for the interest rate swaps entered into on June 24, 2014 and July 1, 2014 increase by $30,000 each May over the four-year terms of the interest rate swaps until the notional amounts each reach $120,000 in May 2018.
At July 29, 2016 and July 31, 2015, our outstanding borrowings were swapped at a weighted average
interest rate of 3.10% and 2.96%, respectively, which are the weighted average fixed rates of our interest rate swaps plus our current credit spread. See Note 6 to our Consolidated Financial Statements for further discussion of our interest rate swaps.
Commodity Price Risk. Many of the food products that we purchase are affected by commodity pricing and
are, therefore, subject to price volatility caused by market conditions, weather, production problems, delivery difficulties and other factors which are outside our control and which are generally unpredictable.
The following table highlights the five food categories which accounted for the largest shares of our food purchases in 2016 and 2015:
Percentage of Food Purchases 2016 2015
Beef 15% 15% Dairy (including eggs) 13% 13% Fruits and vegetables 12% 12% Pork 11% 11% Poultry 11% 10%
43
Other categories affected by the commodities markets, such as grains and seafood, may each account for as much as 8% of our food purchases. While some of our food items are produced to our proprietary specifications, our food items are based on generally available products, and if any existing suppliers fail, or are unable to deliver in quantities required by us, we believe that there are sufficient other quality suppliers in the marketplace that our sources of supply can be replaced as necessary to allow us to avoid any material adverse effects that could be caused by such unavailability. We also recognize, however, that commodity pricing is extremely volatile and can change unpredictably even over short periods of time. Changes in commodity prices would affect us and our competitors generally, and depending on the terms and duration of supply contracts, sometimes simultaneously. We enter into contracts for certain of our products in an effort to minimize volatility of supply and pricing. In many cases, or over the longer term, we believe we will be able to pass through some or much of the increased commodity costs by adjusting our menu pricing. From time to time, competitive circumstances, or judgments about consumer acceptance of price increases, may limit menu price flexibility, and in those circumstances, increases in commodity prices can result in lower margins.
44
ITEM 8. FINANCIAL STATEMENTS AND SUPPLEMENTARY DATA REPORT OF INDEPENDENT REGISTERED PUBLIC ACCOUNTING FIRM To the Board of Directors and Shareholders of Cracker Barrel Old Country Store, Inc. Lebanon, Tennessee
We have audited the accompanying consolidated balance sheets of Cracker Barrel Old Country Store, Inc. and its July 29, 2016 and July 31, 2015, and the related consolidated statements of income, comprehensive income, chanyears in the period ended July 29, 2016management. Our responsibility is to express an opinion on these consolidated financial statements based on our audits.
We conducted our audits in accordance with the standards of the Public Company Accounting Oversight Board (United States). Those standards require that we plan and perform the audit to obtain reasonable assurance about whether the financial statements are free of material misstatement. An audit includes examining, on a test basis, evidence supporting the amounts and disclosures in the financial statements. An audit also includes assessing the accounting principles used and significant estimates made by management, as well as evaluating the overall financial statement presentation. We believe that our audits provide a reasonable basis for our opinion.
In our opinion, such consolidated financial statements present fairly, in all material respects, the financial position of Cracker Barrel Old Country Store, Inc. and its subsidiaries as of July 29, 2016 and July 31, 2015, and the results of their operations and their cash flows for each of the three fiscal years in the period ended July 29, 2016, in conformity with accounting principles generally accepted in the United States of America.
We have also audited, in accordance with the standards of the Public Company Accounting Oversight Board internal control over financial reporting as of July 29, 2016, based on the criteria
established in Internal Control—Integrated Framework (2013) issued by the Committee of Sponsoring Organizations of the Treadway Commission and our report dated September 26, 2016 expressed an
/s/ Deloitte & Touche LLP Nashville, Tennessee September 26, 2016
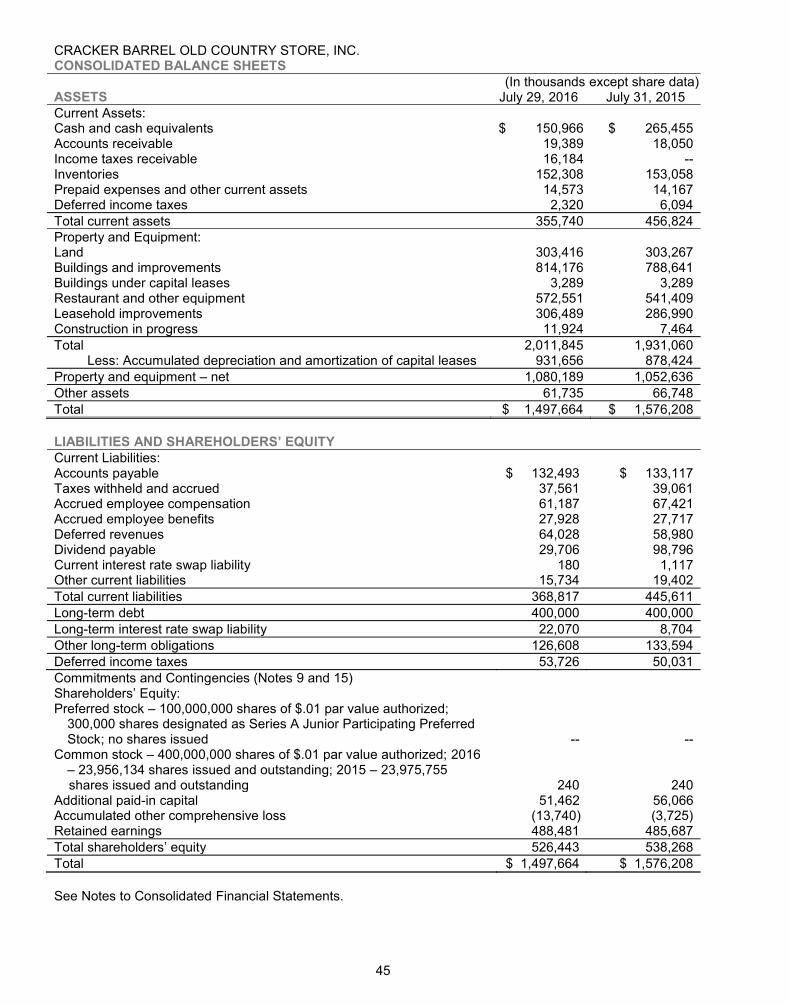
45
CRACKER BARREL OLD COUNTRY STORE, INC. CONSOLIDATED BALANCE SHEETS
(In thousands except share data) ASSETS July 29, 2016 July 31, 2015 Current Assets: Cash and cash equivalents $ 150,966 $ 265,455 Accounts receivable 19,389 18,050 Income taxes receivable 16,184 -- Inventories 152,308 153,058 Prepaid expenses and other current assets 14,573 14,167 Deferred income taxes 2,320 6,094 Total current assets 355,740 456,824 Property and Equipment: Land 303,416 303,267 Buildings and improvements 814,176 788,641 Buildings under capital leases 3,289 3,289 Restaurant and other equipment 572,551 541,409 Leasehold improvements 306,489 286,990 Construction in progress 11,924 7,464 Total 2,011,845 1,931,060
Less: Accumulated depreciation and amortization of capital leases 931,656 878,424 Property and equipment net 1,080,189 1,052,636 Other assets 61,735 66,748 Total $ 1,497,664 $ 1,576,208
Current Liabilities: Accounts payable $ 132,493 $ 133,117 Taxes withheld and accrued 37,561 39,061 Accrued employee compensation 61,187 67,421 Accrued employee benefits 27,928 27,717 Deferred revenues 64,028 58,980 Dividend payable 29,706 98,796 Current interest rate swap liability 180 1,117 Other current liabilities 15,734 19,402 Total current liabilities 368,817 445,611 Long-term debt 400,000 400,000 Long-term interest rate swap liability 22,070 8,704 Other long-term obligations 126,608 133,594 Deferred income taxes 53,726 50,031 Commitments and Contingencies (Notes 9 and 15)
Preferred stock 100,000,000 shares of $.01 par value authorized;
300,000 shares designated as Series A Junior Participating Preferred Stock; no shares issued -- --
Common stock 400,000,000 shares of $.01 par value authorized; 2016 23,956,134 shares issued and outstanding; 2015 23,975,755
shares issued and outstanding 240 240 Additional paid-in capital 51,462 56,066 Accumulated other comprehensive loss (13,740) (3,725) Retained earnings 488,481 485,687
526,443 538,268 Total $ 1,497,664 $ 1,576,208 See Notes to Consolidated Financial Statements.
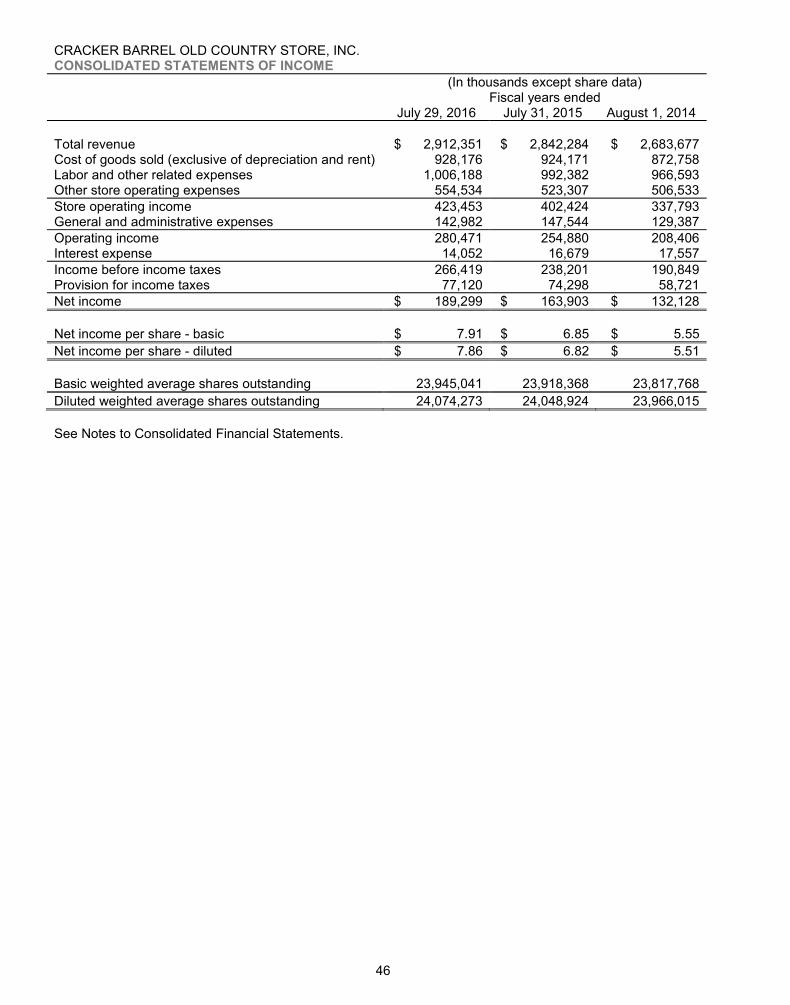
46
CRACKER BARREL OLD COUNTRY STORE, INC. CONSOLIDATED STATEMENTS OF INCOME
(In thousands except share data) Fiscal years ended
July 29, 2016 July 31, 2015 August 1, 2014
Total revenue $ 2,912,351 $ 2,842,284 $ 2,683,677 Cost of goods sold (exclusive of depreciation and rent) 928,176 924,171 872,758 Labor and other related expenses 1,006,188 992,382 966,593 Other store operating expenses 554,534 523,307 506,533 Store operating income 423,453 402,424 337,793 General and administrative expenses 142,982 147,544 129,387 Operating income 280,471 254,880 208,406 Interest expense 14,052 16,679 17,557 Income before income taxes 266,419 238,201 190,849 Provision for income taxes 77,120 74,298 58,721 Net income $ 189,299 $ 163,903 $ 132,128 Net income per share - basic $ 7.91 $ 6.85 $ 5.55 Net income per share - diluted $ 7.86 $ 6.82 $ 5.51 Basic weighted average shares outstanding 23,945,041 23,918,368 23,817,768 Diluted weighted average shares outstanding 24,074,273 24,048,924 23,966,015 See Notes to Consolidated Financial Statements.
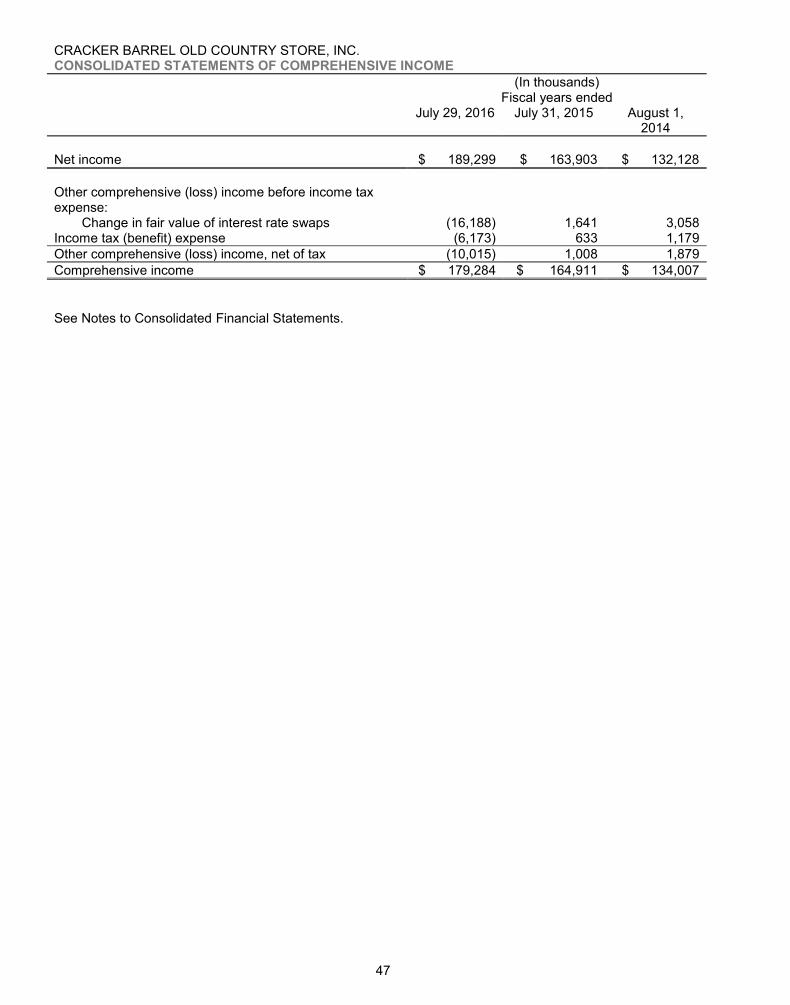
47
CRACKER BARREL OLD COUNTRY STORE, INC. CONSOLIDATED STATEMENTS OF COMPREHENSIVE INCOME
(In thousands) Fiscal years ended
July 29, 2016 July 31, 2015 August 1, 2014
Net income $ 189,299 $ 163,903 $ 132,128 Other comprehensive (loss) income before income tax expense:
Change in fair value of interest rate swaps (16,188) 1,641 3,058 Income tax (benefit) expense (6,173) 633 1,179 Other comprehensive (loss) income, net of tax (10,015) 1,008 1,879 Comprehensive income $ 179,284 $ 164,911 $ 134,007
See Notes to Consolidated Financial Statements.
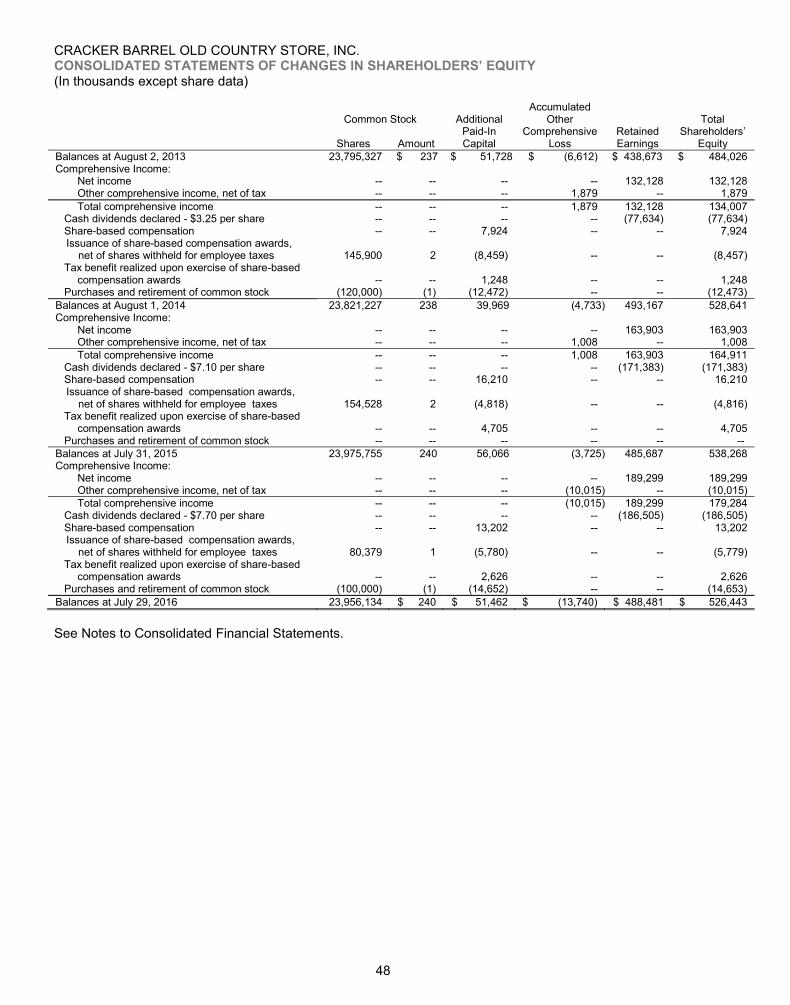
48
CRACKER BARREL OLD COUNTRY STORE, INC. CONSOLIDATED STATEMENTS OF (In thousands except share data)
Common Stock
Additional
Paid-In
Accumulated Other
Comprehensive Retained Total
Shares Amount Capital Loss Earnings Equity Balances at August 2, 2013 23,795,327 $ 237 $ 51,728 $ (6,612) $ 438,673 $ 484,026 Comprehensive Income:
Net income -- -- -- -- 132,128 132,128 Other comprehensive income, net of tax -- -- -- 1,879 -- 1,879 Total comprehensive income -- -- -- 1,879 132,128 134,007
Cash dividends declared - $3.25 per share -- -- -- -- (77,634) (77,634) Share-based compensation -- -- 7,924 -- -- 7,924 Issuance of share-based compensation awards,
net of shares withheld for employee taxes
145,900
2
(8,459)
--
--
(8,457) Tax benefit realized upon exercise of share-based
compensation awards
--
--
1,248
--
--
1,248 Purchases and retirement of common stock (120,000) (1) (12,472) -- -- (12,473)
Balances at August 1, 2014 23,821,227 238 39,969 (4,733) 493,167 528,641 Comprehensive Income:
Net income -- -- -- -- 163,903 163,903 Other comprehensive income, net of tax -- -- -- 1,008 -- 1,008 Total comprehensive income -- -- -- 1,008 163,903 164,911
Cash dividends declared - $7.10 per share -- -- -- -- (171,383) (171,383) Share-based compensation -- -- 16,210 -- -- 16,210 Issuance of share-based compensation awards,
net of shares withheld for employee taxes
154,528
2
(4,818)
--
--
(4,816) Tax benefit realized upon exercise of share-based
compensation awards
--
--
4,705
--
--
4,705 Purchases and retirement of common stock -- -- -- -- -- --
Balances at July 31, 2015 23,975,755 240 56,066 (3,725) 485,687 538,268 Comprehensive Income:
Net income -- -- -- -- 189,299 189,299 Other comprehensive income, net of tax -- -- -- (10,015) -- (10,015) Total comprehensive income -- -- -- (10,015) 189,299 179,284
Cash dividends declared - $7.70 per share -- -- -- -- (186,505) (186,505) Share-based compensation -- -- 13,202 -- -- 13,202 Issuance of share-based compensation awards,
net of shares withheld for employee taxes
80,379
1
(5,780)
--
--
(5,779) Tax benefit realized upon exercise of share-based
compensation awards
--
--
2,626
--
--
2,626 Purchases and retirement of common stock (100,000) (1) (14,652) -- -- (14,653)
Balances at July 29, 2016 23,956,134 $ 240 $ 51,462 $ (13,740) $ 488,481 $ 526,443 See Notes to Consolidated Financial Statements.
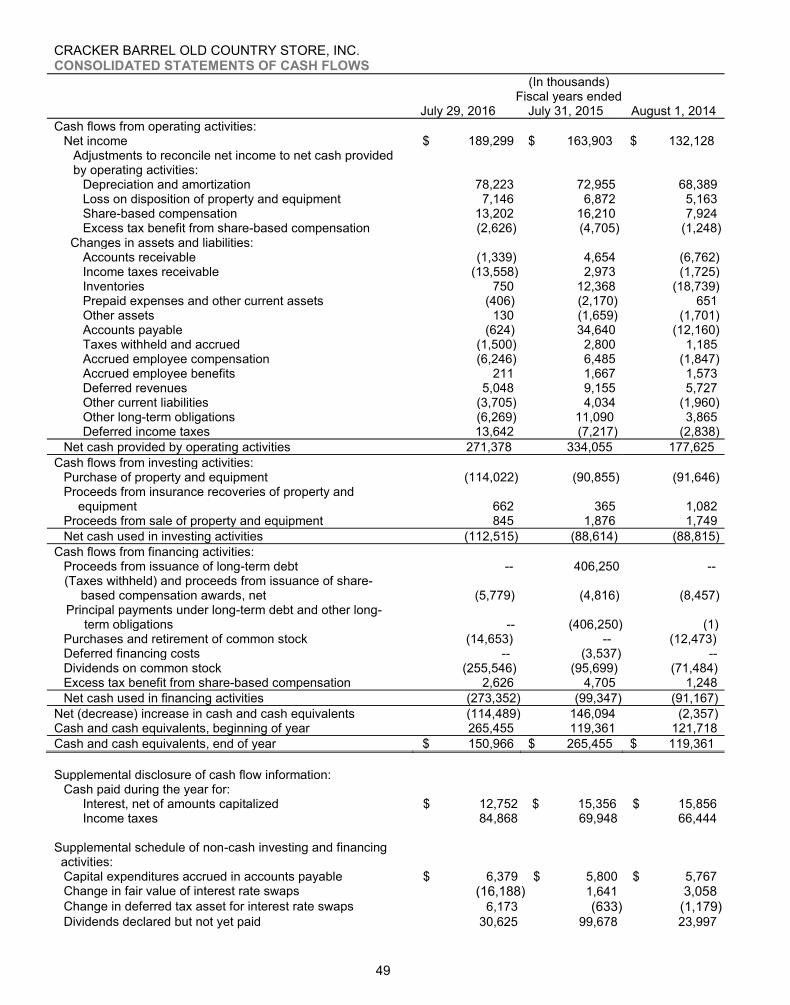
49
CRACKER BARREL OLD COUNTRY STORE, INC. CONSOLIDATED STATEMENTS OF CASH FLOWS
(In thousands) Fiscal years ended
July 29, 2016 July 31, 2015 August 1, 2014 Cash flows from operating activities:
Net income $ 189,299 $ 163,903 $ 132,128 Adjustments to reconcile net income to net cash provided by operating activities:
Depreciation and amortization 78,223 72,955 68,389 Loss on disposition of property and equipment 7,146 6,872 5,163 Share-based compensation 13,202 16,210 7,924 Excess tax benefit from share-based compensation (2,626) (4,705) (1,248)
Changes in assets and liabilities: Accounts receivable (1,339) 4,654 (6,762) Income taxes receivable (13,558) 2,973 (1,725) Inventories 750 12,368 (18,739) Prepaid expenses and other current assets (406) (2,170) 651 Other assets 130 (1,659) (1,701) Accounts payable (624) 34,640 (12,160) Taxes withheld and accrued (1,500) 2,800 1,185 Accrued employee compensation (6,246) 6,485 (1,847) Accrued employee benefits 211 1,667 1,573 Deferred revenues 5,048 9,155 5,727 Other current liabilities (3,705) 4,034 (1,960) Other long-term obligations (6,269) 11,090 3,865 Deferred income taxes 13,642 (7,217) (2,838)
Net cash provided by operating activities 271,378 334,055 177,625 Cash flows from investing activities:
Purchase of property and equipment (114,022) (90,855) (91,646) Proceeds from insurance recoveries of property and
equipment
662
365
1,082 Proceeds from sale of property and equipment 845 1,876 1,749 Net cash used in investing activities (112,515) (88,614) (88,815)
Cash flows from financing activities: Proceeds from issuance of long-term debt -- 406,250 -- (Taxes withheld) and proceeds from issuance of share-
based compensation awards, net (5,779) (4,816) (8,457) Principal payments under long-term debt and other long-
term obligations
--
(406,250)
(1) Purchases and retirement of common stock (14,653) -- (12,473) Deferred financing costs -- (3,537) -- Dividends on common stock (255,546) (95,699) (71,484) Excess tax benefit from share-based compensation 2,626 4,705 1,248 Net cash used in financing activities (273,352) (99,347) (91,167)
Net (decrease) increase in cash and cash equivalents (114,489) 146,094 (2,357) Cash and cash equivalents, beginning of year 265,455 119,361 121,718 Cash and cash equivalents, end of year $ 150,966 $ 265,455 $ 119,361 Supplemental disclosure of cash flow information:
Cash paid during the year for: Interest, net of amounts capitalized $ 12,752 $ 15,356 $ 15,856 Income taxes 84,868 69,948 66,444
Supplemental schedule of non-cash investing and financing activities:
Capital expenditures accrued in accounts payable $ 6,379 $ 5,800 $ 5,767 Change in fair value of interest rate swaps (16,188) 1,641 3,058 Change in deferred tax asset for interest rate swaps 6,173 (633) (1,179) Dividends declared but not yet paid 30,625 99,678 23,997
50
See Notes to Consolidated Financial Statements. CRACKER BARREL OLD COUNTRY STORE, INC. NOTES TO CONSOLIDATED FINANCIAL STATEMENTS (In thousands except share data)
1. Description of the Business
principally engaged in the operation and development in the United States of the Cracker Barrel Old
2. Summary of Significant Accounting Policies
GAAP The accompanying Consolidated Financial Statements have been prepared in accordance with generally accepted accounting principles in the U.S.
Fiscal year of
fiscal year or quarter unless noted otherwise.
Principles of consolidation The Consolidated Financial Statements include the accounts of the Company and its subsidiaries, all of which are wholly owned. All significant intercompany transactions and balances have been eliminated.
Cash and cash equivalents with an original maturity of three months or less to be cash equivalents.
Accounts receivable Accounts receivable represent their estimated net realizable value. Accounts receivable are written off when they are deemed uncollectible.
Inventories Inventories are stated at the lower of cost or market. Cost of restaurant inventory is determined by the first-in, first- . Retail inventories are valued using the retail inventory
enter which uses average cost. Approximately 75% of retail inventories are valued using RIM and the remaining retail inventories are valued using an average cost method. See Note 4 for additional information regarding the components of inventory.
Valuation provisions are included for retail inventory obsolescence, retail inventory shrinkage, returns and amortization of certain items. Cost of goods sold includes an estimate of retail inventory shrinkage that is adjusted upon physical inventory counts. Annual physical inventory counts are conducted throughout the third and fourth quarters based upon a cyclical inventory schedule. An estimate of shrinkage is recorded for the time period between physical inventory counts by using a three-year average of the physical invstore-by-store basis.
Property and equipment Property and equipment are stated at cost. For financial reporting purposes, depreciation and amortization on these assets are computed by use of the straight-line and double-declining balance methods over the estimated useful lives of the respective assets, as follows:
Years Buildings and improvements 30-45 Buildings under capital leases 15-25 Restaurant and other equipment 2-10 Leasehold improvements 1-35
Accelerated depreciation methods are generally used for income tax purposes.
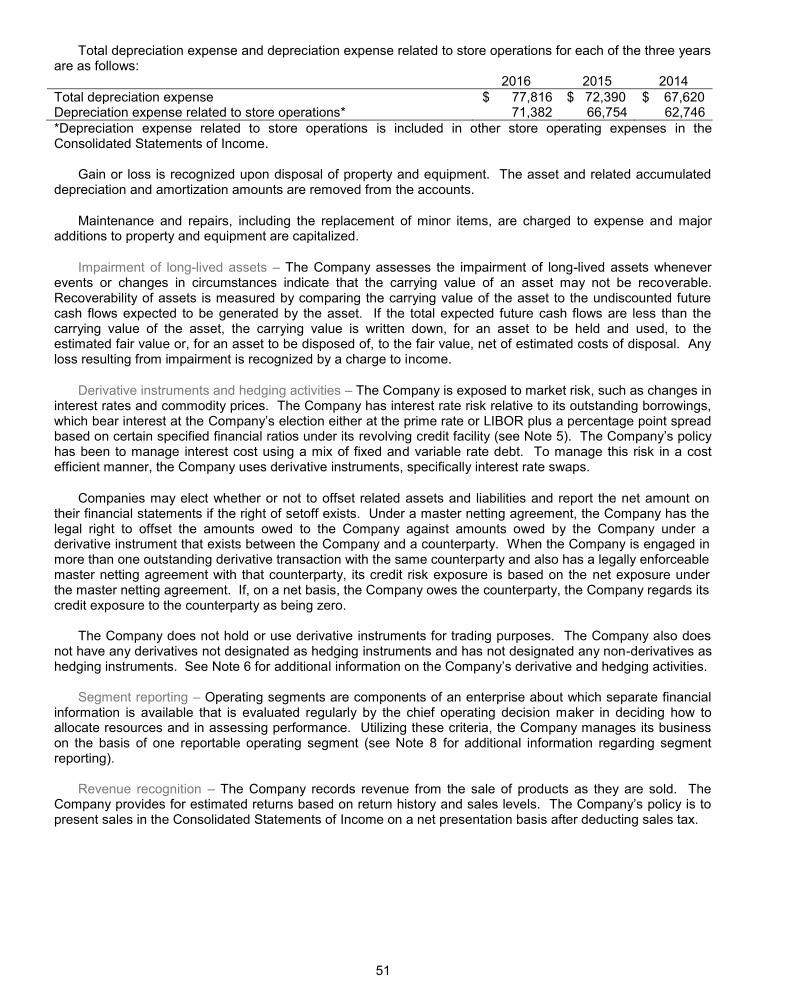
51
Total depreciation expense and depreciation expense related to store operations for each of the three years are as follows: 2016 2015 2014 Total depreciation expense $ 77,816 $ 72,390 $ 67,620 Depreciation expense related to store operations* 71,382 66,754 62,746 *Depreciation expense related to store operations is included in other store operating expenses in the Consolidated Statements of Income.
Gain or loss is recognized upon disposal of property and equipment. The asset and related accumulated
depreciation and amortization amounts are removed from the accounts.
Maintenance and repairs, including the replacement of minor items, are charged to expense and major additions to property and equipment are capitalized.
Impairment of long-lived assets The Company assesses the impairment of long-lived assets whenever events or changes in circumstances indicate that the carrying value of an asset may not be recoverable. Recoverability of assets is measured by comparing the carrying value of the asset to the undiscounted future cash flows expected to be generated by the asset. If the total expected future cash flows are less than the carrying value of the asset, the carrying value is written down, for an asset to be held and used, to the estimated fair value or, for an asset to be disposed of, to the fair value, net of estimated costs of disposal. Any loss resulting from impairment is recognized by a charge to income.
Derivative instruments and hedging activities The Company is exposed to market risk, such as changes in interest rates and commodity prices. The Company has interest rate risk relative to its outstanding borrowings, which bear interest at the based on certain specified financial ratios under its revolving has been to manage interest cost using a mix of fixed and variable rate debt. To manage this risk in a cost efficient manner, the Company uses derivative instruments, specifically interest rate swaps.
Companies may elect whether or not to offset related assets and liabilities and report the net amount on their financial statements if the right of setoff exists. Under a master netting agreement, the Company has the legal right to offset the amounts owed to the Company against amounts owed by the Company under a derivative instrument that exists between the Company and a counterparty. When the Company is engaged in more than one outstanding derivative transaction with the same counterparty and also has a legally enforceable master netting agreement with that counterparty, its credit risk exposure is based on the net exposure under the master netting agreement. If, on a net basis, the Company owes the counterparty, the Company regards its credit exposure to the counterparty as being zero.
The Company does not hold or use derivative instruments for trading purposes. The Company also does
not have any derivatives not designated as hedging instruments and has not designated any non-derivatives as hedging instruments. See Note 6 for additiona
Segment reporting Operating segments are components of an enterprise about which separate financial
information is available that is evaluated regularly by the chief operating decision maker in deciding how to allocate resources and in assessing performance. Utilizing these criteria, the Company manages its business on the basis of one reportable operating segment (see Note 8 for additional information regarding segment reporting).
Revenue recognition The Company records revenue from the sale of products as they are sold. The
present sales in the Consolidated Statements of Income on a net presentation basis after deducting sales tax.
52
Unredeemed gift cards and certificates Unredeemed gift cards and certificates represent a liability of the Company related to unearned income and are recorded at their expected redemption value. No revenue is recognized in connection with the point-of-sale transaction when gift cards or gift certificates are sold. For those states that exempt gift cards and certificates from their escheat laws, the Company makes estimates of the ultimate un amortizes this breakage over the redemption period that other gift cards and certificates historically have been redeemed by reducing its liability and recording revenue accordingly. For those states that do not exempt gift cards and certificates from their escheat laws, the Company records breakage in the period that gift cards and certificates are remitted to the state and reduces its liability accordingly. Any amounts remitted to states under escheat or
any amounts that the Company is permitted to retain are recorded as revenue.
Insurance The Company self- and general liability programs. In 2014 and 2015, the Company purchased on claims that exceeded $250, $500 or $1,000 depending on the state in which the claim originated. Beginning in 2016, the Company purchases $750 or $1,000 depending on the state in which the claim originates. The Company purchases insurance for individual general liability claims that exceed $500.
are quarter and is adjusted by the actuarially determined losses and actual claims payments for the fourth quarter. Additionally, the Company performs limited scope actuarial studies on a quarterly basis to verify and/or modify
The reserves and losses in the actuarial study represent a range of possible outcomes within which no given estimate is more likely than any other estimate. As such, the Company records the losses at the lower end of that range and discounts them to present value using a risk-free interest rate based on projected timing of payments. The Company also monitors actual claims development, including incurrence or settlement of individual large claims during the interim periods between actuarial studies as another means of estimating the adequacy of its reserves.
-insured and fully-insured programs. Benefits
for any individual (employee or dependents) in the self-insured program are limited. The Company records a liability for the self-insured portion of its group health program for all unpaid claims based upon a loss development analysis derived from actual group health claims payment experience. The Company also records a liability for unpaid prescription drug claims based on historical experience. The majority of the
fully-insured plans for calendar 2013 and 2014 contained a retrospective feature which could increase or decrease premiums based on actual claims experience.
Store pre-opening costs Start-up costs of a new store are expensed when incurred, with the exception of rent expense under operating leases, in which the straight-line rent includes the pre-opening period during
on in this Note.
Leases ground leases and office space leases that are recorded as operating leases. The Company also leases its advertising billboards which are recorded as operating leases. provide renewal options and some of these options contain rent escalation clauses. Additionally, some of the leases have rent holiday and contingent rent provisions. During rent holiday periods, which include the pre-opening period during construction, the Company has possession of and access to the property, but is not obligated to, and normally does not, make rent payments. Contingent rent is determined as a percentage of gross sales in excess of specified levels. The Company records a contingent rent liability and corresponding rent expense when it is probable sales have been achieved in amounts in excess of the specified levels.
The liabilities under these leases are recognized on the straight-line basis over the shorter of the useful life, with a maximum of 35 years, or the related lease life. The Company uses a lease life that generally begins on the date that the Company becomes legally obligated under the lease, including the rent holiday periods, and
the inception of the lease, it is reasonably assured that the Company will exercise those renewal options. This lease period is consistent with the period over which leasehold improvements are amortized.
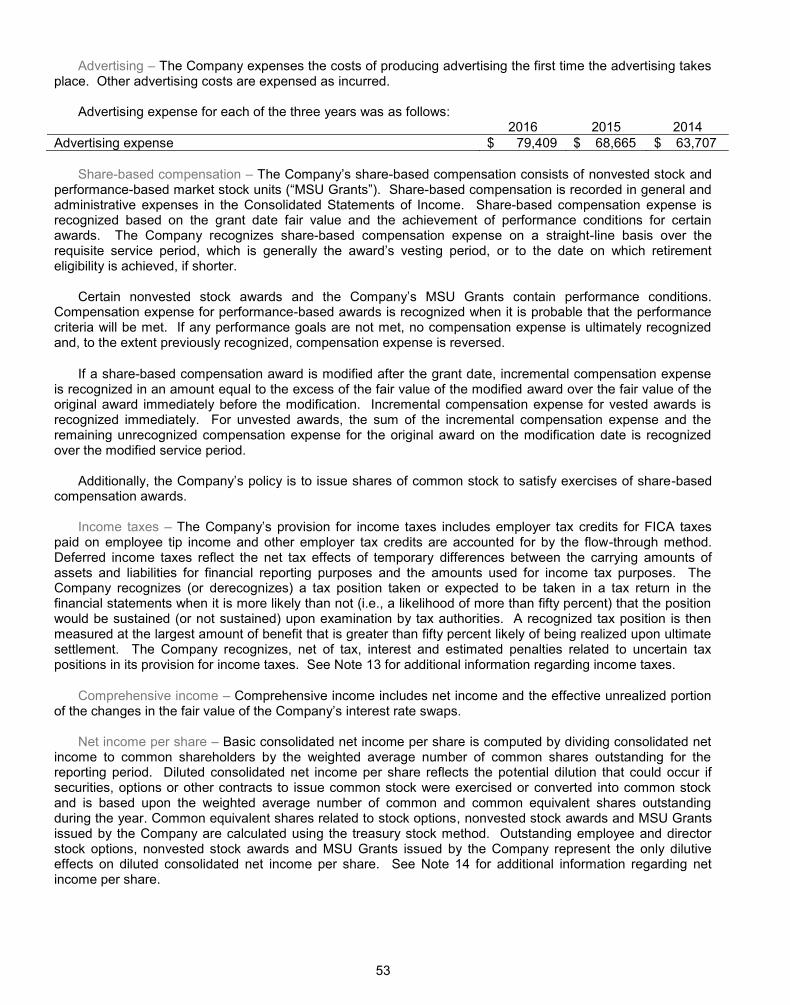
53
Advertising The Company expenses the costs of producing advertising the first time the advertising takes
place. Other advertising costs are expensed as incurred. Advertising expense for each of the three years was as follows:
2016 2015 2014 Advertising expense $ 79,409 $ 68,665 $ 63,707
Share-based compensation -based compensation consists of nonvested stock and
performance-based market stock units ( Share-based compensation is recorded in general and administrative expenses in the Consolidated Statements of Income. Share-based compensation expense is recognized based on the grant date fair value and the achievement of performance conditions for certain awards. The Company recognizes share-based compensation expense on a straight-line basis over the requisite service period or to the date on which retirement eligibility is achieved, if shorter.
Certain nonvested stock awards and the Com s contain performance conditions.
Compensation expense for performance-based awards is recognized when it is probable that the performance criteria will be met. If any performance goals are not met, no compensation expense is ultimately recognized and, to the extent previously recognized, compensation expense is reversed.
If a share-based compensation award is modified after the grant date, incremental compensation expense is recognized in an amount equal to the excess of the fair value of the modified award over the fair value of the original award immediately before the modification. Incremental compensation expense for vested awards is recognized immediately. For unvested awards, the sum of the incremental compensation expense and the remaining unrecognized compensation expense for the original award on the modification date is recognized over the modified service period.
-based
compensation awards.
Income taxes paid on employee tip income and other employer tax credits are accounted for by the flow-through method. Deferred income taxes reflect the net tax effects of temporary differences between the carrying amounts of assets and liabilities for financial reporting purposes and the amounts used for income tax purposes. The Company recognizes (or derecognizes) a tax position taken or expected to be taken in a tax return in the financial statements when it is more likely than not (i.e., a likelihood of more than fifty percent) that the position would be sustained (or not sustained) upon examination by tax authorities. A recognized tax position is then measured at the largest amount of benefit that is greater than fifty percent likely of being realized upon ultimate settlement. The Company recognizes, net of tax, interest and estimated penalties related to uncertain tax positions in its provision for income taxes. See Note 13 for additional information regarding income taxes.
Comprehensive income Comprehensive income includes net income and the effective unrealized portion
Net income per share Basic consolidated net income per share is computed by dividing consolidated net
income to common shareholders by the weighted average number of common shares outstanding for the reporting period. Diluted consolidated net income per share reflects the potential dilution that could occur if securities, options or other contracts to issue common stock were exercised or converted into common stock and is based upon the weighted average number of common and common equivalent shares outstanding during the year. Common equivalent shares related to stock options, nonvested stock awards and MSU Grants issued by the Company are calculated using the treasury stock method. Outstanding employee and director stock options, nonvested stock awards and MSU Grants issued by the Company represent the only dilutive effects on diluted consolidated net income per share. See Note 14 for additional information regarding net income per share.
54
Use of estimates Management of the Company has made certain estimates and assumptions relating to the reporting of assets and liabilities and the disclosure of contingent liabilities at the date of the Consolidated Financial Statements and the reported amounts of revenues and expenses during the reporting periods to prepare these Consolidated Financial Statements in conformity with GAAP. Management believes that such estimates have been based on reasonable and supportable assumptions and that the resulting estimates are reasonable for use in the preparation of the Consolidated Financial Statements. Actual results, however, could differ from those estimates. Recent Accounting Pronouncements Adopted Reporting Discontinued Operations and Disclosures of Disposals of Components of an Entity
In April 2014, the FASB issued accounting guidance which changes the criteria for disposals to qualify as discontinued operations and requires new disclosures about disposals of both discontinued operations and certain other disposals that do not meet the new definition. This accounting guidance was effective for fiscal years beginning on or after December 15, 2014 and interim periods within those years on a prospective basis. The adoption of this accounting guidance in the first quarter of 2016 did not have a significant impact on the
consolidated financial position or results of operations. Recent Accounting Pronouncements Not Yet Adopted Revenue Recognition
In May 2014, the FASB issued accounting guidance which clarifies the principles for recognizing revenue
and provides a comprehensive model for revenue recognition. Revenue recognition should depict the transfer of goods or services to a customer at an amount that reflects the consideration it expects to receive in exchange for those goods or services. The guidance also requires additional disclosures about the nature, amount, timing and uncertainty of revenue and cash flows arising from customer contracts. This accounting guidance is effective for fiscal years beginning after December 15, 2017 and interim periods within those years. Early application is permitted for fiscal years beginning after December 15, 2016. A company may apply this accounting guidance either retrospectively or using the cumulative effect transition method. The Company is currently evaluating the impact of adopting this accounting guidance in the first quarter of 2019. Debt Issuance Costs
In April 2015, the FASB issued accounting guidance which requires debt issuance costs to be presented in the balance sheet as a reduction of the related debt liability rather than as an asset. This accounting guidance is effective for fiscal years beginning after December 15, 2015, and interim periods within those years on a retrospective basis. Early application is permitted. Since this accounting guidance does not provide guidance on debt issuance costs related to revolving debt agreements, this accounting guidance is not expected to have
the first quarter of 2017.
Inventory
In July 2015, the FASB issued accounting guidance which requires companies to measure certain inventory at the lower of cost and net realizable value. This accounting guidance does not apply to inventories measured by using either the last-in, first-out method or the retail inventory method. This accounting guidance is effective for fiscal years beginning after December 15, 2016, and interim periods within those years on a prospective basis. Early application is permitted. The Company is currently evaluating the impact of adopting this accounting guidance in the first period of 2018.
55
Deferred Taxes
In November 2015, in order to simplify the presentation of deferred income taxes, the FASB issued accounting guidance which requires deferred tax liabilities and assets to be classified as noncurrent in the balance sheet. This accounting guidance is effective for fiscal years beginning after December 15, 2016, and interim periods within those years. This accounting guidance may be applied either prospectively to all deferred tax liabilities and assets or retrospectively to all periods presented. Early application is permitted. The Company is currently evaluating the impact of adopting this accounting guidance in the first quarter of 2018.
Leases
In February 2016, the FASB issued accounting guidance which requires the recognition of lease assets and
lease liabilities on the balance sheet and disclosure of key information about leasing arrangements. The accounting guidance is effective for fiscal years beginning after December 15, 2018 and interim periods within those fiscal years on a modified retrospective basis. Early adoption is permitted. The Company is currently evaluating the impact of adopting this accounting guidance in the first quarter of 2020.
Recognition of Breakage for Certain Prepaid Stored-Value Products
In March 2016, in order to address diversity in practice related to the derecognition of a prepaid stored-
value product liability, the FASB issued accounting guidance requiring breakage for prepaid stored-value product liabilities to be accounted for consistent with the breakage guidance in the revenue recognition
fiscal years beginning after December 15, 2017, and interim periods within those years. This accounting guidance may be applied either on a modified retrospective basis or on a retrospective basis. Early application is permitted. The Company is currently evaluating the impact of adopting this accounting guidance in the first quarter of 2019.
Share-Based Payments
In March 2016, the FASB issued accounting guidance in order to simplify certain aspects of the accounting
and presentation of share-based payments, including the income tax consequences, classification of awards as either equity or liabilities and classification on the statement of cash flows. This accounting guidance is effective for fiscal periods beginning after December 15, 2016, and interim periods within those years. This guidance may be applied either on a prospective basis, retrospective basis or a modified retrospective basis depending on the specific accounting topic covered in the accounting guidance. Early adoption is permitted. The Company is currently evaluating the impact of adopting this accounting guidance in the first quarter of 2018. 3. Fair Value Measurements
Fair value is defined as the price that would be received to sell an asset or paid to transfer a liability in an orderly transaction between market participants at the measurement date. In determining fair value, a three level hierarchy for inputs is used. These levels are:
Quoted Prices in Active Markets for I Level 1 quoted prices (unadjusted) for an identical asset or liability in an active market.
Level 2 quoted prices for a similar asset or liability in an active market or model-derived valuations in which all significant inputs are observable for substantially the full term of the asset or liability.
Level 3 unobservable and significant to the fair value measurement of the asset or liability.
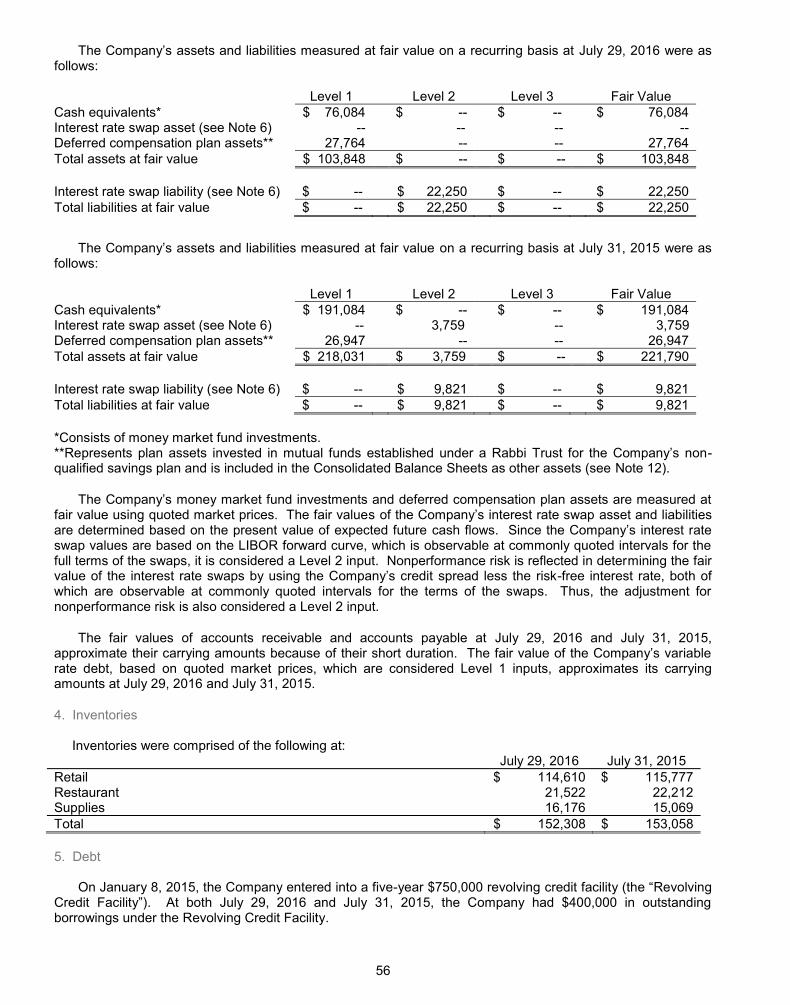
56
July 29, 2016 were as follows:
Level 1
Level 2
Level 3 Fair Value Cash equivalents* $ 76,084 $ -- $ -- $ 76,084 Interest rate swap asset (see Note 6) -- -- -- -- Deferred compensation plan assets** 27,764 -- -- 27,764 Total assets at fair value $ 103,848 $ -- $ -- $ 103,848 Interest rate swap liability (see Note 6) $ -- $ 22,250 $ -- $ 22,250 Total liabilities at fair value $ -- $ 22,250 $ -- $ 22,250
on a recurring basis at July 31, 2015 were as follows:
Level 1
Level 2
Level 3 Fair Value Cash equivalents* $ 191,084 $ -- $ -- $ 191,084 Interest rate swap asset (see Note 6) -- 3,759 -- 3,759 Deferred compensation plan assets** 26,947 -- -- 26,947 Total assets at fair value $ 218,031 $ 3,759 $ -- $ 221,790 Interest rate swap liability (see Note 6) $ -- $ 9,821 $ -- $ 9,821 Total liabilities at fair value $ -- $ 9,821 $ -- $ 9,821
*Consists of money market fund investments.
-qualified savings plan and is included in the Consolidated Balance Sheets as other assets (see Note 12).
ney market fund investments and deferred compensation plan assets are measured at fair value using quoted market prices. The fair values asset and liabilities are determined based on the present value of expected future cash flows. swap values are based on the LIBOR forward curve, which is observable at commonly quoted intervals for the full terms of the swaps, it is considered a Level 2 input. Nonperformance risk is reflected in determining the fair
-free interest rate, both of which are observable at commonly quoted intervals for the terms of the swaps. Thus, the adjustment for nonperformance risk is also considered a Level 2 input.
The fair values of accounts receivable and accounts payable at July 29, 2016 and July 31, 2015,
rate debt, based on quoted market prices, which are considered Level 1 inputs, approximates its carrying amounts at July 29, 2016 and July 31, 2015.
4. Inventories Inventories were comprised of the following at:
July 29, 2016 July 31, 2015 Retail $ 114,610 $ 115,777 Restaurant 21,522 22,212 Supplies 16,176 15,069 Total $ 152,308 $ 153,058 5. Debt
On January 8, 2015, the Company entered into a five-year $750,000 revolving Revolving Credit . At both July 29, 2016 and July 31, 2015, the Company had $400,000 in outstanding borrowings under the Revolving Credit Facility.
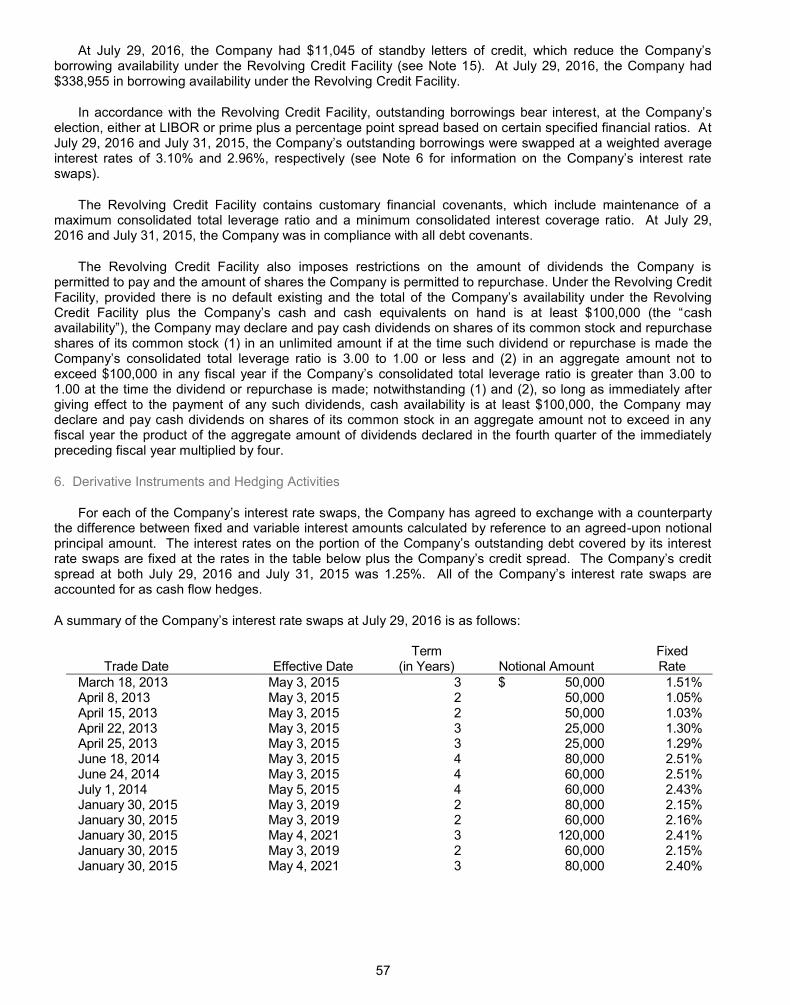
57
At July 29, 2016, the Company had $11,045 borrowing availability under the Revolving Credit Facility (see Note 15). At July 29, 2016, the Company had $338,955 in borrowing availability under the Revolving Credit Facility.
In accordance with the Revolving Credit Facility, outstanding borrowings bear intereselection, either at LIBOR or prime plus a percentage point spread based on certain specified financial ratios. At July 29, 2016 and July 31, 2015 a weighted average interest rates of 3.10% and 2.96%, respectively swaps).
The Revolving Credit Facility contains customary financial covenants, which include maintenance of a maximum consolidated total leverage ratio and a minimum consolidated interest coverage ratio. At July 29, 2016 and July 31, 2015, the Company was in compliance with all debt covenants.
The Revolving Credit Facility also imposes restrictions on the amount of dividends the Company is permitted to pay and the amount of shares the Company is permitted to repurchase. Under the Revolving Credit Facility, provided there is no default existing and the total of the
cash availability , the Company may declare and pay cash dividends on shares of its common stock and repurchase shares of its common stock (1) in an unlimited amount if at the time such dividend or repurchase is made the
00 to 1.00 or less and (2) in an aggregate amount not to
1.00 at the time the dividend or repurchase is made; notwithstanding (1) and (2), so long as immediately after giving effect to the payment of any such dividends, cash availability is at least $100,000, the Company may declare and pay cash dividends on shares of its common stock in an aggregate amount not to exceed in any fiscal year the product of the aggregate amount of dividends declared in the fourth quarter of the immediately preceding fiscal year multiplied by four.
6. Derivative Instruments and Hedging Activities
ounterparty the difference between fixed and variable interest amounts calculated by reference to an agreed-upon notional
rate swaps are fixed at spread at both July 29, 2016 and July 31, 2015 was 1.25%. accounted for as cash flow hedges.
rest rate swaps at July 29, 2016 is as follows:
Trade Date
Effective Date
Term (in Years)
Notional Amount
Fixed Rate
March 18, 2013 May 3, 2015 3 $ 50,000 1.51% April 8, 2013 May 3, 2015 2 50,000 1.05% April 15, 2013 May 3, 2015 2 50,000 1.03% April 22, 2013 May 3, 2015 3 25,000 1.30% April 25, 2013 May 3, 2015 3 25,000 1.29% June 18, 2014 May 3, 2015 4 80,000 2.51% June 24, 2014 May 3, 2015 4 60,000 2.51% July 1, 2014 May 5, 2015 4 60,000 2.43% January 30, 2015 May 3, 2019 2 80,000 2.15% January 30, 2015 May 3, 2019 2 60,000 2.16% January 30, 2015 May 4, 2021 3 120,000 2.41% January 30, 2015 May 3, 2019 2 60,000 2.15% January 30, 2015 May 4, 2021 3 80,000 2.40%
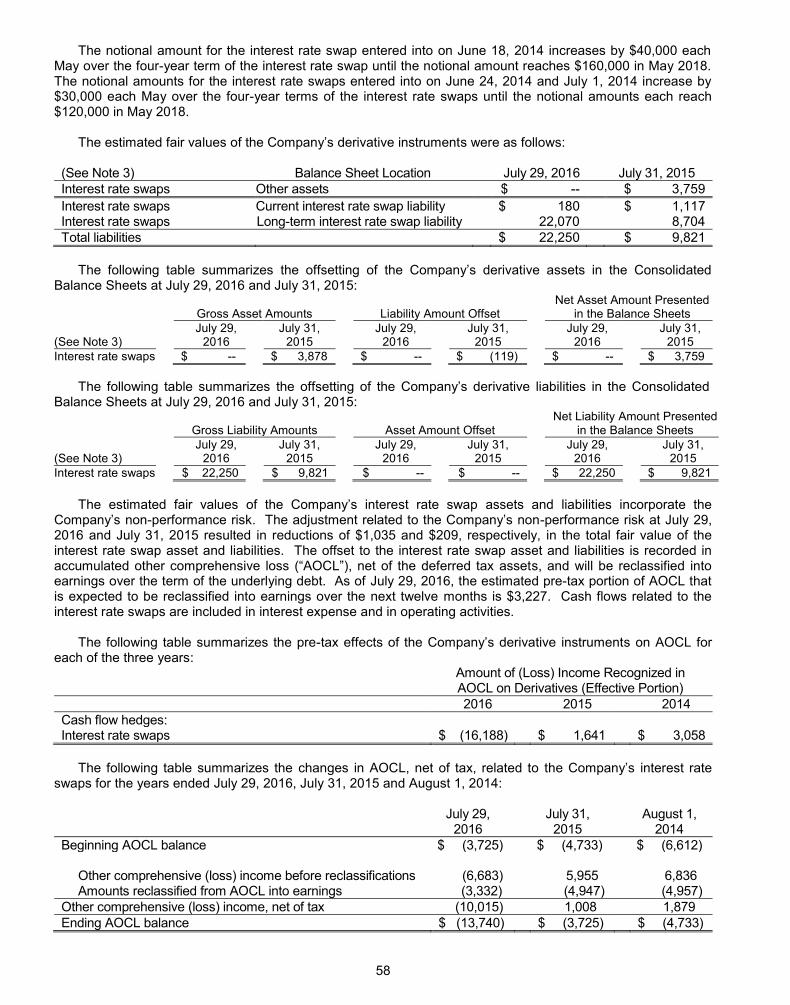
58
The notional amount for the interest rate swap entered into on June 18, 2014 increases by $40,000 each May over the four-year term of the interest rate swap until the notional amount reaches $160,000 in May 2018. The notional amounts for the interest rate swaps entered into on June 24, 2014 and July 1, 2014 increase by $30,000 each May over the four-year terms of the interest rate swaps until the notional amounts each reach $120,000 in May 2018.
The estimated fair va s were as follows:
(See Note 3) Balance Sheet Location July 29, 2016 July 31, 2015 Interest rate swaps Other assets $ -- $ 3,759 Interest rate swaps Current interest rate swap liability $ 180 $ 1,117 Interest rate swaps Long-term interest rate swap liability 22,070 8,704 Total liabilities $ 22,250 $ 9,821
The following table summarizes
Balance Sheets at July 29, 2016 and July 31, 2015:
Gross Asset Amounts
Liability Amount Offset Net Asset Amount Presented
in the Balance Sheets
(See Note 3) July 29,
2016 July 31,
2015 July 29,
2016 July 31,
2015 July 29,
2016 July 31,
2015 Interest rate swaps $ -- $ 3,878 $ -- $ (119) $ -- $ 3,759
The following table summarizes Balance Sheets at July 29, 2016 and July 31, 2015:
Gross Liability Amounts
Asset Amount Offset Net Liability Amount Presented
in the Balance Sheets
(See Note 3) July 29,
2016 July 31,
2015 July 29,
2016 July 31,
2015 July 29,
2016 July 31,
2015 Interest rate swaps $ 22,250 $ 9,821 $ -- $ -- $ 22,250 $ 9,821
The estimated fair values assets and liabilities incorporate the
- -performance risk at July 29, 2016 and July 31, 2015 resulted in reductions of $1,035 and $209, respectively, in the total fair value of the interest rate swap asset and liabilities. The offset to the interest rate swap asset and liabilities is recorded in
s, and will be reclassified into earnings over the term of the underlying debt. As of July 29, 2016, the estimated pre-tax portion of AOCL that is expected to be reclassified into earnings over the next twelve months is $3,227. Cash flows related to the interest rate swaps are included in interest expense and in operating activities.
The following table summarizes the pre- s on AOCL for
each of the three years: Amount of (Loss) Income Recognized in
AOCL on Derivatives (Effective Portion) 2016 2015 2014 Cash flow hedges: Interest rate swaps $ (16,188) $ 1,641 $ 3,058
The following table summarizes the changes in AOCL, net of tax, related to interest rate
swaps for the years ended July 29, 2016, July 31, 2015 and August 1, 2014:
July 29, 2016
July 31, 2015
August 1, 2014
Beginning AOCL balance $ (3,725) $ (4,733) $ (6,612) Other comprehensive (loss) income before reclassifications (6,683) 5,955 6,836 Amounts reclassified from AOCL into earnings (3,332) (4,947) (4,957)
Other comprehensive (loss) income, net of tax (10,015) 1,008 1,879 Ending AOCL balance $ (13,740) $ (3,725) $ (4,733)
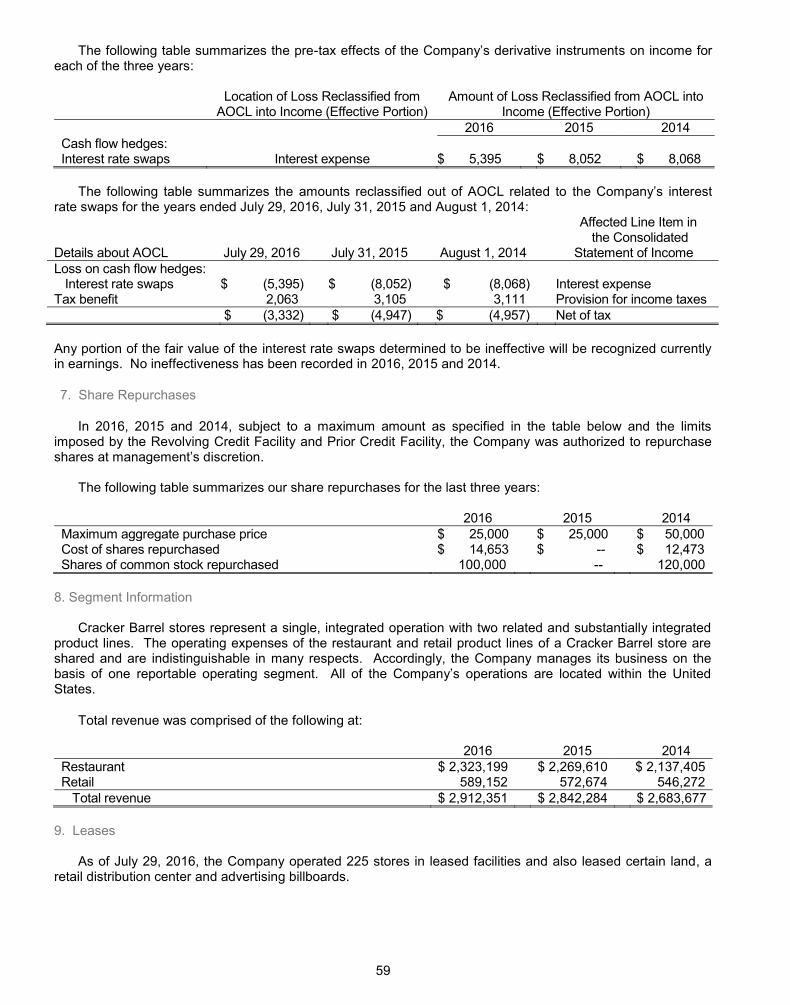
59
The following table summarizes the pre- s on income for each of the three years:
Location of Loss Reclassified from
AOCL into Income (Effective Portion) Amount of Loss Reclassified from AOCL into
Income (Effective Portion) 2016 2015 2014 Cash flow hedges: Interest rate swaps Interest expense $ 5,395 $ 8,052 $ 8,068
The following table summarizes the amounts reclassified out of AOCL related to interest
rate swaps for the years ended July 29, 2016, July 31, 2015 and August 1, 2014: Affected Line Item in
the Consolidated Details about AOCL July 29, 2016 July 31, 2015 August 1, 2014 Statement of Income Loss on cash flow hedges:
Interest rate swaps $ (5,395) $ (8,052) $ (8,068) Interest expense Tax benefit 2,063 3,105 3,111 Provision for income taxes
$ (3,332) $ (4,947) $ (4,957) Net of tax
Any portion of the fair value of the interest rate swaps determined to be ineffective will be recognized currently in earnings. No ineffectiveness has been recorded in 2016, 2015 and 2014.
7. Share Repurchases
In 2016, 2015 and 2014, subject to a maximum amount as specified in the table below and the limits imposed by the Revolving Credit Facility and Prior Credit Facility, the Company was authorized to repurchase shares at .
The following table summarizes our share repurchases for the last three years:
2016 2015 2014 Maximum aggregate purchase price $ 25,000 $ 25,000 $ 50,000 Cost of shares repurchased $ 14,653 $ -- $ 12,473 Shares of common stock repurchased 100,000 -- 120,000
8. Segment Information
Cracker Barrel stores represent a single, integrated operation with two related and substantially integrated
product lines. The operating expenses of the restaurant and retail product lines of a Cracker Barrel store are shared and are indistinguishable in many respects. Accordingly, the Company manages its business on the
States.
Total revenue was comprised of the following at:
2016 2015 2014 Restaurant $ 2,323,199 $ 2,269,610 $ 2,137,405 Retail 589,152 572,674 546,272
Total revenue $ 2,912,351 $ 2,842,284 $ 2,683,677 9. Leases
As of July 29, 2016, the Company operated 225 stores in leased facilities and also leased certain land, a
retail distribution center and advertising billboards.
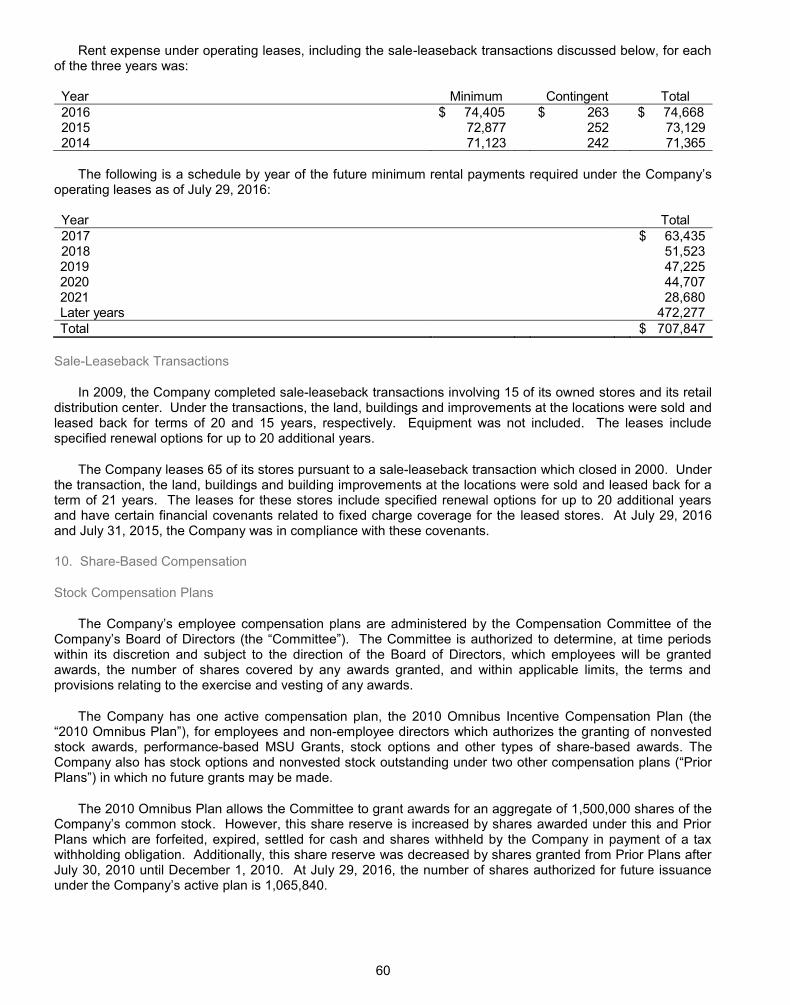
60
Rent expense under operating leases, including the sale-leaseback transactions discussed below, for each of the three years was:
Year Minimum Contingent Total 2016 $ 74,405 $ 263 $ 74,668 2015 72,877 252 73,129 2014 71,123 242 71,365
The following is a schedule by year of the future minimum rental payments required under
operating leases as of July 29, 2016:
Year Total 2017 $ 63,435 2018 51,523 2019 47,225 2020 44,707 2021 28,680 Later years 472,277 Total $ 707,847
Sale-Leaseback Transactions
In 2009, the Company completed sale-leaseback transactions involving 15 of its owned stores and its retail distribution center. Under the transactions, the land, buildings and improvements at the locations were sold and leased back for terms of 20 and 15 years, respectively. Equipment was not included. The leases include specified renewal options for up to 20 additional years.
The Company leases 65 of its stores pursuant to a sale-leaseback transaction which closed in 2000. Under the transaction, the land, buildings and building improvements at the locations were sold and leased back for a term of 21 years. The leases for these stores include specified renewal options for up to 20 additional years and have certain financial covenants related to fixed charge coverage for the leased stores. At July 29, 2016 and July 31, 2015, the Company was in compliance with these covenants.
10. Share-Based Compensation
Stock Compensation Plans
within its discretion and subject to the direction of the Board of Directors, which employees will be granted awards, the number of shares covered by any awards granted, and within applicable limits, the terms and provisions relating to the exercise and vesting of any awards.
The Company has one active compensation plan, the 2010 Omnibus Incentive Compensation Plan (the for employees and non-employee directors which authorizes the granting of nonvested
stock awards, performance-based MSU Grants, stock options and other types of share-based awards. The Company also has stock options and nonvested stock outstanding under two other compensation plans
in which no future grants may be made.
The 2010 Omnibus Plan allows the Committee to grant awards for an aggregate of 1,500,000 shares of the . However, this share reserve is increased by shares awarded under this and Prior
Plans which are forfeited, expired, settled for cash and shares withheld by the Company in payment of a tax withholding obligation. Additionally, this share reserve was decreased by shares granted from Prior Plans after July 30, 2010 until December 1, 2010. At July 29, 2016, the number of shares authorized for future issuance
plan is 1,065,840.
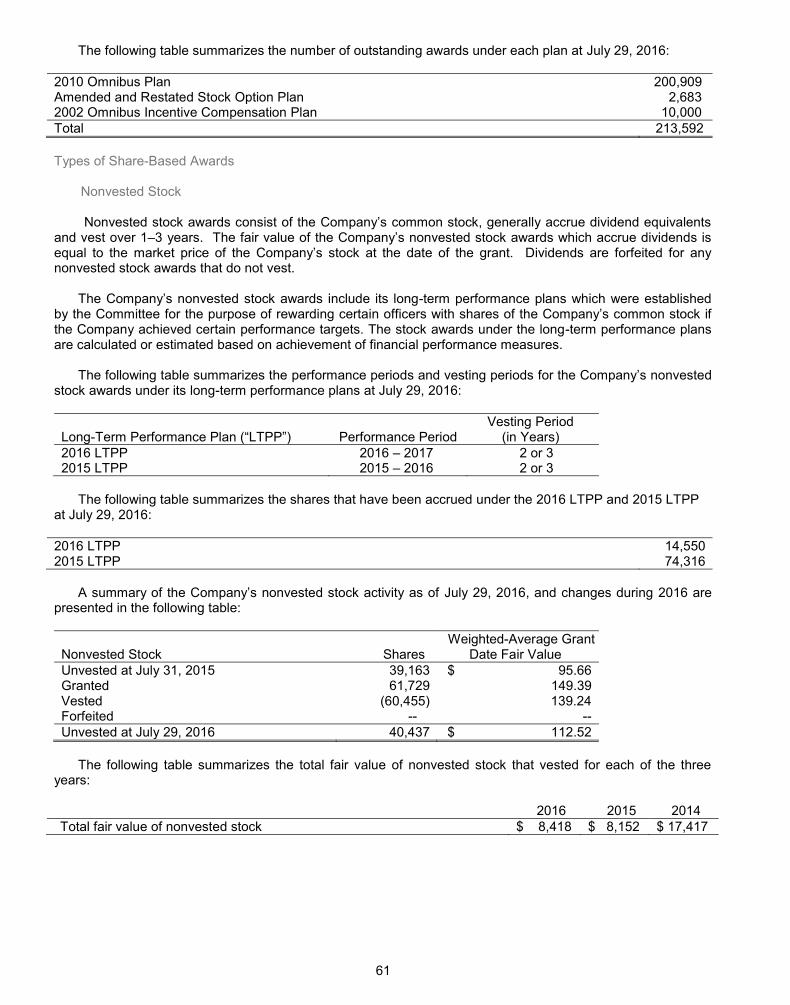
61
The following table summarizes the number of outstanding awards under each plan at July 29, 2016:
2010 Omnibus Plan 200,909 Amended and Restated Stock Option Plan 2,683 2002 Omnibus Incentive Compensation Plan 10,000 Total 213,592 Types of Share-Based Awards
Nonvested Stock
and vest over 1equal to the nonvested stock awards that do not vest.
-term performance plans which were established
by the Committee the Company achieved certain performance targets. The stock awards under the long-term performance plans are calculated or estimated based on achievement of financial performance measures.
The following table summarizes the performance periods and vesting periods for the nonvested
stock awards under its long-term performance plans at July 29, 2016:
Long- Performance Period Vesting Period
(in Years) 2016 LTPP 2016 2017 2 or 3 2015 LTPP 2015 2016 2 or 3
The following table summarizes the shares that have been accrued under the 2016 LTPP and 2015 LTPP
at July 29, 2016: 2016 LTPP 14,550 2015 LTPP 74,316
July 29, 2016, and changes during 2016 are
presented in the following table:
Nonvested Stock Shares Weighted-Average Grant
Date Fair Value Unvested at July 31, 2015 39,163 $ 95.66 Granted 61,729 149.39 Vested (60,455) 139.24 Forfeited -- -- Unvested at July 29, 2016 40,437 $ 112.52
The following table summarizes the total fair value of nonvested stock that vested for each of the three
years: 2016 2015 2014 Total fair value of nonvested stock $ 8,418 $ 8,152 $ 17,417
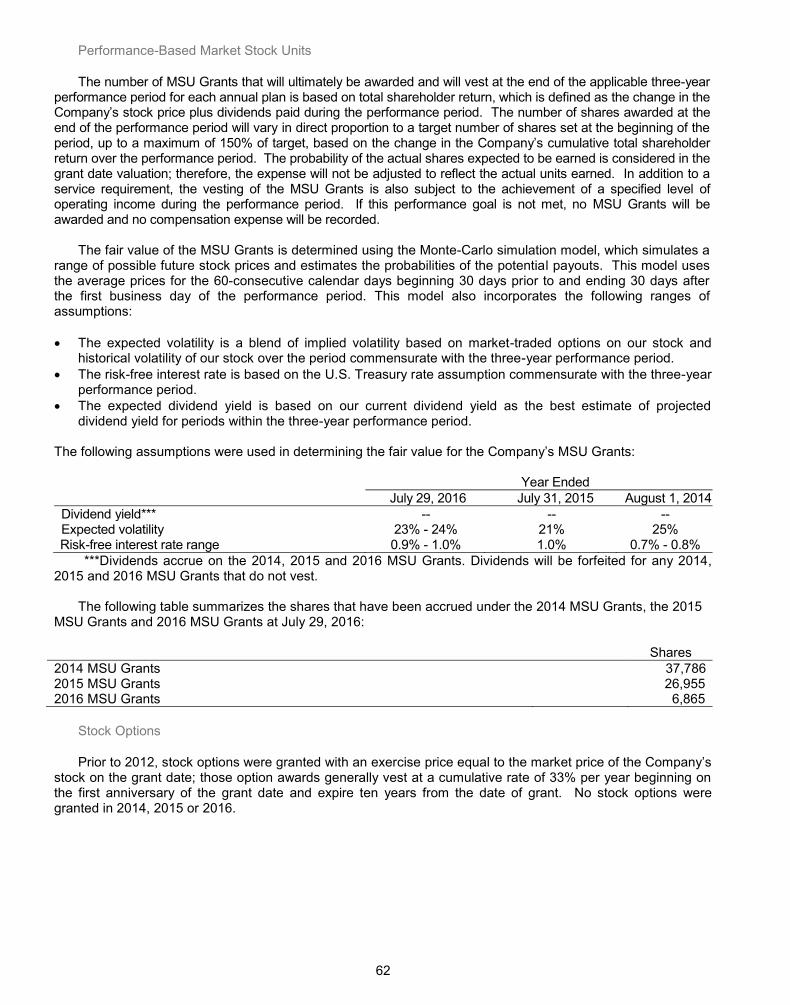
62
Performance-Based Market Stock Units
The number of MSU Grants that will ultimately be awarded and will vest at the end of the applicable three-year performance period for each annual plan is based on total shareholder return, which is defined as the change in the
ng the performance period. The number of shares awarded at the end of the performance period will vary in direct proportion to a target number of shares set at the beginning of the period, up to a maximum of 150% of target, based on the change in the Comp total shareholder return over the performance period. The probability of the actual shares expected to be earned is considered in the grant date valuation; therefore, the expense will not be adjusted to reflect the actual units earned. In addition to a service requirement, the vesting of the MSU Grants is also subject to the achievement of a specified level of operating income during the performance period. If this performance goal is not met, no MSU Grants will be awarded and no compensation expense will be recorded.
The fair value of the MSU Grants is determined using the Monte-Carlo simulation model, which simulates a
range of possible future stock prices and estimates the probabilities of the potential payouts. This model uses the average prices for the 60-consecutive calendar days beginning 30 days prior to and ending 30 days after the first business day of the performance period. This model also incorporates the following ranges of assumptions:
The expected volatility is a blend of implied volatility based on market-traded options on our stock and
historical volatility of our stock over the period commensurate with the three-year performance period. The risk-free interest rate is based on the U.S. Treasury rate assumption commensurate with the three-year
performance period. The expected dividend yield is based on our current dividend yield as the best estimate of projected
dividend yield for periods within the three-year performance period.
The following assumptions were used in determining the fair value SU Grants: Year Ended July 29, 2016 July 31, 2015 August 1, 2014 Dividend yield*** -- -- -- Expected volatility 23% - 24% 21% 25% Risk-free interest rate range 0.9% - 1.0% 1.0% 0.7% - 0.8%
***Dividends accrue on the 2014, 2015 and 2016 MSU Grants. Dividends will be forfeited for any 2014, 2015 and 2016 MSU Grants that do not vest.
The following table summarizes the shares that have been accrued under the 2014 MSU Grants, the 2015 MSU Grants and 2016 MSU Grants at July 29, 2016: Shares 2014 MSU Grants 37,786 2015 MSU Grants 26,955 2016 MSU Grants 6,865
Stock Options
Prior to 2012, stock options were granted with an exercise stock on the grant date; those option awards generally vest at a cumulative rate of 33% per year beginning on the first anniversary of the grant date and expire ten years from the date of grant. No stock options were granted in 2014, 2015 or 2016.
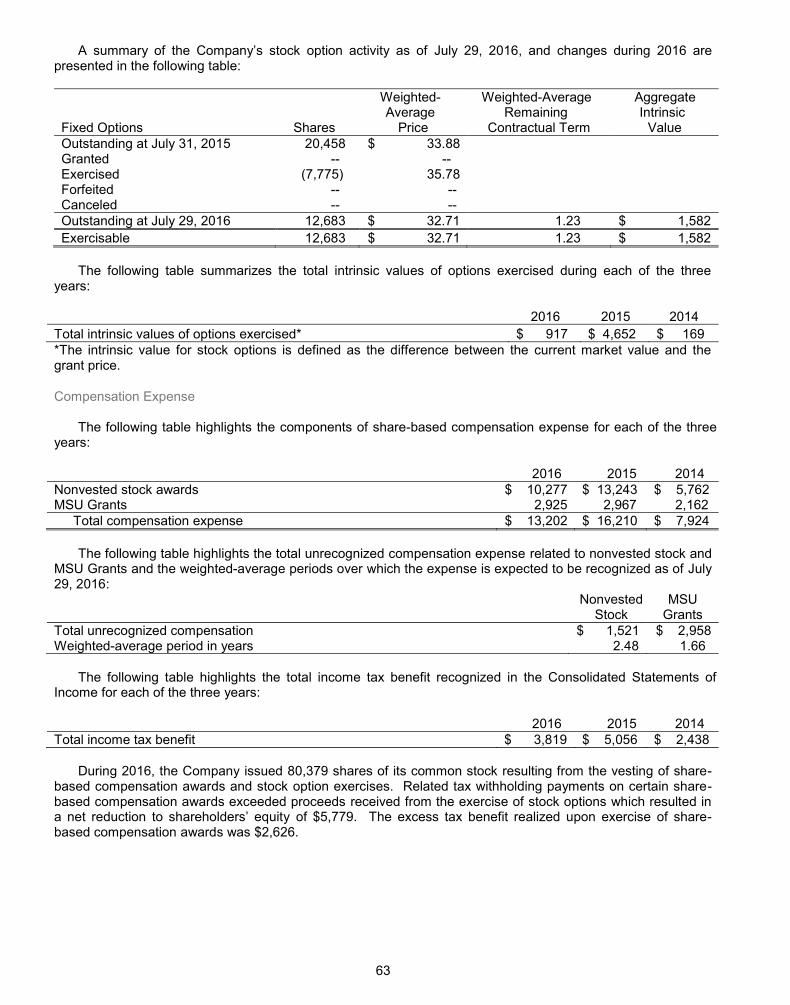
63
July 29, 2016, and changes during 2016 are presented in the following table:
Fixed Options Shares
Weighted- Average
Price
Weighted-Average Remaining
Contractual Term
Aggregate Intrinsic
Value Outstanding at July 31, 2015 20,458 $ 33.88 Granted -- -- Exercised (7,775) 35.78 Forfeited -- -- Canceled -- -- Outstanding at July 29, 2016 12,683 $ 32.71 1.23 $ 1,582 Exercisable 12,683 $ 32.71 1.23 $ 1,582
The following table summarizes the total intrinsic values of options exercised during each of the three
years: 2016 2015 2014 Total intrinsic values of options exercised* $ 917 $ 4,652 $ 169 *The intrinsic value for stock options is defined as the difference between the current market value and the grant price.
Compensation Expense The following table highlights the components of share-based compensation expense for each of the three
years:
2016 2015 2014 Nonvested stock awards $ 10,277 $ 13,243 $ 5,762 MSU Grants 2,925 2,967 2,162
Total compensation expense $ 13,202 $ 16,210 $ 7,924 The following table highlights the total unrecognized compensation expense related to nonvested stock and
MSU Grants and the weighted-average periods over which the expense is expected to be recognized as of July 29, 2016: Nonvested
Stock MSU
Grants Total unrecognized compensation $ 1,521 $ 2,958 Weighted-average period in years 2.48 1.66
The following table highlights the total income tax benefit recognized in the Consolidated Statements of
Income for each of the three years:
2016 2015 2014 Total income tax benefit $ 3,819 $ 5,056 $ 2,438
During 2016, the Company issued 80,379 shares of its common stock resulting from the vesting of share-
based compensation awards and stock option exercises. Related tax withholding payments on certain share-based compensation awards exceeded proceeds received from the exercise of stock options which resulted in
of $5,779. The excess tax benefit realized upon exercise of share-based compensation awards was $2,626.
64
11. Shareholder Rights Plan
On April 9, 2015 tors declared a dividend of one preferred share purchase ) for each outstanding share of common stock, par value $0.01 per share, and adopted a
shareholder rights plan, as set forth in the Rights Agreement dated as of April 9, 2015 by and between the Company and American Stock Transfer & Trust Company, LLC, as rights agent. The dividend was payable on April 20, 2015 to the shareholders of record as of the close of business on April 20, 2015. The Rights Agr
business on April 9, 2015. The 2012 Plan and the preferred share purchase rights issued thereunder expired by their own terms and shareholders of the Company were not entitled to any payment as a result of the expiration of the 2012 Plan. The Rights
The Rights initially trade with, and are inseparable from, the Com
evidenced only by the balances indicated in the book-entry account system of the transfer agent for the
common stock. New Rights will accompany any new shares of common stock the Company issues after April 20, 2015 until the earlier of the Distribution Date, redemption of the Rights by the Board of Directors or the final expiration date of the Rights Agreement, each as described below. Exercise Price
Each Right will allow its holder to purchase from the Company one one-hundredth of a share of Series A Junior Participating Preferred 600.00, once the Rights become exercisable. This portion of a Preferred Share will give the shareholder approximately the same dividend and liquidation rights as would one share of common stock. Prior to exercise, the Right does not give its holder any dividend, voting, or liquidation rights. Exercisability
The Rights will not be exercisable until 10 days after the public announcement that a person or group has ining beneficial ownership of 20 utstanding
common stock. Shares held by affiliates and associates of an Acquiring Person, and Notional Common Shares (as defined
in the Rights Agreement) held by counterparties to a Derivatives Contract (as defined in the Rights Agreement) with an Acquiring Person, will be deemed to be beneficially owned by the Acquiring Person. Certain synthetic interests in securities created by derivative positions whether or not such interests are considered to be ownership of the underlying common stock or are reportable for purposes of Regulation 13D of the Securities Exchange Act equivalent to the economic exposure created by the derivative.
The date when the Rights Until the Distribution Date, the
common stock certificates will evidence the Rights, and any transfer of shares of common stock will constitute a transfer of Rights. After that date, the Rights will separate from the common stock and will be evidenced by book-entry credits or by Rights certificates that the Company will mail to all eligible holders of common stock. Any Rights held by an Acquiring Person will be void and may not be exercised.
At July 29, 2016, none of the Rights were exercisable.
65
Consequences of a Person or Group Becoming an Acquiring Person
If a person or group becomes an Acquiring Person, after the Distribution Date, each Right will generally entitle the holder, except the Acquiring Person or any associate or affiliate thereof, to acquire, for the exercise price of $600.00 per Right (subject to adjustment as provided in the Rights Agreement), shares of the
market value equal to -current exercise price. In addition, if, the Company is later acquired in a merger or similar
transaction after the Distribution Date, each Right will generally entitle the holder, except the Acquiring Person or any associate or affiliate thereof, to acquire, for the exercise price of $600.00 per Right (subject to adjustment as provided in the Rights Agreement), shares of the acquiring corporation having a market value
-current exercise price. Preferred Share Provisions
Each one one-hundredth of a Preferred Share, if issued: will not be redeemable. will entitle holders to quarterly dividend payments of $0.01 per share, or an amount equal to the
dividend paid on one share of common stock, whichever is greater. will entitle holders upon liquidation either to receive $1.00 per share or an amount equal to the payment
made on one share of common stock, whichever is greater. will have the same voting power as one share of common stock. if shares of common stock are exchanged via merger, consolidation, or a similar
transaction, will entitle holders to a per share payment equal to the payment made on one share of common stock.
The value of one one-hundredth of a Preferred Share will generally approximate the value of one share of
common stock.
Redemption
The Board of Directors may redeem the Rights for $0.01 per Right at any time before any person or group becomes an Acquiring Person. If the Board of Directors redeems any Rights, it must redeem all of the Rights. Once the Rights are redeemed, the only right of the holders of Rights will be to receive the redemption price of $0.01 per Right. The redemption price will be adjusted if the Company has a stock split or stock dividends of its common stock. Qualifying Offer Provision
The Rights would also not interfere with all-cash, fully financed tender offers for all shares of common stock
that remain open for a minimum of 60 business days, are subject to a minimum condition of a majority of the outstanding shares and provide for a 20-
of Directors has not redeemed the Rights prior to the consummation of such offer, the consummation of the qualifying offer shall not cause the offeror or its affiliates or associates to become an Acquiring Person, and the Rights will immediately expire upon consummation of the qualifying offer. Exchange
After a person or group becomes an Acquiring Person, but before an Acquiring Person owns 50% or more of outstanding common stock, the Board of Directors may extinguish the Rights by exchanging one share of common stock or an equivalent security for each Right, other than Rights held by the Acquiring Person.
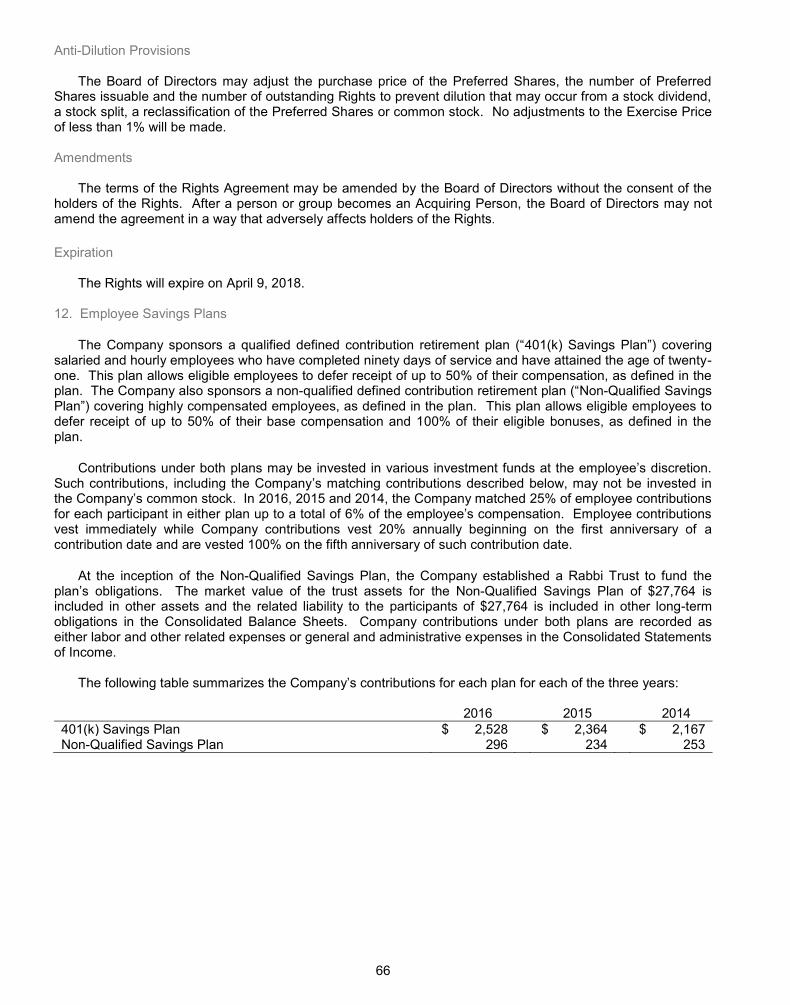
66
Anti-Dilution Provisions
The Board of Directors may adjust the purchase price of the Preferred Shares, the number of Preferred Shares issuable and the number of outstanding Rights to prevent dilution that may occur from a stock dividend, a stock split, a reclassification of the Preferred Shares or common stock. No adjustments to the Exercise Price of less than 1% will be made.
Amendments
The terms of the Rights Agreement may be amended by the Board of Directors without the consent of the
holders of the Rights. After a person or group becomes an Acquiring Person, the Board of Directors may not amend the agreement in a way that adversely affects holders of the Rights. Expiration
The Rights will expire on April 9, 2018.
12. Employee Savings Plans
401(k) Savings Plansalaried and hourly employees who have completed ninety days of service and have attained the age of twenty-one. This plan allows eligible employees to defer receipt of up to 50% of their compensation, as defined in the plan. The Company also sponsors a non- Non-Qualified Savings Plan This plan allows eligible employees to defer receipt of up to 50% of their base compensation and 100% of their eligible bonuses, as defined in the plan.
Contributions under both plans Such contributions, including the Company matching contributions described below, may not be invested in
2016, 2015 and 2014, the Company matched 25% of employee contributions for each participant in either plan vest immediately while Company contributions vest 20% annually beginning on the first anniversary of a contribution date and are vested 100% on the fifth anniversary of such contribution date.
At the inception of the Non-Qualified Savings Plan, the Company established a Rabbi Trust to fund the obligations. The market value of the trust assets for the Non-Qualified Savings Plan of $27,764 is
included in other assets and the related liability to the participants of $27,764 is included in other long-term obligations in the Consolidated Balance Sheets. Company contributions under both plans are recorded as either labor and other related expenses or general and administrative expenses in the Consolidated Statements of Income.
2016 2015 2014 401(k) Savings Plan $ 2,528 $ 2,364 $ 2,167 Non-Qualified Savings Plan 296 234 253
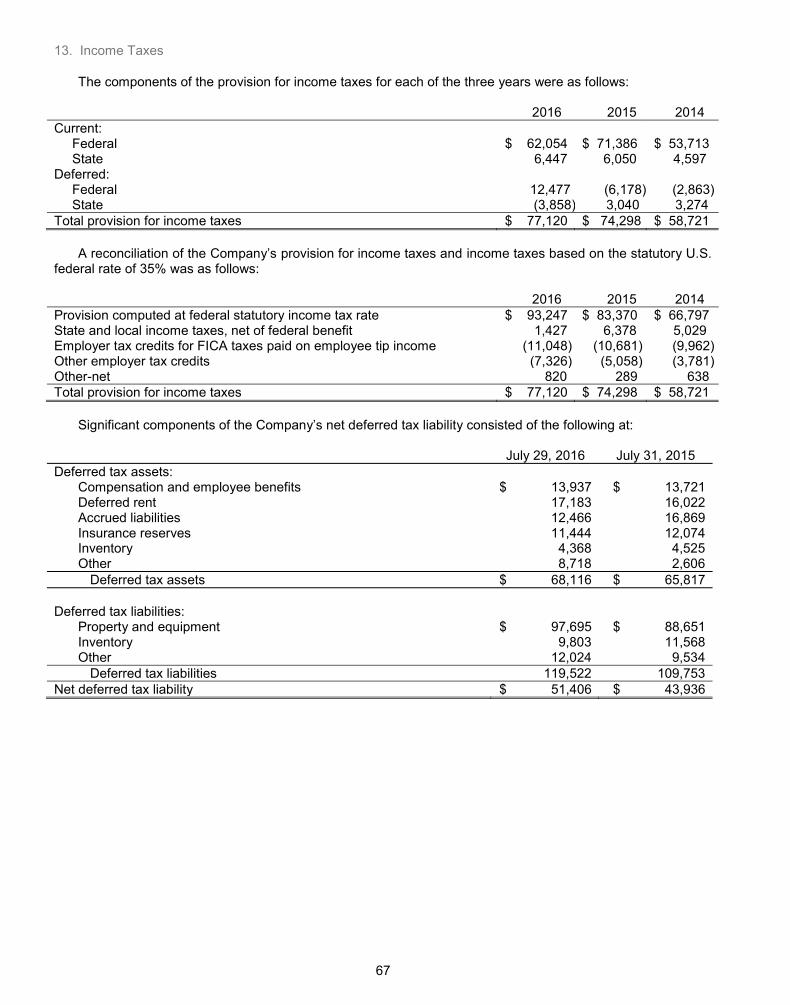
67
13. Income Taxes
The components of the provision for income taxes for each of the three years were as follows:
2016 2015 2014 Current:
Federal $ 62,054 $ 71,386 $ 53,713 State 6,447 6,050 4,597
Deferred: Federal 12,477 (6,178) (2,863) State (3,858) 3,040 3,274
Total provision for income taxes $ 77,120 $ 74,298 $ 58,721 A reconciliation of the provision for income taxes and income taxes based on the statutory U.S.
federal rate of 35% was as follows:
2016 2015 2014 Provision computed at federal statutory income tax rate $ 93,247 $ 83,370 $ 66,797 State and local income taxes, net of federal benefit 1,427 6,378 5,029 Employer tax credits for FICA taxes paid on employee tip income (11,048) (10,681) (9,962) Other employer tax credits (7,326) (5,058) (3,781) Other-net 820 289 638 Total provision for income taxes $ 77,120 $ 74,298 $ 58,721
July 29, 2016 July 31, 2015 Deferred tax assets:
Compensation and employee benefits $ 13,937 $ 13,721 Deferred rent 17,183 16,022 Accrued liabilities 12,466 16,869 Insurance reserves 11,444 12,074 Inventory 4,368 4,525 Other 8,718 2,606
Deferred tax assets $ 68,116 $ 65,817 Deferred tax liabilities:
Property and equipment $ 97,695 $ 88,651 Inventory 9,803 11,568 Other 12,024 9,534
Deferred tax liabilities 119,522 109,753 Net deferred tax liability $ 51,406 $ 43,936
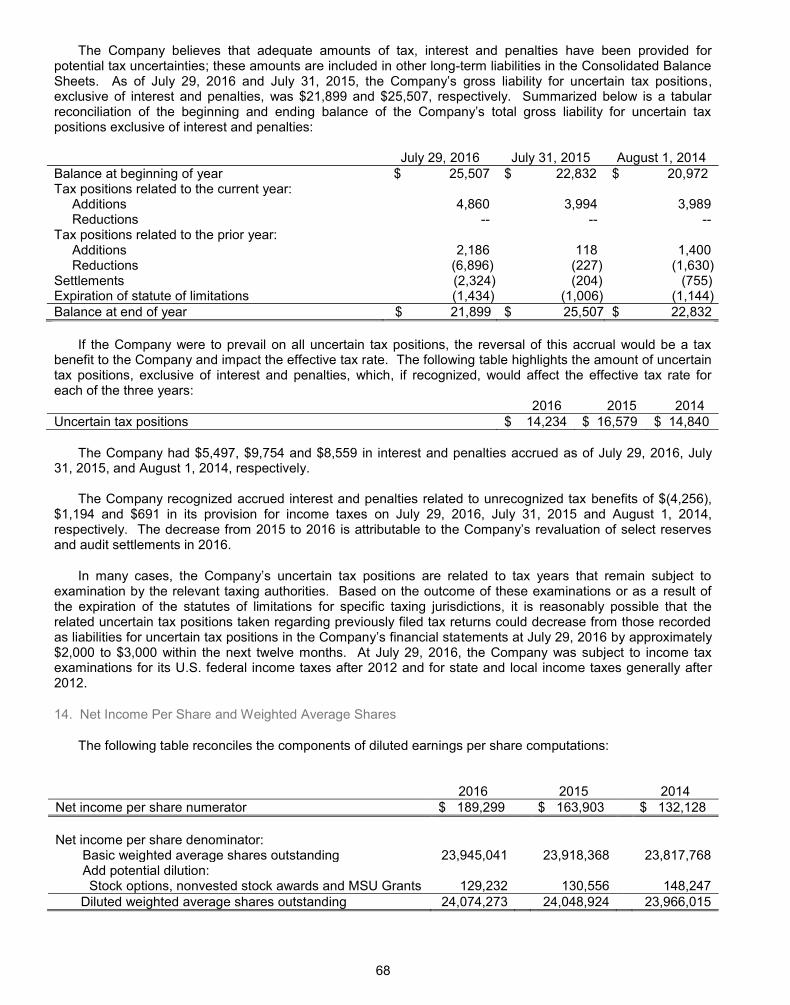
68
The Company believes that adequate amounts of tax, interest and penalties have been provided for potential tax uncertainties; these amounts are included in other long-term liabilities in the Consolidated Balance Sheets. As of July 29, 2016 and July 31, 2015 , exclusive of interest and penalties, was $21,899 and $25,507, respectively. Summarized below is a tabular
positions exclusive of interest and penalties:
July 29, 2016 July 31, 2015 August 1, 2014 Balance at beginning of year $ 25,507 $ 22,832 $ 20,972 Tax positions related to the current year:
Additions
4,860
3,994
3,989 Reductions -- -- --
Tax positions related to the prior year: Additions
2,186
118
1,400
Reductions (6,896) (227) (1,630) Settlements (2,324) (204) (755) Expiration of statute of limitations (1,434) (1,006) (1,144) Balance at end of year $ 21,899 $ 25,507 $ 22,832
If the Company were to prevail on all uncertain tax positions, the reversal of this accrual would be a tax
benefit to the Company and impact the effective tax rate. The following table highlights the amount of uncertain tax positions, exclusive of interest and penalties, which, if recognized, would affect the effective tax rate for each of the three years: 2016 2015 2014 Uncertain tax positions $ 14,234 $ 16,579 $ 14,840
The Company had $5,497, $9,754 and $8,559 in interest and penalties accrued as of July 29, 2016, July
31, 2015, and August 1, 2014, respectively.
The Company recognized accrued interest and penalties related to unrecognized tax benefits of $(4,256), $1,194 and $691 in its provision for income taxes on July 29, 2016, July 31, 2015 and August 1, 2014, respectively. and audit settlements in 2016.
examination by the relevant taxing authorities. Based on the outcome of these examinations or as a result of the expiration of the statutes of limitations for specific taxing jurisdictions, it is reasonably possible that the related uncertain tax positions taken regarding previously filed tax returns could decrease from those recorded
tements at July 29, 2016 by approximately $2,000 to $3,000 within the next twelve months. At July 29, 2016, the Company was subject to income tax examinations for its U.S. federal income taxes after 2012 and for state and local income taxes generally after 2012.
14. Net Income Per Share and Weighted Average Shares
The following table reconciles the components of diluted earnings per share computations:
2016 2015 2014 Net income per share numerator $ 189,299 $ 163,903 $ 132,128 Net income per share denominator:
Basic weighted average shares outstanding 23,945,041 23,918,368 23,817,768 Add potential dilution: Stock options, nonvested stock awards and MSU Grants 129,232 130,556 148,247
Diluted weighted average shares outstanding 24,074,273 24,048,924 23,966,015
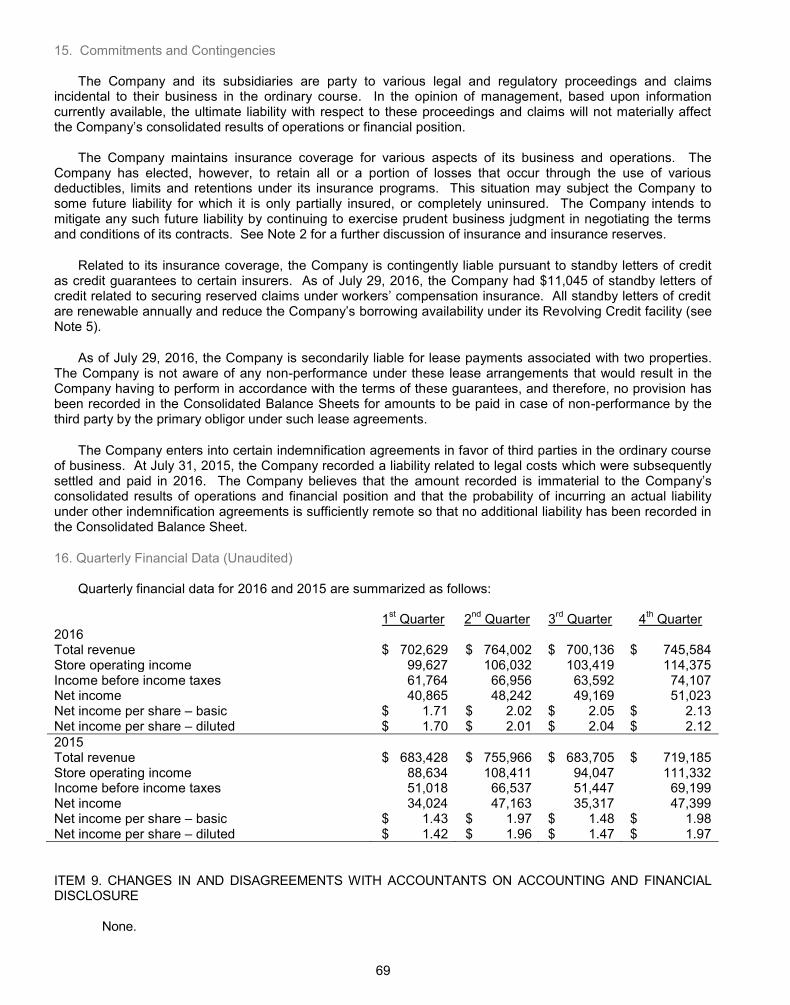
69
15. Commitments and Contingencies The Company and its subsidiaries are party to various legal and regulatory proceedings and claims
incidental to their business in the ordinary course. In the opinion of management, based upon information currently available, the ultimate liability with respect to these proceedings and claims will not materially affect
The Company maintains insurance coverage for various aspects of its business and operations. The
Company has elected, however, to retain all or a portion of losses that occur through the use of various deductibles, limits and retentions under its insurance programs. This situation may subject the Company to some future liability for which it is only partially insured, or completely uninsured. The Company intends to mitigate any such future liability by continuing to exercise prudent business judgment in negotiating the terms and conditions of its contracts. See Note 2 for a further discussion of insurance and insurance reserves.
Related to its insurance coverage, the Company is contingently liable pursuant to standby letters of credit as credit guarantees to certain insurers. As of July 29, 2016, the Company had $11,045 of standby letters of
volving Credit facility (see Note 5).
As of July 29, 2016, the Company is secondarily liable for lease payments associated with two properties. The Company is not aware of any non-performance under these lease arrangements that would result in the Company having to perform in accordance with the terms of these guarantees, and therefore, no provision has been recorded in the Consolidated Balance Sheets for amounts to be paid in case of non-performance by the third party by the primary obligor under such lease agreements.
The Company enters into certain indemnification agreements in favor of third parties in the ordinary course of business. At July 31, 2015, the Company recorded a liability related to legal costs which were subsequently settled and paid in 2016. The Company believes that the consolidated results of operations and financial position and that the probability of incurring an actual liability under other indemnification agreements is sufficiently remote so that no additional liability has been recorded in the Consolidated Balance Sheet.
16. Quarterly Financial Data (Unaudited) Quarterly financial data for 2016 and 2015 are summarized as follows:
1st Quarter 2nd Quarter 3rd Quarter 4th Quarter 2016 Total revenue $ 702,629 $ 764,002 $ 700,136 $ 745,584 Store operating income 99,627 106,032 103,419 114,375 Income before income taxes 61,764 66,956 63,592 74,107 Net income 40,865 48,242 49,169 51,023 Net income per share basic $ 1.71 $ 2.02 $ 2.05 $ 2.13 Net income per share diluted $ 1.70 $ 2.01 $ 2.04 $ 2.12 2015 Total revenue $ 683,428 $ 755,966 $ 683,705 $ 719,185 Store operating income 88,634 108,411 94,047 111,332 Income before income taxes 51,018 66,537 51,447 69,199 Net income 34,024 47,163 35,317 47,399 Net income per share basic $ 1.43 $ 1.97 $ 1.48 $ 1.98 Net income per share diluted $ 1.42 $ 1.96 $ 1.47 $ 1.97 ITEM 9. CHANGES IN AND DISAGREEMENTS WITH ACCOUNTANTS ON ACCOUNTING AND FINANCIAL DISCLOSURE
None.
70
ITEM 9A. CONTROLS AND PROCEDURES
Our management, with the participation of our principal executive and financial officers, including the Chief Executive Officer and the Chief Financial Officer, evaluated the effectiveness of our disclosure controls and procedures (as defined in Rules 13a-15(e) and 15d-15(e) promulgated under the Exchange Act) as of the end of the period covered by this report. Based upon this evaluation, our Chief Executive Officer and Chief Financial Officer each concluded that, as of July 29, 2016, our disclosure controls and procedures were effective.
There have been no changes (including corrective actions with regard to significant deficiencies and material weaknesses) during the quarter ended July 29, 2016 in our internal control over financial reporting (as defined in Exchange Act Rule 13a-15(f)) that have materially affected, or are reasonably likely to materially affect, our internal control over financial reporting.
Control over Financial Reporting
We are responsible for establishing and maintaining adequate internal control over financial reporting (as defined in Rules 13a-15(f) and 15d-15(f) promulgated under the Exchange Act). We maintain a system of internal controls that is designed to provide reasonable assurance in a cost-effective manner as to the fair and reliable preparation and presentation of the consolidated financial statements, as well as to safeguard assets from unauthorized use or disposition.
Our control environment is the foundation for our system of internal control over financial reporting and is embodied in our Corporate Governance Guidelines, our Financial Code of Ethics, and our Code of Business Conduct and Ethics, all of which may be viewed on our website. They set the tone for our organization and include factors such as integrity and ethical values. Our internal control over financial reporting is supported by formal policies and procedures, which are reviewed, modified and improved as changes occur in business conditions and operations. Neither our disclosure controls and procedures nor our internal controls, however, can or will prevent all errors and all fraud. A control system, no matter how well conceived and operated, can provide only reasonable, not absolute, assurance that the objectives of the control system are met. Further, the design of a control system must reflect the benefits of controls relative to their costs. Because of the inherent limitations in all control systems, no evaluation of controls can provide absolute assurance that all control issues and instances of fraud, if any, within the Company have been detected.
We conducted an evaluation of the effectiveness of our internal control over financial reporting based on the framework in Internal Control—Integrated Framework (2013) issued by the Committee of Sponsoring Organizations of the Treadway Commission. This evaluation included review of the documentation of controls, evaluation of the design effectiveness of controls, testing of the operating effectiveness of controls and a conclusion based on this evaluation. We have concluded that our internal control over financial reporting was effective as of July 29, 2016, based on these criteria.
In addition, Deloitte & Touche LLP, an independent registered public accounting firm, has issued an attestation report on our internal control over financial reporting, which is included herein.
/s/Sandra B. Cochran Sandra B. Cochran President and Chief Executive Officer
/s/Jill M. Golder Jill M. Golder Senior Vice President and Chief Financial Officer
71
REPORT OF INDEPENDENT REGISTERED PUBLIC ACCOUNTING FIRM
To the Board of Directors and Shareholders of Cracker Barrel Old Country Store, Inc. Lebanon, Tennessee
We have audited the internal control over financial reporting of Cracker Barrel Old Country Store, Inc. and its subsidiaries (the July 29, 2016, based on criteria established in Internal Control—Integrated Framework (2013) issued by the Committee of Sponsoring Organizations of the Treadway Commission. The
its assessment of the effectiveness of internal control over financial reporting, included in the accompanying
We conducted our audit in accordance with the standards of the Public Company Accounting Oversight Board (United States). Those standards require that we plan and perform the audit to obtain reasonable assurance about whether effective internal control over financial reporting was maintained in all material respects. Our audit included obtaining an understanding of internal control over financial reporting, assessing the risk that a material weakness exists, testing and evaluating the design and operating effectiveness of internal control based on the assessed risk, and performing other procedures as we considered necessary in the circumstances. We believe that our audit provides a reasonable basis for our opinion.
upervision of, the
assurance regarding the reliability of financial reporting and the preparation of financial statements for external
financial reporting includes those policies and procedures that (1) pertain to the maintenance of records that, in reasonable detail, accurately and fairly reflect the transactions and dispositions of the assets of the company; (2) provide reasonable assurance that transactions are recorded as necessary to permit preparation of financial statements in accordance with generally accepted accounting principles, and that receipts and expenditures of the company are being made only in accordance with authorizations of management and directors of the company; and (3) provide reasonable assurance regarding prevention or timely detection of unauthorized
statements.
Because of the inherent limitations of internal control over financial reporting, including the possibility of collusion or improper management override of controls, material misstatements due to error or fraud may not be prevented or detected on a timely basis. Also, projections of any evaluation of the effectiveness of the internal control over financial reporting to future periods are subject to the risk that the controls may become inadequate because of changes in conditions, or that the degree of compliance with the policies or procedures may deteriorate.
In our opinion, the Company maintained, in all material respects, effective internal control over financial reporting as of July 29, 2016, based on the criteria established in Internal Control—Integrated Framework (2013) issued by the Committee of Sponsoring Organizations of the Treadway Commission.
We have also audited, in accordance with the standards of the Public Company Accounting Oversight Board (United States), the consolidated financial statements of the Company as of and for the year ended July 29, 2016, and our report dated September 26, 2016 expressed an unqualified opinion on those consolidated financial statements.
/s/ Deloitte & Touche LLP Nashville, Tennessee September 26, 2016
72
ITEM 9B. OTHER INFORMATION None
PART III ITEM 10. DIRECTORS, EXECUTIVE OFFICERS AND CORPORATE GOVERNANCE
The information required by this Item with respect to directors of the Company is incorporated herein by this reference to the following sections of the 2016 Proposal 1: Election of Directors,
Relationships and Related Transactions Code of Ethics m with respect to executive officers of the Company is set forth in Part I of this Annual Report on Form 10-K under the heading
. ITEM 11. EXECUTIVE COMPENSATION
The information required by this Item is incorporated herein by this reference to the following sections of the 2016 —Compensation of Directors. the section of the 2016 Proxy Statement entitled
purposes of Section 18 of the Exchange Act. ITEM 12. SECURITY OWNERSHIP OF CERTAIN BENEFICIAL OWNERS AND MANAGEMENT AND RELATED STOCKHOLDER MATTERS
The information required by this Item is incorporated herein by this reference to the sections entitled Stock Ownership of Certain Beneficial Owners and Management Equity Compensation Plan Information2016 Proxy Statement. ITEM 13. CERTAIN RELATIONSHIPS AND RELATED TRANSACTIONS, AND DIRECTOR INDEPENDENCE
The information required by this Item is incorporated herein by this reference to the sections entitled Director Independence 2016 Proxy Statement.
ITEM 14. PRINCIPAL ACCOUNTING FEES AND SERVICES
The information required by this Item is incorporated herein 2016 Proxy Statement. No other portion of the section of the
2016 into this Annual Report on Form 10-K.
PART IV ITEM 15. EXHIBITS, AND FINANCIAL STATEMENT SCHEDULES
(a) List of documents filed as part of this report: 1. All financial statements see Item 8. 2. All schedules have been omitted since they are either not required or not applicable, or
the required information is included. 3. The exhibits listed in the accompanying Index to Exhibits immediately following the
signature page to this Annual Report on Form 10-K.
73
SIGNATURES Pursuant to the requirements of Section 13 or 15(d) of the Securities Exchange Act of 1934, the registrant has duly caused this report to be signed on its behalf by the undersigned, thereunto duly authorized on this 26th day of September, 2016.
CRACKER BARREL OLD COUNTRY STORE, INC. By:
/s/Sandra B. Cochran Sandra B. Cochran, President and Chief Executive Officer
Pursuant to the requirements of the Securities Exchange Act of 1934, this report has been signed below by the following persons on behalf of the registrant in the capacities on this 26th day of September, 2016. Name Title /s/Sandra B. Cochran Sandra B. Cochran
President, Chief Executive Officer and Director
/s/Jill M. Golder Jill M. Golder
Senior Vice President and Chief Financial Officer (Principal Financial Officer)
/s/Jeffrey M. Wilson Jeffrey M. Wilson
Vice President, Corporate Controller (Principal Accounting Officer)
/s/Thomas H. Barr Thomas H. Barr
Director
/s/James W. Bradford James W. Bradford
Director and Chairman of the Board
/s/Glenn A. Davenport Glenn A. Davenport
Director
/s/Richard J. Dobkin Richard J. Dobkin
Director
/s/Norman E. Johnson Norman E. Johnson
Director
/s/William W. McCarten William W. McCarten
Director
/s/Coleman H. Peterson Coleman H. Peterson
Director
/s/Andrea M. Weiss Andrea M. Weiss
Director
74
INDEX TO EXHIBITS Exhibit 3(I), 4(a) Amended and Restated Charter of Cracker Barrel Old Country Store, Inc. (1) 3(II), 4(b) Amended and Restated Bylaws of Cracker Barrel Old Country Store, Inc. (2) 4(c), 10(a) Credit Agreement, dated as of January 8, 2015, among Cracker Barrel Old Country Store, Inc.,
the Subsidiary Guarantors named therein, the Lenders party thereto, and Wells Fargo Bank, National Association as Administrative Agent and Collateral Agent (3)
4(d) Rights Agreement, dated as of April 9, 2015, between Cracker Barrel Old Country Store, Inc. and
American Stock Transfer & Trust Company, LLC, as rights agent (4) 10(b) Form of Stock Option Award under the CBRL Group, Inc. 2002 Omnibus Incentive
Compensation Plan (5) 10(c) Master Lease, dated July 31, 2000, between Country Stores Property I, LLC, as Lessor, and
Cracker Barrel Old Country Store, Inc., as Lessee, for lease of 21 Cracker Barrel Old Country Store® sites (6)
10(d) Master Lease, dated July 31, 2000, between Country Stores Property I, LLC, as Lessor, and
Cracker Barrel Old Country Store, Inc., as Lessee, for lease of nine Cracker Barrel Old Country Store® sites*
10(e) Master Lease, dated July 31, 2000, between Country Stores Property II, LLC, as Lessor, and
Cracker Barrel Old Country Store, Inc., as Lessee, for lease of 23 Cracker Barrel Old Country Store® sites*
10(f) Master Lease, dated July 31, 2000, between Country Stores Property III, LLC, as Lessor, and
Cracker Barrel Old Country Store, Inc., as Lessee, for lease of 12 Cracker Barrel Old Country Store® sites*
10(g) Cracker Barrel Old Country Store, Inc. Amended and Restated Stock Option Plan (as
amended to date) (7) 10(h) Cracker Barrel Old Country Store, Inc. Corporate Policy Severance Benefits Policy (as
amended to date) (8) 10(i) Cracker Barrel Old Country Store, Inc. 2002 Omnibus Incentive Compensation Plan (as
amended to date) (9) 10(j) Cracker Barrel Old Country Store, Inc. 2010 Omnibus Stock and Incentive Plan (10) 10(k) Cracker Barrel Old Country Store, Inc. Form of Performance-Based Stock Unit Award (11) 10(l) Cracker Barrel Old Country Store, Inc. Non-Qualified Savings Plan (as amended to date) (12) 10(m) Cracker Barrel Old Country Store, Inc. Deferred Compensation Plan (13) 10(n) Amendment to Deferred Compensation Plan (14) 10(o) Executive Employment Agreement with Sandra B. Cochran, dated as of September 26, 2013
(15) 10(p) Cracker Barrel Old Country Store, Inc. Form of Restricted Stock Award Notice (16)
75
10(q) Cracker Barrel Old Country Store, Inc. and Subsidiaries FY 2014 Long-Term Incentive Program(17)
10(r) Cracker Barrel Old Country Store, Inc. and Subsidiaries FY 2015 Long-Term Incentive Program
(18) 10(s) Form of Change in Control and Severance Agreement between Cracker Barrel Old Country
Store, Inc. and certain of its named officers (19) 10(t) Change in Control and Severance Agreement with Edward A. Greene, dated May 22, 2015 ** 10(u) Change in Control and Severance Agreement with Christopher A. Ciavarra, dated May 22,
2015 ** 10(v) Change in Control and Severance Agreement with Lawrence E. Hyatt, dated May 22, 2015 ** 10(w) Change in Control and Severance Agreement with Nicholas V. Flanagan, dated May 22,
2015 ** 10(x) Retirement Agreement with Lawrence E. Hyatt, dated as of September 25, 2015 (20) 10(y) Cracker Barrel Old Country Store, Inc. and Subsidiaries FY 2016 Annual Bonus Plan (21) 10(z) Cracker Barrel Old Country Store, Inc. and Subsidiaries FY 2016 Long-Term Incentive Program
(22) 10(aa) Change in Control and Severance Agreement with Jill Golder, dated April 28, 2016 (23) 21 Subsidiaries of the Registrant (filed herewith) 23 Consent of Independent Registered Public Accounting Firm - Deloitte & Touche LLP (filed
herewith) 31.1 Certification of Chief Executive Officer pursuant to Section 302 of the Sarbanes-Oxley Act of
2002 (filed herewith) 31.2 Certification of Chief Financial Officer pursuant to Section 302 of the Sarbanes-Oxley Act of
2002 (filed herewith) 32.1 Certification of Chief Executive Officer pursuant to Section 906 of the Sarbanes-Oxley Act of
2002 (filed herewith) 32.2 Certification of Chief Financial Officer pursuant to Section 906 of the Sarbanes-Oxley Act of
2002 (filed herewith) 101.INS XBRL Instance Document (filed herewith) 101.SCH XBRL Taxonomy Extension Schema (filed herewith) 101.CAL XBRL Taxonomy Extension Calculation Linkbase (filed herewith) 101.LAB XBRL Taxonomy Extension Label Linkbase (filed herewith) 101.PRE XBRL Taxonomy Extension Presentation Linkbase (filed herewith) 101.DEF XBRL Taxonomy Extension Definition Linkbase (filed herewith)
76
(1) Incorporated by reference to Exhibit 3.1 to the Company's Current Report on Form 8-K filed under the Exchange Act on April 10, 2012.
(2) Incorporated by reference to Exhibit 3.1 -K filed under the
Exchange Act on February 24, 2012. (3) -K filed under the
Exchange Act on January 9, 2015. (4) Incorporated by reference to Exhibit 4.1 Current Report on Form 8-K filed under the
Exchange Act on April 9, 2015. (5) -K filed under the
Exchange Act for the fiscal year ended July 29, 2005 (Commission File No. 000-25225). (6) Incorporated by reference to Exhibit 10(r) -K filed under
the Exchange Act for the fiscal year ended July 28, 2000 (Commission File No. 000-25225). (7) -Q filed under
the Exchange Act for the quarterly period ended January 30, 2009 (Commission File No. 000-25225). (8) Incorporated by reference to Exhibit 10.1 to the -Q filed under
the Exchange Act for the quarterly period ended May 1, 2009 (Commission File No. 000-25225). (9) -Q filed under
the Exchange Act for the quarterly period ended January 29, 2010 (Commission File No. 000-25225). (10) -K filed under the
Exchange Act on December 7, 2010 (Commission File No. 000-25225). (11) -K filed under the
Exchange Act on December 7, 2010 (Commission File No. 000-25225). (12) -K filed under
the Exchange Act for the fiscal year ended July 29, 2011. (13) -K filed under
the Exchange Act for the fiscal year ended July 29, 2011. (14) -K filed under
the Exchange Act for the fiscal year ended July 29, 2011. (15) -K filed under
the Exchange Act for the fiscal year ended August 2, 2013. (16) Incorporated by reference to Exhibit 10.3 -K filed under the
Exchange Act on July 31, 2013. (17) -K filed under the
Exchange Act on July 31, 2013. (18) Incorporated by reference to Exhibit 10.2 -K filed under the
Exchange Act on October 7, 2014. (19) -K filed under the
Exchange Act on May 22, 2015. (20) Incorporated -K filed under
the Exchange Act on September 29, 2015.
77
(21) -K filed under the
Exchange Act on September 30, 2015. (22) Incorporated by reference to Exhibit 10.2 -K filed under the
Exchange Act on September 30, 2015. (23) Form 8-K filed under the
Exchange Act on April 29, 2016. *Document not filed because essentially identical in terms and conditions to Exhibit 10(c). **Document not filed because essentially identical in terms and conditions to Exhibit 10(s). Denotes management contract or compensatory plan, contract or arrangement.

78
-BLANK PAGE-
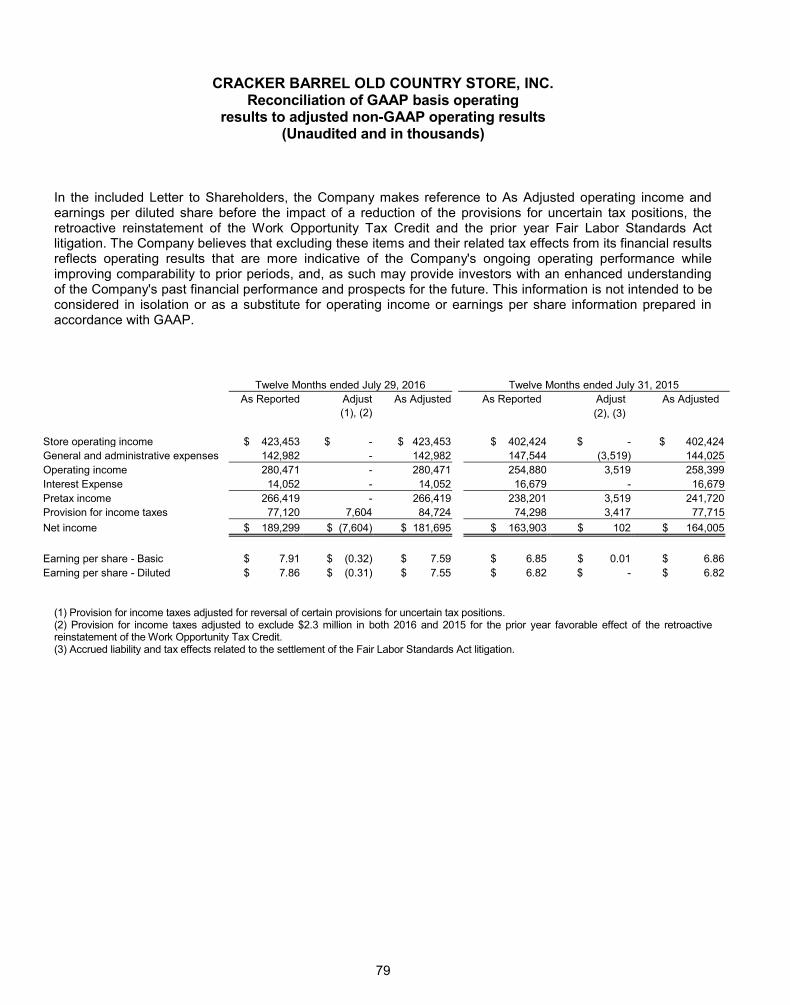
79
CRACKER BARREL OLD COUNTRY STORE, INC. Reconciliation of GAAP basis operating
results to adjusted non-GAAP operating results (Unaudited and in thousands)
In the included Letter to Shareholders, the Company makes reference to As Adjusted operating income and earnings per diluted share before the impact of a reduction of the provisions for uncertain tax positions, the retroactive reinstatement of the Work Opportunity Tax Credit and the prior year Fair Labor Standards Act litigation. The Company believes that excluding these items and their related tax effects from its financial results reflects operating results that are more indicative of the Company's ongoing operating performance while improving comparability to prior periods, and, as such may provide investors with an enhanced understanding of the Company's past financial performance and prospects for the future. This information is not intended to be considered in isolation or as a substitute for operating income or earnings per share information prepared in accordance with GAAP.
Twelve Months ended July 29, 2016 Twelve Months ended July 31, 2015 As Reported Adjust As Adjusted As Reported Adjust As Adjusted
(1), (2) (2), (3)
Store operating income $ 423,453 $ - $ 423,453 $ 402,424 $ - $ 402,424 General and administrative expenses 142,982 - 142,982 147,544 (3,519) 144,025 Operating income 280,471 - 280,471 254,880 3,519 258,399 Interest Expense 14,052 - 14,052 16,679 - 16,679 Pretax income 266,419 - 266,419 238,201 3,519 241,720 Provision for income taxes 77,120 7,604 84,724 74,298 3,417 77,715 Net income $ 189,299 $ (7,604) $ 181,695 $ 163,903 $ 102 $ 164,005
Earning per share - Basic $ 7.91 $ (0.32) $ 7.59 $ 6.85 $ 0.01 $ 6.86 Earning per share - Diluted $ 7.86 $ (0.31) $ 7.55 $ 6.82 $ - $ 6.82
(1) Provision for income taxes adjusted for reversal of certain provisions for uncertain tax positions. (2) Provision for income taxes adjusted to exclude $2.3 million in both 2016 and 2015 for the prior year favorable effect of the retroactive reinstatement of the Work Opportunity Tax Credit. (3) Accrued liability and tax effects related to the settlement of the Fair Labor Standards Act litigation.
CRACKER BARREL OLD COUNTRY STORE, INC.
P. Doug CouvillionVice President, Supply Chain and Quality Assurance
Laura A. DailySenior Vice President, Retail
Senior Vice President, Restaurant and Retail Operations
Jill M. Golder
Regional Vice President, Restaurant Operations
Vice President, Internal Audit
Vice President, Talent and Leadership Development
COO, Holler & Dash
Vice President, Marketplace and Product Development
Regional Vice President, Retail Operations
Brenda L. CoolRegional Vice President, Retail Operations
Leon M. De WetVice President, Information Services and CIO
Regional Vice President, Restaurant Operations
Regional Vice President, Restaurant Operations
Regional Vice President, Restaurant Operations
Vice President, Distribution and Logistics
Vice President, Financial and Strategic Planning
Vice President, Restaurant Operations
Regional Vice President, Restaurant Operations
Vice President, Retail Operations
Vice President, Marketing
Regional Vice President, Restaurant Operations
Vice President, Restaurant and Retail Operations Support
Vice President, Human Resources
Regional Vice President, Restaurant Operations
Vice President, Training and Management Development
Maja N. PattonVice President, Merchandise Planning and Allocation
Regional Vice President, Restaurant Operations
Regional Vice President, Retail Operations
Regional Vice President, Retail Operations
Vice President, Financial Planning and Analysis
Regional Vice President, Restaurant Operations
Walter W. TyreeRegional Vice President, Restaurant Operations
Vice President, General Counsel and Corporate Secretary
CRACKER BARREL OLD COUNTRY STORE, INC.Corporate Information
Cracker Barrel Old Country Store, Inc.P.O. Box 787305 Hartmann DriveLebanon, TN 37088-0787Phone: 615-444-5533crackerbarrel.com
American Stock Transfer & Trust Company59 Maiden LanePlaza LevelNew York, NY 10038
Deloitte & Touche LLPNashville, Tennessee
10-K ReportA copy of the Cracker Barrel Old Country Store, Inc.
Securities and Exchange Commission, may be obtained without charge through our Internet website, located at crackerbarrel.com and (without exhibits) by writing tothe Company, attention: Investor Relations. If requestedin writing, exhibits to the Form 10-K Annual Report are available for a reasonable fee.
Annual MeetingThe annual meeting of shareholders will be held at 10:00a.m. Thursday, November 17, 2016, at the Cracker
Lebanon, Tennessee.
Although our company does not sponsor a dividend reinvestment or direct stock purchase plan, our transfer agent, American Stock Transfer & Trust Company, LLC (“AST”), sponsors and administers such programs. Youmay call AST at 800-485-1883 or 718-921-8124 to obtainenrollment forms.
annual report to “CBRL,” “Cracker Barrel” or “The Company” refer to Cracker Barrel Old Country Store, Inc. and its subsidiaries; or its Cracker Barrel Old Country Store®
concept.
“Cracker Barrel Old Country Store” name and logo, “Cracker Barrel”, “Pleasing People”, “CB Old Country Store”, and “Holler & Dash Biscuit House” are trademarks of CBOCS Properties, Inc. ©2016 CBOCS Properties, Inc.
Old Country Store, Inc. Common Stock, the Standard & Poor’s Mid Cap Index, and the Standard & Poor’s 400
in the graph has been provided by FactSet Research Systems, Inc.