enhanced dynamic® moderate active deck
TRANSCRIPT

Enhanced Dynamic® Moderate Active Fund
“The Smart Beta Overlay to improve Active Equity and Smart Beta Strategies”®
Enhanced Investment Partners, LLC
30 South Wacker Drive, Suite 2200
Chicago, IL 60606
312-913-9872
Enhanced Dynamic® Equity Investment Methodology
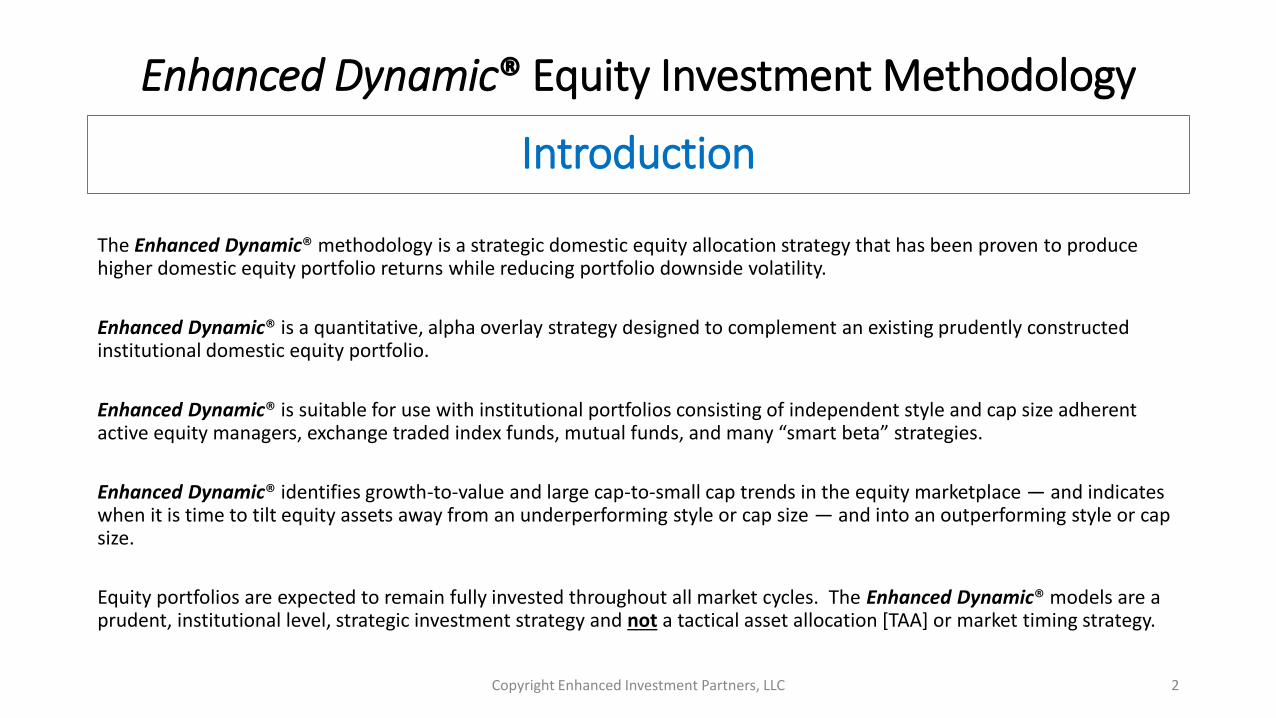
The Enhanced Dynamic® methodology is a strategic domestic equity allocation strategy that has been proven to produce higher domestic equity portfolio returns while reducing portfolio downside volatility.
Enhanced Dynamic® is a quantitative, alpha overlay strategy designed to complement an existing prudently constructed institutional domestic equity portfolio.
Enhanced Dynamic® is suitable for use with institutional portfolios consisting of independent style and cap size adherent active equity managers, exchange traded index funds, mutual funds, and many “smart beta” strategies.
Enhanced Dynamic® identifies growth-to-value and large cap-to-small cap trends in the equity marketplace — and indicates when it is time to tilt equity assets away from an underperforming style or cap size — and into an outperforming style or cap size.
Equity portfolios are expected to remain fully invested throughout all market cycles. The Enhanced Dynamic® models are a prudent, institutional level, strategic investment strategy and not a tactical asset allocation [TAA] or market timing strategy.
Introduction
Copyright Enhanced Investment Partners, LLC 2

Enhanced Dynamic® Equity Investment Methodology
There are times in the investment marketplace when a value style of investing is more profitable and productive than a growth style of investing. Conversely, there are other times when growth investing is more profitable than value investing.
The same observations generally apply to equity capitalization, where at certain periods large cap issues will outperform their small cap counterparts, and other times small cap equities will outperform large cap issues.
The Enhanced Dynamic® methodology seeks to identify the current in-favor equity style and cap size, as well as the out-of-favor (less profitable) style and cap size. Based upon this identification, portfolios are strategically tilted and over-weighted toward the most productive asset class, while the out-of-favor style and cap size asset class is de-emphasized.
Enhanced Dynamic® is a strategic equity allocation overlay, that has been proven to produce higher risk adjusted equity returns when applied to most style adherent domestic equity managers, funds, and strategies.
Equity portfolios are expected to remain fully invested through all market cycles, without any tactical market timing.
Enhanced Dynamic® overlay generally prevents the common problem of overweighting last year’s top performing investment strategies, only to have them underperform the market averages over the next three to five years.
Enhanced Dynamic® Investment Concept
Copyright Enhanced Investment Partners, LLC 3

Enhanced Dynamic® Moderate Active Fund
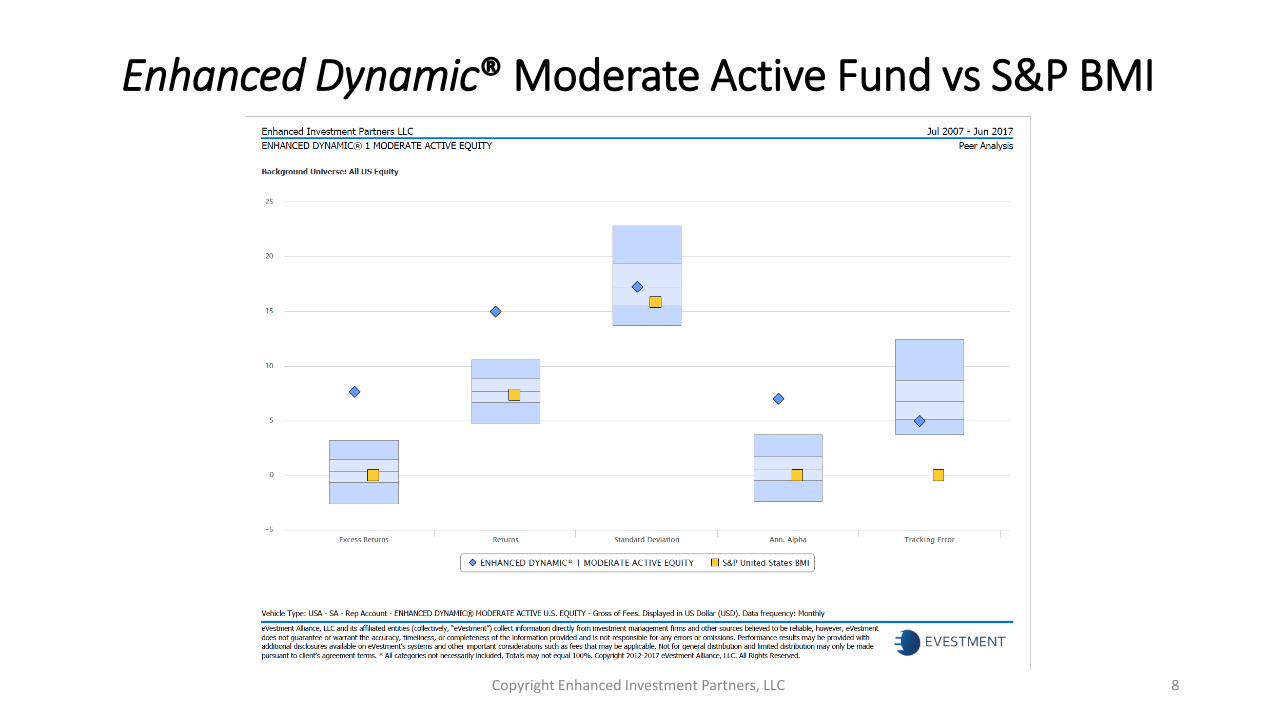
The following empirical studies are to display the effectiveness of Enhanced Dynamic®, with independent, style-adherent, active investment managers for the past 1-3-5-7-10 and 15 years..
These illustrations and graphs are based upon the eVestment Alliance investment manager database and provide a consistent comparison and display. Investment manager results are a composite of the top 35% of the active style-adherent managers in the database, to avoid concerns of “cherry-picking” of individual manager candidates.
We have determined that independent, style-adherent, active equity managers combined with the Enhanced Dynamic® overlay methodology provides significant benefits in both higher returns, and lower down-side capture.
Enhanced Dynamic® was applied consistently within these exhibits, without the benefit of any market timing, tactical asset allocation, security or index selection, or deviation from the Enhanced Dynamic® methodology.
Please refer to the Disclosures section within the http://www.enhancedinvesting.com and http://www.enhanceddynamic.com Web sites for further discussion.
Fund Illustrations, Studies, and Graphs
Copyright Enhanced Investment Partners, LLC 4

Enhanced Dynamic® Moderate Active Fund vs S&P BMI
Copyright Enhanced Investment Partners, LLC 5

Enhanced Dynamic® Moderate Active Fund vs S&P BMI
Copyright Enhanced Investment Partners, LLC 6

Enhanced Dynamic® Moderate Active Fund vs S&P BMI
Copyright Enhanced Investment Partners, LLC 7
Enhanced Dynamic® Moderate Active Fund vs S&P BMI
Copyright Enhanced Investment Partners, LLC 8

Enhanced Dynamic® Moderate Active Fund vs S&P BMI
Copyright Enhanced Investment Partners, LLC 9

Enhanced Dynamic® Moderate Active Fund vs S&P BMI
Copyright Enhanced Investment Partners, LLC 10

Enhanced Dynamic® Moderate Active Fund vs HFN
Copyright Enhanced Investment Partners, LLC 11

Enhanced Dynamic® Moderate Active Fund vs HFN
Copyright Enhanced Investment Partners, LLC 12

Enhanced Dynamic® Moderate Active Fund vs HFN
Copyright Enhanced Investment Partners, LLC 13

Enhanced Dynamic® Moderate Active Fund vs HFN
Copyright Enhanced Investment Partners, LLC 14

Enhanced Dynamic® Moderate Active Fund vs HFN
Copyright Enhanced Investment Partners, LLC 15

Enhanced Dynamic® Moderate Active Fund vs HFN
Copyright Enhanced Investment Partners, LLC 16

Enhanced Dynamic® Equity Investment Methodology
Equity Style Rotation [Value to Growth to Value] of both large cap and small cap strategies, guided by the Enhanced Dynamic® methodology, has been proven to generate higher returns with lower volatility when compared to static strategies. (data from www.Wilshire.com; annualized gross period Wilshire index returns; returns do not represent actual investments.)
Style Rotation
Copyright Enhanced Investment Partners, LLC 17
Enhanced Dynamic® Large Cap Rotation
(Wilshire Index Series)
-40.00%
-20.00%
0.00%
20.00%
40.00%
60.00%
80.00%
100.00%
120.00%
140.00%
200
4 Q
3
200
4 Q
4
200
5 Q
1
200
5 Q
2
200
5 Q
3
200
5 Q
4
200
6 Q
1
200
6 Q
2
200
6 Q
3
200
6 Q
4
200
7 Q
1
200
7 Q
2
200
7 Q
3
200
7 Q
4
200
8 Q
1
200
8 Q
2
200
8 Q
3
200
8 Q
4
200
9 Q
1
200
9 Q
2
200
9 Q
3
200
9 Q
4
201
0 Q
1
201
0 Q
2
201
0 Q
3
201
0 Q
4
201
1 Q
1
201
1 Q
2
201
1 Q
3
201
1 Q
4
201
2 Q
1
201
2 Q
2
201
2 Q
3
201
2 Q
4
201
3 Q
1
201
3 Q
2
201
3 Q
3
201
3 Q
4
201
4 Q
1
201
4 Q
2
WILSHIRE STYLE (LG/LV) S&P 500 WILSHIRE LG WILSHIRE LV RUSSELL 1000 WILSHIRE 5000
WILSHIRE STYLE (LG/LV) METRICS
METRIC 1-YEAR 3-YEAR 5-YEAR 7-YEAR 10-YEAR 15-YEAR
AVERAGE 21.82% 16.23% 18.99% 8.31% 9.24% 6.28%
STANDARD DEVIATION
N/A 10.36% 10.75% 20.23% 17.40% 16.01%
CORRELATION N/A 0.9810 0.8159 0.9509 0.8985 0.7857
R-SQUARED N/A 0.9623 0.6656 0.9043 0.8073 0.6174
BETA N/A 0.8596 1.1783 0.9826 0.9977 0.7813
Enhanced Dynamic® Small Cap Rotation
(Wilshire Index Series)
-50.00%
0.00%
50.00%
100.00%
150.00%
200.00%
200
4 Q
3
200
4 Q
4
200
5 Q
1
200
5 Q
2
200
5 Q
3
200
5 Q
4
200
6 Q
1
200
6 Q
2
200
6 Q
3
200
6 Q
4
200
7 Q
1
200
7 Q
2
200
7 Q
3
200
7 Q
4
200
8 Q
1
200
8 Q
2
200
8 Q
3
200
8 Q
4
200
9 Q
1
200
9 Q
2
200
9 Q
3
200
9 Q
4
201
0 Q
1
201
0 Q
2
201
0 Q
3
201
0 Q
4
201
1 Q
1
201
1 Q
2
201
1 Q
3
201
1 Q
4
201
2 Q
1
201
2 Q
2
201
2 Q
3
201
2 Q
4
201
3 Q
1
201
3 Q
2
201
3 Q
3
201
3 Q
4
201
4 Q
1
201
4 Q
2
WILSHIRE STYLE (SG/SV) S&P 500 WILSHIRE SG WILSHIRE SV RUSSELL 2000 WILSHIRE 5000
WILSHIRE STYLE (SG/SV) METRICS
METRIC 1-YEAR 3-YEAR 5-YEAR 7-YEAR 10-YEAR 15-YEAR
AVERAGE 29.08% 17.10% 24.01% 12.41% 12.95% 12.96%
STANDARD DEVIATION
N/A 17.72% 17.46% 24.52% 20.27% 18.70%
CORRELATION N/A 0.9069 0.7134 0.8685 0.8267 0.5250
R-SQUARED N/A 0.8225 0.5089 0.7543 0.6837 0.2757
BETA N/A 1.3595 1.6735 1.0874 1.0701 0.6097

Enhanced Dynamic® Equity Investment Methodology
Equity Cap Size Rotation [Large Cap to Small Cap to Large Cap] of both growth and value styled strategies, guided by the Enhanced Dynamic® methodology, has been proven to generate higher returns with lower volatility when compared to static strategies. (data from www.Wilshire.com; annualized gross period Wilshire index returns; returns do not represent actual investments.)
Capitalization Size Rotation
Copyright Enhanced Investment Partners, LLC 18
Enhanced Dynamic® Growth Style Rotation
(Wilshire Index Series)
-50.00%
0.00%
50.00%
100.00%
150.00%
200.00%
200
4 Q
3
200
4 Q
4
200
5 Q
1
200
5 Q
2
200
5 Q
3
200
5 Q
4
200
6 Q
1
200
6 Q
2
200
6 Q
3
200
6 Q
4
200
7 Q
1
200
7 Q
2
200
7 Q
3
200
7 Q
4
200
8 Q
1
200
8 Q
2
200
8 Q
3
200
8 Q
4
200
9 Q
1
200
9 Q
2
200
9 Q
3
200
9 Q
4
201
0 Q
1
201
0 Q
2
201
0 Q
3
201
0 Q
4
201
1 Q
1
201
1 Q
2
201
1 Q
3
201
1 Q
4
201
2 Q
1
201
2 Q
2
201
2 Q
3
201
2 Q
4
201
3 Q
1
201
3 Q
2
201
3 Q
3
201
3 Q
4
201
4 Q
1
201
4 Q
2
WILSHIRE CAP (LG/SG) S&P 500 WILSHIRE LG WILSHIRE LV RUSSELL 3000 WILSHIRE 5000
WILSHIRE CAP (LG/SG) METRICS
METRIC 1-YEAR 3-YEAR 5-YEAR 7-YEAR10-
YEAR15-
YEAR
AVERAGE 33.65% 21.67% 22.25% 11.55% 12.13% 8.40%
STANDARD DEVIATION
N/A 15.31% 12.86% 21.91% 18.15% 13.81%
CORRELATION N/A 0.8503 0.8481 0.9484 0.9156 0.7745
R-SQUARED N/A 0.7230 0.7193 0.8994 0.8382 0.5999
BETA N/A 1.1010 1.4656 1.0610 1.0607 0.6643
Enhanced Dynamic™ Value Style Rotation
(Wilshire Index Series)
-50.00%
0.00%
50.00%
100.00%
150.00%
200.00%
20
04
Q3
20
04
Q4
2005
Q1
20
05
Q2
20
05
Q3
2005
Q4
20
06
Q1
20
06
Q2
2006
Q3
20
06
Q4
20
07
Q1
2007
Q2
20
07
Q3
20
07
Q4
2008
Q1
20
08
Q2
20
08
Q3
2008
Q4
20
09
Q1
20
09
Q2
2009
Q3
20
09
Q4
20
10
Q1
2010
Q2
20
10
Q3
20
10
Q4
2011
Q1
20
11
Q2
20
11
Q3
2011
Q4
20
12
Q1
20
12
Q2
2012
Q3
20
12
Q4
20
13
Q1
20
13
Q2
20
13
Q3
20
13
Q4
20
14
Q1
20
14
Q2
WILSHIRE CAP (LV/SV) S&P 500 WILSHIRE LV WILSHIRE SV RUSSELL 3000 WILSHIRE 5000
WILSHIRE CAP (LV/SV) METRICS
METRIC 1-YEAR 3-YEAR 5-YEAR 7-YEAR 10-YEAR 15-YEAR
AVERAGE 25.62% 21.10% 21.64% 8.82% 11.15% 8.58%
STANDARD DEVIATION
N/A 7.54% 7.36% 22.83% 19.04% 17.98%
CORRELATION N/A 0.9374 0.8605 0.9878 0.9716 0.8393
R-SQUARED N/A 0.8787 0.7404 0.9757 0.9440 0.7044
BETA N/A 0.5982 0.8512 1.1517 1.1811 0.9371
Enhanced Dynamic® Equity Investment Methodology
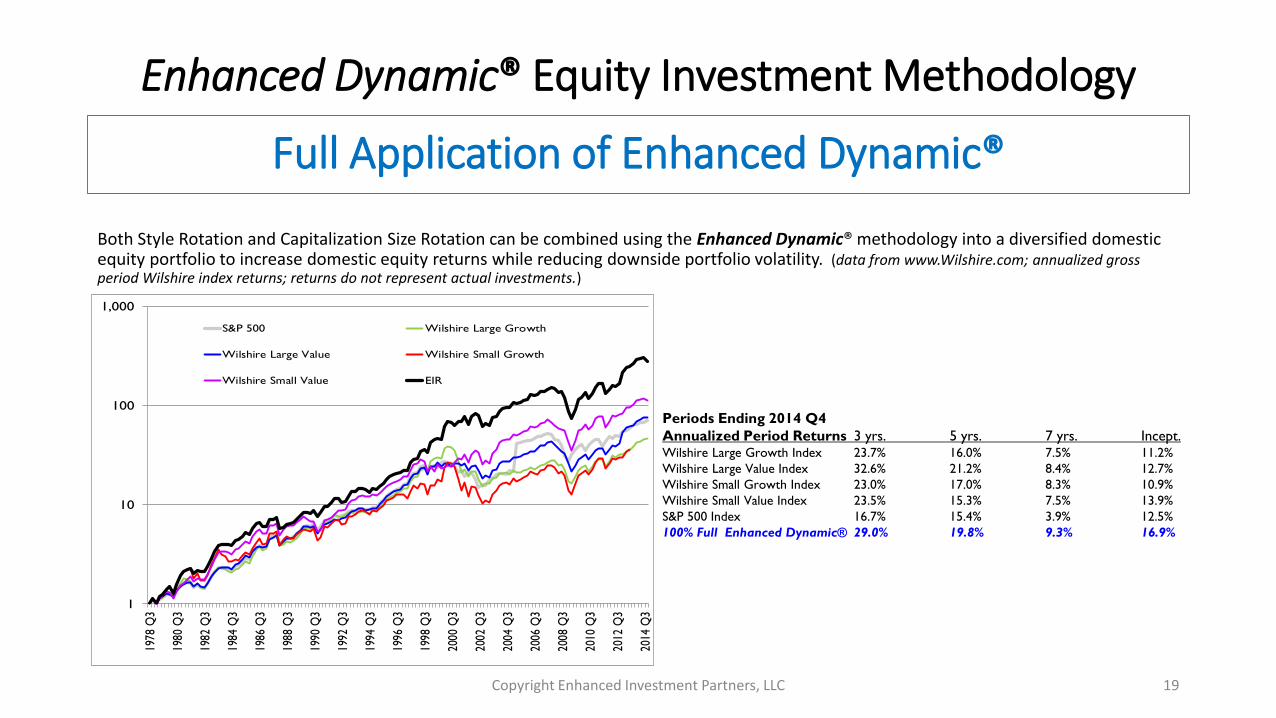
Both Style Rotation and Capitalization Size Rotation can be combined using the Enhanced Dynamic® methodology into a diversified domestic equity portfolio to increase domestic equity returns while reducing downside portfolio volatility. (data from www.Wilshire.com; annualized gross period Wilshire index returns; returns do not represent actual investments.)
Full Application of Enhanced Dynamic®
Copyright Enhanced Investment Partners, LLC 19
1
10
100
1,000
1978
Q3
1980
Q3
1982
Q3
1984
Q3
1986
Q3
1988
Q3
1990
Q3
1992
Q3
1994
Q3
1996
Q3
1998
Q3
2000
Q3
2002
Q3
2004
Q3
2006
Q3
2008
Q3
2010
Q3
2012
Q3
2014
Q3
S&P 500 Wilshire Large Growth
Wilshire Large Value Wilshire Small Growth
Wilshire Small Value EIR
Periods Ending 2014 Q4
Annualized Period Returns 3 yrs. 5 yrs. 7 yrs. Incept.Wilshire Large Growth Index 23.7% 16.0% 7.5% 11.2%
Wilshire Large Value Index 32.6% 21.2% 8.4% 12.7%
Wilshire Small Growth Index 23.0% 17.0% 8.3% 10.9%
Wilshire Small Value Index 23.5% 15.3% 7.5% 13.9%
S&P 500 Index 16.7% 15.4% 3.9% 12.5%
100% Full Enhanced Dynamic® 29.0% 19.8% 9.3% 16.9%

Enhanced Dynamic® Equity Investment Methodology
The chart below reflects the growth of $1,000,000.00, invested from 1978 until 12-31-2016, and compares the S&P 500 index versus a static index of 25% large growth, 25% large value, 25% small growth, and 25% small value compared to a moderate allocation using the Enhanced Dynamic® allocation methodology. (data from www.Wilshire.com; annualized gross period Wilshire index returns; returns do not represent actual investments.)
Growth of a Dollar
Copyright Enhanced Investment Partners, LLC 20
$1
$10
$100
$1,000
1978
Q2
1979
Q2
1980
Q2
1981
Q2
1982
Q2
1983
Q2
1984
Q2
1985
Q2
1986
Q2
1987
Q2
1988
Q2
1989
Q2
1990
Q2
1991
Q2
1992
Q2
1993
Q2
1994
Q2
1995
Q2
1996
Q2
1997
Q2
1998
Q2
1999
Q2
2000
Q2
2001
Q2
2002
Q2
2003
Q2
2004
Q2
2005
Q2
2006
Q2
2007
Q2
2008
Q2
2009
Q2
2010
Q2
2011
Q2
2012
Q2
2013
Q2
2014
Q2
Growth of a Dollar
Outperform S&P 500 Index
Enhanced Dynamic® Equity Investment Methodology
Copyright Enhanced Investment Partners, LLC 21
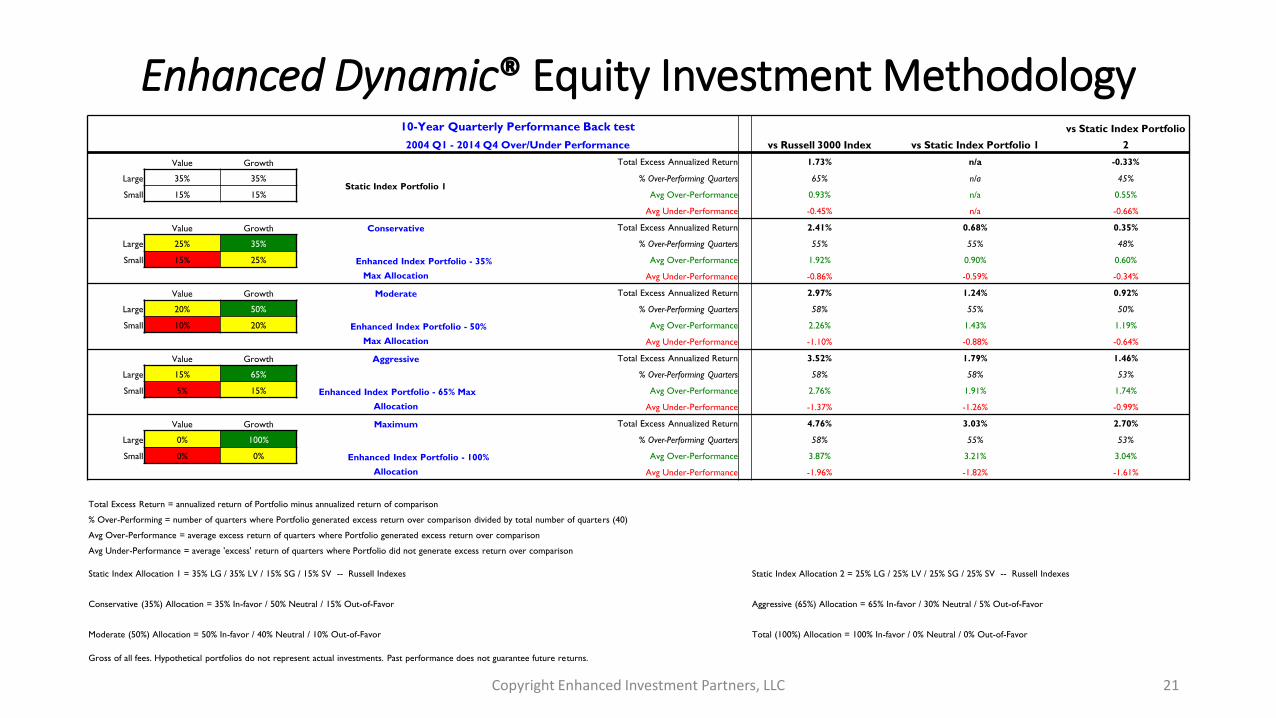
10-Year Quarterly Performance Back test
vs Russell 3000 Index vs Static Index Portfolio 1
vs Static Index Portfolio
22004 Q1 - 2014 Q4 Over/Under Performance
Value Growth
Static Index Portfolio 1
Total Excess Annualized Return 1.73% n/a -0.33%
Large 35% 35% % Over-Performing Quarters 65% n/a 45%
Small 15% 15% Avg Over-Performance 0.93% n/a 0.55%
Avg Under-Performance -0.45% n/a -0.66%
Value Growth Conservative
Enhanced Index Portfolio - 35%
Max Allocation
Total Excess Annualized Return 2.41% 0.68% 0.35%
Large 25% 35% % Over-Performing Quarters 55% 55% 48%
Small 15% 25% Avg Over-Performance 1.92% 0.90% 0.60%
Avg Under-Performance -0.86% -0.59% -0.34%
Value Growth Moderate
Enhanced Index Portfolio - 50%
Max Allocation
Total Excess Annualized Return 2.97% 1.24% 0.92%
Large 20% 50% % Over-Performing Quarters 58% 55% 50%
Small 10% 20% Avg Over-Performance 2.26% 1.43% 1.19%
Avg Under-Performance -1.10% -0.88% -0.64%
Value Growth Aggressive
Enhanced Index Portfolio - 65% Max
Allocation
Total Excess Annualized Return 3.52% 1.79% 1.46%
Large 15% 65% % Over-Performing Quarters 58% 58% 53%
Small 5% 15% Avg Over-Performance 2.76% 1.91% 1.74%
Avg Under-Performance -1.37% -1.26% -0.99%
Value Growth Maximum
Enhanced Index Portfolio - 100%
Allocation
Total Excess Annualized Return 4.76% 3.03% 2.70%
Large 0% 100% % Over-Performing Quarters 58% 55% 53%
Small 0% 0% Avg Over-Performance 3.87% 3.21% 3.04%
Avg Under-Performance -1.96% -1.82% -1.61%
Total Excess Return = annualized return of Portfolio minus annualized return of comparison
% Over-Performing = number of quarters where Portfolio generated excess return over comparison divided by total number of quarters (40)
Avg Over-Performance = average excess return of quarters where Portfolio generated excess return over comparison
Avg Under-Performance = average 'excess' return of quarters where Portfolio did not generate excess return over comparison
Static Index Allocation 1 = 35% LG / 35% LV / 15% SG / 15% SV -- Russell Indexes Static Index Allocation 2 = 25% LG / 25% LV / 25% SG / 25% SV -- Russell Indexes
Conservative (35%) Allocation = 35% In-favor / 50% Neutral / 15% Out-of-Favor Aggressive (65%) Allocation = 65% In-favor / 30% Neutral / 5% Out-of-Favor
Moderate (50%) Allocation = 50% In-favor / 40% Neutral / 10% Out-of-Favor Total (100%) Allocation = 100% In-favor / 0% Neutral / 0% Out-of-Favor
Gross of all fees. Hypothetical portfolios do not represent actual investments. Past performance does not guarantee future returns.

Enhanced Dynamic® Equity Investment Methodology
In the domestic equity market, either a growth or value investment style has been favored (more profitable) during certain periods of time, which has lasted for extended periods. Similar investment style dominance has typically prevailed across large and small capitalization sizes.
Since 1978, domestic equity style rotation back-testing using various indices and active manager strategies have generated additional annualized excess return of 1.5%. Additionally, style rotation back-testing using the Wilshire Small Cap Indexes has generated on average 2.0% annualized returns versus the S&P 500.
In the domestic equity market, a large cap or small cap equity investment style has been favored (more profitable) during certain periods of a market cycle, versus the opposing equity capitalization size, and have also lasted for extended periods.
Since 1978, domestic equity cap size rotation back-testing using the Wilshire Growth and Value Indexes has generated an additional annualized excess return of 0.1%, and cap size rotation back-testing has generated an additional 2.8% annualized return, versus the S&P 500.
Since 1978, the combination of domestic equity style rotation with capitalization size rotation back testing using the Wilshire Indexes has generated an additional return in excess of 4.0% per annum, versus the S&P 500.
We seek to increase a portfolio’s overall equity returns, with equal or lower volatility than the market, by combining the results of equity style rotation and equity cap size rotation, when applied strategically (not tactically), over a full market cycle, with active style adherent investment managers.
The Enhanced Dynamic® investment methodology may be incorporated within most domestic equity portfolios, with minimal dislocation of current portfolio managers and investment structure, and without significant additional expense.
The depth or degree of style and cap size adherence of the investment managers and vehicles is a significant contributor and determinant of the full benefit [risk adjusted returns] of Enhanced Dynamic®.
Equity portfolios are expected to be fully invested at all times. This is not a tactical market (TAA) timing program.
Observations and Conclusions
Copyright Enhanced Investment Partners, LLC 22