enhanced methane productivity from manure fibers...
TRANSCRIPT
General rights Copyright and moral rights for the publications made accessible in the public portal are retained by the authors and/or other copyright owners and it is a condition of accessing publications that users recognise and abide by the legal requirements associated with these rights.
• Users may download and print one copy of any publication from the public portal for the purpose of private study or research. • You may not further distribute the material or use it for any profit-making activity or commercial gain • You may freely distribute the URL identifying the publication in the public portal
If you believe that this document breaches copyright please contact us providing details, and we will remove access to the work immediately and investigate your claim.
Downloaded from orbit.dtu.dk on: Aug 17, 2018
Enhanced methane productivity from manure fibers by aqueous ammonia soakingpretreatment
Jurado, Esperanza; Skiadas, Ioannis V; Gavala, Hariklia N.
Published in:Applied Energy
Publication date:2013
Document VersionPeer reviewed version
Link back to DTU Orbit
Citation (APA):Jurado, E., V. Skiadas, I., & Gavala, H. N. (2013). Enhanced methane productivity from manure fibers byaqueous ammonia soaking pretreatment. Applied Energy, 109, 104-111.
1
Enhanced methane productivity from manure fibers by aqueous ammonia soaking 1
pretreatment 2
3
Esperanza Jurado1, Ioannis V. Skiadas
1, Hariklia N. Gavala
1,* 4
5
6
1Aalborg University Copenhagen (AAU-Cph), Department of Biotechnology, Chemistry 7
and Environmental Engineering, A C Meyers Vænge 15, DK 2450 Copenhagen SV 8
Denmark 9
*Corresponding author: e-mail: [email protected], [email protected], tel: 10
+4599402586, fax: +45 99402594. 11
12
Abstract 13
The necessity of increasing the methane productivity of manure based biogas plants has 14
triggered the application of anaerobic digestion to the separated solid fraction of 15
manure, with the challenge that its high lignocellulosic fibers content is difficult to 16
digest and thus makes anaerobic digestion process slow and economically unfavourable. 17
In the present study, aqueous ammonia soaking (AAS) was investigated as a 18
pretreatment method to increase methane potential of swine manure fibers. 3 days at 19
22°C were the optimal conditions among the ones tested (1, 3, and 5 days at 22 and 20
55°C) for increasing the methane potential of manure fibers. AAS pretreatment 21
exhibited a significant effect on methane production rate and potential. It was found that 22
AAS for 3 days at 22°C resulted at a 30-80 and 178% increase in methane yield from 23
digested and raw manure fibers, respectively. Batch anaerobic digestion of AAS-treated 24
2
digested manure fibers could stand loadings as high as 100 g TS/l inoculum with no 25
inhibition problems. Enzymatic hydrolysis tests applied to AAS-pretreated fibers 26
resulted to 80 and 65% hydrolysis efficiency of glucan and xylan compared to 27
insignificant numbers for non-pretreated fibers confirming thus that AAS effect on 28
methane yield and production rate is due to the facilitation of hydrolysis step of 29
anaerobic digestion process. This is attributed to AAS directly affecting the 30
disintegration step and thus releasing carbohydrates, which can be further hydrolysed, 31
from the lignocellulosic matrix. 32
33
Keywords: anaerobic digestion; aqueous ammonia soaking; manure fibers; methane 34
potential; pretreatment. 35
36
37

3
1. Introduction 38
Biogas production and utilization has become a major part of the rapidly growing 39
renewable energy sector. In recent years, biogas technology has progressed significantly 40
and its application has experienced an explosive growth worldwide in municipalities, 41
industry and agriculture. Biogas is arguably a versatile renewable energy source due to 42
its determinate energy value and ease of storage, hence, potential utilization is 43
significantly independent of factors such as geographical location and season. It can be 44
used directly for heating and electricity generation and as substitute for fossil fuel 45
applications, e.g., transport fuel [1]. Currently, most agricultural biogas plants are used 46
to ferment liquid manure [2] due to several advantages; anaerobic digestion is based on 47
microorganisms already existing in manure and therefore methane production occurs 48
naturally. Additionally, production of biogas from manure results in much higher 49
reduction in greenhouse gas emission than other biofuels producing processes, such as 50
bioethanol, and equals savings in fossil fuels. As cost aspects point to the same 51
direction, manure based biogas should have higher priority than other biofuels [3]. 52
53
Denmark is one of the largest producers of pig meat and the use of swine manure in 54
biogas production is a common practice. Swine manure, when not properly treated, 55
results in pollution of the environment. Anaerobic digestion is considered as an efficient 56
and cost-effective treatment capable of reducing organic content of swine waste 57
effluents while producing energy from methane valorisation [4]. However, biogas plants 58
digesting liquid manure alone are not economically viable due to the relatively low 59
organic content of the manure, usually 3-5%. Therefore, current biogas production in 60
Denmark is based on the codigestion of at least 75% animal manure and up to 25% 61
4
other (additional) biomasses characterized by high methane potential, such as 62
slaughterhouse wastes, glycerine, crops, animal fat, fish oil, etc. The addition of this 63
type of biomasses increases the methane efficiency and thus the process profitability 64
[3]. However, due to the increased demand for biomass feedstock in the bioenergy 65
sector, the prices of these additional biomasses have increased significantly and supply 66
of alternative organic fractions from industrial and agricultural sectors for production of 67
biogas is becoming increasingly limited. This scarcity is causing fluctuation in prices 68
and biomass supply insecurity, which directly affects the income and overall economy 69
of the biogas plants. Moreover, the frequent change of additional biomass supply results 70
in frequent adaptation of the anaerobic digestion processes and thus reduced the overall 71
biogas efficiency. Two possible alternatives have been studied most recently in order to 72
solve this problem: a) the addition of alternative materials to increase dry matter 73
concentration, such as wheat straw [5], which creates a dependency on another extra 74
material and b) the development and application of solid-liquid separation technologies 75
[6]. The solid-liquid separation has the advantage of more efficient and cheaper 76
transportation since only the solid fraction of the manure will be transported to the 77
biogas plant, resulting in a considerable decrease of transportation cost per cubic meter 78
of methane produced. Meanwhile, the liquid fraction will remain in the farm, where it 79
will be used as fertilizer [7]. Separation technologies available include for: mechanical 80
screen separators, filter presses, sedimentation, centrifugation, biological treatment and 81
reverse osmosis [8]. 82
83
The solid fraction of manure consists mainly of swine faeces, lignocellulosic plant 84
fibers and some additional elements (as hair, skin, and soil from roughage). Biogas 85
5
production from manure fibers presents difficulties mainly due to the rigid 86
lignocellulosic structure. Native lignin, which binds and encapsulates carbohydrates, is 87
generally resistant to microbial/enzymatic decomposition [9]. Therefore, pretreatment is 88
a prerequisite process for accessing fermentable carbohydrates. The main purpose of 89
pretreatment of lignocellulosic feedstocks is disrupting the lignocellulosic matrix, 90
facilitating the hydrolysis of cellulose and hemicellulose by cellulases and/or xylanases 91
produced by cellulolytic and xylanolytic microorganisms and allowing thus the 92
subsequent anaerobic fermentation and methanogenesis steps [10, 11]. Several 93
pretreatment methods for increasing the biodegradability of methane production from 94
fibers and other lignocellulosic materials have been reported. Mechanical treatment, 95
such us milling, increases the surface available for enzymatic attack and has been 96
proven effective in increasing methane yields of lignocellulosic substrates up to 25%. 97
Physical treatments, e.g microwave treatment, chemical treatments with acids, bases and 98
oxidants and combined physicochemical treatments have also been tested [11-13]. 99
Among them, alkaline hydrolysis with NaOH has been proven a satisfactory treatment 100
when applied on lignocellulosic materials like straw. Biological treatment using white 101
rot fungi with delignification ability has been reported to increase methane yield to 102
some extent. The use of some commercial enzymes increases also methane yield when 103
it is combined with other pre-treatment technologies, such as steam treatment [14]. 104
105
In the present study, aqueous ammonia soaking (AAS) and subsequent ammonia 106
removal has been used as a method to increase methane potential and biogas 107
productivity of manure fibers. AAS has been so far tested for bioethanol and chemicals 108
production with satisfactory results [15-18]. In these studies, AAS has been proven an 109
6
effective treatment of low lignin content feedstocks such as agriculture residues [19]. In 110
addition AAS presents certain advantages as a pretreatment method; Ammonia is 111
relatively safe to handle, non-polluting and non-corrosive and can be easily recovered 112
due to its high volatility [9]. Ammonia is a weak base and has high selectivity toward 113
the lignin reactions, preserving the carbohydrates [19]. It cleaves the ether bonds in 114
lignin and the ether and ester bonds between lignin and hemicellulose. It can also 115
penetrate the crystalline structure in cellulose and cause swelling [9]. In most processes, 116
ammonia pretreatment has been performed at high temperatures, resulting thus in high 117
delignification. However, a number of disadvantages to these processes, such as high 118
energy input, formation of toxic compounds and loss of sugars have been reported. Low 119
reaction temperature has been presented as an alternative approach to alleviate these 120
challenges [9]. Diverse studies have indicated that the use of ammonia at room 121
temperature minimized its interaction with hemicellulose and the formation of toxic 122
compounds while increasing bioconversion and fermentation yields [9]. However, 123
studies on the effect of AAS on methane production from various biomasses are scarce 124
with just that of Himmelsbach et al. [20] applying AAS on switch grass found so far in 125
the international literature. 126
127
It has to be emphasized that the ammonia used for the pretreatment can be easily 128
recycled in a full-scale plant resulting in actually no chemicals consumption. Ammonia 129
recovery from digested manure is technically and in many cases economically feasible 130
as well [21]. The ammonia recovery methods, currently used in commercial scale, focus 131
on the whole digestate effluent stream and the production of nitrogen fertilizers. The 132
AAS method tested in the present study requires the ammonia recovery from only the 133
7
manure fibers which is a very small fraction (less than 10%) of the total mass of the 134
liquid manure and therefore the energy requirements are expected to be significantly 135
lower. Therefore, application of AAS on manure fibers in biogas plants already 136
equipped with ammonia removal infrastructure (as ammonia removal is in most cases 137
necessary for manure based plants) is expected to constitute a cost-efficient and 138
sustainable pretreatment (or post-treatment) option. A costs and benefits analysis of the 139
proposed AAS method combined with an ammonia recovery system is not part of the 140
present study but it is certainly included in future research plans. 141
142
In the present study, AAS was applied to both raw and digested (before and after 143
anaerobic digestion) swine manure fibers. The objectives were to study the effect of 144
AAS on the methane yield and hydrolysis step as well as to investigate if AAS treated 145
fibers exhibited any inhibition on anaerobic digestion with increasing TS loadings. 146
147
2. Methods 148
2.1. Substrate, reagents enzymes and inoculum 149
Manure fibers were kindly provided by Morsø BioEnergi (a mesophilic biogas plant 150
treating manure and manure fibers) and stored at -20°C until used. Two kinds of manure 151
fibers were used in this study: those collected directly in the farm after separation using 152
a decanter centrifuge - called raw manure fibers - and those which were collected at the 153
Morsø BioEnergi biogas plant after decanting the effluent of the anaerobic digester – 154
called digested manure fibers. Aqueous ammonia solution 32% w/w was used for the 155
pretreatment. Novozymes Biomass Kit was kindly provided by Novozymes A/S 156
(Bagsværd, Denmark). The inoculum for the methane potential tests came from a 3-L 157
8
active volume mesophilic digester treating swine manure at an organic loading rate of 158
2.58 g COD/l d and a methane productivity of 0.55 l/l d. The Volatile Solids (VS) 159
content of the inoculum was 17.6 ± 1.4 g/l. It was estimated that 2.9, 4.3 and 7.8% of 160
the VS of the inoculum corresponded to acidogenic, acetogenic and methanogenic 161
microbial population, respectively. This estimation was based on simulations of the 162
reactor performance based on Anaerobic Digestion Model 1 [22] 163
164
2.2. Analytical methods 165
All characterisations of AAS-pretreated fibers were done after removal of ammonia (as 166
described in section 2.3). The results are given per g TS in order to be comparable with 167
those coming from non-pretreated fibers as the mass of TS before and after AAS 168
pretreatment remained the same. Determination of total solids (TS) and volatile solids 169
(VS) was carried out according to standard methods [23]. In order to measure total 170
Chemical Oxygen Demand (COD), the material was dried at 105°C and milled to 171
powder. After that, the material was diluted in Millipore water and measured with Hach 172
Lange kit LCK_914 (5-60 g/l range). For soluble COD the material was centrifuged at 173
4000 rpm for 10 min, the supernatant was filtered through high flow filter (pore size 0.2 174
µm) and analysis was performed with Hach Lange kit LCK_514 (100-2000 mg/l range). 175
For soluble ammonium nitrogen (NH4-N) measurement, the material was centrifuged 176
and filtered as previously described and analysis was performed with Hach Lange kit 177
LCK_305 (1-12 mg/l range). 178
Detection and quantification of sugar monomers (glucose, xylose and arabinose) was 179
made with HPLC-RI equipped with an Aminex HPX-87H column (BioRad) at 60°C. A 180
solution of 4 mmol/l H2SO4 was used as eluent at a flow rate of 0.6 mL/min. Samples 181

9
for HPLC analysis were acidified with a 10% w/w solution of H2SO4, centrifuged at 182
10000 rpm for 10 min and finally filtered through a 0.45μm membrane filter. Two 183
groups of carbohydrates were determined in the samples of raw and pretreated manure 184
fibers: the first group was the total carbohydrates, including those bound in the 185
lignocellulosic biomass and the second group was the simple sugars [24]. Analysis of 186
the two groups of carbohydrates was carried out based on the NREL analytical 187
procedures [25]. Enzyme activity was determined by Filter Paper assay [26, 27]. 188
Biogas composition in methane was measured with a gas chromatograph (SRI GC 189
model 310) equipped with a thermal conductivity detector and a packed column 190
(Porapak-Q, length 6ft and inner diameter 2.1 mm). The temperature for injector, 191
column and detector was set to 80°C. The volume of methane produced in sealed vials 192
during methane potential tests was calculated multiplying the biogas composition with 193
the headspace volume. The increase in methane yield of the AAS-pretreated fibers 194
compared to the non-pretreated fibers was calculated according to equation 1: 195
100*%
4
44
fiberscontrol
CH
fiberscontrol
CH
fibersAAS
CH
Y
YYincrease
(1) 196
Where fibersAAS
CHY
4 and fiberscontrol
CHY
4 corresponded to the methane yield in ml CH4/g TS 197
obtained from AAS-pretreated fibers and non-pretreated fibers, respectively. 198
199
2.3. Ammonia pretreatment 200
Samples of manure fibers were soaked in ammonia reagent (32% w/w in ammonia) with 201
a ratio of 10 mL reagent per 1 g TS. The pretreatment was performed in closed glass 202
flasks to avoid ammonia evaporation. After the completion of the pretreatment, water 203
was added at a ratio of 10 mL per g TS to facilitate the subsequent ammonia distillation 204
10
step. Distillation was performed using a rotary evaporator (Buchi RII Rotavapor) with a 205
vertical condenser under 320 psi and gradually increased temperature from 40 to 90°C 206
with a step of 20 degrees from 40 to 80°C. The retention time was 10 and 20 min at the 207
two first and two last temperature levels, respectively. 208
209
2.4. Effect of AAS duration and temperature on methane production 210
Three different AAS pretreatment durations (1, 3 and 5 days) and two moderate 211
temperatures (22 and 55°C) were applied in digested manure fibers. 212
Methane potential tests of pretreated fibers (AAS-fibers) were carried out at triplicates 213
in 300 ml sealed serum vials and anaerobic mixed liquor from a mesophilic digester 214
treating liquid manure was used as inoculum. An amount equivalent to 0.25 g TS of 215
fibers per 10 mL of inoculum was added in the serum vials. A control triplicate was run 216
in parallel by using non-pretreated fibers (control-fibers) while a triplicate containing 217
only inoculum was served as control for background (coming from the inoculum) 218
methane production. The vials were incubated under mesophilic conditions (37°C) for 219
35-50 days with periodic shaking and methane production was monitored throughout 220
the duration of the experiments. Methane potential was calculated as the volume of 221
methane produced per g of TS of manure fibers added after subtracting the methane 222
produced in the control vials with only inoculum added. Thus, the suitability and the 223
efficiency of the aqueous ammonia soaking as a pretreatment method for enhanced 224
methane production from manure fibers were assessed and the optimal conditions 225
among the ones tested were chosen for subsequent experiments. 226
227
2.5. Effect of AAS on the composition of raw and digested manure fibers 228
11
Raw and digested manure fibers were subjected to AAS pretreatment for 3 days at 22°C 229
and their composition in terms of lignin, carbohydrate polymers and free sugars, total 230
and soluble COD and NH4-N was determined before and after the pretreatment. 231
232
2.6. Effect of organic loading of AAS pre-treated manure fibers on methane production 233
Methane production rate and yield were evaluated in batch experiments at different 234
organic loadings in order to assess any inhibitory effects due to the pretreatment. 235
Digested and raw manure fibers were pretreated for 3 days at 22°C. Four different TS 236
loadings were tested: 0.16, 0.25, 0.5 and 1 g TS per 10 ml of inoculum. 237
Methane potential tests of pretreated fibers (AAS-fibers) were carried out as described 238
in section 2.4. Control triplicates by using non-pretreated fibers (control-fibers) at the 239
same TS loadings and a triplicate containing only inoculum were also run in parallel as 240
previously described. Methane potential was again calculated as the volume of methane 241
produced per g of TS of manure fibers added after subtracting the methane produced in 242
the control vials with only inoculum added. 243
244
2.7. Effect of AAS on enzymatic hydrolysis step 245
As it is reported previously, AAS is expected to disrupt the lignocellulosic matrix, 246
facilitating and speeding-up thus the hydrolysis of cellulose and hemicellulose during 247
the hydrolysis step of the anaerobic digestion process. One way to evaluate the effect 248
that AAS has on the hydrolysis’ efficiency is to add commercial cellulases and 249
xylanases to AAS-pretreated and non-pretreated digested fibers and to compare the 250
sugars release in each case. pH of the non-pretreated fibers (control-fibers) and AAS 251
pretreated fibers (AAS-fibers) was adjusted to 5.5 with 30% H2SO4 prior to enzymatic 252
12
hydrolysis. Cloranphenicol, tetracycline and ampiciline were added at a final 253
concentration of 50µg/mL, 50µg/mL and 100 µg/mL, respectively, in order to prevent 254
microbial growth and consumption of the released sugars. Novozymes Biomass Kit was 255
used for performing enzymatic hydrolysis. It consisted of five different enzymes 256
(NS50013, NS50010, NS50012, NS50030, NS22002) exhibiting cellulolytic, beta-257
glucosidic, arabinolytic, hemicellulolytic, pectinolytic and xylanolytic activities. The 258
above enzymes were mixed at a mass ratio of 15:1.5:1:1.25:5 (NS50013: NS50010: 259
NS50012: NS50030: NS22002) and the resulted enzymes solution exhibited an activity 260
of 62 FPU/g as determined by the filter Paper assay. Three different enzymatic loadings 261
were tested: 5, 15 and 25 FPU/g TS, respectively. Enzymatic hydrolysis tests were 262
carried out in a shaking incubator at a temperature of 50°C and 120 rpm continuous 263
mixing for four days. Free sugars in control-fibers and AAS-fibers were analyzed before 264
and after the completion of enzymatic hydrolysis tests and the hydrolytic efficiency 265
regarding glucose and xylose was calculated based on equations 2 and 3, respectively. 266
10011.1
1cos
cellulose
egluefficiencyHydrolytic (2) 267
10014.1
1
xylan
xyloseefficiencyHydrolytic (3) 268
Where [glucose], [xylose], [cellulose] and [xylan] are the respective concentrations 269
given in g per 100 g TS. 270
271
3. Results and discussion 272
3.1. Effect of AAS duration and temperature on methane production 273
AAS was investigated as a pretreatment method for enhancement of the methane 274
production rate and potential from digested manure fibers. The efficiency of AAS has 275
13
been tested at different durations (1, 3 and 5 days) and temperatures (22 and 55°C) as 276
described previously. The methane yield after 35 days of anaerobic digestion of non-277
pretreated (control-fibers) and AAS pretreated digested fibers (AAS-fibers) is shown in 278
Fig. 1. Except from the sample treated for 1 day at 22°C, which exhibited a slight 279
decrease in the methane yield compared to the control, an increase between 17-80% in 280
the methane yield of AAS-fibers compared to the control-fibers was observed. AAS for 281
3 days at 22°C was the most efficient one exhibiting 139 ml CH4/g TS. The methane 282
production rate was also positively affected by AAS as the maximum yield, 135 mL 283
CH4/g TS was obtained after 16 days incubation of AAS-fibers (AAS for 3 days at 284
22°C) while 32 days were needed for control-fibers to achieve the maximum methane 285
yield, approximately 77 mL CH4/g TS, as shown in Fig. 2. Moreover, the methane yield 286
of AAS-fibers was 128% higher than the one of control-fibers after 16 days incubation. 287
As it was anticipated, the methane production from AAS pretreated fibers was higher 288
and faster probably due to the higher accessibility of the organic compounds. It is well 289
known that the extracellular hydrolysis is slow and incomplete during anaerobic 290
digestion of lignocellulosic material [2], thus being the rate-limiting step in the biogas 291
production. Due to the manure fibers structural changes induced by the AAS 292
pretreatment, faster and more complete hydrolysis occurred resulting to higher methane 293
production rate and potential (Figs. 1-2). 294
No higher methane yield was obtained when AAS was performed at 55°C compared to 295
that at 22°C for 3 days (139 and 130 ml CH4/g TS at 22 and 55°C, respectively) and 5 296
days (122 and 123 ml CH4/g TS at 22 and 55°C, respectively) pretreatment duration. 297
According to the literature an increase in AAS temperature results in a greater 298
delignification degree [16]; in the present study, nevertheless, a temperature increase 299
14
from 22 to 55 °C did not have any positive effect on the methane potential a finding that 300
may be translated in reduced cost for the pretreatment process. It has to be noted, 301
however, that in the study of Kim et al. [16] the pretreated biomass (barley hull) was 302
different than the biomass used in the present study. Whether the optimal conditions for 303
AAS pretreatment depend on the biomass type could be an interesting subject for future 304
investigations. In the present study, 3 days at 22°C were chosen as the optimal 305
conditions among the ones tested for AAS pretreatment of manure fibers since they 306
exhibited the higher methane yield and hence they were applied to all subsequent 307
experiments. 308
309
3.2. Effect of AAS on the composition of manure fibers 310
The composition of raw and digested manure fibers before and after AAS pretreatment 311
for 3 days at 22°C is shown in Table 1. The TS content of raw and digested fibers was 312
31.98 0.2% and 27.82 0.98%, respectively. The TS/VS ratio in raw and digested 313
fibers accounted for 1.27 and 1.44, respectively and it remains the same for AAS-treated 314
fibers as well. 315
Soluble COD values imply that solubilisation of the solid matrix took place with AAS 316
pretreatment (7.6% and 14.8% for digested fibers and 5.0% and 7.6% for raw fibers 317
before and after AAS pre-treatment, respectively). Solubilisation was significantly 318
higher in digested than in raw fibers. 319
As it was expected and according to the literature [9] cellulose (glucan fraction) was not 320
degraded during the pretreatment. Xylan (corresponding to hemicelluloses fraction) did 321
not seem to be degraded either. The non-destruction of sugars was attributed to the mild 322
nature of AAS, not involving high temperature and/or pressure and oxidative 323

15
conditions. The decreased concentration of glucan and xylan in digested fibers 324
compared to the raw fibers could be attributed to the fact that digested fibers had 325
already undergone an anaerobic digestion step resulting thus to a small decomposition 326
of the carbohydrate fractions. The same explanation could apply for the higher lignin 327
content in digested fibers: part of TS was removed during anaerobic digestion while 328
lignin remained intact, comprising thus a higher fraction of TS in digested samples. A 329
first-order solubilisation of the lignin during AAS could explain the higher lignin 330
removal for the higher initial concentration samples (digested) in comparison to the raw 331
fibers. This hypothesis needs, however, further investigation. In order to verify that 332
AAS did not result in solubilisation of sugars, free sugars were determined as well 333
before and after AAS treatment and in all cases they remained below detection limit 334
(Table 1). 335
Ammonia concentration differed slightly among different types of fibers and in all cases 336
the amount of ammonia was low enough to allow anaerobic digestion to proceed 337
without inhibition. Specifically for the AAS-pretreated fibers, the NH4-N concentration 338
reached 0.15 and 0.28 g NH4-N/l for raw and digested fibers, respectively, after 339
ammonia removal. According to the literature, unadapted microorganisms can tolerate 340
ammonia concentration up to 1.5-2.5 g NH4-N/l before inhibition is observed [28]. 341
Moreover, the methanogenic inoculum used for the methane potential tests was adapted 342
to an NH4-N concentration of around 4 g/l. 343
344
3.3. Effect of organic loading of AAS pre-treated manure fibers on methane production 345
16
Different organic loadings of AAS pretreated raw and digested fibers were tested in 346
order to analyze possible inhibition due to components that may be formed during the 347
pretreatment, as it was described in detail in §2.5. 348
The final methane yields of non-pretreated (control fibers) and AAS-pretreated (AAS-349
fibers) digested fibers after 40 days of batch anaerobic digestion at different organic 350
loadings are shown in Fig. 3a. It was noticed that increasing of TS loading up to 1 g TS 351
per 10 ml of inoculum did not affect the final methane yield of either control- or AAS-352
fibers. Methane yield of control-fibers was 90 ± 7 ml CH4/g TS while the final methane 353
yield of AAS-fibers was 117 ± 4 ml CH4/g TS taking into account the values obtained 354
from all loadings. Increase of the final methane yield of the AAS-fibers compared to the 355
control fibers was calculated as 30.3 ± 7.9 %. 356
In case of AAS-fibers, even though the final methane yield was the same for all 357
loadings tested, the methane production rate was different (Fig. 4b). Specifically, during 358
the first 10 days, the methane production rate in the vials with 0.5 and 1 g TS per 10 ml 359
of inoculum was lower than the rate observed for the first two loadings (0.16 and 0.25 g 360
TS per 10 ml of inoculum) with the rate decreasing with increasing loading. This 361
implies that an inhibition, most probably due to inhibitors formed during the 362
pretreatment, occurred. The inhibition was overcome after 18 days of digestion where 363
the methane production reached the same level for all loadings. Apparently, the 364
microbial culture could quickly adapt and this is an indication that inhibition will not 365
constitute a problem in a continuous process for anaerobic digestion of AAS pretreated 366
digested fibers, at least up to the loading tested. 367
For raw fibers the profiles of methane yield at different loadings were different than 368
those of digested fibers. Fig. 3b shows the final methane yields of non-pretreated 369
17
(control fibers) and AAS-pretreated (AAS-fibers) raw fibers after approximately 40 370
days of batch anaerobic digestion. Increment in TS loading from 0.16 to 1 g TS/10 ml 371
of inoculum did not affect the methane yield of control-fibers. Methane yield was 116 ± 372
9 ml CH4/g TS taking into account all loadings. On the other hand, the same increment 373
in TS loading of AAS-fibers resulted in reduced methane yield for loadings higher than 374
0.16 g TS/10 ml of inoculum. Specifically, the vials loaded with 0.16 gTS/10 ml of 375
inoculum exhibited a methane yield of 320 ml CH4/g TS (corresponding to a 177.8% 376
increase compared to that of control-fibers) while the methane yield decreased to 180 377
ml CH4/g TS for the vials loaded with 0.25 and 0.5 gTS/10 ml inoculum. The methane 378
yield became even lower (138 ml CH4/g TS corresponding to an increase of just 7.3 % 379
compared to that of control-fibers) in the vials loaded with the higher 1 gTS/10 ml of 380
inoculum. This implies the presence of methanogens’ inhibitors possibly due to the 381
AAS pretreatment of raw fibers. Furthermore, the inhibitory effect could not be 382
overcome with time (at least within 40 days), contrary to what happened with AAS-383
pretreated digested fibers. 384
The methane production rate of control-fibers (Fig. 5a) was also the same for all 385
loadings tested, while it was significantly reduced in the vials with a loading of 0.25, 0.5 386
and 1 g TS AAS-fibers/10 ml of inoculum (Fig. 5b) compared to the vials with the 387
lowest loading of 0.16. An increase of the production rate was observed for the highest 388
loading after 12 days of digestion; however the methane production reached a 389
significantly lower level than in the vials with the lowest loading. The results obtained 390
clearly imply that a strong inhibition of anaerobic digestion process occurred with AAS-391
pretreated raw fibers at increased loadings. It could be either of the four distinct steps, 392
hydrolysis, acidogenesis, acetogenesis and methanogenesis, or more than one step that 393
18
are inhibited. It is also likely that this inhibition will be overcome in a continuous 394
system where the microbial community will be exposed for long enough time to adapt 395
to the inhibitors. Moreover, the different inhibition intensity observed between the 396
AAS-pretreated digested and AAS-pretreated raw fibers could be due to the interaction 397
of the ammonia and the easily biodegradable organic matter present in the raw fibers. 398
All the three abovementioned issues regarding inhibited step(s), possibility of 399
adaptation and inhibition causes exhibit profound scientific interest and deserve further 400
investigation. 401
402
3.4. Effect of AAS on enzymatic hydrolysis step 403
Enzymatic hydrolysis tests were performed in digested fibers. AAS-fibers (pretreated 404
for 3 days at 22°C) and control-fibers were hydrolyzed using enzymes from Novozymes 405
biomass kit (as described in § 2.6) in order to compare the effect of hydrolytic enzymes 406
on pretreated and non-pretreated digested fibers. Free sugar concentrations at different 407
enzymatic loadings (5, 15 and 25 FPU/g TS) as well as hydrolytic efficiencies based on 408
glucose and xylose release are presented in Figs. 6a and b, respectively. 409
The addition of enzymes to the control-fibers had insignificant effect on the release of 410
free sugars. This could be attributed to the intact lignocellulosic structure of non-411
pretreated fibers, which did not allow the enzymes to reach cellulose and 412
hemicelluloses. On the other hand, enzymatic hydrolysis had a significant effect on 413
AAS-fibers. Free sugars reached a maximum total concentration of 19 g per 100 g-TS 414
corresponding to a hydrolytic efficiency of 80 and 65% for glucose and xylose 415
respectively. It was concluded that the AAS pretreatment had affected the 416
lignocellulosic structure allowing the enzymes to hydrolyse the released cellulose and 417
19
hemicellulose. The effect of such a pretreatment on anaerobic digestion process would 418
have been a faster hydrolysis step and consequently an increased biogas production rate. 419
An increase of the enzymatic loading from 15 to 25 FPU/g TS had a relatively small 420
effect on the free sugars release. 421
422
4. Conclusions 423
In the present study, aqueous ammonia soaking (AAS) was investigated as a moderate 424
and sustainable method for enhancing the methane potential of swine manure fibers. 425
AAS pretreatment exhibited a significant enhancement of methane potential. AAS for 3 426
days at 22°C resulted at a 30-80 and 178% increase in methane yield from digested and 427
raw manure fibers, respectively. The positive effect of AAS on the methane yield was 428
due to the facilitation of hydrolysis step of anaerobic digestion process and could be 429
attributed to AAS directly affecting the disintegration step of the lignocellulosic matrix. 430
That was indicated by enzymatic hydrolysis tests of AAS-pretreated fibers, which 431
resulted to 80 and 65% hydrolysis efficiency of glucan and xylan compared to 432
insignificant numbers for non-pretreated fibers. Moreover, batch anaerobic digestion of 433
AAS-pretreated digested manure fibers could stand loadings as high as 100 g TS /l 434
inoculum with no inhibition problems. On the other hand, batch anaerobic digestion of 435
AAS-pretreated raw manure fibers exhibited an inhibition of the methane production 436
rate and potential for loadings higher than 16 g TS /l inoculum. 437
438
Acknowledgement 439
The authors wish to thank the EUDP-2008, Energistyrelsen, Copenhagen for the 440
financial support of this work under RETROGAS project. 441
20
442
References 443
1. Poeschl M, Ward S, Owende P. Evaluation of energy efficiency of various biogas 444
production and utilization pathways, Applied Energy 2010;87:3305-3321. 445
2. Deublein D, Steinhauser A. Biogas from waste and renewable resources. Wiley 446
Online Library; 2008. 447
3. Thyø KA, Wenzel H. Life cycle assessment of biogas from maize sillage and from 448
manure, Xergi A/S, Denmark; 2007 449
www.xergi.com/images/stories/pdf/life_cycle_assessment_report.pdf (accessed in 450
2012). 451
4. Molinuevo-Salces B, González-Fernádez C, Gómez X, García-González M, Morán 452
C. Vegetable processing wastes addition to improve swine manure anaerobic 453
digestion: Evaluation in terms of methane yield and SEM characterization, Applied 454
Energy 2012, 91:36-42. 455
5. Wang G, Gavala HN, Skiadas IV, Ahring BK. Wet explosion of wheat straw and 456
codigestion with swine manure: Effect on the methane productivity, Waste Manage. 457
2009;29:2830-2835. 458
6. Hjorth M, Christensen KV, Christensen ML, Sommer SG. Solid—liquid separation 459
of animal slurry in theory and practice. A review, Agronomy for sustainable 460
development 2010;30:153-180. 461
7. Jurado E, Gavala HN, Rohold L, Skiadas IV. Cost-effective production of biogas 462
from manure - Retrogas project, Proceedings of the 3rd
International Conference on 463
Engineering for Waste and Biomass Valorisation, Beijing, May 17-19, 2010, p. 464
224. 465
21
8. Asam ZZ, Poulsen T, Nizami AS, Rafique R, Kiely G, Murphy JD. How can we 466
improve biomethane production per unit of feedstock in biogas plants? Applied 467
Energy 2011, 88:2013-2018. 468
9. Kim M, Aita G, Day DF. Compositional changes in sugarcane bagasse on low 469
temperature, long-term diluted ammonia treatment, Appl. Biochem. Biotechnol. 470
2010;161:34-40. 471
10. Frigon J-C, Guiot SR. Biomethane production from starch and lignocellulosic 472
crops: a comparative review, Biofules, Bioprod. Bioref. 2010, 4:447-458. 473
11. Mehrdad Adl, Kuichuan Sheng, Arash Gharibi. Technical assessment of bioenergy 474
recovery from cotton stalks through anaerobic digestion process and the effects of 475
inexpensive pre-treatments, Applied Energy 2012, 93: 251-260. 476
12. Zhen-Hu Hu, Zhen-Bo Yue, Han-Qing Yu, Shao-Yang Liu, Hideki Harada, Yu-477
You Li, Mechanisms of microwave irradiation pretreatment for enhancing 478
anaerobic digestion of cattail by rumen microorganisms, Applied Energy 2012, 93: 479
229-236. 480
13. Sompong O-Thong, Kanokwan Boe, Irini Angelidaki, Thermophilic anaerobic co-481
digestion of oil palm empty fruit bunches with palm oil mill effluent for efficient 482
biogas production, Applied Energy, 93:648-654. 483
14. Bruni E, Jensen AP, Angelidaki I. Comparative study of mechanical, hydrothermal, 484
chemical and enzymatic treatments of digested biofibers to improve biogas 485
production, Bioresour. Technol. 2010;101:8713-8717. 486
15. Kim TH, Lee Y. Pretreatment of corn stover by soaking in aqueous ammonia, Appl. 487
Biochem. Biotechnol. 2005;121-124:1119-1131. 488
22
16. Kim TH, Taylor F, Hicks KB. Bioethanol production from barley hull using SAA 489
(soaking in aqueous ammonia) pretreatment, Bioresour. Technol. 2008;99:5694-490
5702. 491
17. Ko JK, Bak JS, Jung MW, Lee HJ, Choi IG, Kim TH, Kim KH. Ethanol production 492
from rice straw using optimized aqueous-ammonia soaking pretreatment and 493
simultaneous saccharification and fermentation processes, Bioresour. Technol. 494
2009;100:4374-4380. 495
18. Fu Z, Holtzapple MT. Anaerobic mixed‐culture fermentation of aqueous 496
ammonia‐treated sugarcane bagasse in consolidated bioprocessing, Biotechnol. 497
Bioeng. 2010;106:216-227. 498
19. Gupta R, Lee Y. Investigation of biomass degradation mechanism in pretreatment 499
of switchgrass by aqueous ammonia and sodium hydroxide, Bioresour. Technol. 500
2010;101:8185-8191. 501
20. Himmelsbach J, Raman D, Anex R, Burns R, Faulhaber C. Effect of ammonia 502
soaking pretreatment and enzyme addition on biochemical methane potential of 503
switchgrass. Transactions of the ASABE 2010;53:1921-1927. 504
21. Jiang A. Ammonia recovery from digested dairy manure as nitrogen fertilizer. A 505
dissertation submitted in partial fulfillment of the requirements for the degree of 506
Doctor of Philosophy, Washington State University, Department of Biochemical 507
Systems Engineering, December 2009. 508
22. Jurado E, Gavala HN, Skiadas IV. ADM1-based modeling of anaerobic digestion of 509
swine manure fibers pretreated with aqueous ammonia soaking, Proceedings of the 510
4th
International Symposium on Energy from biomass and Waste, 2012, San 511
Servolo, Venice (Italy), November 12-15. 512

23
23. APHA. Standard Methods for the Examination of Water and Wastewater. 21st edn, 513
American Public Health Association/ American Water Works Association/ Water 514
Pollution Control Federation.Washington DC, USA; 2005. 515
24. Haagensen F, Skiadas IV, Gavala HN, Ahring BK. Pre-treatment and ethanol 516
fermentation potential of olive pulp at different dry matter concentrations, Biomass 517
Bioenergy 2009;33:1643-1651. 518
25. Sluite A, Hames B, Ruiz R, Scarlata C, Sluiter J, Templeton D, Crocker D. 519
Determination of structural Carbohydrates and Lignin in Biomass. National 520
Renewable Energy Laboratory (NREL); 2011, 521
www.nrel.gov/biomass/pdfs/42618.pdf, accessed in 2012. 522
26. Mandels M, Andreotti R, Roche C. Measurement of saccharifying cellulase, 523
Biotechnology and bioengineering 1976;6:21-33. 524
27. Ghose T. Measurement of cellulase activities, Pure Appl. Chem. 1987;59:257-268. 525
28. Hansen KH, Angelidaki I, Ahring BK. Anaerobic digestion of swine manure: 526
inhibition by ammonia, Water Res. 1998;32:5-12. 527
528
24
Figure captions 529
530
Fig. 1 - Methane yield after 35 days of anaerobic digestion of control-fibers and AAS 531
pretreated digested fibers (AAS-fibers) at different pretreatment durations and 532
temperatures. 533
Fig. 2 - Methane yield profile during 50 days anaerobic digestion of control fibers and 534
AAS pretreated digested fibers (AAS-fibers). AAS was applied for 3 days at 22°C. 535
Fig. 3 - Methane yield after 40 days of anaerobic digestion of control-fibers and AAS-536
fibers at different g TS per 10 ml of inoculum ratios for (a) digested fibers and (b) raw 537
fibers. AAS was applied for 3 days at 22°C. 538
Fig. 4 - Methane yield after 40 days of anaerobic digestion of (a) control-fibers and (b) 539
AAS-fibers at different gTS per 10 ml inoculum ratios for digested fibers. AAS was 540
applied for 3 days at 22°C. 541
Fig. 5 - Methane yield after 40 days of anaerobic digestion of (a) control-fibers and (b) 542
AAS-fibers at different gTS per 10 ml inoculum ratios for raw fibers. AAS was applied 543
for 3 days at 22°C. 544
Fig. 6 - (a) Glucose and xylose monomers released after AAS pretreatment (3 days, 545
22°C) and enzymatic hydrolysis (4 days, 50°C, 120 rpm) and (b) enzymatic hydrolysis 546
efficiency. 547
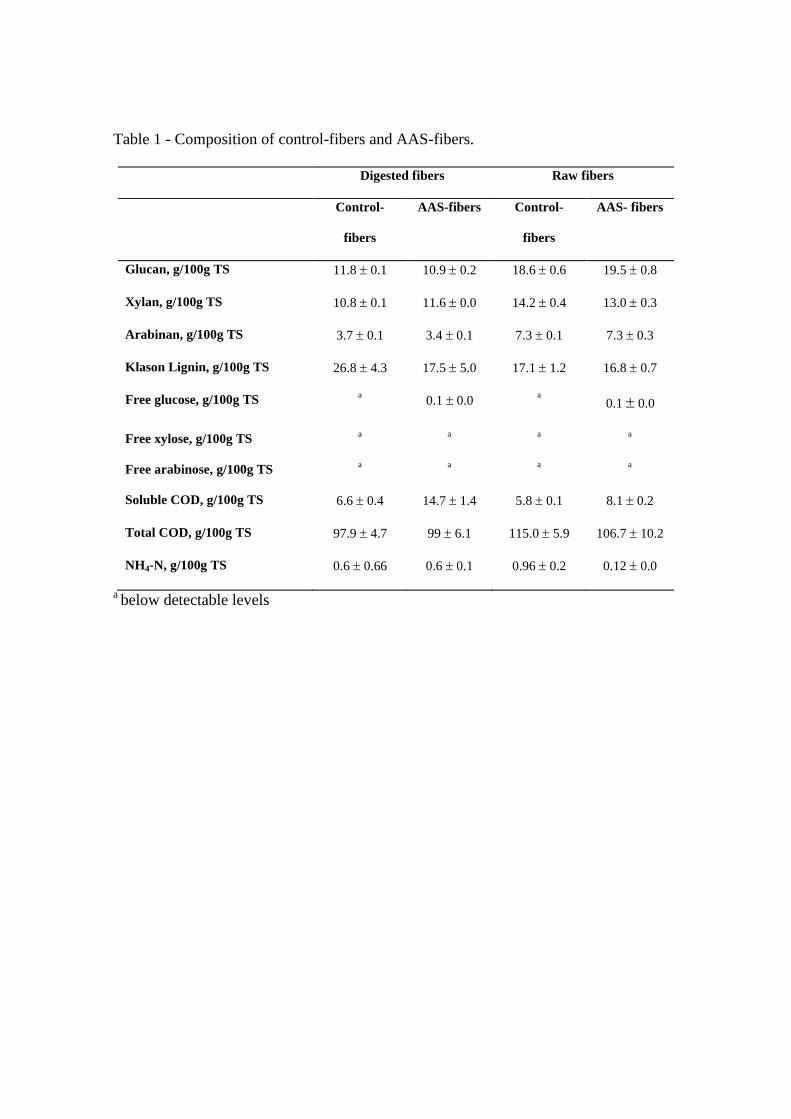
Table 1 - Composition of control-fibers and AAS-fibers.
Digested fibers Raw fibers
Control-
fibers
AAS-fibers Control-
fibers
AAS- fibers
Glucan, g/100g TS 11.8 0.1 10.9 0.2 18.6 0.6 19.5 0.8
Xylan, g/100g TS 10.8 0.1 11.6 0.0 14.2 0.4 13.0 0.3
Arabinan, g/100g TS 3.7 0.1 3.4 0.1 7.3 0.1 7.3 0.3
Klason Lignin, g/100g TS 26.8 4.3 17.5 5.0 17.1 1.2 16.8 0.7
Free glucose, g/100g TS a 0.1 0.0
a
0.1 0.0
Free xylose, g/100g TS a
a
a
a
Free arabinose, g/100g TS a
a
a
a
Soluble COD, g/100g TS 6.6 0.4 14.7 1.4 5.8 0.1 8.1 0.2
Total COD, g/100g TS 97.9 4.7
99 6.1 115.0 5.9 106.7 10.2
NH4-N, g/100g TS 0.6 0.66 0.6 0.1 0.96 0.2 0.12 0.0
a below detectable levels
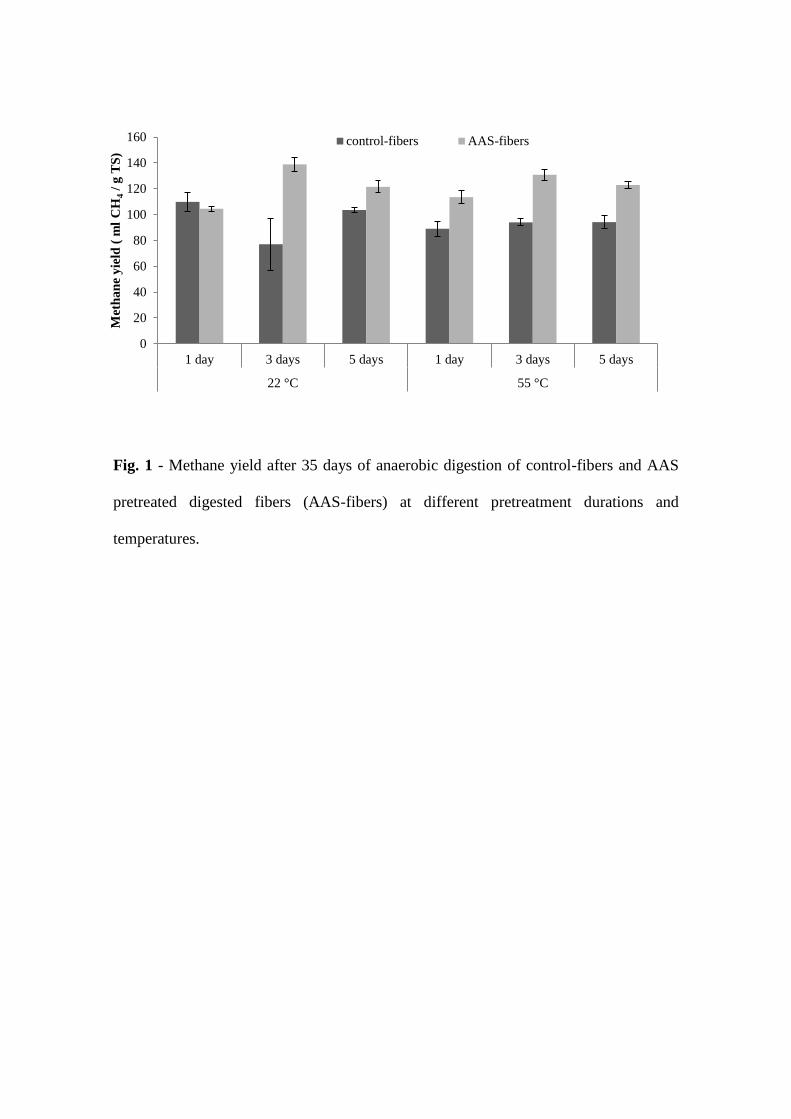
Fig. 1 - Methane yield after 35 days of anaerobic digestion of control-fibers and AAS
pretreated digested fibers (AAS-fibers) at different pretreatment durations and
temperatures.
0
20
40
60
80
100
120
140
160
1 day 3 days 5 days 1 day 3 days 5 days
22 °C 55 °C
Met
ha
ne
yie
ld (
ml
CH
4 /
g T
S)
control-fibers AAS-fibers
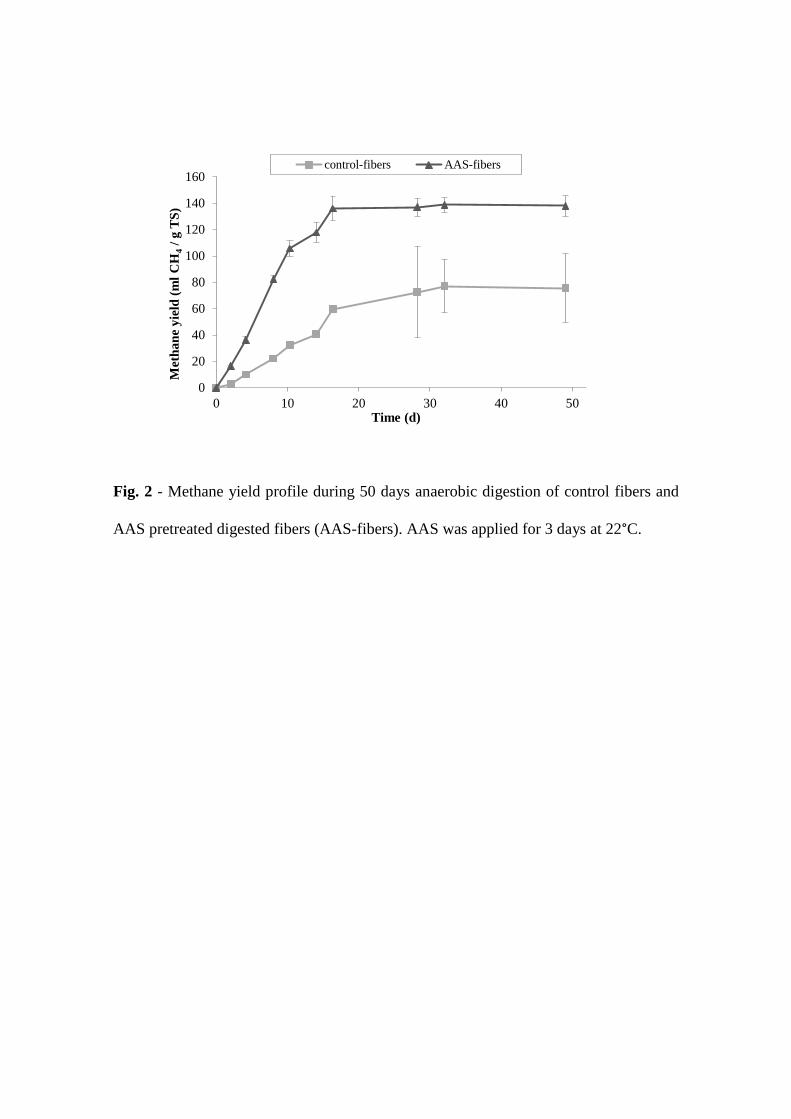
Fig. 2 - Methane yield profile during 50 days anaerobic digestion of control fibers and
AAS pretreated digested fibers (AAS-fibers). AAS was applied for 3 days at 22°C.
0
20
40
60
80
100
120
140
160
0 10 20 30 40 50
Met
ha
ne
yie
ld (
ml
CH
4 /
g T
S)
Time (d)
control-fibers AAS-fibers
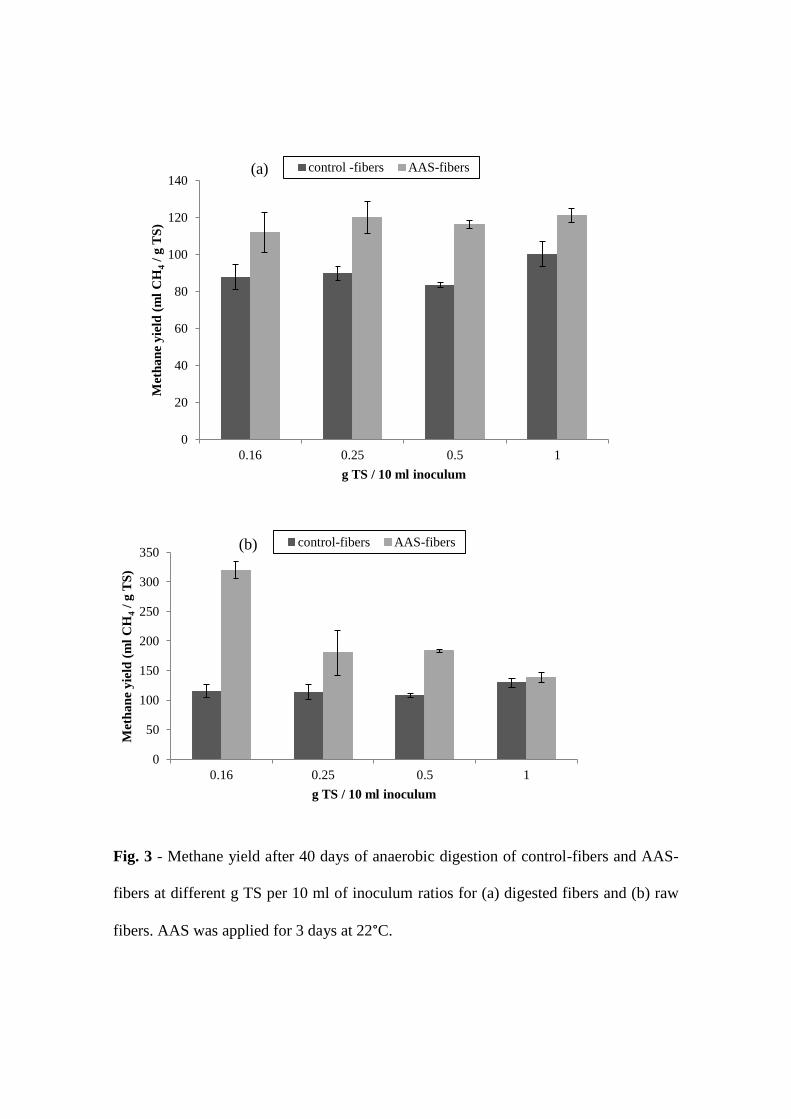
Fig. 3 - Methane yield after 40 days of anaerobic digestion of control-fibers and AAS-
fibers at different g TS per 10 ml of inoculum ratios for (a) digested fibers and (b) raw
fibers. AAS was applied for 3 days at 22°C.
0
20
40
60
80
100
120
140
0.16 0.25 0.5 1
Met
ha
ne
yie
ld (
ml
CH
4 /
g T
S)
g TS / 10 ml inoculum
control -fibers AAS-fibers
0
50
100
150
200
250
300
350
0.16 0.25 0.5 1
Met
ha
ne
yie
ld (
ml
CH
4 /
g T
S)
g TS / 10 ml inoculum
control-fibers AAS-fibers(b)
(a)
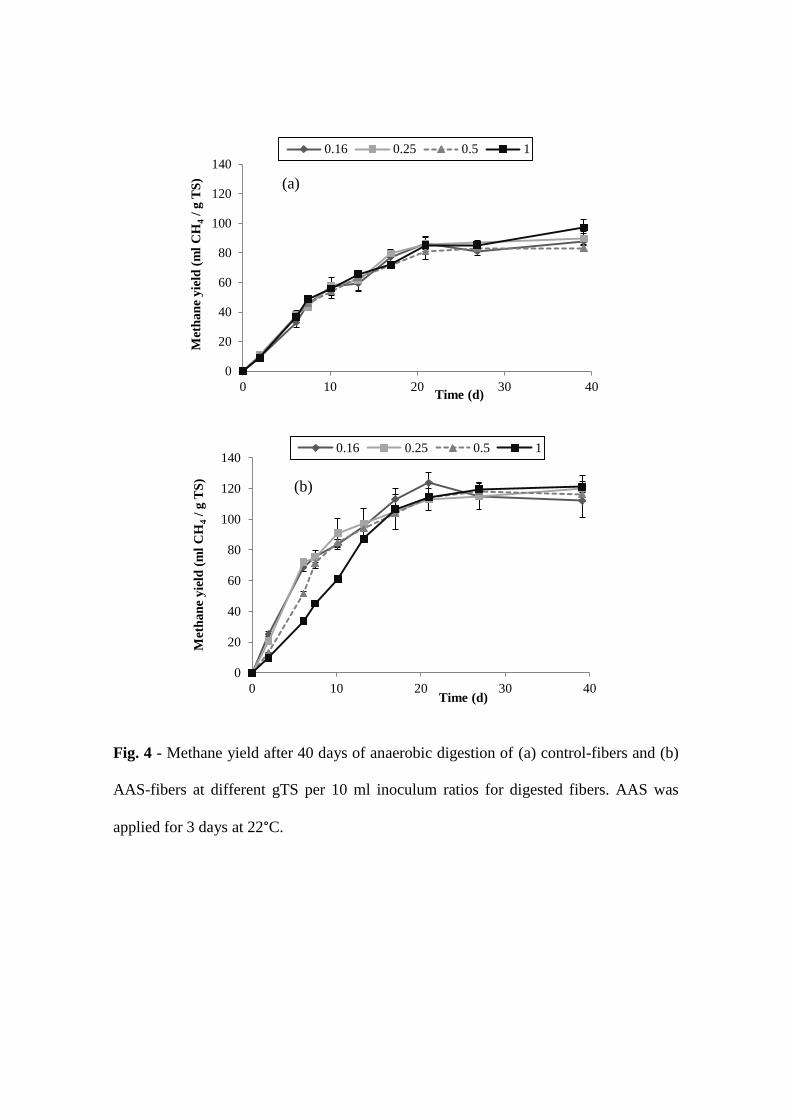
Fig. 4 - Methane yield after 40 days of anaerobic digestion of (a) control-fibers and (b)
AAS-fibers at different gTS per 10 ml inoculum ratios for digested fibers. AAS was
applied for 3 days at 22°C.
0
20
40
60
80
100
120
140
0 10 20 30 40
Met
ha
ne
yie
ld (
ml
CH
4 /
g T
S)
Time (d)
0.16 0.25 0.5 1
0
20
40
60
80
100
120
140
0 10 20 30 40
Met
ha
ne
yie
ld (
ml
CH
4 /
g T
S)
Time (d)
0.16 0.25 0.5 1
(a)
(b)
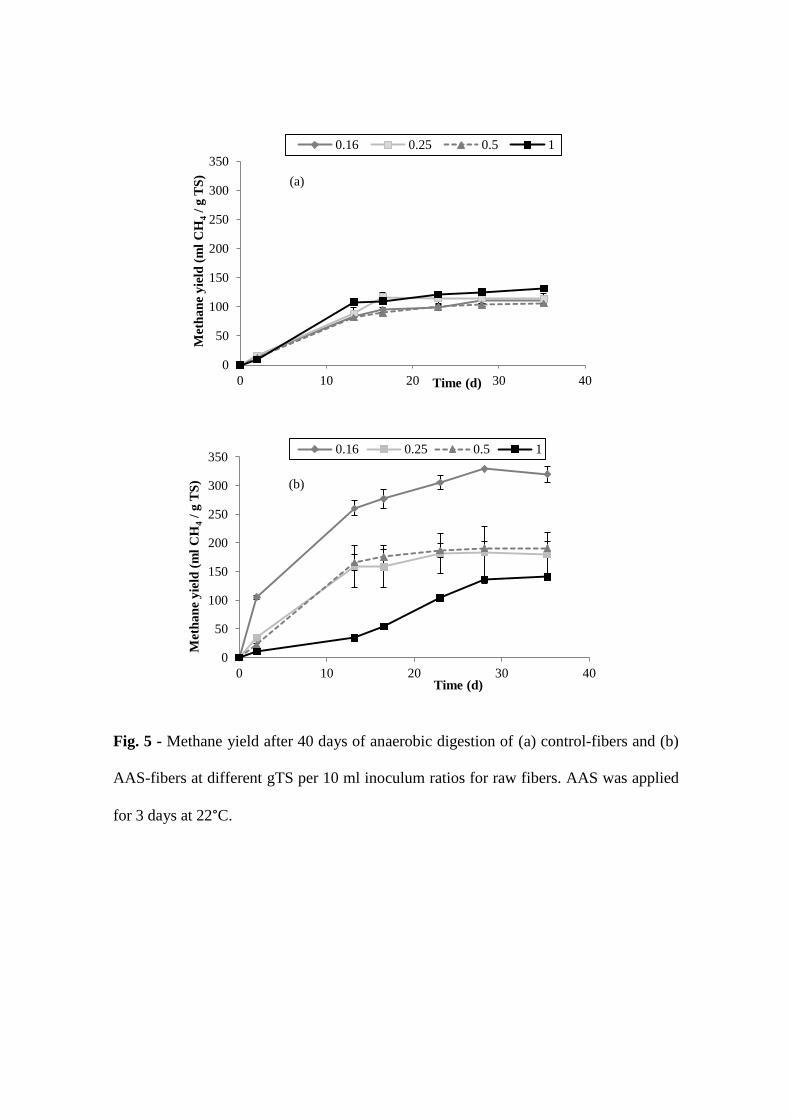
Fig. 5 - Methane yield after 40 days of anaerobic digestion of (a) control-fibers and (b)
AAS-fibers at different gTS per 10 ml inoculum ratios for raw fibers. AAS was applied
for 3 days at 22°C.
0
50
100
150
200
250
300
350
0 10 20 30 40
Met
ha
ne
yie
ld (
ml
CH
4 /
g T
S)
Time (d)
0.16 0.25 0.5 1
0
50
100
150
200
250
300
350
0 10 20 30 40
Met
ha
ne
yie
ld (
ml
CH
4 /
g T
S)
Time (d)
0.16 0.25 0.5 1
(a)
(b)
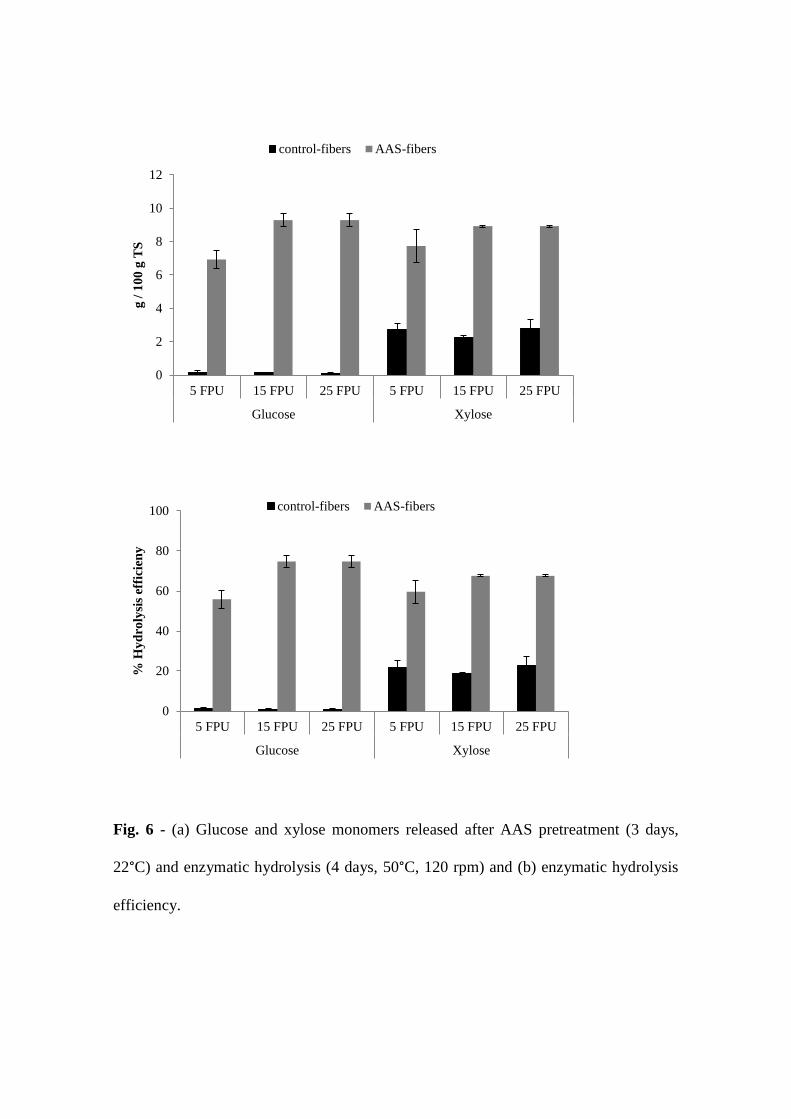
Fig. 6 - (a) Glucose and xylose monomers released after AAS pretreatment (3 days,
22°C) and enzymatic hydrolysis (4 days, 50°C, 120 rpm) and (b) enzymatic hydrolysis
efficiency.
0
2
4
6
8
10
12
5 FPU 15 FPU 25 FPU 5 FPU 15 FPU 25 FPU
Glucose Xylose
g /
10
0 g
TS
control-fibers AAS-fibers
0
20
40
60
80
100
5 FPU 15 FPU 25 FPU 5 FPU 15 FPU 25 FPU
Glucose Xylose
% H
yd
roly
sis
effi
cien
y
control-fibers AAS-fibers