methane, nitrous oxide and carbon-dioxide emissions from ... · methane, nitrous oxide and...
TRANSCRIPT
Methane, Nitrous Oxide and Carbon-dioxide emissions from the liquid dairy manure
management chain in New Zealand as affected by acidification and separation: a pilot study.
Sommer S.G.1, Clough T.J.2, Balaine N.2, Hafner S.1, Cameron K.C2, 1Institute of Chemical Eng., Biotechnology and Environmental Technology,
Faculty of Engineering, Univ. Southern Denmark, Campusvej 55, 5230 Odense M, Denmark.
2Dep. of Soil and Physical Sciences, Lincoln Univ., Lincoln 85084, Canterbury, New Zealand.

Hypotheses
•Acidification of effluent will reduce ammonia (NH3) and methane (CH4) emissions during storage.
•Physical separation of effluent will further affect the degree of emissions reduction.

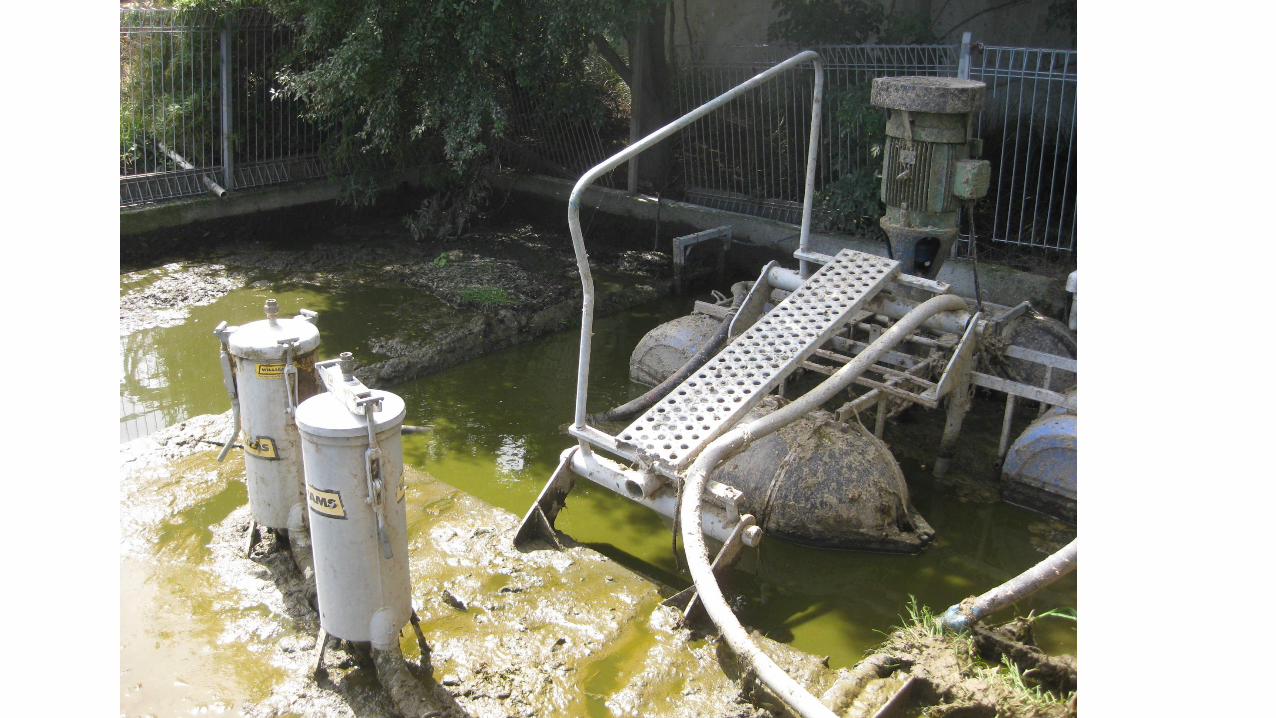
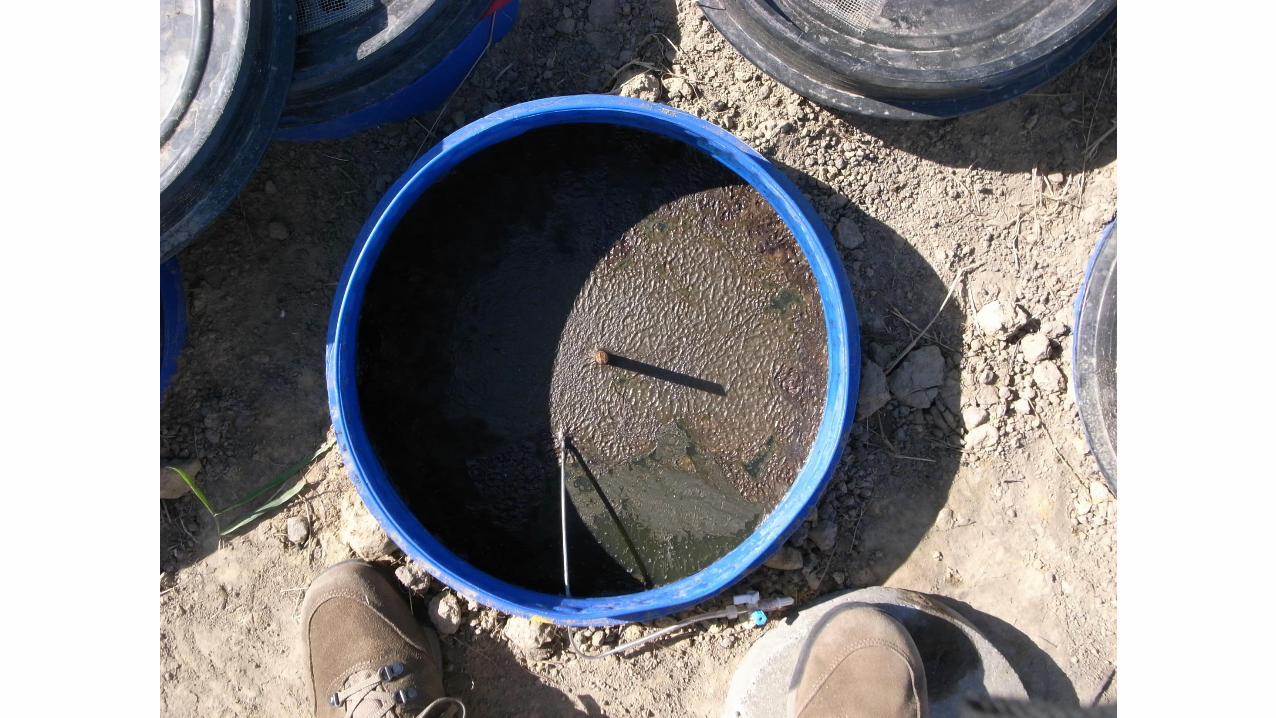
Methods
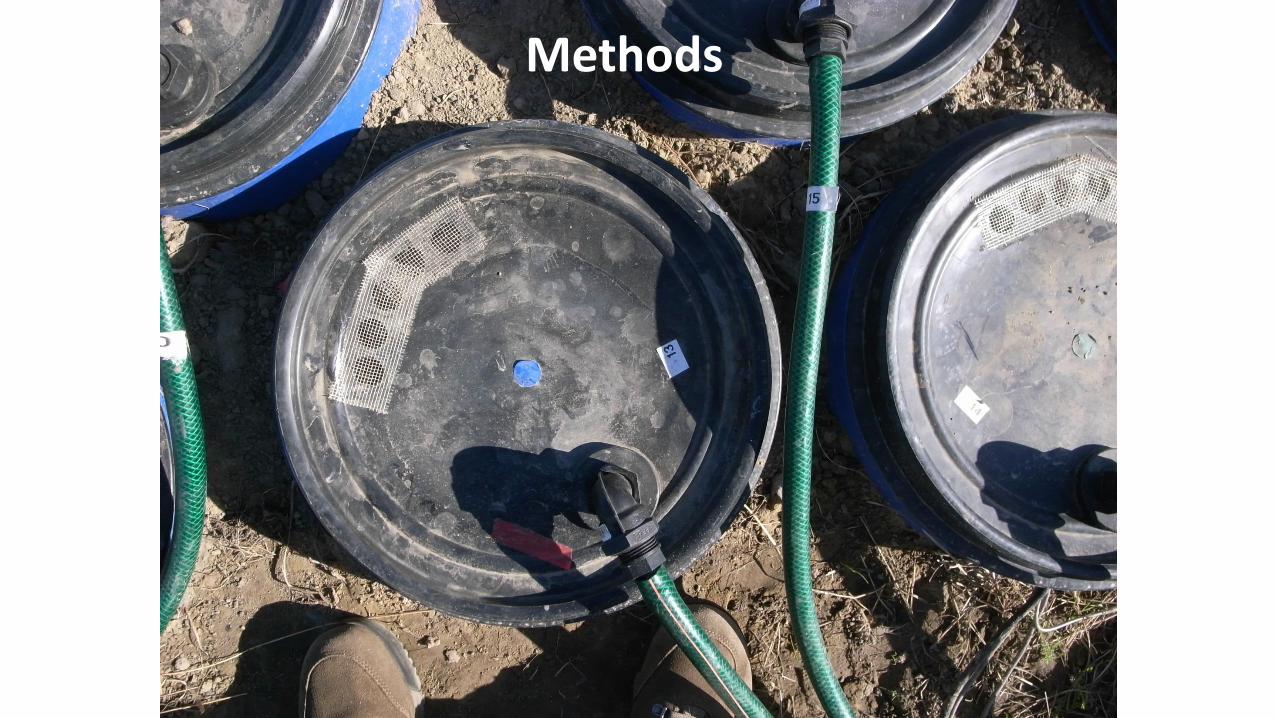
Methods
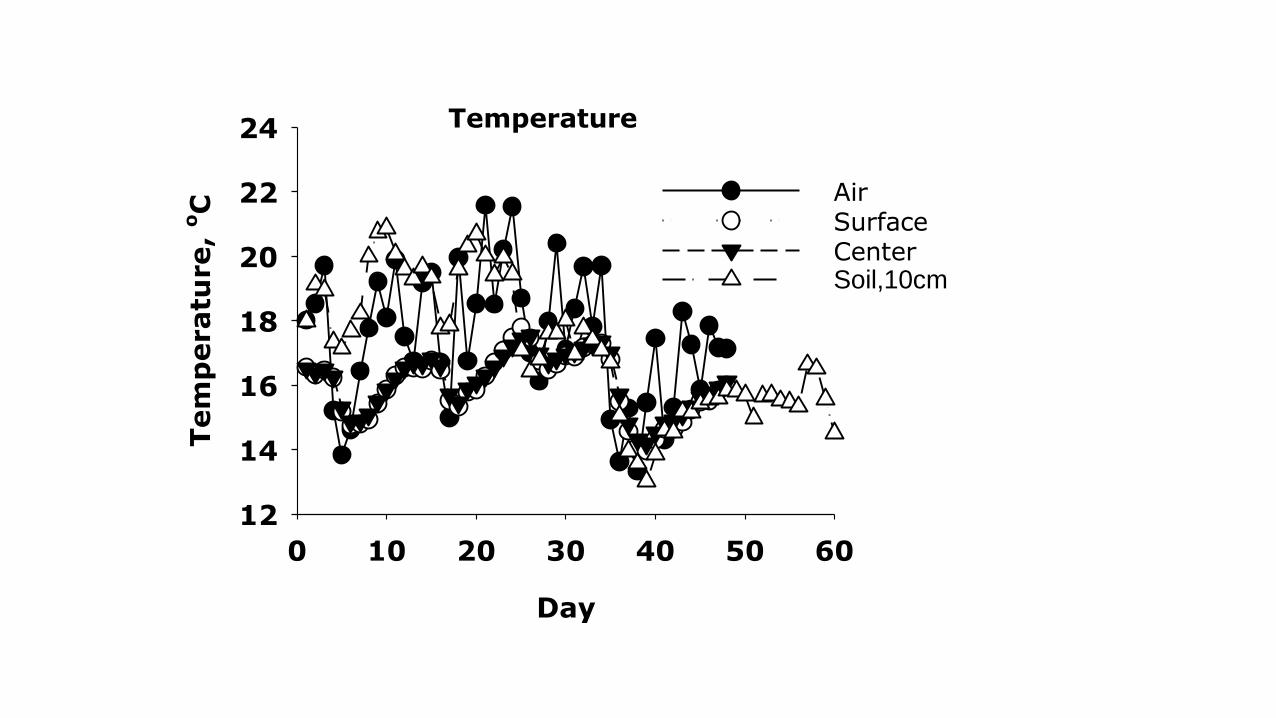
Temperature
Day
0 10 20 30 40 50 60
Tem
peratu
re,
oC
12
14
16
18
20
22
24
AirSurfaceCenterSoil,10cm
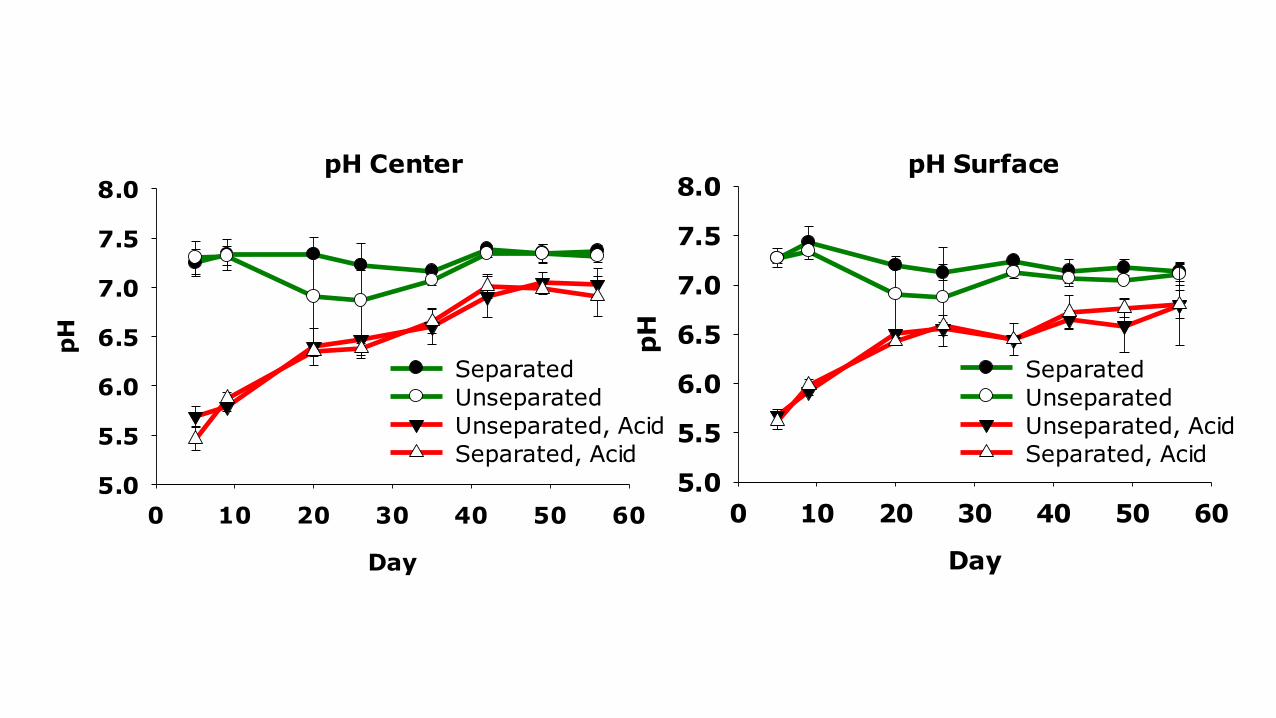
pH Center
Day
0 10 20 30 40 50 60
pH
5.0
5.5
6.0
6.5
7.0
7.5
8.0
Separated
Unseparated
Unseparated, Acid
Separated, Acid
pH Surface
Day
0 10 20 30 40 50 60
pH
5.0
5.5
6.0
6.5
7.0
7.5
8.0
Separated
Unseparated
Unseparated, Acid
Separated, Acid
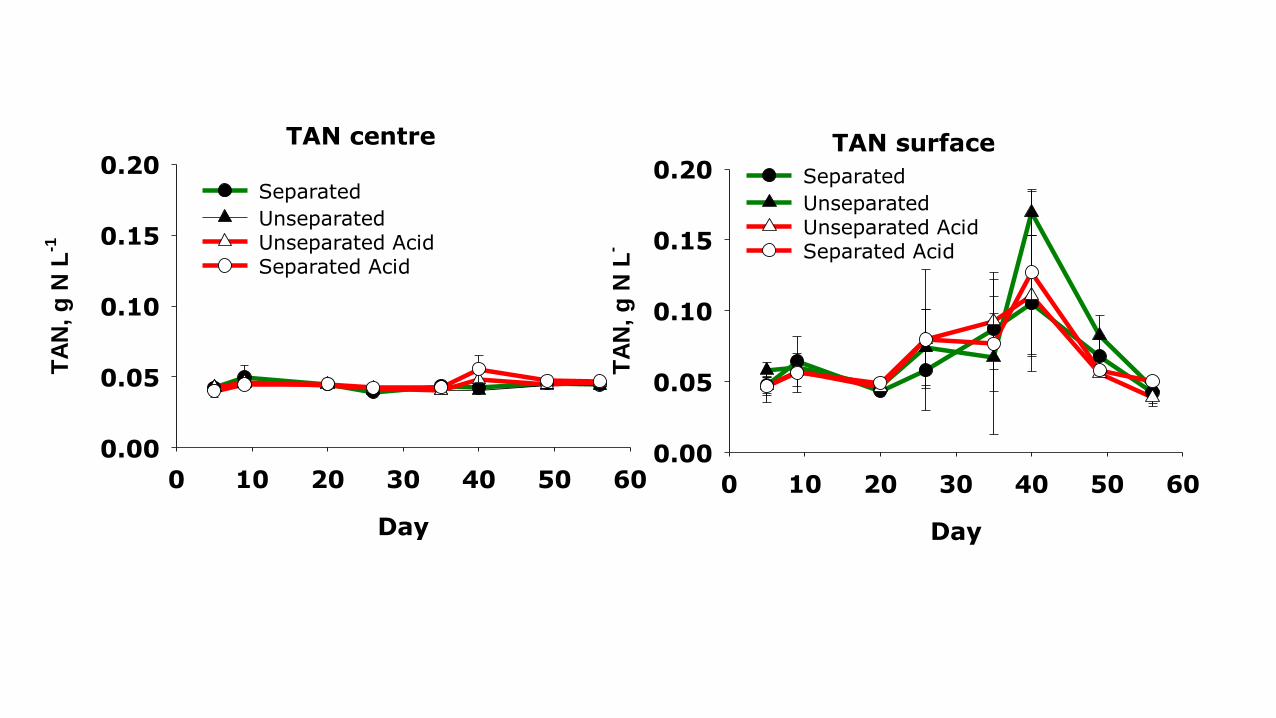
TAN centre
Day
0 10 20 30 40 50 60
TA
N,
g N
L-1
0.00
0.05
0.10
0.15
0.20Separated
UnseparatedUnseparated AcidSeparated Acid
TAN surface
Day
0 10 20 30 40 50 60
TA
N,
g N
L-
0.00
0.05
0.10
0.15
0.20 Separated
UnseparatedUnseparated AcidSeparated Acid
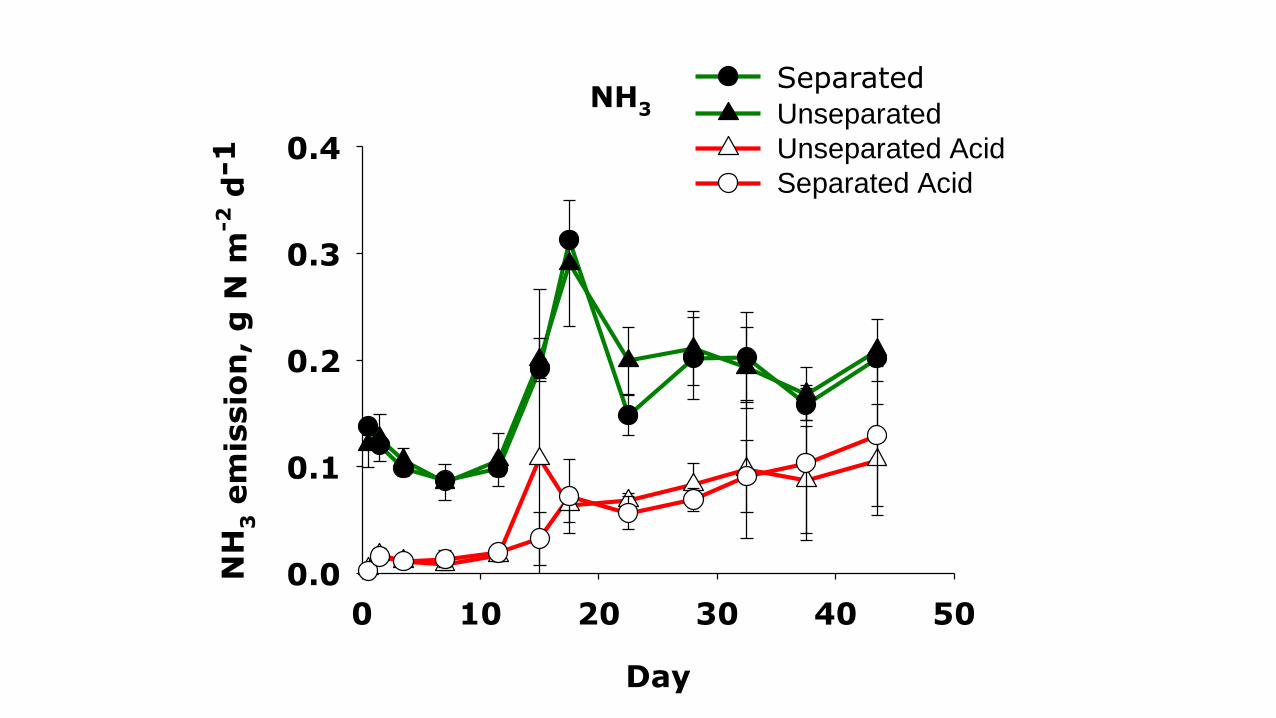
NH3
Day
0 10 20 30 40 50
NH
3 e
mis
sio
n,
g N
m-2
d-1
0.0
0.1
0.2
0.3
0.4
Separated
Unseparated
Unseparated Acid
Separated Acid
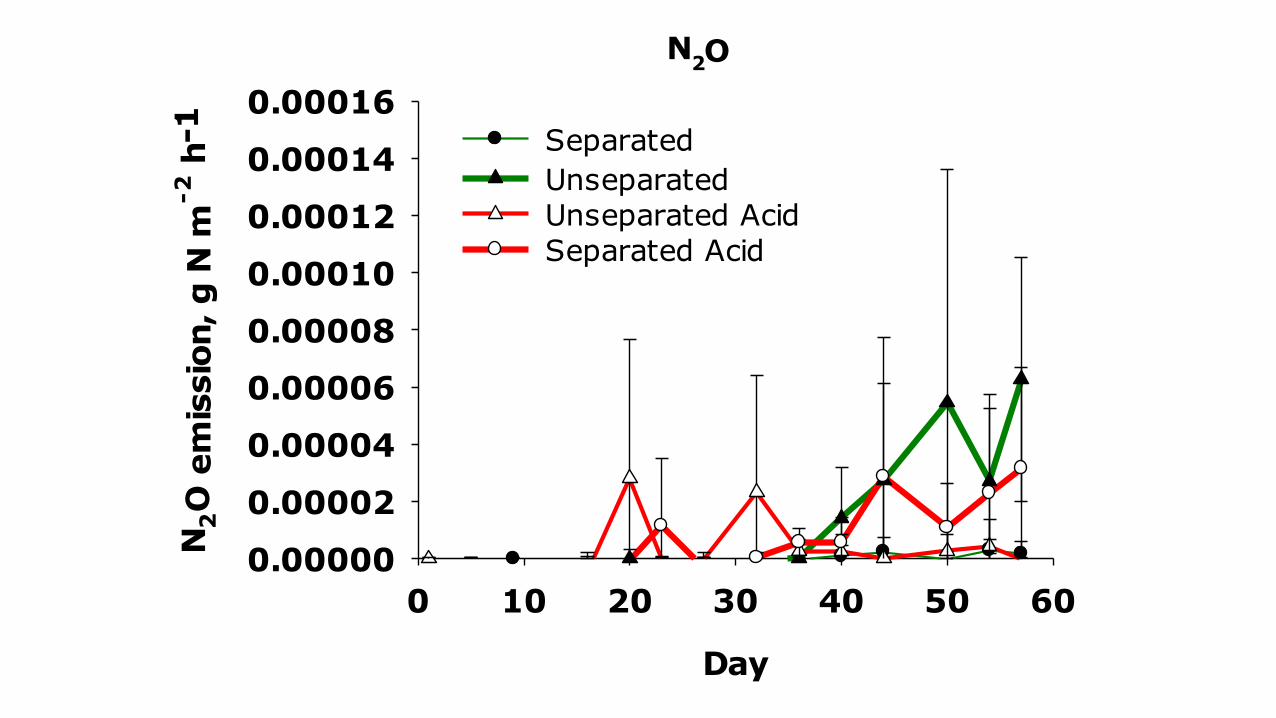
N2O
Day
0 10 20 30 40 50 60
N2O
em
issio
n, g N
m-2 h
-1
0.00000
0.00002
0.00004
0.00006
0.00008
0.00010
0.00012
0.00014
0.00016Separated
UnseparatedUnseparated AcidSeparated Acid
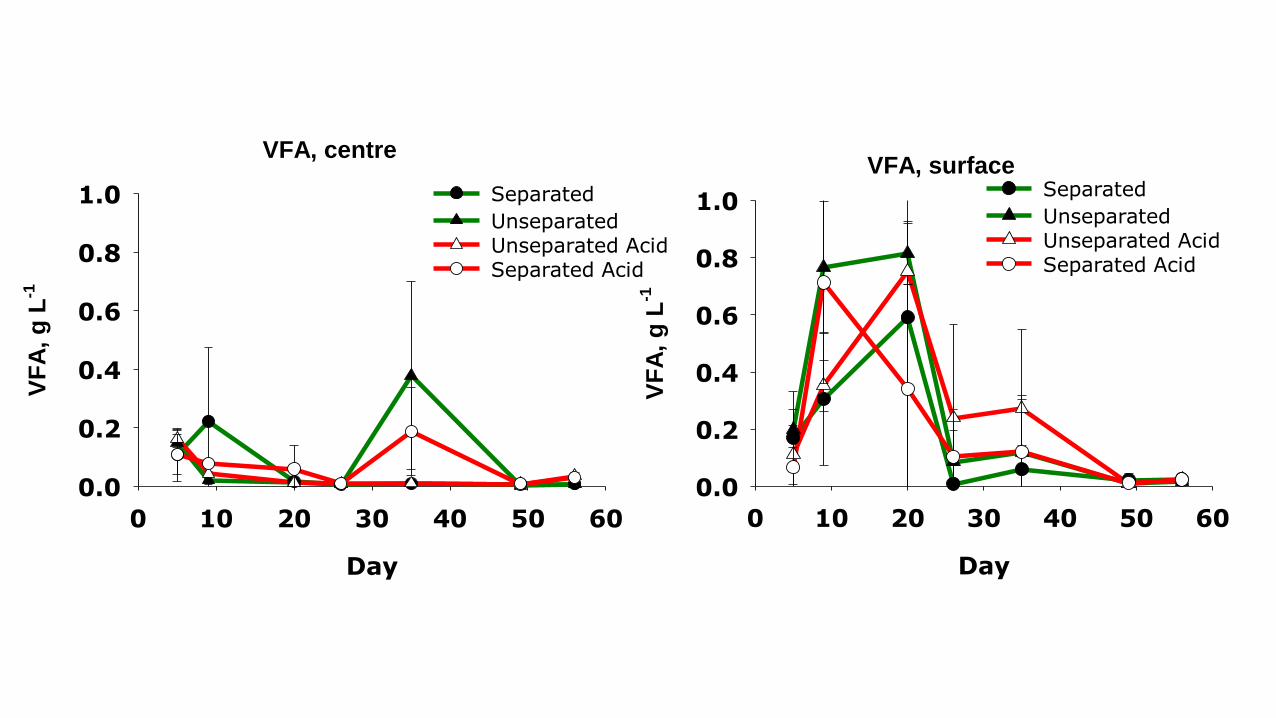
VFA, centre
Day
0 10 20 30 40 50 60
VF
A,
g L
-1
0.0
0.2
0.4
0.6
0.8
1.0 Separated
UnseparatedUnseparated AcidSeparated Acid
VFA, surface
Day
0 10 20 30 40 50 60
VF
A,
g L
-1
0.0
0.2
0.4
0.6
0.8
1.0Separated
UnseparatedUnseparated AcidSeparated Acid
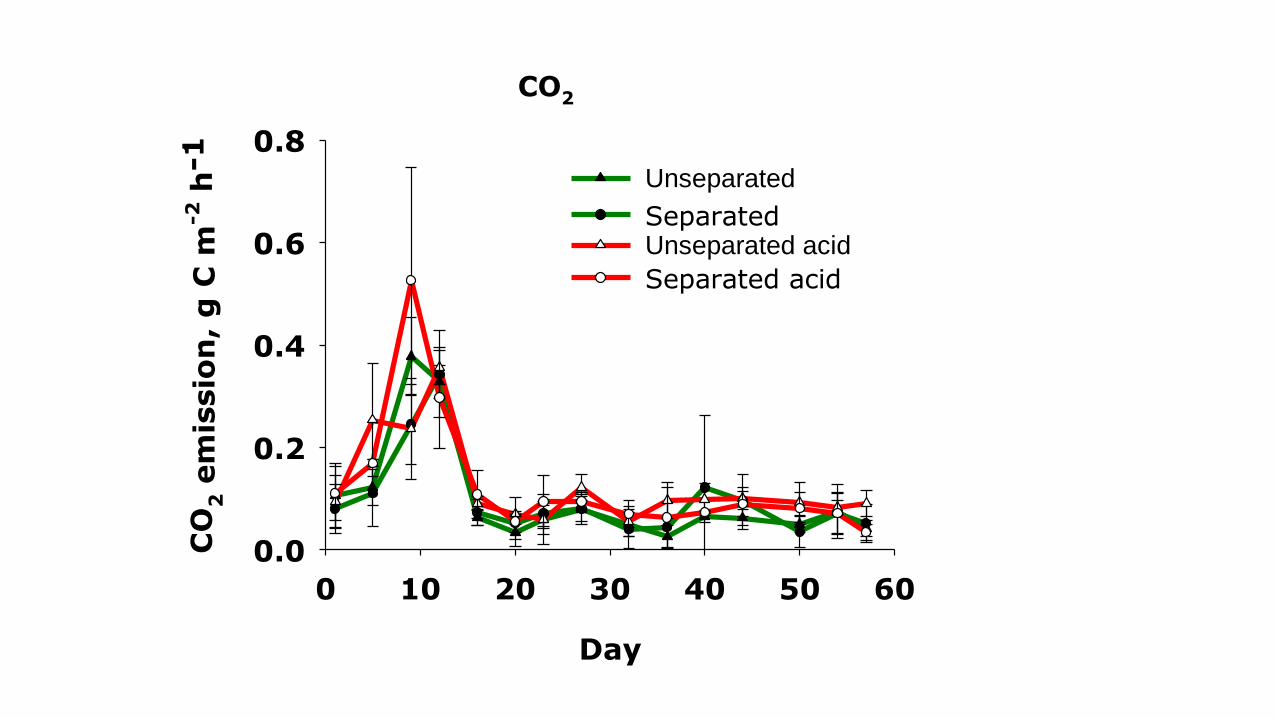
CO2
Day
0 10 20 30 40 50 60
CO
2 e
mis
sio
n,
g C
m-2
h-1
0.0
0.2
0.4
0.6
0.8
Separated
Unseparated
Unseparated acid
Separated acid
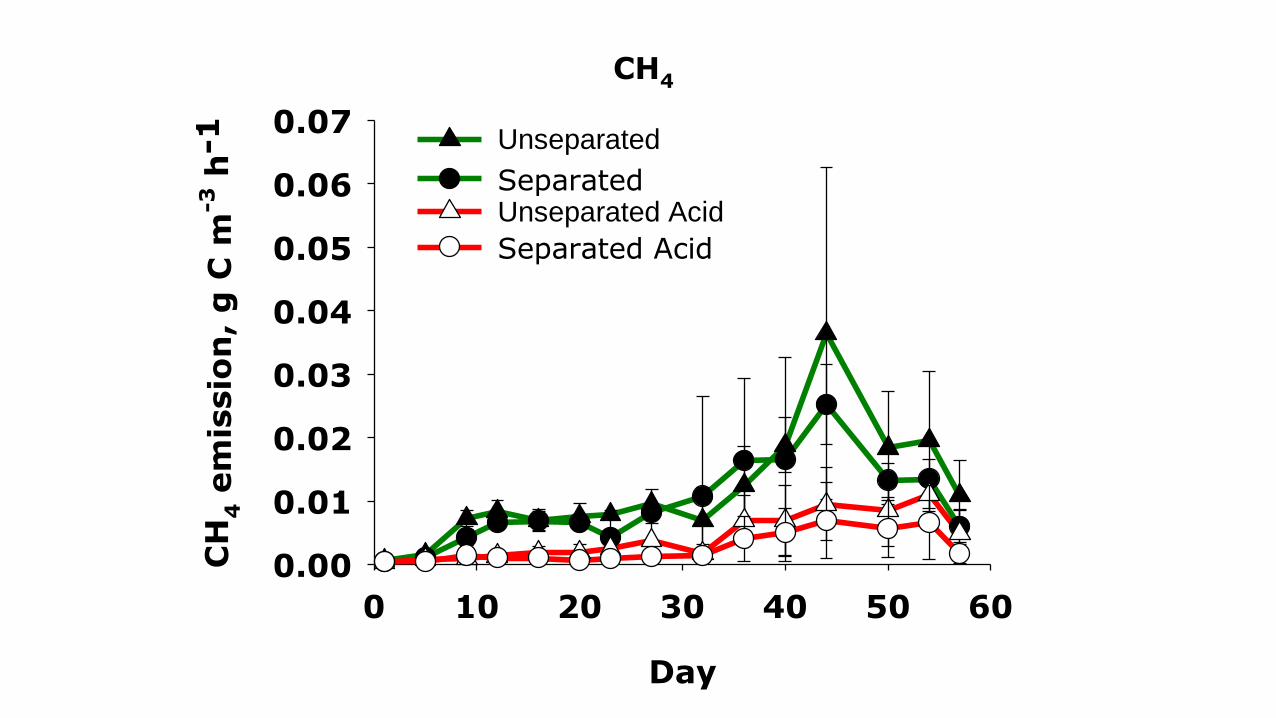
CH4
Day
0 10 20 30 40 50 60
CH
4 e
mis
sio
n,
g C
m-3
h-1
0.00
0.01
0.02
0.03
0.04
0.05
0.06
0.07
Separated
Unseparated
Unseparated Acid
Separated Acid
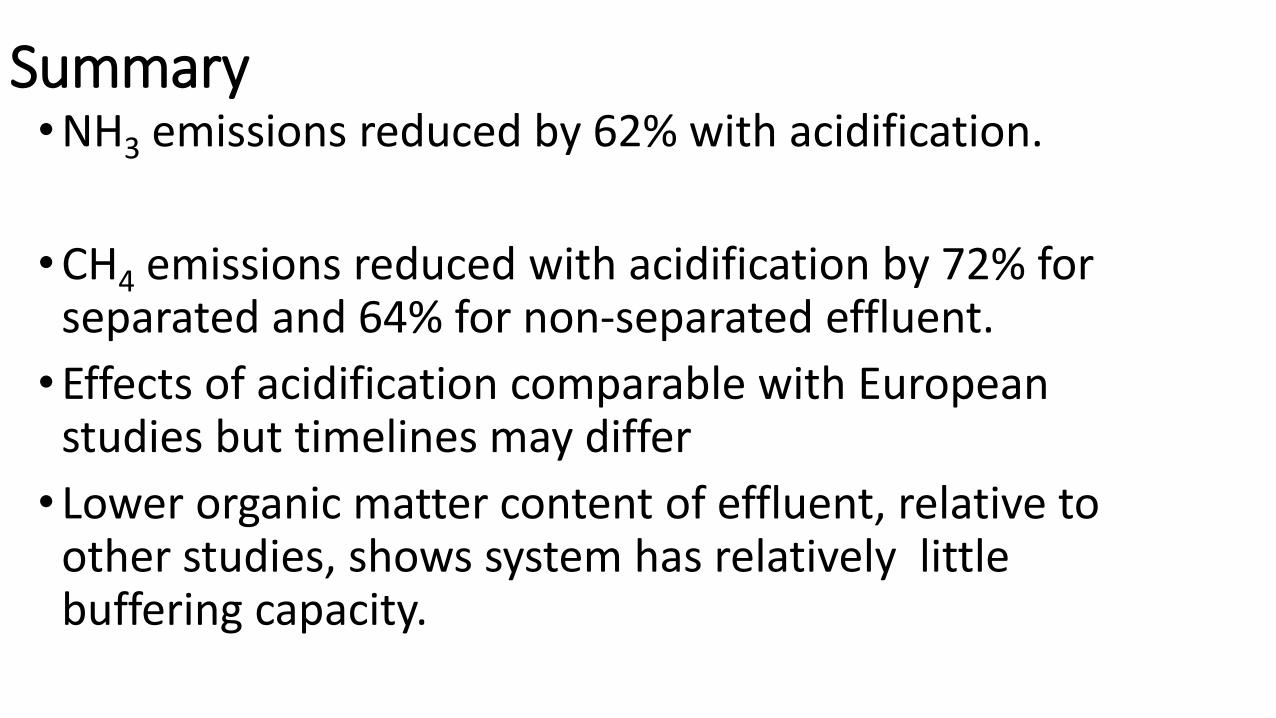
Summary•NH3 emissions reduced by 62% with acidification.
•CH4 emissions reduced with acidification by 72% for separated and 64% for non-separated effluent.
•Effects of acidification comparable with European studies but timelines may differ
• Lower organic matter content of effluent, relative to other studies, shows system has relatively little buffering capacity.