methane and nitrous oxide sources and emissions in a
TRANSCRIPT
Biogeosciences 11 5245ndash5258 2014wwwbiogeosciencesnet1152452014doi105194bg-11-5245-2014copy Author(s) 2014 CC Attribution 30 License
Methane and nitrous oxide sources and emissions in a subtropicalfreshwater reservoir South East Queensland AustraliaK Sturm 1 Z Yuan1 B Gibbes2 U Werner1 and A Grinham12
1Advanced Water Management Centre (AWMC) The University of Queensland Level 4 Gehrmann Building BrisbaneQueensland 4072 Australia2School of Civil Engineering The University of Queensland Level 5 Advanced Engineering Building BrisbaneQueensland 4072 Australia
Correspondence toA Grinham (agrinhamuqeduau)
Received 31 October 2013 ndash Published in Biogeosciences Discuss 11 December 2013Revised 7 August 2014 ndash Accepted 30 August 2014 ndash Published 30 September 2014
Abstract Reservoirs have been identified as an importantsource of non-carbon dioxide (CO2) greenhouse gases withwide ranging fluxes for reported methane (CH4) howeverfluxes for nitrous oxide (N2O) are rarely quantified Thisstudy investigates CH4 and N2O sources and emissions in asubtropical freshwater Gold Creek Reservoir Australia us-ing a combination of waterndashair and sedimentndashwater flux mea-surements and water column and pore water analyses Thereservoir was clearly a source of these gases as surface wa-ters were supersaturated with CH4 and N2O AtmosphericCH4 fluxes were dominated by ebullition (60 to 99 ) rel-ative to diffusive fluxes and ranged from 414times 102 to306times 105 micromol CH4 mminus2 dayminus1 across the sampling sitesDissolved CH4 concentrations were highest in the anoxicwater column and sediment pore waters (approximately5 000 000 supersaturated) CH4 production rates of up to3616plusmn 395 micromol CH4 mminus2 dayminus1 were found during sedi-ment incubations in anoxic conditions These findings are incontrast to N2O where no production was detected duringsediment incubations and the highest dissolved N2O concen-trations were found in the oxic water column which was 110to 220 supersaturated with N2O N2O fluxes to the atmo-sphere were primarily through the diffusive pathway mainlydriven by diffusive fluxes from the water column and by aminor contribution from sediment diffusion and ebullitionResults suggest that future studies of subtropical reservoirsshould monitor CH4 fluxes with an appropriate spatial reso-lution to ensure capture of ebullition zones whereas assess-ment of N2O fluxes should focus on the diffusive pathway
1 Introduction
Methane (CH4) and nitrous oxide (N2O) are powerful green-house gases (GHGs) and are of emerging environmentalconcern Their global warming potentials (GWPs) are 25and 310 times that of carbon dioxide (CO2) respectivelywhen calculated on a 100-year time horizon (IPCC 2007)Man-made reservoirs which include those for hydropoweragriculture or drinking water purposes are now consideredsignificant contributors of these GHGs particularly CH4(Barros et al 2011 Bastviken et al 2011 St Louis etal 2000) The recognition of reservoirs as anthropogenicsources of GHGs has thus increased global interest in themeasurement monitoring and modelling of these emissionsThe result is a discontinuous database of a large range of pri-marily CH4 fluxes of which studies in potentially importantareas such as the tropics and subtropics as well as whole con-tinents like Australia remain scarce (Mendonccedila et al 2012Ortiz-Llorente and Alvarez-Cobelas 2012 St Louis et al2000) Fewer studies conducted worldwide have analysedthe contribution of N2O to GHG emissions from reservoirs(Guerin et al 2008 Mengis et al 1997 Tremblay et al2005) despite N2O having a higher GWP than CH4 Thereare currently only two studies (Bastien and Demarty 2013Grinham et al 2011) reporting CH4 emissions and none forN2O from reservoirs in Australia ndash a country with over 2300reservoirs covering a surface area in excess of 5700 km2 atfull supply (Geoscience Australia 2004)
Freshwater reservoirs in Australia cover a large surfacearea and are essential for drinking water supply and irriga-tion purposes These reservoirs are typically closed systems
Published by Copernicus Publications on behalf of the European Geosciences Union
5246 K Sturm et al CH4 and N2O sources and emissions in a subtropical freshwater reservoir
without continuous release through a dam but may have pe-riodic release for environmental flows and drinking watersupplies These reservoirs enable storage and greater cer-tainty of supply compared to river and groundwater sourcesin Australia In reservoirs without continuous water re-lease the primary CH4 emission pathways to the atmosphereare ebullition from sediments diffusion over the waterndashairinterface and plant-mediated transport from littoral zones(Bastviken et al 2004) Ebullition has been shown to bethe dominant CH4 emission pathway in many tropical sys-tems (DelSontro et al 2011 Devol et al 1988 Grinham etal 2011 Joyce and Jewell 2003 Keller and Stallard 1994Soumis et al 2005) Factors controlling CH4 ebullition inlake systems are relatively well known (Bastviken et al2004 Joyce and Jewell 2003 Ortiz-Llorente and Alvarez-Cobelas 2012) however the dynamics and the spatial dis-tribution of ebullition are not well understood (DelSontro etal 2011 Ostrovsky et al 2008 Ramos et al 2006) CH4 istypically produced by the process of methanogenesis underanoxic conditions (Canfield et al 2005) as found in the sed-iment and hypolimnetic zones of a reservoir However zoneswithin a reservoir may contain large gradients in dissolvedoxygen (DO) availability (such as at the metalimnion understratified conditions or upper layers of shallow sediments)and promote oxidation of dissolved CH4 via methanotrophicbacteria (Guerin and Abril 2007) which can greatly reducediffusive emissions from the water surface
N2O production or consumption is also associated withthese zones where large DO gradients occur Under oxic con-ditions as found in the epilimnion or metalimnion N2O isprimarily produced as a byproduct of nitrification At oxicndashanoxic boundaries N2O is produced as an intermediate ofdenitrification (Mengis et al 1997 Ward 1996) or can bereduced to nitrogen gas during denitrification (Lipschultz etal 1990 Mengis et al 1997) In stratified reservoirs theoxicndashanoxic boundaries are found in the water column Inwell-mixed systems or at shallow sites DO can reach thesediment surface and thus N2O can be produced in the wa-ter column as well as in the upper layers of sediment
The low-latitude reservoirs of Australia provide ideal con-ditions for GHG production consumption and emissionsThe generally higher temperatures experienced in tropical re-gions drive thermal stratification and a rapid deoxygenationof bottom waters (Barros et al 2011 Tundisi and Tundisi2012) Irregular and heavy precipitation events can lead tothe input of high organic carbon loads into the water body(Tundisi et al 1993) The organic carbon loads togetherwith elevated temperatures and deoxygenated bottom wa-ters of these reservoirs will provide conditions that enhanceCH4 production and emissions (Demarty and Bastien 2011Fearnside 1995 Galy-Lacaux et al 1999) The steep oxy-gen gradients and high ammonium turnover found in sub-tropical reservoirs will likely favour N2O production (Guerinet al 2008)
There is recent emphasis to further study CH4 emissionsfrom freshwater reservoirs (Barros et al 2011 Bastvikenet al 2011 Demarty and Bastien 2011 St Louis et al2000) and this has stimulated an increase of CH4 monitor-ing However studies of N2O emissions are lacking (Mengiset al 1997 Seitzinger and Kroeze 1998) despite N2O be-ing a more potent GHG than CH4 Although GHG studiesfrom reservoirs have recently increased they remain lim-ited particularly in subtropicaltropical regions of the South-ern Hemisphere (Mendonccedila et al 2012 Ortiz-Llorente andAlvarez-Cobelas 2012 St Louis et al 2000) Consequentlythrough this shortfall a large gap in the understanding ofglobal CH4 and N2O emissions persists
In our study we investigated CH4 and N2O emissions pro-duction and consumption processes in the Gold Creek Reser-voir in South East Queensland Australia The study con-sisted of two main parts First a detailed field investigationof the CH4 and N2O emission rates at two sites (one deepand one shallow) by measuring total waterndashair fluxes as wellas water column and pore water concentrations The detailedstudy also included sedimentndashwater flux incubations of theshallow site which were conducted in the laboratory to gainfurther insight of the CH4 and N2O production or consump-tion processes Secondly a spatial emission field study fo-cused on total flux (ebullitive and diffusive) measurementsand estimated diffusive fluxes was performed to assess theCH4 and N2O emissions from shallow and deep sites of thereservoir This study examined and validated the spatial andtemporal representativeness of the CH4 and N2O emissiondata from the two sites of the detailed investigation
2 Materials and methods
21 Site description
Gold Creek Reservoir (2745prime97primeprime S 15287prime86primeprime E) is locatedin subtropical South East Queensland 14 km west of the cityof Brisbane Australia Completed in 1885 the reservoir isone of the oldest reservoirs in Australia and was built forthe supply of drinking water to Brisbane (although currentlynot used for this purpose) Gold Creek Reservoir has a sur-face area of 19 ha and is near the median size for Australianreservoirs The reservoir has a capacity of 820 000 m3 andmaximum water depth of 1175 m at full supply Approxi-mately 65 of the total storage capacity is within the upper2 m of the reservoir (Supplement Table S1) The reservoirrsquospristine catchment area is 105 km2 and consists of 98 openeucalyptus forest (Queensland Department of Science Infor-mation Technology Innovation and the Arts 2012) Thesesteep forested catchments export high amounts of organicmatter in the form of senescent leaves and woody materialduring intensive precipitation events (Tundisi et al 1993)This material is generally deposited in the inflow points of
Biogeosciences 11 5245ndash5258 2014 wwwbiogeosciencesnet1152452014
K Sturm et al CH 4 and N2O sources and emissions in a subtropical freshwater reservoir 5247
reservoirs where ebullition is frequently observed (Grinhamet al 2011)
In contrast to many temperate systems and reservoirs usedfor hydropower Gold Creek Reservoir experiences waterlevel increases mainly by intensive irregular precipitationevents and subsequent inflows especially during the summermonths (eg 444 mm in 4 days January 2013 Bureau of Me-teorology 2013) Water level decreases are caused by waterevaporation due to the warm temperatures (annual mean tem-perature 264C Bureau of Meteorology 2013) As GoldCreek Reservoir has no regular release of water via damoutlets the turbulent exchange of CH4 and N2O to the at-mosphere is restricted to when the reservoirrsquos capacity isexceeded and water is released over a spillway The reser-voir is steep-sided with limited colonisation of rooted macro-phytes limiting the importance of plant-mediated emissionpathways This means that the main emission pathways forGold Creek Reservoir are ebullition from sediments and dif-fusion via the waterndashair interface
Located in a subtropical region Gold Creek Reservoir hasrelatively high water temperatures compared with many tem-perate systems Monthly monitoring of water column profilesusing a multi-parameter sonde (YSI 6600 YSI Inc YellowSprings OH USA) showed seasonal ranges of surface wa-ter temperature from 14C in winter (June to August) to30C in summer (December to February) and bottom wa-ter temperatures ranging between 14 to 16C in all seasonsThe water column was oxygenated in the upper 2 m duringall seasons and stratified for 10 months of the year Watercolumn profiles of chlorophylla were taken with a chloro-phyll fluorometer (Seapoint Sensors Inc Exeter NH USA)Sampling and experiments for this study were conducted inMarch 2012 and February 2014 During these periods strat-ified conditions predominated the reservoir was consistentlyfilled to 90ndash100 and experienced no overspill
In the first part of our study the detailed investigation wasconducted at a shallow site (s4) and a deep site (d7) (Fig 1Supplement Table S2) CH4 and N2O total waterndashair fluxesand water column concentrations from both sites were mea-sured as well as pore water concentrations from the shal-low site s4 Additionally laboratory incubations of sedimentsfrom sampling site s4 were conducted to determine CH4 andN2O production as this site was located at the oxycline zone
The second part of this study investigated the spatial vari-ability of emissions and focused on total flux measurementsand diffusive flux estimates at several shallow sites (s1ndashs4)and deep sites (d5ndashd8) (Fig 1 Supplement Table S2) Thedata obtained in this study were also used to validate the rep-resentativeness of waterndashair emission estimates from sites s4and d7 of the detailed study The average depth of the shal-low sampling sites located in the reservoirrsquos sidearms was17plusmn 05 m The deep sampling sites with an average depthof 79plusmn 27 m were generally located in the middle of thereservoir body
Figure 1 The location of the sampling sites at the Gold CreekReservoir South East Queensland Australia Sampling sites arenumbered from the shallowest to deepest sites Water depths werefor the sites s1 11 m s2 17 m s3 19 m s4 21 m d5 44 m d675 m d7 97 m d8 102 m during the spatial emission study Thedetailed study was undertaken at sites s4 and d7
22 Field measurements
221 Waterndashair flux measurements
Total CH4 and N2O emission fluxes (both ebullitive and dif-fusive fluxes) at the waterndashair interface were determined us-ing anchored surface floating chambers Gas accumulationof ebullitive and diffusive waterndashair fluxes in the chambersover time was used for rate calculations Diffusive waterndashairfluxes were estimated using the thin boundary layer (TBL)model (Cole et al 2010) Ebullitive emissions were calcu-lated by the difference between total (floating chamber) anddiffusive (TBL model) fluxes
The surface floating chambers used are described in Grin-ham et al (2011) and consisted of a floating platform with sixsmall cylindrical PVC chamber units as replicates each witha volume of 000048 m3 and surface area of 000583 m2 Thechambers were stabilised in the water column by anchoringat two points to the reservoirrsquos floor using an anchor systemthat was attached to each chamber at two opposite sides Theropes used for this were connected to a sub-surface floatingbuoy which was again connected by ropes to an anchor onthe reservoir ground Sampling-induced disturbances to thewater column and sampling-induced ebullition from the sed-iments were minimised by a careful approach and by main-taining boat speeds below 25 kn
Headspace gas samples were taken from the floatingchambers to determine emission rates after known deploy-ment periods During the detailed study at sites s4 and d7gas samples were taken every 24 h from each of the six repli-cate units per floating chamber After sampling the surface
wwwbiogeosciencesnet1152452014 Biogeosciences 11 5245ndash5258 2014
5248 K Sturm et al CH4 and N2O sources and emissions in a subtropical freshwater reservoir
floating chambers were lifted out of the water and flushedwith air This sampling procedure was repeated 5 times over5 consecutive days During the spatial emission study sur-face floating chambers with three replicate units per chamberwere deployed at sites s1ndashs4 and at sites d5ndashd8 In this studythe chamber deployment time was 1 h After taking gas sam-ples from all chamber units the chambers were also lifted outof the water and flushed with air This sampling procedurewas repeated 3 times at each site Gas from the chamberswas sampled using a 60 mL syringe with a 064 mm needle(Livingstone International Pty Ltd Rosebery NSW Aus-tralia) and transferred into 12 mL pre-evacuated borosilicatevials (Exetainer Labco Ltd Lampeter UK)
Diffusive waterndashair fluxes were estimated using the equa-tion
F = k times 1C = k times (Cw minus Ceq) (1)
whereF is the flux (micromol mminus2 dayminus1) k is the gas transfercoefficient (m dayminus1) and1C is the difference between thegas concentration in the surface water (Cw) and the gas con-centration in the surface water that is in equilibrium with theair (Ceq) (Cole et al 2010)
The gas transfer coefficientk was estimated using themodel Eq (2) developed by Wanninkhof (1992)
k = a times U210times (Sc600)minusx (2)
where a is 031 for short-term winds or 039 for steadywindsU10 is the frictionless wind speed (m sminus1) normalisedat 10 mSc is the Schmidt number for CH4 and N2O andx is a constant depending on the wind speed (x = 066 forwind speed lt 3 m sminus1 or x = 05 for wind speed gt 3 m sminus1)The Schmidt numberScwas calculated (Wanninkhof 1992)using Eqs (3) and (4) for CH4 and N2O respectively
Sc(CH4) = 18978minus 11428times t + 32902times t2
minus 0039061times t3 (3)
Sc(N2O) = 20556minus 13711times t + 43173times t2
minus 0054350times t3 (4)
wheret is the temperature in Celsius The frictionless windspeedU10 was normalised to a height of 10 m according toCrusius and Wanninkhof (2003)
U10 = 122times U1 (5)
whereU1 is the wind speed at 1 m height (m sminus1)Cw was measured from a water sample (explained in the
next section) whereasCeq was calculated with the solubil-ity approaches of Yamamoto et al (1976) for CH4 and Weissand Price (1980) for N2O and measured atmospheric con-centrations before starting the chamber deployment times Aweather transmitter (WXT520 Vaisala Vantaa Finland) wasinstalled during all sampling times at site d7 and the average
wind speeds were logged every minute (Supplement Figs S1and S2a) The wind speeds used for calculations were aver-aged over 24 h for each of the 5 consecutive measurementdays for the detailed study and were averaged over the 1 hsampling intervals for the spatial emission study
222 Water column sampling
Water column samples were taken at sites s4 and d7 to de-termine the concentrations of CH4 N2O and for the nutri-ent levels of ammonium (NH+4 ) nitrate (NOminus
3 ) and nitrite(NOminus
2 ) Samples were taken from the epilimnion (20 cm be-low the water surface) and at the metalimnion depth (2 m)with a 42 L Niskin water sampler (Wildco Wildlife Sup-ply Company Yulee FL USA) daily over the 5 consecu-tive days At site d7 samples were also taken from the hy-polimnion (8 m depth) All water samples were pressure-filtered through 25 mm diameter 022 microm pore-size filters(Merck Millipore Billerica MA USA) Water samples forCH4 and N2O analyses were injected into pre-evacuatedborosilicate vials using a 12 mL syringe with a 064 mm nee-dle then equilibrated in an inflatable glove bag filled withultra-high purity nitrogen gas (BOC Brisbane Australia) toatmospheric pressure and then stored at 4C until analysisWater samples used for nutrient analyses were stored in ster-ile 10 mL vials (Sarstedt AG amp Co Nuumlmbrecht Germany)and frozen until analysis was carried out
223 Pore water sampling
To investigate sediments as potential sources of CH4 andN2O pore waters were extracted from sediment samples andanalysed for CH4 and N2O concentrations at the shallowsite s4 For this six undisturbed sediment cores were takenwith a gravity corer (Envco Environmental Equipment Sup-pliers Australia) fitted with acrylic liners (69 mm inner di-ameter 500 mm long) and sealed with PVC caps The grav-ity corer used had a 2 m pole which limited the collectiondepth to a shallow site (ie site s4) However Gold CreekReservoir is generally shallow with the main storage capac-ity being within the upper 2 m of the storage (SupplementTable S1) Therefore the oxycline of the reservoir is aroundthe 2 m mark (Supplement Fig S3a) and most sediments ofthe reservoir are exposed to oxygen Thus sediments of thechosen shallow site may be at least in terms of oxygen ex-posure representative for most of the reservoirrsquos sediments
Collected sediments in the cores had a height of1154plusmn 234 cm For the pore water analysis sediment coreswere pushed up to the top of the acrylic liners and 2 cmsediment layers were transferred into 50 mL test tubes (Fal-con tubes BD Biosciences San Jose CA USA) Care wastaken to ensure no headspace was formed However methoddrawbacks due to possible gas leakage from the vials wouldlead to an underestimation of pore water concentrations ifthe investigated gases are supersaturated Upon arrival in the
Biogeosciences 11 5245ndash5258 2014 wwwbiogeosciencesnet1152452014
K Sturm et al CH 4 and N2O sources and emissions in a subtropical freshwater reservoir 5249
laboratory sediments in the test tubes were centrifuged (Ep-pendorf AG Hamburg Germany) for 20 min at 1500g with-out pressure or temperature changes The pore water (super-natant) was removed and stored at 4C until analysis forCH4 N2O NH+
4 NOminus
3 and NOminus
2 Sample handling as wellas sample equilibration of the gases followed the same proce-dure as described previously for the water column samples
23 Sediment incubation study
Sediment incubations were conducted in the laboratory to de-termine CH4 and N2O sedimentndashwater fluxes from the shal-low site samples (s4) For this a second set of six undisturbedsediment core replicate samples were collected at site s4 witha gravity corer as described previously The collected sedi-ments had a height of 979plusmn 112 cm with an overlying wa-ter column of 4021plusmn 112 cm The covered sediment coreswere transferred to the laboratory within 4 h placed into in-cubators and the top PVC caps were removed The incuba-tors were filled with surface water from the respective siteThe water was adjusted to the in situ temperature (24C) us-ing water chillers The open sediment cores were left to settleovernight while the water column above each sediment corewas gently stirred using a magnetic stirring bar suspended inthe water column and propelled by additional stirrer bars ro-tating at 18 rpm adjacent to the incubators Results from insitu deployments of underwater light loggers (Odyssey pho-tosynthetic active radiation recorders Dataflow Systems PtyLtd Christchurch New Zealand) indicated strong light at-tenuation at the reservoir with the photic zone being lessthan 1 to 05 m (Supplement Fig S4) Consequently for thesesediment studies the incubators were covered with aluminumfoil on the sides and light-blocking cloth at the top to mimicthe reservoirrsquos sediment conditions below the photic zone
The sediment core liners were capped 15 h after samplingusing plexiglas lids with O-rings taking care to exclude airbubbles The lids contained three ports for sampling refillingand for a dissolved oxygen probe (tip sealed against samplingport) One-way valves were attached to the tubing (Mas-terflex Tygon John Morris Scientific Pty Ltd ChatswoodNSW Australia) of the sampling and refilling ports and arubber stopper was used for the oxygen probe port if notused Sampling and refilling with site water were carriedout with 20 mL syringes Dissolved oxygen and temperatureof the water column above the sediment cores were moni-tored using an optical DO probe (PreSens Precision SensingGmbH Regensburg Germany) before the core liners werecapped and every 24 h subsequently until the experiment fin-ished Cores were regularly inspected for signs of ebullition(bubble formation under the cap) throughout the incubationtimes Samples from the overlying water of the sedimentcores were taken for analysis of CH4 N2O and the nutrientsNH+
4 NOminus
3 and NOminus
2 before the cores were capped and after72 120 and 288 h incubation Daily fluxes were determinedfor CH4 NH+
4 NOminus
3 and NOminus
2 over 288 h and for DO over
48 h These were calculated from the rates of change in con-centration and by taking the core volume and sediment sur-face area into account CH4 N2O and nutrient sample han-dling as well as sample equilibration of the gases followedthe same procedure as described previously for the water col-umn samples
24 Analyses
Both gaseous and liquid samples were analysed for CH4 andN2O concentrations using an Agilent GC7890A gas chro-matograph (Agilent Technologies Santa Clara CA USA)A flame ionisation detector and a micro-electron capture de-tector were used for the analysis of CH4 and N2O respec-tively The gas chromatograph was calibrated using stan-dards with a range of 18 to 82 000 ppm for CH4 and 05to 5053 ppm for N2O which were prepared from certifiedgas standards (BOC gases Brisbane Australia) A LachatQuickChem 8000 Flow Injection Analyzer (Lachat Instru-ment Milwaukee WI USA) was used for the analysis ofNH+
4 NOminus
3 and NOminus
2 concentrationsStatistical analyses were performed with the program Sta-
tistica version 12 (StatSoft Inc Tulsa OK USA) usingone-way analysis of variances (ANOVAs) In order to eval-uate differences amongst sampling sites one-way ANOVAswere performed with sampling sites s4 or d7 sampling days1ndash5 or the sampling depths (epilimnion metalimnion hy-polimnion pore water) as the categorical predictor and CH4N2O or nutrients (NH+4 NOminus
3 NOminus
2 ) as the continuous vari-ables Data were log transformed where necessary to ensurenormality of distribution and homogeneity of variance (Lev-enersquos test) (Zar 1984) Post hoc tests were performed usingFisherrsquos LSD (least significant difference) test (Zar 1984)The non-parametric KruskalndashWallis (KW) test was used fordata which failed to satisfy the assumptions of normality andhomogeneity of data after being transformed
3 Results
31 Waterndashair fluxes
Sites s4 (shallow) and d7 (deep) of the detailed study showedsignificantly different (KW-H160 =412 P lt 0001) CH4emission rates with the highest rates found at the shallowsite s4 (Fig 2a and c Table 1) However there was no signifi-cant difference (P gt 005) found in N2O emissions betweenthe two sites (Fig 2b and d Table 1) Total CH4 and N2Ofluxes across the 5 consecutive monitoring days were not sig-nificantly different (P gt 005) at both sampling sites s4 andd7 apart from N2O fluxes at site s4 between day 4 and day 5(KW-H960 = 478 P lt 001) Results of the detailed study(Fig 2) showed that diffusive fluxes account for 12 to 40 of the total CH4 fluxes at site d7 and less than 3 at site s4However diffusive fluxes estimated by the TBL model ex-plain in four out of 5 monitoring days 82 to 100 of total
wwwbiogeosciencesnet1152452014 Biogeosciences 11 5245ndash5258 2014
5250 K Sturm et al CH4 and N2O sources and emissions in a subtropical freshwater reservoir
Figure 2 Total and diffusive methane and nitrous oxide fluxes at the shallow sampling site s4(a b) and the deep sampling site d7(c d)determined over 5 consecutive days Total fluxes were determined from measurements using the anchored surface floating chambers anddiffusive fluxes were determined using the thin boundary layer model Fluxes are given as averagesplusmn SEn = 6
Table 1 Total waterndashair methane and nitrous oxide fluxes at theshallow site s4 and the deep site d7 of the detailed study Fluxes aregiven as the average determined over the 5 consecutive daysplusmn SEn = 30
Site Total CH4 fluxes Total N2O fluxes(micromol CH4 mminus2 dayminus1) (micromol N2O mminus2 dayminus1)
s4 10 423plusmn 1249 289plusmn 017d7 1210plusmn 223 201plusmn 003
N2O fluxes for both sites Otherwise the estimated fluxesexceed the measured fluxes by up to 80 (Fig 2b and ddiscussed in Sect 41)
The spatial emission study confirmed that the Gold CreekReservoir is a source of both CH4 and N2O (Fig 3 Table 2)However the results show that CH4 fluxes varied much morewidely (6300 to 258 535 micromol CH4 mminus2 dayminus1) than N2Ofluxes (073 to 140 micromol N2O mminus2 dayminus1) No significanttrend was observed for flux differences between shallow anddeep sites for either investigated gas except that CH4 emis-sions at the shallow site s1 exceeded the emissions of allother sites by 1ndash2 orders of magnitude CH4 emissions at sites1 were significantly different (KW-H772 = 410 P lt 005)from all other sampling sites while significant difference was
Table 2 Total waterndashair methane and nitrous oxide fluxes at sam-pling sites s1ndashs4 and d5ndashd8 of the spatial emission study Rates areaveraged over three surface floating chamber deployments Sam-pling sites are numbered from shallowest to deepest site Fluxes aregiven as an averageplusmn SEn = 9
Site Total CH4 fluxes Total N2O fluxes(micromol CH4 mminus2 dayminus1) (micromol N2O mminus2 dayminus1)
s1 258 535plusmn 37 087 073plusmn 006s2 21 381plusmn 6695 124plusmn 008s3 20 452plusmn 4164 140plusmn 006s4 6726plusmn 2686 120plusmn 015d5 28 597plusmn 5411 110plusmn 010d6 30 274plusmn 13 023 087plusmn 005d7 6300plusmn 932 117plusmn 008d8 15 952plusmn 1896 122plusmn 008
not detected between emissions from the other sites s2ndashs4and d5ndashd8 (P gt 005) The highest CH4 emissions from thedeeper sites were detected at sites d5 and d6 which are bothlocated in the north-western arm of the reservoir close tothe shallow site s1 In contrast to this no clear spatial pat-tern between sites was observed for N2O fluxes SimilarlyN2O fluxes measured amongst four sites two shallow andtwo deep sites (s2 s4 d7 and d8) were not significantly
Biogeosciences 11 5245ndash5258 2014 wwwbiogeosciencesnet1152452014
K Sturm et al CH 4 and N2O sources and emissions in a subtropical freshwater reservoir 5251
Figure 3 Total and diffusive methane(a) and nitrous oxide(b) fluxes at sampling sites s1ndashs4 and d5ndashd8 Total fluxes were determinedusing the anchored surface floating chambers and diffusive fluxes were determined using the thin boundary layer model Rates per site wereaveraged over three surface floating chamber deployments Sampling sites are numbered from shallowest to deepest Fluxes are given asaverageplusmn SEn = 9
different (P gt 005) However N2O fluxes from samplingsite d6 were different than all other sites (KW-H772 = 312P lt 001) apart from s1 and d5 (P gt 005) Interestinglythe lowest N2O fluxes were measured at the shallow site s1Comparing total fluxes with diffusive fluxes from all sam-pling sites showed that in the spatial emission study diffusivefluxes accounted for 1 to 6 of the total CH4 fluxes (Fig 3a)Diffusive fluxes explain in five out of the eight sites 82 to100 of total N2O fluxes although at one site d6 the dif-fusive flux exceeded (by up to 25 ) the measured total flux(Fig 3b discussed in Sect 41)
Wind speed during the spatial emission study (SupplementFig S2a) conducted at sites s1ndashs4 and d5ndashd8 increased fromthe first (18plusmn 08 m sminus1) to the second (28plusmn 14 m sminus1)chamber deployment as well as from the second to the third(40plusmn 12 m sminus1) chamber deployment (deployment intervalfor each floating chamber was 1 h) Averaged chamber N2Ofluxes increased at all sites with increasing wind speed how-ever the increase was not significant (P gt 005) (Supple-ment Fig S2b) In contrast to this averaged CH4 fluxes at allsites did not increase with the increasing wind speed (Sup-plement Fig S2c) Total chamber fluxes of each chamber de-ployment and per sampling site showed low variability forN2O and high variability for CH4
Averaged total chamber CH4 fluxes were not significantlydifferent (P gt 005) between the two conducted studies (de-tailed study from March 2012 and spatial emission studyfrom February 2014) for the shallow site s4 However atthe deep site d7 total CH4 fluxes differed significantly be-tween the two studies (KW-H139 = 182 P lt 0001) Thetotal N2O fluxes at both sites site s4 and site d7 differed sig-nificantly between the two studies (KW-H139 = 191 P lt
0001 andF137 = 1246 P lt 0001 respectively)
32 Water column parameters
Water column CH4 N2O and nutrient concentrations at bothsites s4 (Fig 4a and b Table 3) and d7 (Fig 4c and d Ta-ble 3) showed no significant difference (P gt 005) amongstthe 5 consecutive experiment days and thus were pooled Thereservoir was characterised by a clear stratification with re-spect to oxygen (Supplement Fig S3a) Epilimnetic layerswere fully oxic while metalimnetic layers were suboxic andthe hypolimnetic layer at the deep site d7 was anoxic
The epilimnion at both sites s4 and d7 was supersatu-rated with CH4 and N2O CH4 metalimnion concentrations atsite s4 were 1 order of magnitude higher than the epilimnionconcentrations At site d7 hypolimnion CH4 concentrationswere approximately 24 000 000 supersaturated and 2ndash3 or-ders of magnitude higher than the meta- and epilimnion con-centrations respectively N2O concentrations were compa-rable for both sites s4 and d7 in the epilimnion and metal-imnion However N2O concentrations at site d7 were highestin the epilimnion not in the hypolimnion The epilimneticand metalimnetic CH4 and N2O concentrations at site s4were comparable to the measured concentrations at site d7
NH+
4 concentrations at site s4 were not significantly dif-ferent (P gt 005) in epilimnion and metalimnion NOminus2 andNOminus
3 concentrations at site s4 showed slight increases be-tween epilimnion and metalimnion NH+4 concentrations atsite d7 were similar in the epilimnion and metalimnion but2 orders of magnitude higher in the hypolimnion NOminus
2 andNOminus
3 concentrations at site d7 were not significantly differ-ent (P gt 005) within each of the three investigated watercolumn layers All analysed NH+4 NOminus
2 and NOminus
3 concentra-tions in epilimnion as well as metalimnion were comparablebetween site s4 and site d7
wwwbiogeosciencesnet1152452014 Biogeosciences 11 5245ndash5258 2014
5252 K Sturm et al CH4 and N2O sources and emissions in a subtropical freshwater reservoir
Figure 4 Levels of methane nitrous oxide and nutrients determined at the shallow sampling site s4(a b) and at the deep sampling sited7 (c d) Results are shown for the epilimnion metalimnion and for pore water (bars with hatch pattern) at the shallow site s4 and forthe epilimnion metalimnion and hypolimnion at the deep site d7 Methane and nutrient concentrations are plotted on a log scale Valuesrepresent averagesplusmn SE with the number of replicates beingn = 12 for water column methane and nitrous oxiden = 15 for nutrient watercolumn samplesn = 4 for pore water methane and nitrous oxide andn = 8 for pore water nutrients
33 Pore water parameters
The dissolved CH4 pore water concentrations at site s4(Fig 4a Table 3) were 2 orders of magnitude higher thanthe concentrations measured in the epilimnion as well asin the metalimnion The pore waters were approximately5 000 000 supersaturated with CH4 (pore waters were col-lected from the upper sediment layers and the saturation per-cent was calculated as done for the water samples) N2Opore water concentrations at site s4 were comparable to mea-sured concentrations in both investigated water column lay-ers (epilimnion and metalimnion) NH+4 pore water concen-trations at site s4 (Fig 4b Table 3) were 3 orders of mag-nitude higher than in the epilimnion and metalimnion Sim-ilarly the pore water NOminus2 and NOminus
3 concentrations were 2orders of magnitude higher than in the water column
34 Sedimentndashwater fluxes
CH4 was consistently produced during the incubations ofthe site s4 sediments (Fig 5a Table 4) N2O concentrationsindicated consumption had occurred however these levelswere low and near the theoretical detection limit from 72 honwards (Fig 5a) Dissolved oxygen was rapidly removed(Table 4) from overlying waters and was not detected after48 h (Fig 5a) NH+4 concentrations increased significantly(F38 = 61 P lt 001) between the start and end (288 h)of the incubation study NOminus2 concentrations were seen tohave increased over time following the same pattern as NH+
4 while the NOminus
3 levels decreased (Fig 5b Table 4)
Biogeosciences 11 5245ndash5258 2014 wwwbiogeosciencesnet1152452014
K Sturm et al CH 4 and N2O sources and emissions in a subtropical freshwater reservoir 5253
Table 3 Measured methane nitrous oxide and nutrient concentrations of the detailed study at the shallow site s4 in the epilimnion metal-imnion and pore water and at the deep site d7 in the epilimnion metalimnion and hypolimnion Values represent the averageplusmn SEn = 12for water column methane and nitrous oxiden = 15 for water column nutrientsn = 4 for pore water methane and nitrous oxide andn = 8for pore water nutrients
Site Measured Epilimnion Metalimnion Pore waterparameter concentration concentration concentration
s4CH4
050plusmn 004 micromol CH4 Lminus1 347plusmn 060 129plusmn 3221 986plusmn 2660 saturation micromol CH4 Lminus1 micromol CH4 Lminus1
N2O0017plusmn 0001 micromol N2O Lminus1 0023plusmn 0004 0015plusmn 0001168plusmn 12 saturation micromol N2O Lminus1 micromol N2O Lminus1
NH+
4049plusmn 006 099plusmn 040 798plusmn 51micromol NH+
4 -N Lminus1 micromol NH+
4 -N Lminus1 micromol NH+
4 -N Lminus1
NOminus
2013plusmn 000 025plusmn 004 23plusmn 5micromol NOminus
2 -N Lminus1 micromol NOminus
2 -N Lminus1 micromol NOminus
2 -N Lminus1
NOminus
3036plusmn 005 050plusmn 004 21plusmn 3micromol NOminus
3 -N Lminus1 micromol NOminus
3 -N Lminus1 micromol NOminus
3 -N Lminus1
Site Measured Epilimnion Metalimnion Hypolimnionparameter concentration concentration concentration
d7CH4
055plusmn 007 micromol CH4 Lminus1 469plusmn 129 600plusmn 2819 722plusmn 1465 saturation micromol CH4 Lminus1 micromol CH4 Lminus1
N2O0014plusmn 0001 micromol N2O Lminus1 0008plusmn 0001 0004plusmn 0000206plusmn 14 saturation micromol N2O Lminus1 micromol N2O Lminus1
NH+
4099plusmn 015 118plusmn 027 212plusmn 6micromol NH+
4 -N Lminus1 micromol NH+
4 -N Lminus1 micromol NH+
4 -N Lminus1
NOminus
2015plusmn 001 018plusmn 002 017plusmn 001micromol NOminus
2 -N Lminus1 micromol NOminus
2 -N Lminus1 micromol NOminus
2 -N Lminus1
NOminus
3090plusmn 015 071plusmn 012 053plusmn 008micromol NOminus
3 -N Lminus1 micromol NOminus
3 -N Lminus1 micromol NOminus
3 -N Lminus1
Table 4Production and consumption rates of methane nitrous ox-ide and nutrients during the sediment incubation study Positive val-ues indicate production and negative values indicate consumptionRates are given as an averageplusmn SEn = 3
Measured Productionparameter consumption rates
CH4 3616plusmn 395 micromol CH4 mminus2 dayminus1
DO minus38 220 micromol O2 mminus2 dayminus1
NH+
4 3874plusmn 1129 micromol NH+4 -N mminus2 dayminus1
NOminus
2 17plusmn 10 micromol NOminus
2 -N mminus2 dayminus1
NOminus
3 minus8plusmn 5 micromol NOminus
3 -N mminus2 dayminus1
CH4 NH+
4 NOminus
2 NOminus
3 productionconsumption rates weredetermined between hour 0 and 288 of the incubation experiment TheDO rate was determined between hour 0 and 48 of the incubationexperiment
4 Discussion
41 Surface gas emissions and thedominance of CH4 ebullition
The waterndashair flux measurements of the detailed study aswell as the spatial emission study showed that the Gold CreekReservoir was a source of CH4 and N2O Overall CH4 emis-sions emitted from the water surface were at least 1ndash2 (de-tailed study) or 2ndash4 (spatial emission study) orders of mag-nitude higher relative to N2O in terms of CO2 equivalentsdespite N2O being a more powerful GHG than CH4
The spatial emission study showed high variability of to-tal CH4 fluxes across and within (amongst chamber deploy-ments) all sampling sites and low variability of total N2Ofluxes indicating that fluxes were driven by ebullition anddiffusion respectively These results agree with previousemission findings at sites s4 and d7 of the detailed studyHigh spatial variability of CH4 fluxes driven by ebullition has
wwwbiogeosciencesnet1152452014 Biogeosciences 11 5245ndash5258 2014
5254 K Sturm et al CH4 and N2O sources and emissions in a subtropical freshwater reservoir
Figure 5 Sediment incubations of the shallow site s4 dissolvedoxygen methane nitrous oxide(a) and nutrient production or con-sumption(b) Values represent averagesplusmn SEn = 3
been observed in other tropical reservoir studies (Bastvikenet al 2010 DelSontro et al 2011 Grinham et al 2011)
A comparison of the measured fluxes determined at thefloating chambers and the estimated fluxes determined usingthe TBL model clearly showed that at all the sites the CH4fluxes were mainly driven by ebullition and the N2O fluxeswere mainly driven by diffusion Our findings confirm thoseof previous studies where ebullition has been shown to pro-duce the largest CH4 emissions compared to the pathways ofdiffusion and plant-mediated transport This is especially thecase under the conditions of shallow and warm water sys-tems where high CH4 production rates occur (DelSontro etal 2011 Devol et al 1988 Grinham et al 2011 Joyceand Jewell 2003 Keller and Stallard 1994) Gold CreekReservoir meets those conditions as it is a shallow system(maximum depth of 1175 m) experiencing warm tempera-tures (Supplement Fig S3b) throughout the year Diffusionis the dominant pathway for N2O emissions at Gold CreekReservoir and this has been found in other tropical reservoirs(Guerin et al 2008)
Estimated N2O fluxes in some cases exceeded the fluxesmeasured by the floating chambers It is likely this anomalyresults from inherent errors in both these methods The esti-mates were based on one exemplary model for the gas trans-fer coefficientk (Wanninkhof 1992) However there arevarious models described that give over- or underestimationsof measured fluxes and wide discrepancies in their results(Musenze et al 2014 Ortiz-Llorente and Alvarez-Cobelas2012) In addition modelled fluxes can be influenced by anumber of factors that include rainfall on the water surface
(Guerin et al 2007 Ho et al 1997) spatial variations ofwind speed (Matthews et al 2003) heating and cooling ofthe water surface (Polsenaere et al 2013 Rudorff et al2011) surrounding vegetation and wind fetch (Cole et al2010) Emission rates in this study were modelled with av-eraged wind speeds fork over the deployment time of 24 hperiods (detailed study) and for 1 h periods (spatial emis-sion study) Diurnal changes in wind speed occurred withhigher wind speeds during daylight which was when the spa-tial study was conducted Therefore the deployment periodsdo not provide the same study conditions and could introducean error consequently comparisons of daily rates betweenthe two studies should be treated with caution
42 Factors controlling CH4 ebullition
Both studies (detailed and spatial emission) showed thatebullition from anoxic sediments was the main contributorto the total CH4 emissions in this subtropical reservoir Thedetailed study showed that ebullitive CH4 fluxes were higherat site s4 than at site d7 The spatial emission study revealedthat ebullitive CH4 fluxes at site s1 were significantly higherthan at all deep sites These results confirm findings fromBastviken et al (2004) showing that CH4 fluxes by ebulli-tion are depth-dependent and higher at water depths of 4 mor less Ebullition and ultimately CH4 emission can be en-hanced when the hydrostatic pressure is reduced which couldbe a result of current-induced bottom shear stress or thelowering of storage water levels (Joyce and Jewell 2003Ostrovsky et al 2008) The already quite low hydrostaticpressure in the Gold Creek Reservoir (ie lt 2 atmospheres)favours active ebullition there The CH4 in the gas bubblescan escape oxidation during the transport through the watercolumn as CH4 moves faster through the water column byebullition than by diffusion (Joyce and Jewell 2003) Inter-estingly however significantly higher ebullition rates werenot found at the other shallow sites (s2ndashs4) as compared tothe deeper sites Highest CH4 waterndashair fluxes of the spatialemission study were generally found at the shallow site s1and the deep sites d5 and d6 located in the north-western armof the reservoir These three sites (s1 d5 and d6) are locatedwhere the main water inflow to the reservoir would occurand these likely receive high amounts of organic matter com-pared to the other sites Hence higher CH4 production result-ing in higher fluxes would occur at these sites This wouldalso explain why CH4 fluxes at the shallow sites s2ndashs4 didnot support other findings of depth-dependent fluxes as theylikely receive less organic matter than received in the north-western sidearm of the reservoir The chlorophylla profileindicated that phytoplankton was predominantly present inthe upper 2 m of the water column (Supplement Fig S3c)Phytoplankton were also present in the deeper aphotic lay-ers suggesting these are a source of organic carbon to thesediments However the spatial pattern in ebullition indicatesthat the major source of organic carbon is generated from the
Biogeosciences 11 5245ndash5258 2014 wwwbiogeosciencesnet1152452014
K Sturm et al CH 4 and N2O sources and emissions in a subtropical freshwater reservoir 5255
surrounding catchment as the highest CH4 flux rates werefound adjacent to major inflows where there was intense for-est litter deposition This phenomenon has been observed inother storages within the region (Grinham et al 2011) andhighlights the importance of identifying ebullition hot spotsto improve total emission estimates
The CH4 fluxes from Gold Creek Reservoir compare wellwith other reservoirs (Table 5) in the South East Queenslandregion (eg Little Nerang Dam (Grinham et al 2011) andBaroon Pocket Dam (Grinham et al 2012)) and even ex-ceeded the rates of younger reservoirs (eg Lake Wivenhoeand Baroon Pocket Dam Grinham et al 2012) The age ofa reservoir is described as one of the parameters affectingGHG fluxes as it is often described that fluxes tend to declinewith the reservoir age (Abril et al 2005 Galy-Lacaux et al1999) Barros et al (2011) used published data from differenthydroelectric reservoirs to show that the relationship betweenCH4 flux and reservoir age is negatively correlated HoweverCH4 fluxes from reservoirs measured in South East Queens-land (Table 5) significantly exceeded the fluxes analysed byBarros et al (2011) and the older reservoirs in the regionshowed higher CH4 emissions rates than the younger reser-voirs This may be explained by intensive irregular precipi-tation events that occur in the region and these would period-ically flush high amounts of organic matter into the systemIt is likely that these bursts of high organic loadings wouldallow the ebullitive pathways for CH4 emissions to persistand maintain high fluxes over time
43 Sources of CH4 production
Generally the highest CH4 concentrations in the Gold CreekReservoir were found in the hypolimnion and sediments in-dicating the sediments as a main source of CH4 The hy-polimnetic CH4 concentrations were comparable to concen-trations found in other stratified tropical reservoirs (Abril etal 2005 Galy-Lacaux et al 1999 Guerin and Abril 2007)Epilimnetic CH4 concentrations were 3 orders of magnitudelower than concentrations in the hypolimnion indicatingthat a substantial portion of the CH4 was oxidised by CH4-oxidising bacteria before reaching the surface waters and theatmosphere as has been suggested to occur in other tropicalreservoirs (Guerin and Abril 2007 Lima 2005) These epil-imnion concentrations were comparable (Guerin and Abril2007) or significantly lower (up to 3 orders of magnitude)than concentrations found in other stratified tropical reser-voirs (Abril et al 2005) Despite lower CH4 concentrationsin the epilimnion the reservoir was still supersaturated withCH4 and a source to the atmosphere
The laboratory incubations showed that the sediments ofGold Creek Reservoir were a consistent source of CH4 asthe CH4 concentration steadily increased throughout the in-cubation period This supports the findings of the field studywhere CH4 sediment pore water concentrations were greatlyelevated relative to the surface water concentrations The
Table 5 The range of methane fluxes across selected reservoirs(covering shallow and deep sites) in South East Queensland
Reservoir Commission CH4 flux rangesyear (micromol CH4 mminus2 dayminus1)
Baroon Pocket Dam 1988 505ndash251 750(Grinham et al 2012)Lake Wivenhoe 1984 95ndash78 500(Grinham et al 2012)Little Nerang Dam 1962 4230ndash1 403 250(Grinham et al 2011)Gold Creek Reservoir 1885 414ndash306 302(this study)
high methanogenesis rates in the sediments are thus likelydriving a significant portion of the waterndashair CH4 fluxesmeasured in this study Past studies have demonstrated thatsediments are a significant CH4 source (Barros et al 2011Canfield et al 2005) A recent study on a similar reservoirsystem clearly demonstrated the dominance of methanogenicarchaea in the upper 15 cm of the sediment zone (Green etal 2012) Given the high rates of organic matter loading inthese systems CH4 production will be an important pathwayfor organic matter degradation in the sediments The highlysupersaturated concentrations of the pore waters of thisrelatively shallow reservoir means that any small changesin hydrostatic pressure eg via bottom shear would likelyincrease the ebullition rates (Joyce and Jewell 2003) Incomparison of the CH4 sedimentndashwater fluxes with the CH4waterndashair fluxes from the shallow site s4 it was evident thatthe sediment efflux (3616plusmn 395 micromol CH4 mminus2 dayminus1)explained 67 of the diffusive CH4 emissions(5400plusmn 1250 micromol CH4 mminus2 dayminus1) and 35 of thetotal CH4 emissions (10 423plusmn 1249 micromol CH4 mminus2 dayminus1)This strongly indicates that the fluxes assessed during thesediment incubations in this study were underestimated Themost influential factor for this underestimation is likely theheight of the incubated sediment core With a height of onlyabout 10 cm the CH4 production from deeper (also anoxic)sediment layers was not considered
44 Sources of N2O production or consumption
The sediment incubation study clearly showed that theanoxic sediments were the source of NH+
4 for the N2O pro-duction (Fig 5b) However N2O production through ei-ther the nitrification or denitrification pathway ultimately re-quires DO Dissolved oxygen is introduced into the upperwater layer through wind re-aeration or by photosyntheticproduction The production of N2O therefore suffers fromtwin limitations below the oxycline DO is limiting whereasabove the oxycline NH+4 is limiting This confines N2O pro-duction to a narrow band within the water column in deepsites or to upper sediment layers in shallow sites and limits
wwwbiogeosciencesnet1152452014 Biogeosciences 11 5245ndash5258 2014
5256 K Sturm et al CH4 and N2O sources and emissions in a subtropical freshwater reservoir
the degree of supersaturation and therefore the likelihoodof bubble production The net result was that N2O emissionsfrom the water surface predominately occurred through thediffusive pathway
Our measurements showed that the surface waters weresupersaturated with N2O so the system was acting as a N2Osource to the atmosphere The elevated N2O concentrationsin the oxic zones (epilimnion and metalimnion) relative tothe anoxic zones indicate that nitrification was the predom-inant production pathway N2O consumption occurs in theanoxic hypolimnion and sediments possibly via denitrifica-tion as found previously (Guerin et al 2008 Mengis et al1997) The presence of NOminus3 within the anoxic zones furthersupports the likelihood of denitrification
45 Implications
Intensive field and laboratory studies in Gold Creek Reser-voir were undertaken to improve the understanding of pro-ductionconsumption and emission rates of the non-CO2GHGs CH4 and N2O Our results clearly demonstrate thatthe Gold Creek Reservoir is a source of CH4 and N2Oto the atmosphere although CH4 is clearly the dominantgas even when expressed as CO2 equivalents N2O fluxrates were in fact much lower than those reported in otherreservoirs with similar climates (N2O fluxes from six reser-voirs of three countries (Brazil Panama French Guiana)ranged between 3ndash157 micromol N2O mminus2 dayminus1 (Guerin et al2008) in comparison the fluxes in this study range be-tween 073ndash289 micromol N2O mminus2 dayminus1) Gold Creek Reser-voir CH4 fluxes on the other hand (53 t CH4 yrminus1 range be-tween 7ndash290 t CH4 yrminus1) were dominated by ebullitive emis-sions and were within the range reported for other tropi-cal systems (St Louis et al 2000) The exception was theflux measured at the shallowest site (s1) which greatly ex-ceeded even the higher-end range from the young (filled in1994) Petit Saut Dam in French Guiana (Galy-Lacaux etal 1997 St Louis et al 2000) Barros et al (2011) de-termined that the relationship between CH4 flux and lati-tude is significantly negatively correlated CH4 fluxes fromGold Creek Reservoir (spatial emission study range be-tween 6300ndash258 535 micromol CH4 mminus2 dayminus1) situated at thelatitude of 2745prime97primeprime S significantly exceeded the fluxes pre-sented in that study which were given to be in general lessthan 4167 micromol CH4 mminus2 dayminus1 The catchment of the GoldCreek Reservoir consists of 98 forest and experienceswarm temperatures as well as intense precipitation eventsthat potentially flush high amounts of organic matter intothe reservoir throughout the year These characteristics arein contrast to temperate systems and likely accelerate theCH4 production in subtropical systems like the Gold CreekReservoir The high rates of CH4 flux that we measured fur-ther highlight the importance of studies that focus on sub-tropical systems Additionally studies from tropical fresh-water systems are also important as these experience higher
water temperatures than subtropical systems and are thus ex-pected to exhibit even higher surface CH4 fluxes (Barros etal 2011) There is a lack of study of Australiarsquos reservoirsin both the tropical and subtropical climate zones and theircontribution as significant CH4 emitters is not recognisedFuture emission studies of these systems would add to thelimited knowledge of this region which is important for in-clusion in global GHG estimates
The spatial variability results of our study further empha-sise the importance of including a reasonable spatial reso-lution when monitoring GHG emissions from water bodiesparticularly when measuring CH4 In addition monitoringefforts should include measuring CH4 ebullition as it is themost dominant pathway in these systems For N2O howeverassessing only diffusive fluxes is likely sufficient Our resultsalso suggest that reservoir age is potentially not an importantparameter affecting CH4 fluxes in systems similar to GoldCreek Reservoir Ultimately the results presented here arelikely to be globally relevant as an increasing number of largereservoirs are being constructed to meet growing water de-mand particularly in tropical and subtropical zones but alsobecause subtropical systems can provide insight into the pos-sible impacts that a warming climate will have on temperatereservoirs
The Supplement related to this article is available onlineat doi105194bg-11-5245-2014-supplement
AcknowledgementsThe authors gratefully acknowledge thesupport and collaboration of Michele Burford at Griffith UniversityThe advice and assistance provided by the RSampT team AndrewWatkinson and Duncan Middleton of Seqwater are also gratefullyacknowledged We would like to thank Tonya DelSontro for thevery helpful guidance provided during the manuscript reviewingprocess We thank the three anonymous reviewers whose sugges-tions have greatly improved this manuscript We also would liketo thank Philip Bond for a thorough review of the manuscriptThis project was financially supported by the Australian ResearchCouncil (ARC) project LP100100325
Edited by T DelSontro
References
Abril G Guerin F Richard S Delmas R Galy-Lacaux CGosse P Tremblay A Varfalvy L Dos Santos M A andMatvienko B Carbon dioxide and methane emissions andthe carbon budget of a 10-year old tropical reservoir (PetitSaut French Guiana) Global Biogeochem Cy 19 GB4007doi1010292005gb002457 2005
Barros N Cole J J Tranvik L J Prairie Y T Bastviken DHuszar V L M del Giorgio P and Roland F Carbon emis-sion from hydroelectric reservoirs linked to reservoir age and lat-itude Nat Geosci 4 593ndash596 doi101038ngeo1211 2011
Biogeosciences 11 5245ndash5258 2014 wwwbiogeosciencesnet1152452014
K Sturm et al CH 4 and N2O sources and emissions in a subtropical freshwater reservoir 5257
Bastien J and Demarty M Spatio-temporal variation of grossCO2 and CH4 diffusive emissions from Australian reservoirs andnatural aquatic ecosystems and estimation of net reservoir emis-sions Lakes amp Reservoirs Research and Management 18 115ndash127 doi101111lre12028 2013
Bastviken D Cole J Pace M and Tranvik L Methane emis-sions from lakes Dependence of lake characteristics two re-gional assessments and a global estimate Global BiogeochemCy 18 GB4009 doi1010292004gb002238 2004
Bastviken D Santoro A L Marotta H Pinho L Q CalheirosD F Crill P and Enrich-Prast A Methane emissions fromPantanal South America during the low water season Towardmore comprehensive sampling Environ Sci Technol 44 5450ndash5455 doi101021es1005048 2010
Bastviken D Tranvik L J Downing J A Crill PM and Enrich-Prast A Freshwater methane emissionsoffset the continental carbon sink Science 331 6013doi101126science1196808 2011
Canfield D E Erik K and Bo T The Methane Cycle in Ad-vances in Marine Biology edited by Donald E Canfield E Kand Bo T Academic Press 383ndash418 2005
Climate Data Online Bureau of Meteorology Copyright Common-wealth of Australia available atwwwbomgovau last access 6October 2013
Cole J J Bade D L Bastviken D Pace M L and Van deBogert M Multiple approaches to estimating air-water gas ex-change in small lakes Limnol Oceanogr-Methods 8 285ndash293doi104319lom20108285 2010
Crusius J and Wanninkhof R Gas transfer velocities measured atlow wind speed over a lake Limnol Oceanogr 48 1010ndash10172003
DelSontro T Kunz M J Kempter T Wuest A Wehrli B andSenn D B Spatial heterogeneity of methane ebullition in alarge tropical reservoir Environ Sci Technol 45 9866ndash9873doi101021es2005545 2011
Demarty M and Bastien J GHG emissions from hydroelectricreservoirs in tropical and equatorial regions Review of 20 yearsof CH4 emission measurements Energ Policy 39 4197ndash4206doi101016jenpol201104033 2011
Devol A H Richey J E Clark W A King S L and Mar-tinelli L A Methane emissions to the troposphere from theAmazon Floodplain J Geophys Res-Atmos 93 1583ndash1592doi101029JD093iD02p01583 1988
Fearnside P M Hydroelectric dams in the Brazilian Amazon assources of greenhouse gases Environ Conserv 22 7ndash19 1995
Galy-Lacaux C Delmas R Jambert C Dumestre J-FLabroue L Richard S and Gosse P Gaseous emissionsand oxygen consumption in hydroelectric dams A case studyin French Guyana Global Biogeochemical Cy 11 471ndash483doi10102997gb01625 1997
Galy-Lacaux C Delmas R Kouadio G Richard S and GosseP Long-term greenhouse gas emissions from hydroelectricreservoirs in tropical forest regions Global Biogeochem Cy 13503ndash517 doi1010291998gb900015 1999
Geoscience Australia Dams and water storages 1990 available atwwwgagovau 2004
Green T J Barnes A C Bartkow M Gale D and Grinham ASediment bacteria and archaea community analysis and nutrient
fluxes in a sub-tropical polymictic reservoir Aquat MicrobialEcol 65 287ndash302 2012
Grinham A Dunbabin M Gale D and Udy J Quantifi-cation of ebullitive and diffusive methane release to atmo-sphere from a water storage Atmos Environ 45 7166ndash7173doi101016jatmosenv201109011 2011
Grinham A Gibbes B Cutts N Kvennefors C Jinks D andDunbabin M Quantifying natural GHG sources and sinks LakeWivenhoe and Baroon Pocket Dam Seqwater internal reportThe University of Queensland 2012
Guerin F and Abril G Significance of pelagic aerobicmethane oxidation in the methane and carbon budget of atropical reservoir J Geophys Res-Biogeo 112 G03006doi1010292006jg000393 2007
Guerin F Abril G Serca D Delon C Richard S Delmas RTremblay A and Varfalvy L Gas transfer velocities of CO2and CH4 in a tropical reservoir and its river downstream J MarSyst 66 161ndash172 doi101016jjmarsys200603019 2007
Guerin F Abril G Tremblay A and Delmas R Nitrous oxideemissions from tropical hydroelectric reservoirs Geophys ResLett 35 L06404 doi1010292007gl033057 2008
Ho D T Bliven L F Wanninkhof R and Schlosser P Theeffect of rain on air-water gas exchange Tellus B 49 149ndash158doi101034j1600-088949issue23x 1997
IPCC Climate Change 2007 ndash The Physical Science Basis Cam-bridge University Press Cambridge United Kingdom and NewYork NY USA 2007
Joyce J and Jewell P W Physical controls on methane ebullitionfrom reservoirs and lakes Environ Eng Geosci 9 167ndash178doi10211392167 2003
Keller M and Stallard R F Methane emissions by bubbling fromGatun Lake Panama J Geophys Res-Atmos 99 8307ndash8319doi10102992jd02170 1994
Lima I B T Biogeochemical distinction of methane releasesfrom two Amazon hydroreservoirs Chemosphere 59 1697ndash1702 doi101016jchemosphere200412011 2005
Lipschultz F Wofsy S C Ward B B Codispoti L AFriedrich G and Elkins J W Bacterial transformations of in-organic nitrogen in the oxygen-deficient waters of the EasternTropical South Pacific Ocean Deep-Sea Res 37 1513ndash1541doi1010160198-0149(90)90060-9 1990
Matthews C J D St Louis V L and Hesslein R H Compar-ison of three techniques used to measure diffusive gas exchangefrom sheltered aquatic surfaces Environ Sci Technol 37 772ndash790 2003
Mendonccedila R Barros N Vidal L O Pacheco F Kosten Sand Roland F Greenhouse gas emissions from hydroelectricreservoirs what knowledge do we have and what is lacking inGreenhouse Gases ndash Emission Measurement and Managementedited by Liu D G 55ndash78 2012
Mengis M Gachter R and Wehrli B Sources and sinks of ni-trous oxide (N2O) in deep lakes Biogeochemistry 38 281ndash301doi101023a1005814020322 1997
Musenze R S Werner U Grinham A Udy J and Yuan ZMethane and nitrous oxide emissions from a subtropical estuary(the Brisbane River estuary Australia) Sci Total Environ 472719ndash729 2014
Ortiz-Llorente M J and Alvarez-Cobelas M Comparison ofbiogenic methane emissions from unmanaged estuaries lakes
wwwbiogeosciencesnet1152452014 Biogeosciences 11 5245ndash5258 2014
5258 K Sturm et al CH4 and N2O sources and emissions in a subtropical freshwater reservoir
oceans rivers and wetlands Atmos Environ 59 328ndash337doi101016jatmosenv201205031 2012
Ostrovsky I McGinnis D F Lapidus L and Eckert W Quanti-fying gas ebullition with echosounder the role of methane trans-port by bubbles in a medium-sized lake Limnol Oceanogr-Methods 6 105ndash118 2008
Polsenaere P Deborde J Detandt G Vidal L O Perez M AP Marieu V and Abril G Thermal enhancement of gas trans-fer velocity of CO2 in an Amazon floodplain lake revealed byeddy covariance measurements Geophys Res Lett 40 1734ndash1740 doi101002grl50291 2013
Queensland Department of Science Information Technology Inno-vation and the Arts Land cover change in Queensland 2009-10 aStatewide Landcover and Trees Study (SLATS) report DSITIABrisbane 2012
Ramos F M Lima I B T Rosa R R Mazzi E A Car-valho J C Rasera M Ometto J Assireu A T and StechJ L Extreme event dynamics in methane ebullition fluxesfrom tropical reservoirs Geophys Res Lett 33 L21404doi1010292006gl027943 2006
Rudorff C M Melack J M MacIntyre S Barbosa C C Fand Novo E Seasonal and spatial variability of CO2 emissionfrom a large floodplain lake in the lower Amazon J GeophysRes-Biogeo 116 G04007 doi1010292011jg001699 2011
Seitzinger S P and Kroeze C Global distribution of ni-trous oxide production and N inputs in freshwater and coastalmarine ecosystems Global Biogeochem Cy 12 93ndash113doi10102997gb03657 1998
Soumis N Lucotte M Canuel R Weissenberger S Houel SLarose C and Duchemin Eacute Hydroelectric reservoirs as an-thropogenic sources of greenhouse gases in Water Encyclope-dia John Wiley amp Sons Inc 2005
St Louis V L Kelly C A Duchemin Eacute Rudd J W M andRosenberg D M Reservoir surfaces as sources of greenhousegases to the atmosphere A global estimate BioScience 50 766ndash775 doi1016410006-3568(2000)050[0766rsasog]20co22000
Tremblay A Varfalvy L Roehm C and Garneau M Green-house gas emissions ndash fluxes and processes Hydroelectric reser-voirs and natural environments 1st Edn Springer Berlin 2005
Tundisi J G and Tundisi T M Limnology CRC PressBalkemaLeiden The Netherlands 2012
Tundisi J G Matsumura-Tundisi T and Calijuri M C Lim-nology and management of reservoirs in Brazil in ComparativeReservoir Limnology and Water Quality Management edited byStraškraba M Tundisi J G and Duncan A Developments inHydrobiology Springer Netherlands 25ndash55 1993
Wanninkhof R Relationship between wind speed and gas ex-change over the ocean J Geophys Res-Oceans 97 7373ndash7382doi10102992jc00188 1992
Ward B B Nitrification and denitrification Probing the nitrogencycle in aquatic environments Microbial Ecol 32 247ndash2611996
Weiss R F and Price B A Nitrous oxide solubility in wa-ter and seawater Mar Chem 8 347ndash359 doi1010160304-4203(80)90024-9 1980
Yamamoto S Alcauskas J B and Crozier T E Solubility ofmethane in distilled water and seawater J Chem Eng Data 2178ndash80 doi101021je60068a029 1976
Zar J H Biostatistical analysis Biostatistical analysis Prentice-Hall Inc New Jersey i-xiv 1ndash718 pp 1984
Biogeosciences 11 5245ndash5258 2014 wwwbiogeosciencesnet1152452014
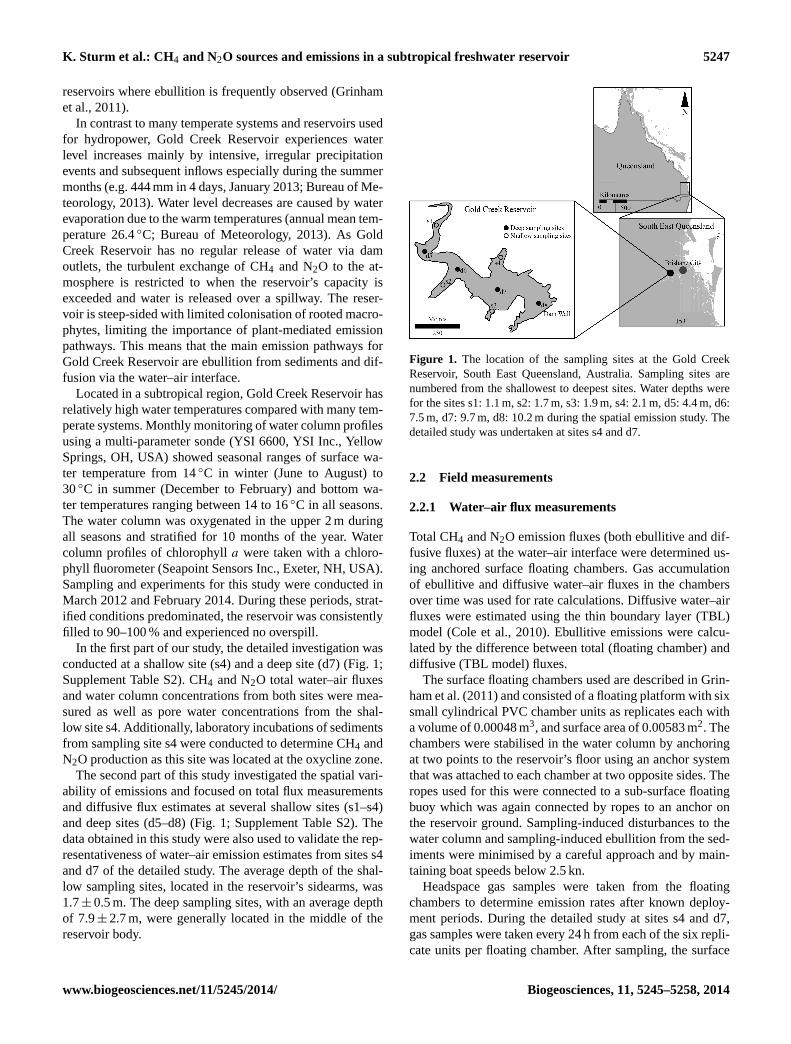
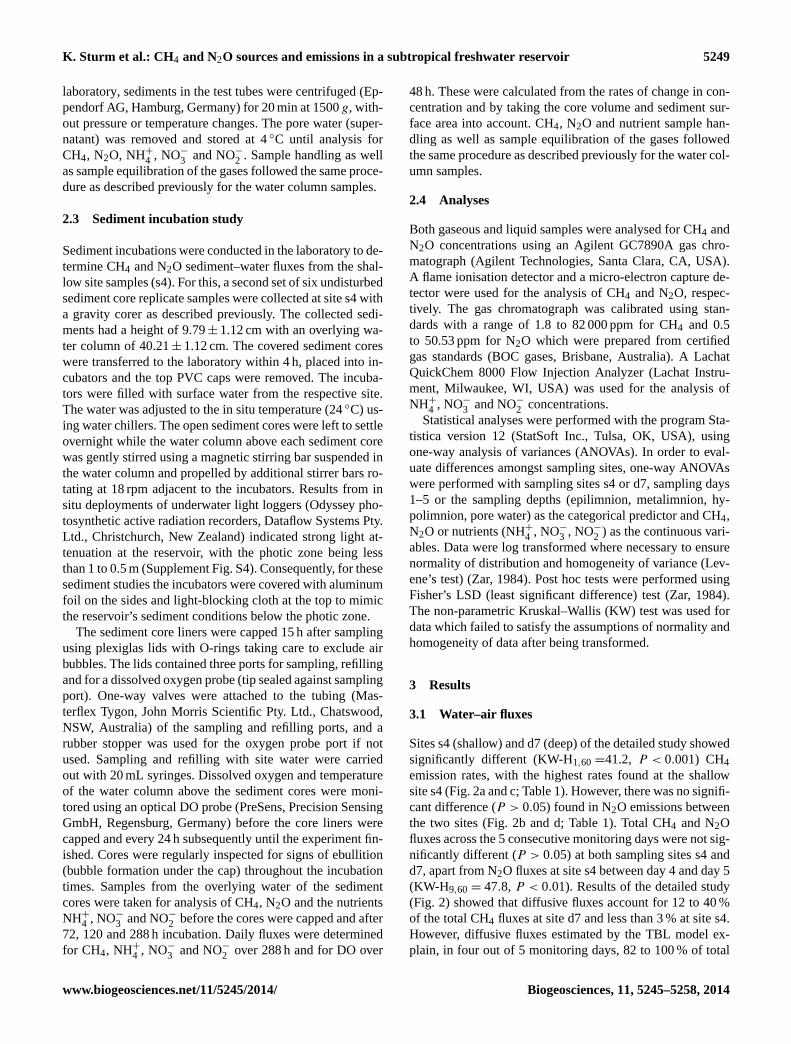
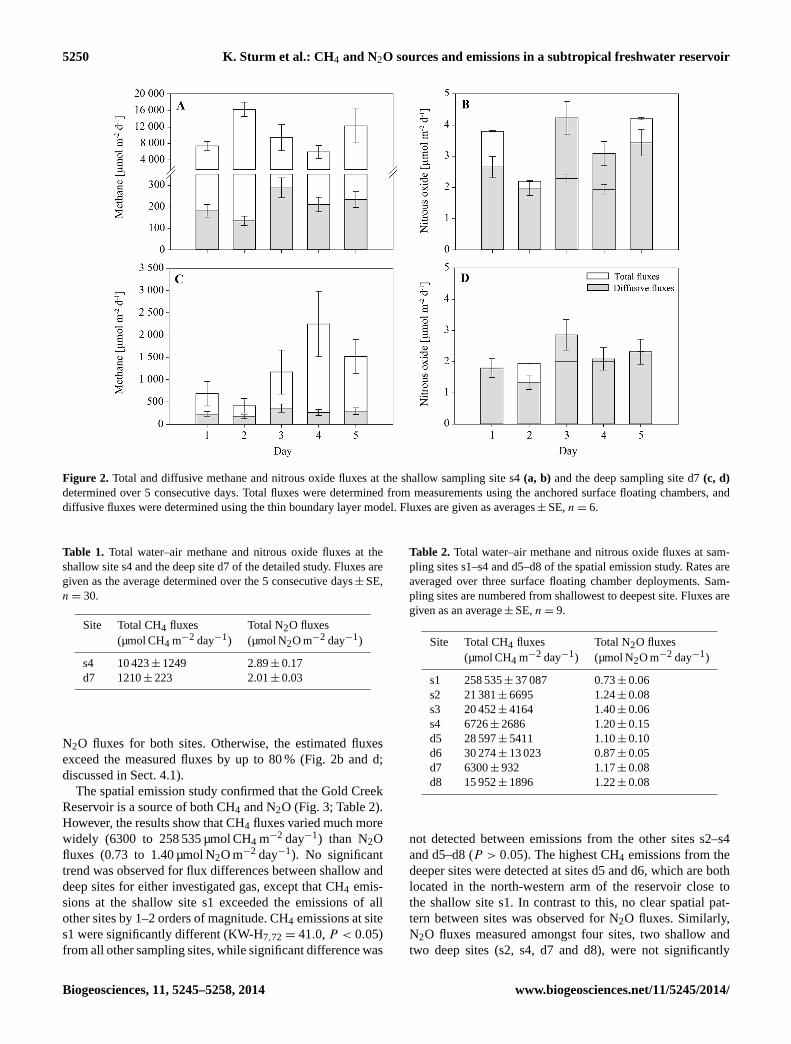
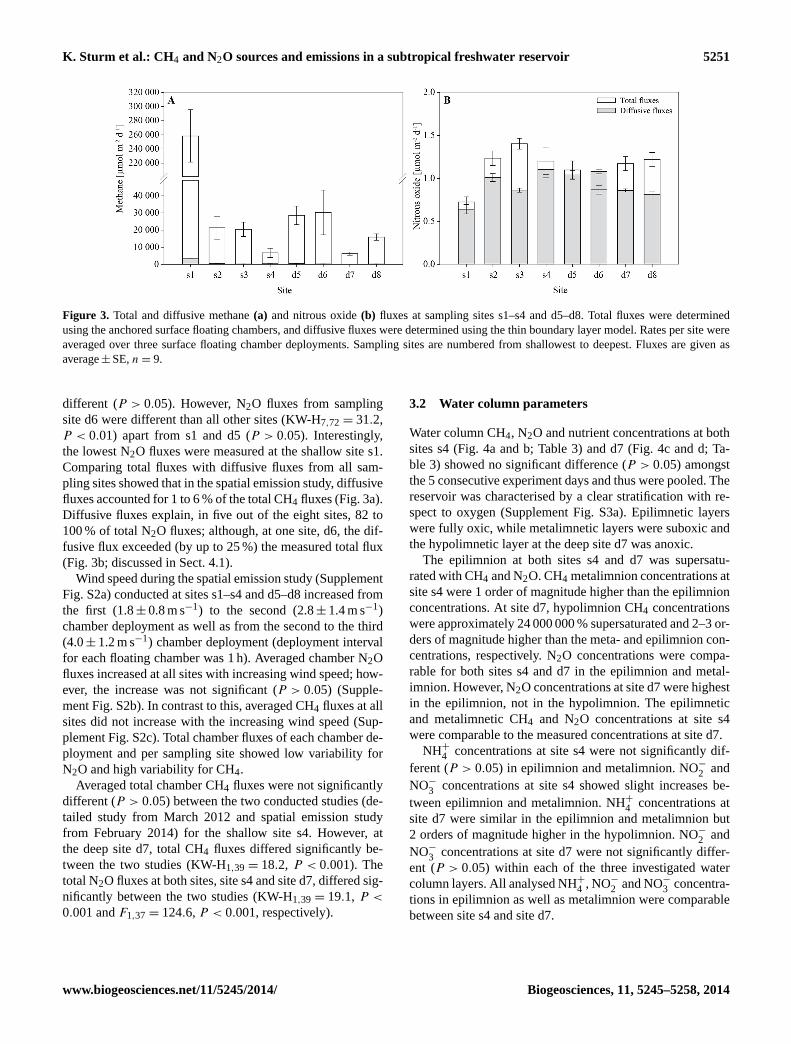
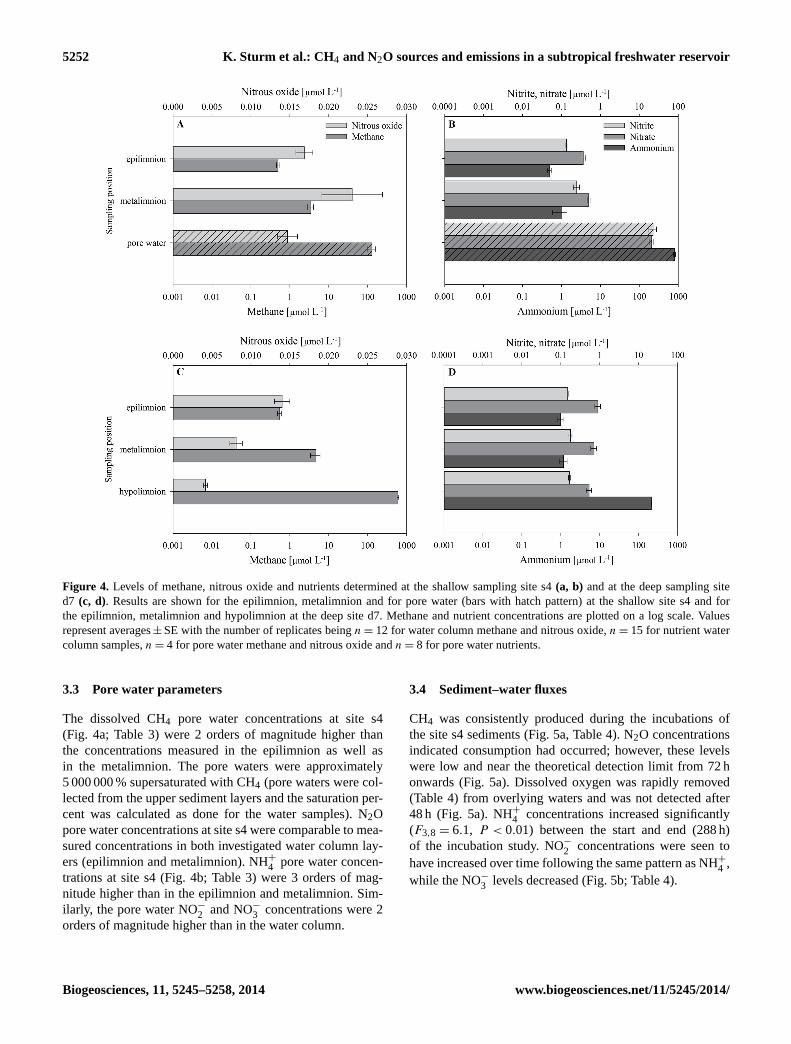
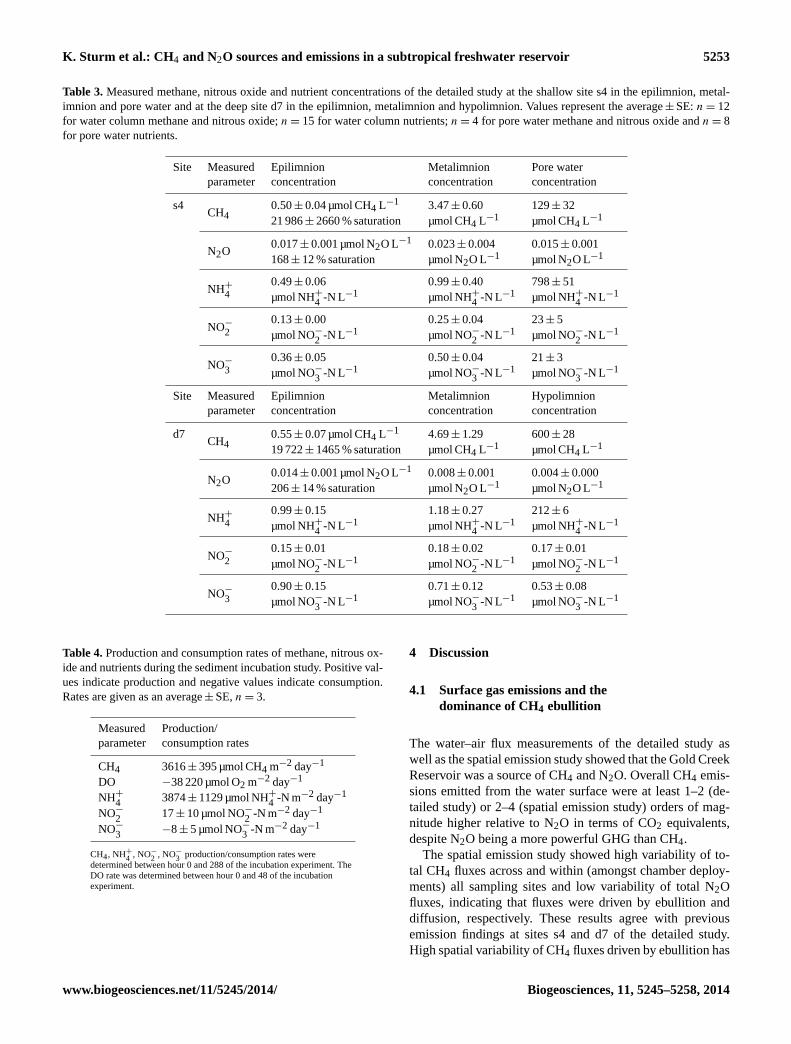
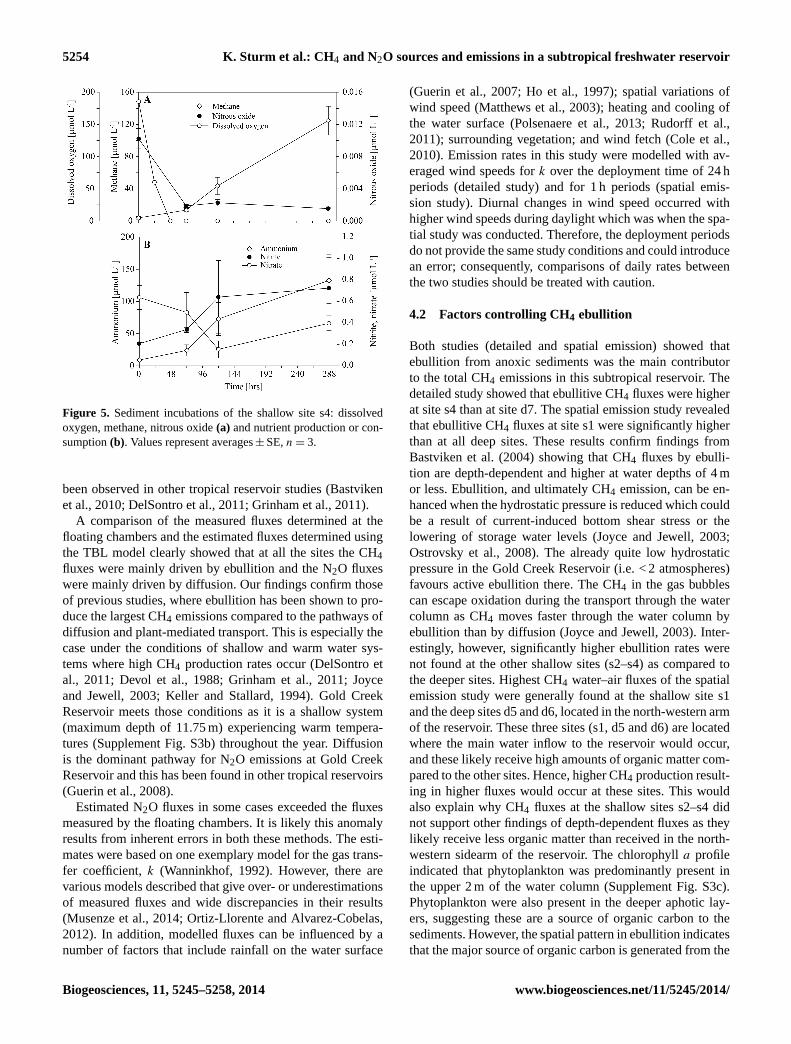
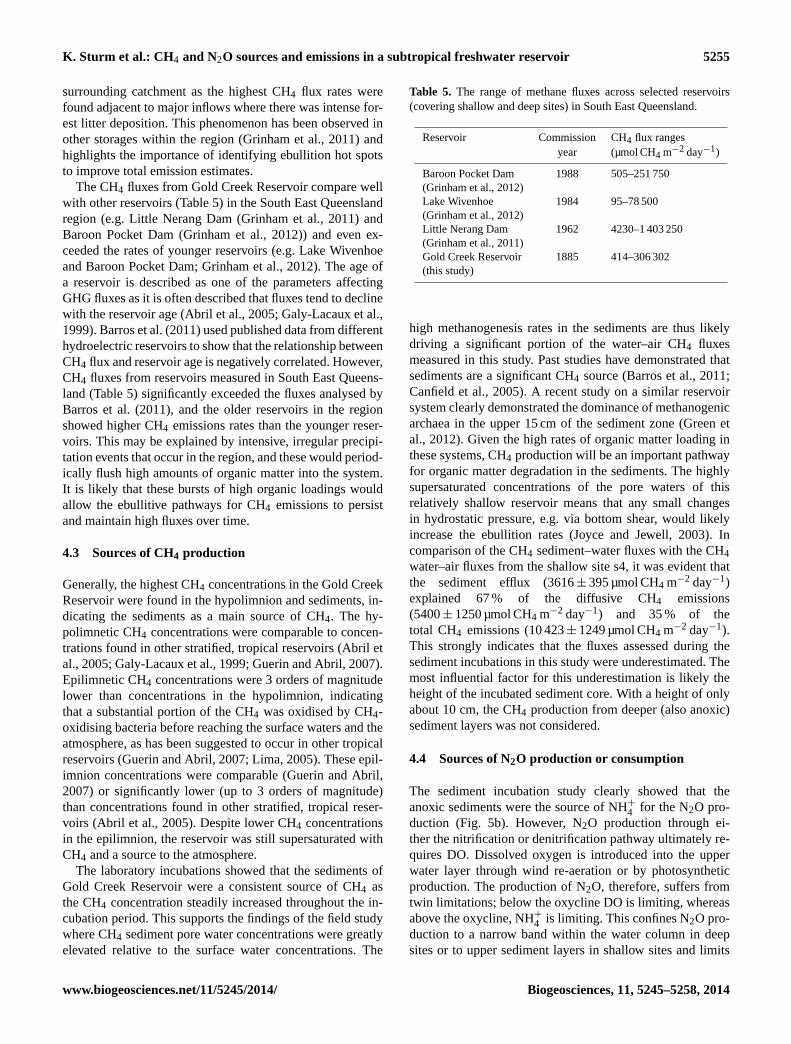
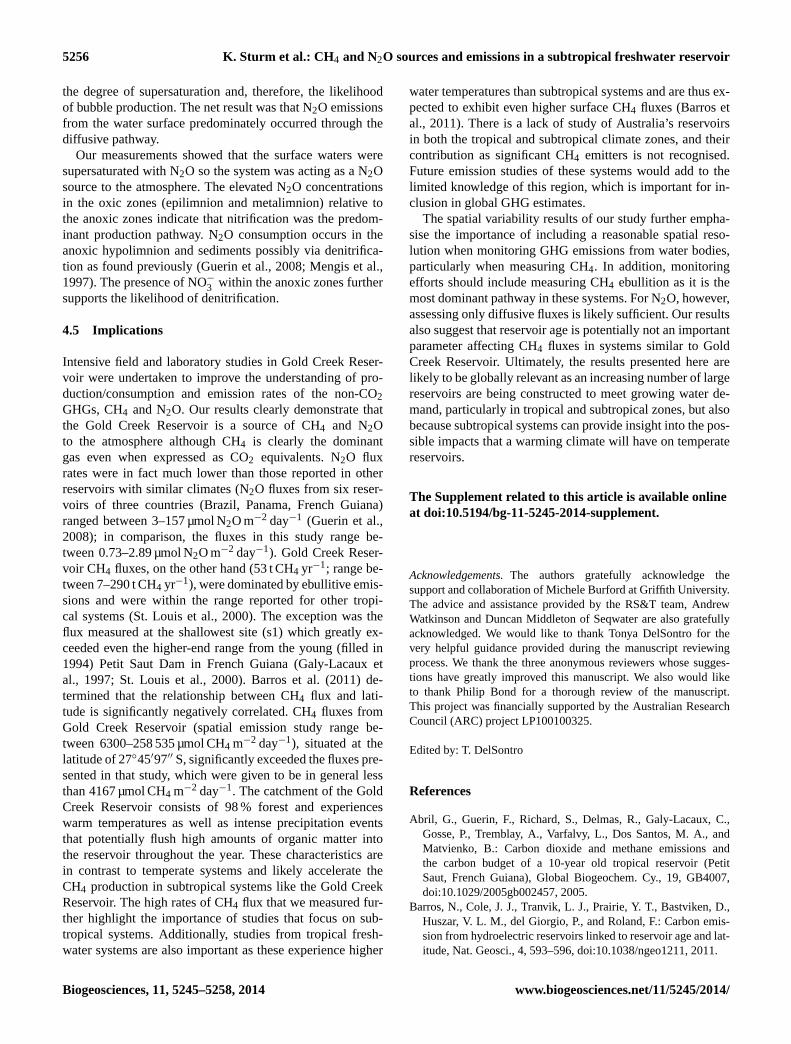
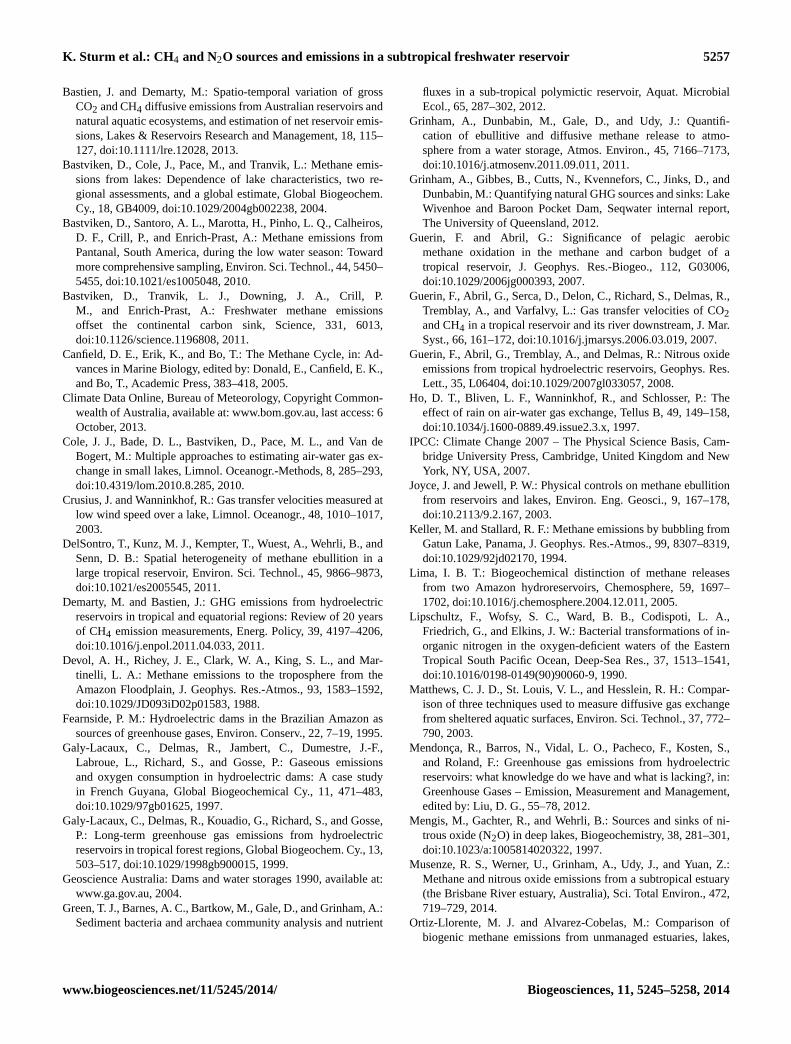