enhancing airline handling of large scale flight ... · enhancing airline handling of large scale...
TRANSCRIPT
1
ENHANCING AIRLINE HANDLING OF LARGE SCALE FLIGHT CANCELATION
EVENTS THROUGH PRE-EMPTIVE REBOOKING
Sanja Avramovic, Ph.D.
Lance Sherry, Ph.D., [email protected], 703-993-1711
Center for Air Transportation Systems Research
George Mason University
4400 University Drive MS 4A6
Fairfax, VA 22030
Corresponding Author:
Lance Sherry, [email protected], 703-993-1711
Permanent Address:
Center for Air Transportation Systems Research
George Mason University
Engineering Building Room 4507
4400 University Drive, Fairfax, VA, 22030
2
ENHANCING AIRLINE HANDLING OF LARGE SCALE FLIGHT CANCELATION
EVENTS THROUGH PRE-EMPTIVE REBOOKING
Abstract
Although, on average, only 2.1% of airline flights are cancelled each year, some of these
flight cancellations occur in batches due to events that impact airline network operations such as
snow storms, equipment outages, and labor issues. Batch flight cancellations impact a large
number of passengers at the same time in the same location and have a negative effect on airline
revenue (due to refund obligations), corporate profits (due to unbudgeted costs of employee
travel), and overall traveler experience.
Due to technological limitations and air traffic control procedures airlines are obliged to deal
with these cancellation events in a reactive manner. The flight cancellation is announced at the
last minute and passengers are rebooked after the scheduled flight departure time. Advances in
meteorological forecasting, air traffic control procedures for irregular operations (e.g.
Collaborative Decision Making), and the ubiquity of inexpensive and reliable broadband
communication services for communication between airlines and passengers, have changed the
landscape. It is now possible for airlines to migrate to a pro-active approach whereby the
cancellation event would be announced in advance and passengers would have the option to re-
book before the large scale cancellation event (i.e. pre-emptive rebooking).
If an airline were to adopt this pre-emptive approach: (1) could the available seat capacity
accommodate the passengers, and (2) would this approach be economically beneficial to the
airlines and the passengers?
This paper describes a method for Monte Carlo simulation of passenger re-booking using
historic flight schedules, load factors, and passenger itineraries to assess the feasibility and
economic benefits. Case-studies of 13 large flight cancellation events for a major U.S. network
carrier were analyzed. The results indicate that pre-emptive rebooking is feasible. More than
70% of the passengers choosing to rebook pre-emptively can be accommodated. Further, pre-
emptive rebooking is economically beneficial, yielding savings for airlines, and corporate
employers of travelers. The implications of these results for airlines, corporations, and travelers
are discussed.
Keywords
Airline reliability, Passenger itinerary delays, Passenger disruption, Pre-emptive rebooking
3
1. INTRODUCTION
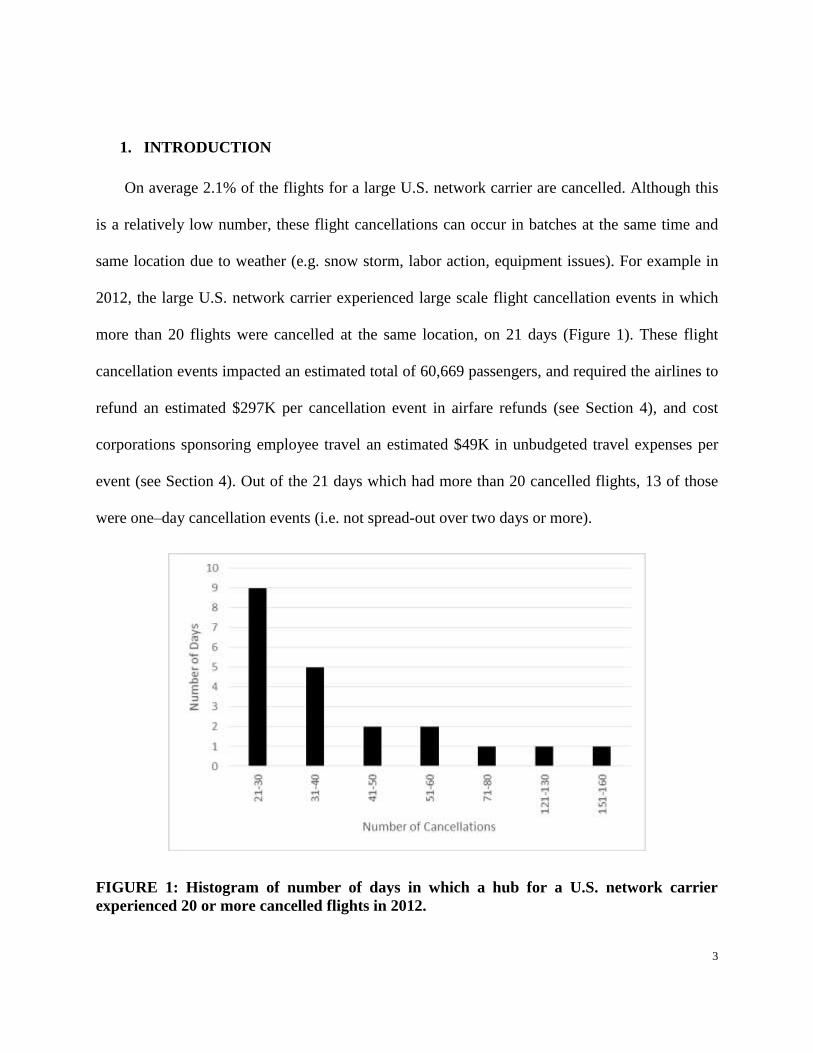
On average 2.1% of the flights for a large U.S. network carrier are cancelled. Although this
is a relatively low number, these flight cancellations can occur in batches at the same time and
same location due to weather (e.g. snow storm, labor action, equipment issues). For example in
2012, the large U.S. network carrier experienced large scale flight cancellation events in which
more than 20 flights were cancelled at the same location, on 21 days (Figure 1). These flight
cancellation events impacted an estimated total of 60,669 passengers, and required the airlines to
refund an estimated $297K per cancellation event in airfare refunds (see Section 4), and cost
corporations sponsoring employee travel an estimated $49K in unbudgeted travel expenses per
event (see Section 4). Out of the 21 days which had more than 20 cancelled flights, 13 of those
were one–day cancellation events (i.e. not spread-out over two days or more).
FIGURE 1: Histogram of number of days in which a hub for a U.S. network carrier
experienced 20 or more cancelled flights in 2012.
4
Although many of these large scale cancellation events can be forecasted (i.e. snow storms,
labor issues, and equipment outages), uncertainty in Air Traffic Control (ATC) and in the flight
operations of competing airline in response to these events, obliges airlines to reactively
announce flight cancellations close to the scheduled departure time and then rebook passengers
after the cancellation event.
However, significant procedural changes in air traffic control such as Collaborative Decision
Making (Wambsganns, 2001) in which airlines share operational information and coordinate use
of limited resources (e.g. departure slots), enable airlines to take advantage of improved
forecasting and announce flight cancellations in advance without losing airport arrival and
departure slots to competing airlines. In addition, the rapid advances in technology that enable
ubiquitous broadband wireless communication between the airlines and passengers, provides a
mechanism for passengers to evaluate their options and choose whether to rebook in advance,
after, or simply cancel, and if they do choose to rebook, which flight to choose. This allows
passengers to make decisions that are best for them.
Previous research describes methods for addressing the general class of airline irregular
operations including: robust flight scheduling (Clarke, 1998; Bratu, Barnhart, 2006;
AhmadBeygi, Cohn, Guan, Belobaba, 2008; Chiraphadhanakul, Barnhart 2013), and aircraft
assignment during irregular operations (Eggenberg, Salani, Bierlaire, 2010; Jafari, Zegordi,
2011). The effects of passenger rebooking have been analyzed by Yan et.al. (submitted 2015).
Pre-emptive passenger rebooking for a possible missed connection for a single delayed flight
was discussed in McCarty (2012).
This paper describes a method for the analysis of the feasibility and benefits to airlines and
passengers of pre-emptive rebooking of passengers scheduled to fly to, from, or through a hub
5
airport in advance of forecast large scale flight cancellation event. A Monte Carlo simulation of
passenger itinerary rebooking based on historic flight and passenger data is described. A case
study of the concept-of-operations for a U.S. network carrier operating a Midwest hub showed
that the concept is feasible and economically beneficial:
the pre-emptive rebooking concept-of-operations is feasible for any given combination of
passengers seeking pre-emptive rebooking by accommodating more than 70% of the
passengers.
Rebooking earlier on the same day is sufficient to accommodate passengers. Previous day
rebooking is not required as it did not change the percentage of passengers rebooked pre-
emptively (i.e. less than 7%).
Airlines can recoup up to an average of $297K per one-day cancellation event in airfare
refund obligations. Corporations can collectively save approximately up to an average of
$49K per one-day cancellation event in unexpected (i.e. unbudgeted) travel costs.
This paper is organized as follows: Section 2 describes the Pre-emptive Rebooking concept-
of-operations. Section 3 describes the method of analysis. Section 4 describes the results of
case-studies for 13 one day cancellation events for a large U.S. network carrier. Section 5
discusses the implications of these results.
2 PRE-EMPTIVE REBOOKING CONCEPT-OF-OPERATIONS
In response to irregular operations (e.g. snow storms, labor actions, equipment shortage or
outages, or construction) the traditional concept-of-operations is for the airline to wait until a few
hours before departure time to cancel the flight. Cancelling as late as possible keeps the airlines’
options open and provides the means to maximize airline revenue and/or minimize costs. This
6
modus-operandi is in place largely due to the combination of the first-come/first-served rules
used by Air Traffic Control (ATC) for airspace operations, the uncertainty in the occurrence of
the cancellation events, the uncertainty in competitors’ response to the events with regards to
flight operations, and the absence of collaboration between stakeholders in allocating available
airspace and runway resources. The options for re-accommodating passengers is also limited as
passengers could not be reliably contacted in a quick and affordable manner.
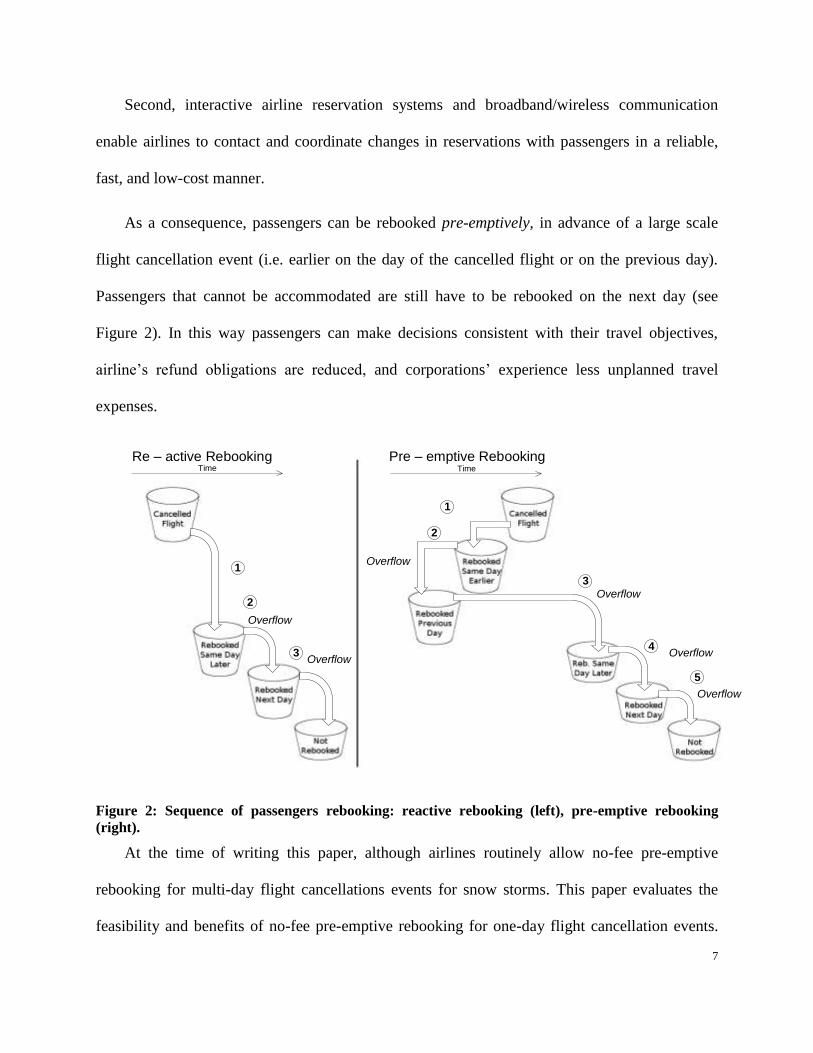
As a consequence of the late flight cancellation announcement, passengers are then
rebooked after their ticketed flight departure time resulting in missed travel objectives (e.g.
wedding, sporting event, business meeting). Passengers that cannot be rebooked on flights on the
same day overflow into rebooked flights on the next day and even the next-next day (see Figure
2).
Under this concept-of-operations, airlines stand to lose revenue due to refund obligations.
Corporations sponsoring employee travel must absorb non-billable expenses in unplanned and
unbudgeted expenses.
Several factors that have emerged over the last decade provide an opportunity to change the
paradigm and facilitate a more cost effective and passenger friendly response to these flight
cancellation events. First, Collaborative Decision-Making (CDM) has changed the way flight
operations in the National Airspace System (NAS) are managed from a reactive to a pro-active
modus-operandi. Capacity shortfalls at airports or airspace are forecast and identified in advance.
Available slots are allocated in advance allowing airlines to coordinate aircraft and crew
assignment, and plan for delays and cancellations.
7
Second, interactive airline reservation systems and broadband/wireless communication
enable airlines to contact and coordinate changes in reservations with passengers in a reliable,
fast, and low-cost manner.
As a consequence, passengers can be rebooked pre-emptively, in advance of a large scale
flight cancellation event (i.e. earlier on the day of the cancelled flight or on the previous day).
Passengers that cannot be accommodated are still have to be rebooked on the next day (see
Figure 2). In this way passengers can make decisions consistent with their travel objectives,
airline’s refund obligations are reduced, and corporations’ experience less unplanned travel
expenses.
Re –�active Rebooking Pre –�emptive Rebooking
Overflow
OverflowOverflow
Overflow
1
2
34
3
1
2
Time Time
Overflow
Overflow
5
Figure 2: Sequence of passengers rebooking: reactive rebooking (left), pre-emptive rebooking
(right).
At the time of writing this paper, although airlines routinely allow no-fee pre-emptive
rebooking for multi-day flight cancellations events for snow storms. This paper evaluates the
feasibility and benefits of no-fee pre-emptive rebooking for one-day flight cancellation events.
8
The questions are: (1) is pre-emptive no-fee rebooking with passenger flight options feasible
given an airlines flight schedule and seat availability? and (2) is it economically beneficial for
airlines and passengers?
3. METHOD OF ANALYSIS
To analyze the feasibility and economics of pre-emptive rebooking strategies the Passenger
Itinerary Delay Algorithm (PIDA) (Sherry et al, 2010) is embedded in a Monte Carlo Simulation.
The PIDA, Monte Carlo Simulation, and the Metrics are described in this section.
3.1 Passenger Itinerary Delay Algorithm (PIDA)
The PIDA is used to generate statistics for trip delays for each ticketed passenger itinerary
(Sherry, 2011). The PIDA algorithm takes as an input individual passenger itineraries (i.e. origin,
destination, connection, scheduled departure and arrival time). These itineraries are reverse
engineered from publicly available data (Sherry, 2011). The itineraries are processed using actual
performance of the flights associated with the itinerary. As is standard industry practice, flights
that arrive within 15 minutes of their scheduled arrival time are considered on-time. If the flight
is delayed more than 15 minutes, the PIDA assigns the delay to each passenger. If a flight is
cancelled, or a passenger experiences a missed connection, the PIDA rebooks the passengers on
alternate flights and calculates trip delays based on when the passengers arrives at their
destination.
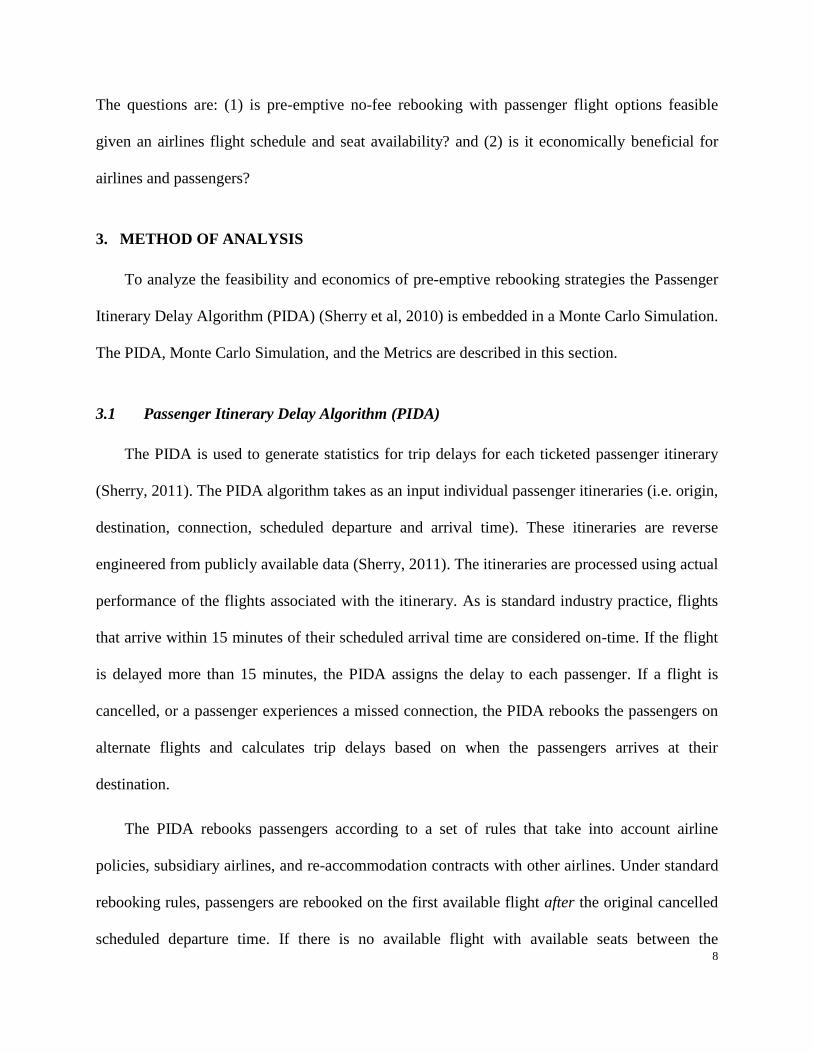
The PIDA rebooks passengers according to a set of rules that take into account airline
policies, subsidiary airlines, and re-accommodation contracts with other airlines. Under standard
rebooking rules, passengers are rebooked on the first available flight after the original cancelled
scheduled departure time. If there is no available flight with available seats between the
9
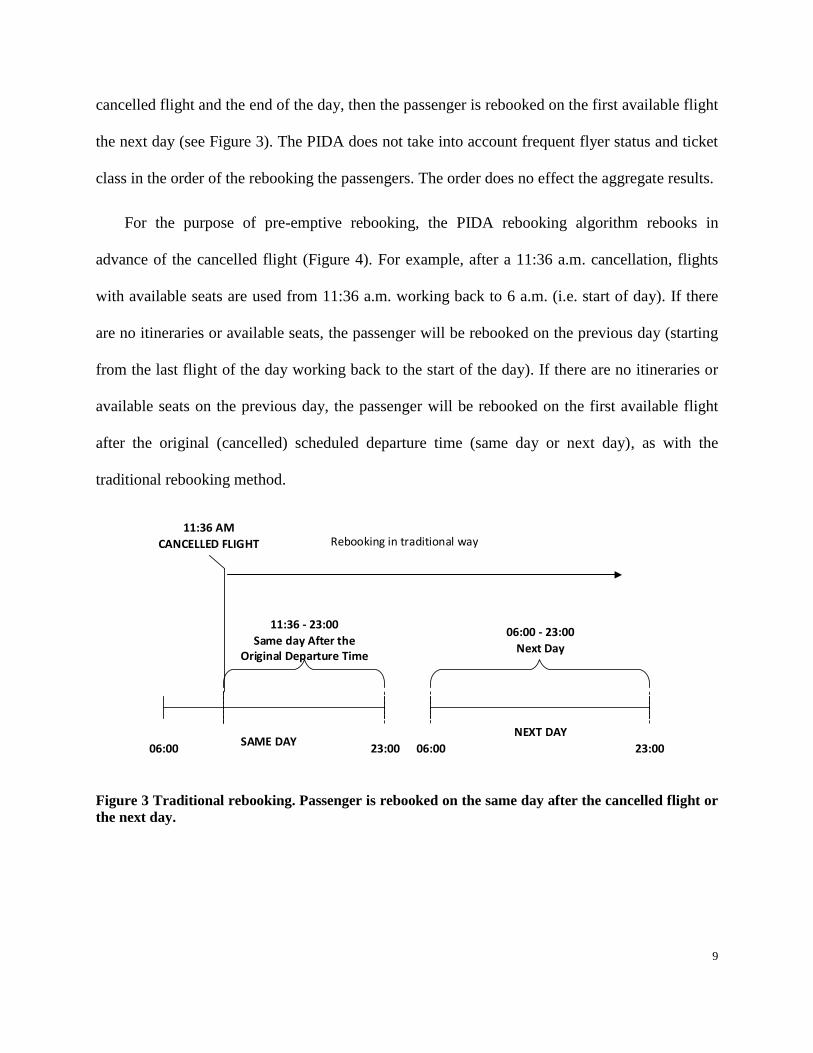
cancelled flight and the end of the day, then the passenger is rebooked on the first available flight
the next day (see Figure 3). The PIDA does not take into account frequent flyer status and ticket
class in the order of the rebooking the passengers. The order does no effect the aggregate results.
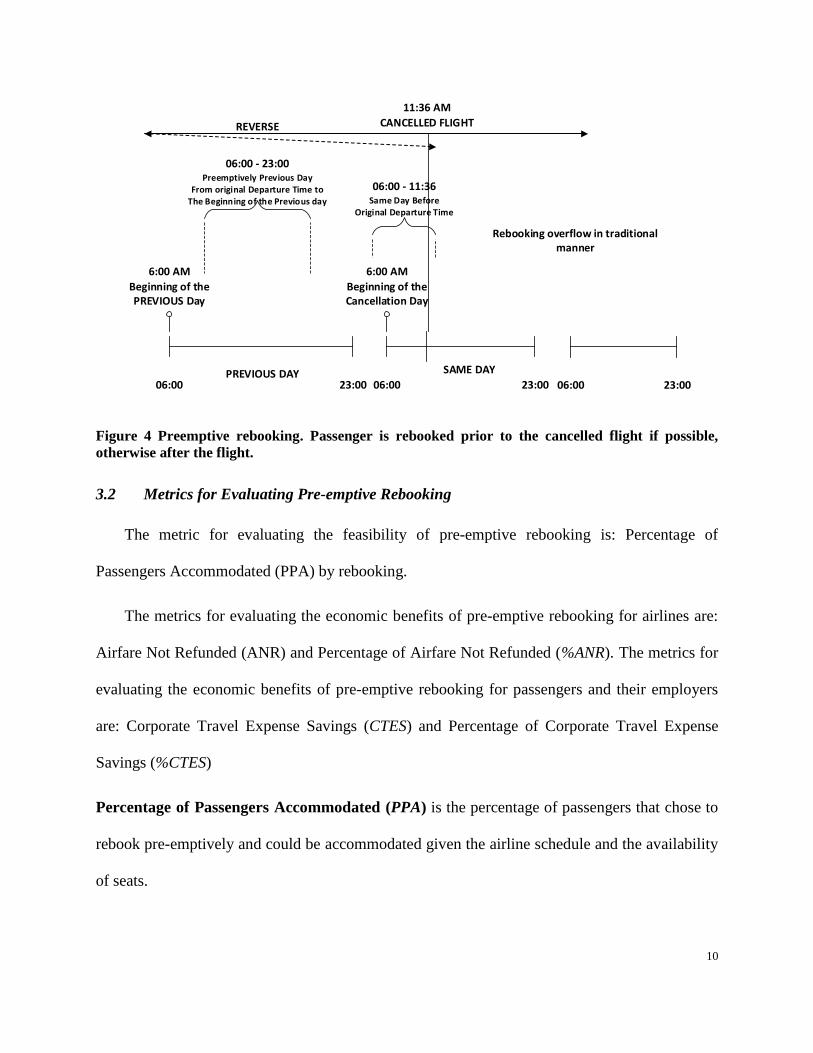
For the purpose of pre-emptive rebooking, the PIDA rebooking algorithm rebooks in
advance of the cancelled flight (Figure 4). For example, after a 11:36 a.m. cancellation, flights
with available seats are used from 11:36 a.m. working back to 6 a.m. (i.e. start of day). If there
are no itineraries or available seats, the passenger will be rebooked on the previous day (starting
from the last flight of the day working back to the start of the day). If there are no itineraries or
available seats on the previous day, the passenger will be rebooked on the first available flight
after the original (cancelled) scheduled departure time (same day or next day), as with the
traditional rebooking method.
06:00 23:00 06:00 23:00
11:36 AM
CANCELLED FLIGHT
SAME DAYNEXT DAY
Rebooking in traditional way
11:36 - 23:00
Same day After the Original Departure Time
06:00 - 23:00
Next Day
Figure 3 Traditional rebooking. Passenger is rebooked on the same day after the cancelled flight or
the next day.
10
06:00 23:00 06:00 23:00 06:00 23:00
6:00 AM
Beginning of the PREVIOUS Day
6:00 AM
Beginning of the Cancellation Day
SAME DAYPREVIOUS DAY
06:00 - 11:36Same Day Before
Original Departure Time
06:00 - 23:00Preemptively Previous Day
From original Departure Time to The Beginning of the Previous day
REVERSE
Rebooking overflow in traditional manner
11:36 AM
CANCELLED FLIGHT
Figure 4 Preemptive rebooking. Passenger is rebooked prior to the cancelled flight if possible,
otherwise after the flight.
3.2 Metrics for Evaluating Pre-emptive Rebooking
The metric for evaluating the feasibility of pre-emptive rebooking is: Percentage of
Passengers Accommodated (PPA) by rebooking.
The metrics for evaluating the economic benefits of pre-emptive rebooking for airlines are:
Airfare Not Refunded (ANR) and Percentage of Airfare Not Refunded (%ANR). The metrics for
evaluating the economic benefits of pre-emptive rebooking for passengers and their employers
are: Corporate Travel Expense Savings (CTES) and Percentage of Corporate Travel Expense
Savings (%CTES)
Percentage of Passengers Accommodated (PPA) is the percentage of passengers that chose to
rebook pre-emptively and could be accommodated given the airline schedule and the availability
of seats.
11
Airfare Not Refunded (ANR) is the difference in Airfare refunded by the airline without pre-
emptive rebooking and with pre-emptive rebooking.
ANR = ARbase -AR
Where:
ARbase = (PAXRebNDBase+ PAXRemBase) • $377
AR = (PAXRebND +PAXRem)• $377
PAXRebNDBase: Number of passengers rebooked next day, with no pre-emptive rebooking.
PAXRebND: Number of passengers rebooked next day with pre-emptive rebooking.
PAXRemBase: Number of unbooked passengers remaining, with no pre-emptive rebooking.
PAXRem: Number of unbooked passengers remaining for pre-emptive rebooking.
ARbase: Airfare refund for the baseline case (i.e. without pre-emptive rebooking)
AR: Airfare refund for the case for the % of passengers that choose pre-emptive rebooking
$377 is the average U.S. domestic airfare for this time period (Bureau of Transportation
Statistics, 2015).
Percentage of Airfare Not Refunded (%ANR) is calculated as follows.
%ANR = 100%•ANR/ARbase
For the purpose of modeling the change in %ANR with regards to the %PSPR a linear regression
model can be estimated as follows.
%ANR = (mANR * %PSPR) + bANR
where:
12
%PAXRebooked: the percentage rate at which passengers accept a preemptive rebooking offer.
mANR: the slope of the line relating the rate of the % of passengers choosing preemptive
rebooking to the ANR value.
bANR: the y-intercept of the line relating the rate of the % of passengers choosing preemptive
rebooking to the ANR value, thus bANR = 0.
Corporate Travel Expense Savings (CTES) is the additional travel expenses accrued by
corporate travelers that are required to overnight due to rebooking the next day (Sherry, 2014).
The additional costs for overnight stays is estimated at $250 ($160 for hotel accommodation and
$90 for food and transportation expenses) per government per-diem rates (U.S. GSA, 2012). It is
assumed that 50% of the passengers are not at their hometown airport and would require
overnight hotel accommodation (Li, Baik, Trani, 2010). Further 50% of these passengers are
estimated to travel on corporate expense accounts (DoT, 2015).
CTES = CTEBase - CTE
Where:
CTEBase = $250•(PAXRebNDBase+PAXRemBase+PAXRebPDBase )•0.5•0.5
CTE = $250•(PAXRebND+PAXRem+ PAXRebPD )•0.5•0.5
PAXRebPDBase: Number of passengers rebooked Previous Day, with no pre-emptive rebooking.
PAXRebPD: Number of passengers rebooked Previous Day, using the % of passengers that choose
of pre-emptive rebooking.
Percentage of Corporate Travel Expense Savings (%CTES) is calculated as follows.
%CTES = 100%•CTES/CTEBase
13
For the purpose of modeling the change in %CTES with regards to the %PSPR a linear
regression model can be estimated as follows:
% CTES = (mCTES * %PSPR) + bCTES
where:
mCTES: the slope of the line relating the rate of preemptive acceptance to the CTES value.
bCTES: the y-intercept of the line relating the rate of preemptive acceptance to the CTES value, thus bCTES =
0.
3.3 Monte Carlo Simulation
To achieve the objectives of the analysis, inputs to the PIDA are modified over multiple runs
of a Monte Carlo simulation. The passengers that choose to participate in the pre-emptive
rebooking are chosen randomly using a uniform distribution (i.e. on each run of the Monte Carlo
simulation, each passenger has equal likelihood of choosing to participate in pre-emptive
rebooking). The random selection of passengers is one way of accounting for groups of
passengers (e.g. families, corporate teams) and preferential treatment due to seating class
(business class, and frequent flyer miles).
To achieve a 95% confidence interval in the results of the Monte Carlo simulation it is
required to be executed 25 repetitions for each replication. The number of repetitions was
determined by a review of the standard deviation from 500 repetitions for a randomly selected
day and verified by simulation for 5 randomly selected days. There were diminishing returns
beyond 25 repetitions.
The Monte Carlo simulation is run for 10 treatments defined by the combination of:
1. Percentage of passengers that choose to participate in pre-emptive rebooking from
0% (baseline) to 10%, 30%, 50% and 70%.
14
2. The time in advance that the pre-emptive rebooking option is made available to
passengers (i.e. Same Day Before the scheduled departure time of the cancelled
flight, or Previous Day and Same Day Earlier Before the scheduled departure time of
the cancelled flight).
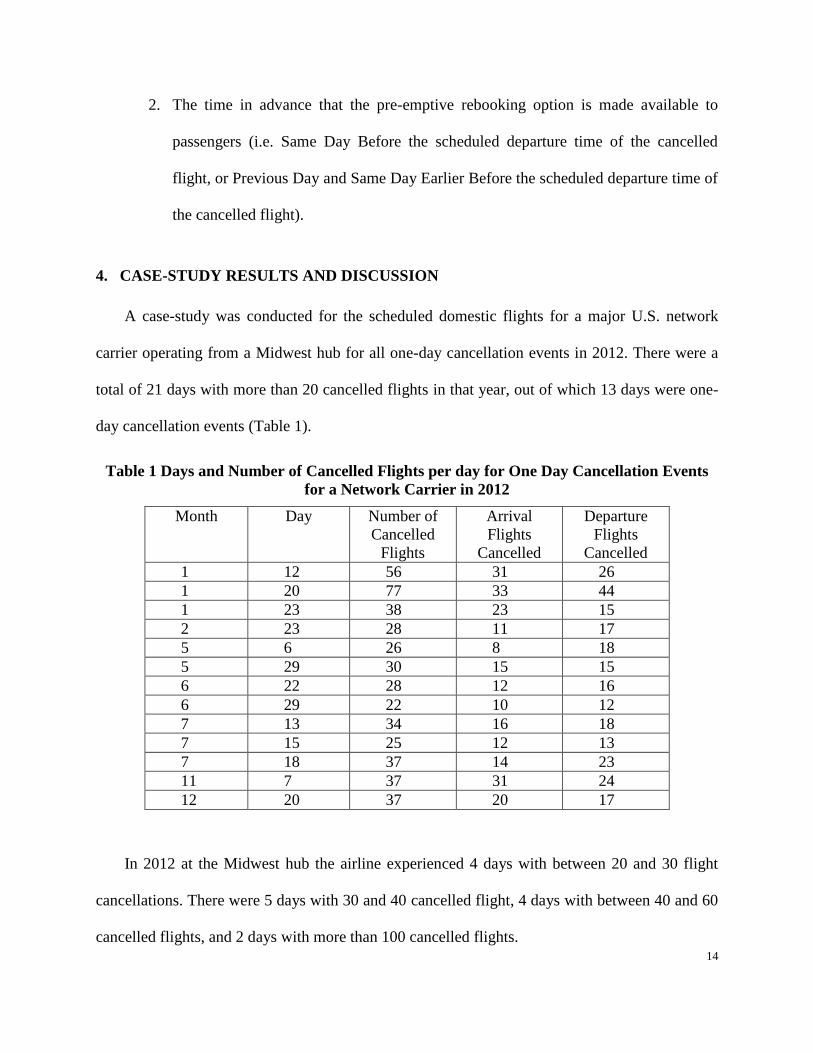
4. CASE-STUDY RESULTS AND DISCUSSION
A case-study was conducted for the scheduled domestic flights for a major U.S. network
carrier operating from a Midwest hub for all one-day cancellation events in 2012. There were a
total of 21 days with more than 20 cancelled flights in that year, out of which 13 days were one-
day cancellation events (Table 1).
Table 1 Days and Number of Cancelled Flights per day for One Day Cancellation Events
for a Network Carrier in 2012
Month Day Number of
Cancelled
Flights
Arrival
Flights
Cancelled
Departure
Flights
Cancelled
1 12 56 31 26
1 20 77 33 44
1 23 38 23 15
2 23 28 11 17
5 6 26 8 18
5 29 30 15 15
6 22 28 12 16
6 29 22 10 12
7 13 34 16 18
7 15 25 12 13
7 18 37 14 23
11 7 37 31 24
12 20 37 20 17
In 2012 at the Midwest hub the airline experienced 4 days with between 20 and 30 flight
cancellations. There were 5 days with 30 and 40 cancelled flight, 4 days with between 40 and 60
cancelled flights, and 2 days with more than 100 cancelled flights.
15
For these one-day cancellation events, the average load factor on all flights was 83% with a
minimum of 25% and maximum of 100%. The average load factor on the cancelled flights was
80% with a minimum of 32% and maximum of 97%.
The metrics for pre-emptive rebooking for these 13 one-day cancellation events were
calculated from the Monte Carlo simulation are shown in Figures 5 – 10 and summarized in
Tables 2 and 3. The treatments are: (1) Pre-emptive rebooking on the Same Day, Before the
Scheduled Departure Time of the Cancelled Flight for randomly selected passengers that choose
the pre-emptive rebooking option 10%, 30%, 50%, 70%, and (2) Pre-emptive rebooking on the
Same Day, Before the Scheduled Departure Time of the Cancelled Flight and the Previous Day
for randomly selected passengers that choose the pre-emptive rebooking option 10%, 30%, 50%,
70%.
The results for the pre-emptive rebooking on the same day before the scheduled flight, and
the results for previous day plus the same day before the scheduled flight are described in the
next two sections.
4.1 Pre-emptive Rebooking Same Day Before
The results of the Monte Carlo simulation of randomly selected passengers choosing to take
advantage of pre-emptive rebooking (PSPR) for cancelled flights on the same day before the
scheduled departure of the cancelled flight are shown in Figure 5, 6 and 7. Each figure shows
percentage of passengers that choose pre-emptive rebooking: 0% (baseline) 10%, 30% 50% and
70% of the passengers.
Feasibility of Pre-emptive Rebooking
For each percentage of passengers choosing the pre-emptive option (%PSPR), on average
70% of the passengers can be accommodated (PPA) for each of the 13 one-day cancellation
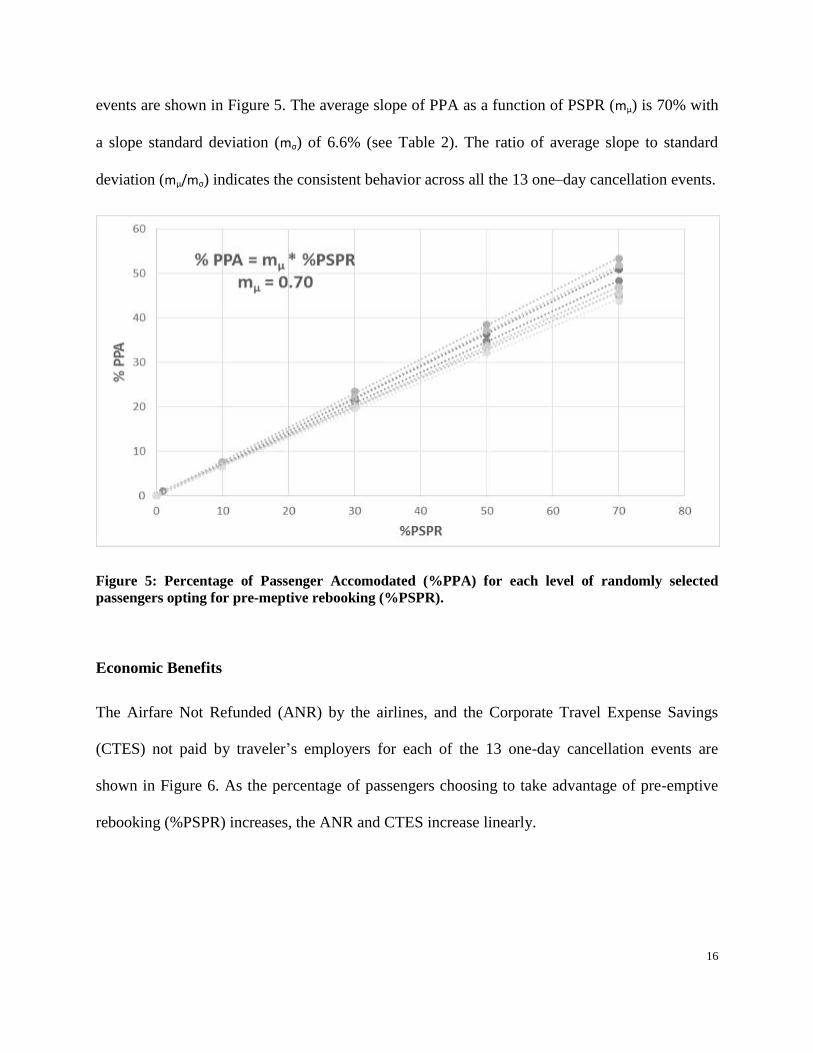
16
events are shown in Figure 5. The average slope of PPA as a function of PSPR (mµ) is 70% with
a slope standard deviation (mσ) of 6.6% (see Table 2). The ratio of average slope to standard
deviation (mµ/mσ) indicates the consistent behavior across all the 13 one–day cancellation events.
Figure 5: Percentage of Passenger Accomodated (%PPA) for each level of randomly selected
passengers opting for pre-meptive rebooking (%PSPR).
Economic Benefits
The Airfare Not Refunded (ANR) by the airlines, and the Corporate Travel Expense Savings
(CTES) not paid by traveler’s employers for each of the 13 one-day cancellation events are
shown in Figure 6. As the percentage of passengers choosing to take advantage of pre-emptive
rebooking (%PSPR) increases, the ANR and CTES increase linearly.
17
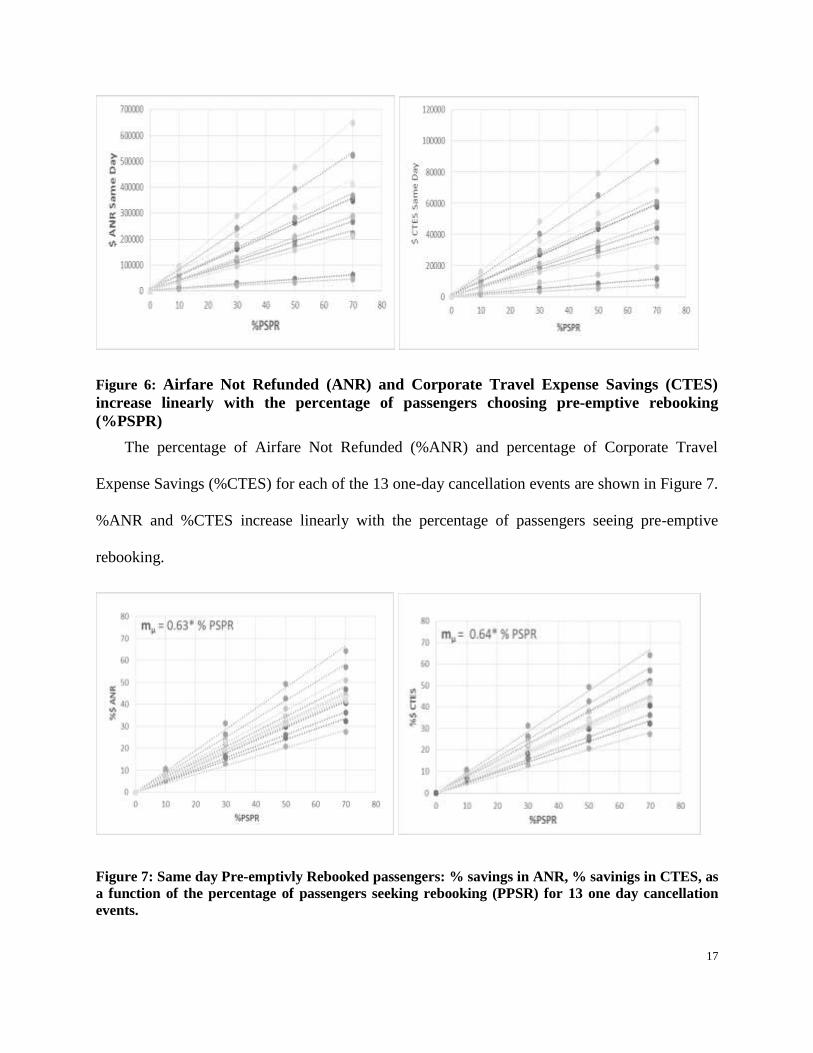
Figure 6: Airfare Not Refunded (ANR) and Corporate Travel Expense Savings (CTES)
increase linearly with the percentage of passengers choosing pre-emptive rebooking
(%PSPR)
The percentage of Airfare Not Refunded (%ANR) and percentage of Corporate Travel
Expense Savings (%CTES) for each of the 13 one-day cancellation events are shown in Figure 7.
%ANR and %CTES increase linearly with the percentage of passengers seeing pre-emptive
rebooking.
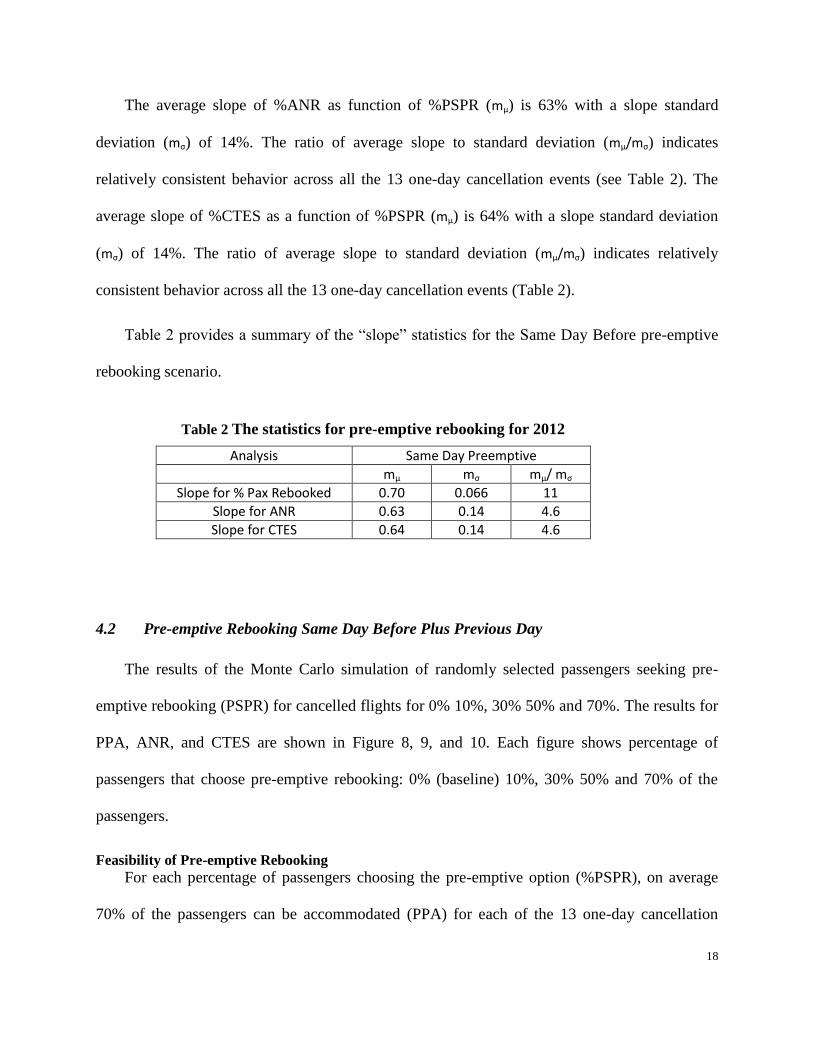
Figure 7: Same day Pre-emptivly Rebooked passengers: % savings in ANR, % savinigs in CTES, as
a function of the percentage of passengers seeking rebooking (PPSR) for 13 one day cancellation
events.
18
The average slope of %ANR as function of %PSPR (mµ) is 63% with a slope standard
deviation (mσ) of 14%. The ratio of average slope to standard deviation (mµ/mσ) indicates
relatively consistent behavior across all the 13 one-day cancellation events (see Table 2). The
average slope of %CTES as a function of %PSPR (mµ) is 64% with a slope standard deviation
(mσ) of 14%. The ratio of average slope to standard deviation (mµ/mσ) indicates relatively
consistent behavior across all the 13 one-day cancellation events (Table 2).
Table 2 provides a summary of the “slope” statistics for the Same Day Before pre-emptive
rebooking scenario.
4.2 Pre-emptive Rebooking Same Day Before Plus Previous Day
The results of the Monte Carlo simulation of randomly selected passengers seeking pre-
emptive rebooking (PSPR) for cancelled flights for 0% 10%, 30% 50% and 70%. The results for
PPA, ANR, and CTES are shown in Figure 8, 9, and 10. Each figure shows percentage of
passengers that choose pre-emptive rebooking: 0% (baseline) 10%, 30% 50% and 70% of the
passengers.
Feasibility of Pre-emptive Rebooking
For each percentage of passengers choosing the pre-emptive option (%PSPR), on average
70% of the passengers can be accommodated (PPA) for each of the 13 one-day cancellation
Table 2 The statistics for pre-emptive rebooking for 2012
Analysis Same Day Preemptive
mµ mσ mµ/ mσ
Slope for % Pax Rebooked 0.70 0.066 11
Slope for ANR 0.63 0.14 4.6
Slope for CTES 0.64 0.14 4.6
19
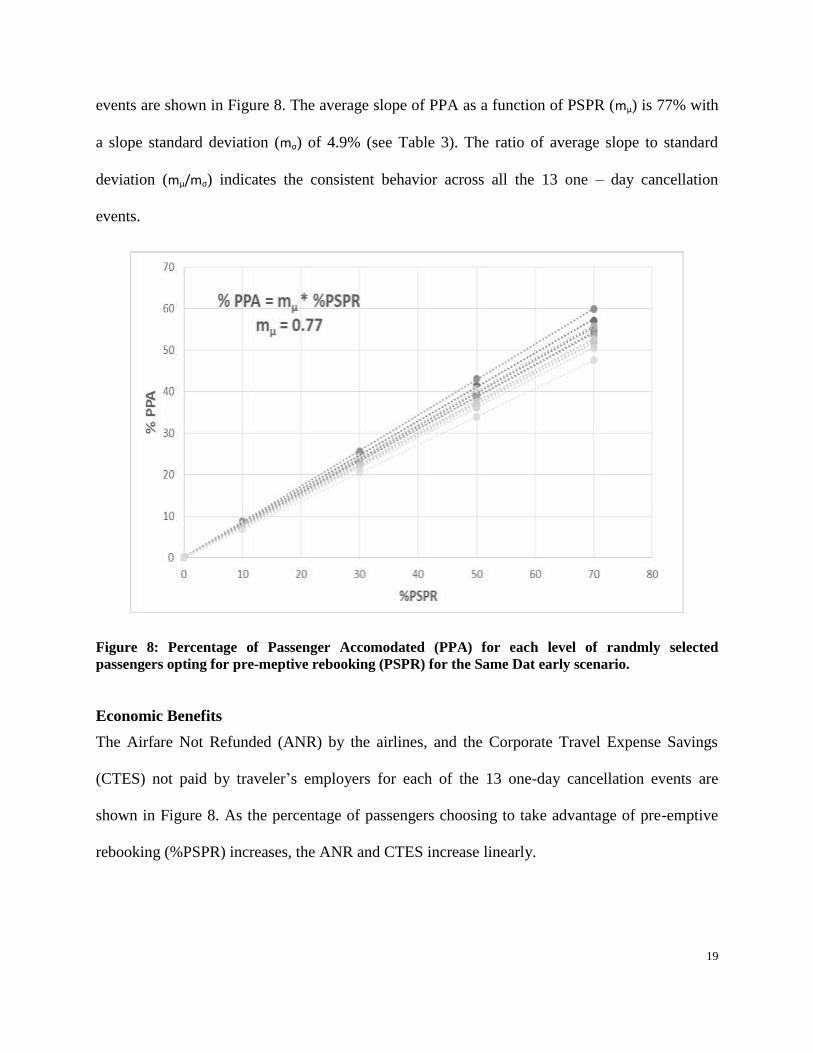
events are shown in Figure 8. The average slope of PPA as a function of PSPR (mµ) is 77% with
a slope standard deviation (mσ) of 4.9% (see Table 3). The ratio of average slope to standard
deviation (mµ/mσ) indicates the consistent behavior across all the 13 one – day cancellation
events.
Figure 8: Percentage of Passenger Accomodated (PPA) for each level of randmly selected
passengers opting for pre-meptive rebooking (PSPR) for the Same Dat early scenario.
Economic Benefits
The Airfare Not Refunded (ANR) by the airlines, and the Corporate Travel Expense Savings
(CTES) not paid by traveler’s employers for each of the 13 one-day cancellation events are
shown in Figure 8. As the percentage of passengers choosing to take advantage of pre-emptive
rebooking (%PSPR) increases, the ANR and CTES increase linearly.
20
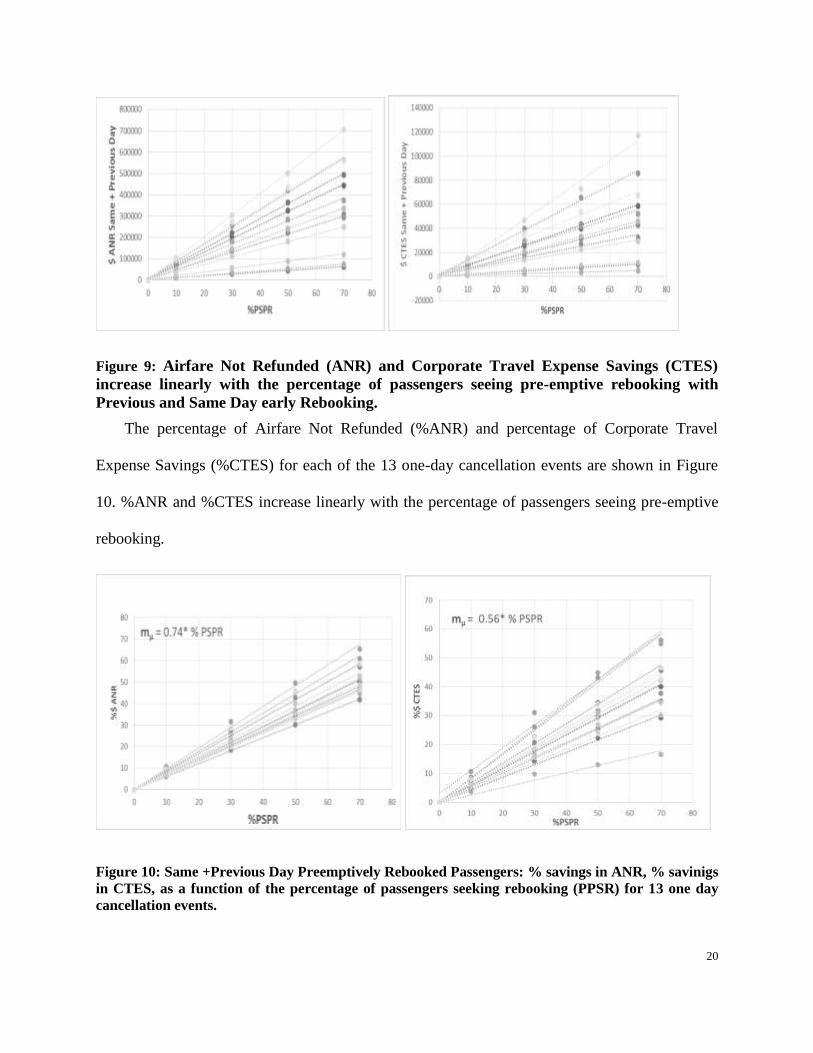
Figure 9: Airfare Not Refunded (ANR) and Corporate Travel Expense Savings (CTES)
increase linearly with the percentage of passengers seeing pre-emptive rebooking with
Previous and Same Day early Rebooking.
The percentage of Airfare Not Refunded (%ANR) and percentage of Corporate Travel
Expense Savings (%CTES) for each of the 13 one-day cancellation events are shown in Figure
10. %ANR and %CTES increase linearly with the percentage of passengers seeing pre-emptive
rebooking.
Figure 10: Same +Previous Day Preemptively Rebooked Passengers: % savings in ANR, % savinigs
in CTES, as a function of the percentage of passengers seeking rebooking (PPSR) for 13 one day
cancellation events.

21
The average slope of %ANR as function of %PSPR (mµ) is 56% with a slope standard
deviation (mσ) of 15%. The ratio of average slope to standard deviation (mµ/mσ) indicates
relatively consistent behavior across all the 13 one-day cancellation events (see Table 3). The
average slope of %CTES as a function of %PSPR (mµ) is 56% with a slope standard deviation
(mσ) of 15%. The ratio of average slope to standard deviation (mµ/mσ) indicates relatively
consistent behavior across all the 13 one-day cancellation events (Table 3).
Table 3 provides a summary of the “slope” statistics for the Same Day Before pre-emptive
rebooking scenario.
5. CONCLUSIONS
This paper performed an analysis of the feasibility and economic benefits of Pre-emptive
Rebooking for large scale one-day cancelled flight events (i.e. more than 20 flights cancelled on
a day). A method was described using a Monte Carlo simulation for alterative rebooking for
historic passenger itineraries, flight performance, and seat availability. Metrics were developed
for the feasibility, airline economic benefits, and passenger economic benefits.
Case-studies for 13 one-day cancellation events showed that pre-emptive rebooking in
advance of forecast large-scale cancellation events is feasible. At least 70% of the passengers
choosing to take advantage of pre-emptive rebooking can be accommodated before their original
Table 3 The statistics for pre-emptive rebooking for 2012
Analysis Same Day+Previous Day
Preemptively
mµ mσ mµ/ mσ
Slope for % Pax Rebooked 0.77 0.049 16
Slope for ANR 0.74 0.10 7.4
Slope for CTES 0.56 0.15 3. 7
22
scheduled flight time. The remaining passengers seeking pre-emptive rebooking cannot be re-
accommodated due to insufficient seats (not insufficient flights).
Pre-emptive rebooking on the previous day was not required as it did not significantly
change the percentage of passengers re-accommodated.
Pre-emptive rebooking is economically beneficial to both airlines and passengers. The
Percentage of Passengers Accommodated (PPA), Airfare Not Refunded (ANR), and Corporate
Travel Expense Savings (CTES) for each event are positive. Further these metrics exhibit a
linear function with respect to the Percentage of Passengers Seeking Rebooking (PPSR).
Approximately 70% of the PPSR were accommodated. On average $297K of the obligated
refunds could be saved (ANR) and $49K of the unplanned travel expenses could be saved
(CTES). Further, the 13 days analyzed across the seasons exhibited similar behavior and this
behavior increased linearly with increasing percentage of passengers opting for pre-emptive
rebooking.
In addition to the savings, there is the opportunity for the airlines to return some degree of
control to the passengers for their travel plans during these irregular operations events and to
eliminate uncertainty in travel. There is also an opportunity for airlines to generate additional
revenue by offering a for-fee option that would move passengers to the front of the preemptive
rebooking queue in the event of a large scale event (Raiteri, 2015).
Future work includes analysis of alternate cancellation policies, load factors and route
structures. Monte Carlo analysis could also be done for random variables for airfare distributions
between city-pairs and for per-diem distributions for overnight costs. The ANR calculation
represents an upper-bound and could take into account passengers choice to accept credit and for
23
breakage. Analysis could also be done to account for airfare revenue lost by using seats for
rebooking that otherwise may have been sold to last minute travelers in flight.
Acknowledgements
Kevin Lai, John Shortle, George Donohue, Anvardh Nanduri (GMU), Ashley Raiteri (The
Answer Group), Terry Thompson (LMI), and anonymous reviewers from two major airlines.
This work was funded by George Mason University Center for Air Transportation Systems
Research Foundation.
References
AhmadBeygi, S., Cohn, A., Guan, Y., & Belobaba, P. (2008). Analysis of the potential for delay
propagation in passenger airline networks. Journal of air transport management, 14(5), 221-236.
Bratu, S., & Barnhart, C. (2006). Flight operations recovery: New approaches considering
passenger recovery. Journal of Scheduling, 9(3), 279-298.
Bureau of Transportation and Statistics (2015), Air Fares, Available:
http://www.rita.dot.gov/bts/airfares
Chiraphadhanakul, V., & Barnhart, C. (2013). Robust flight schedules through slack re-
allocation. EURO Journal on Transportation and Logistics, 2(4), 277-306.
Clarke, M. D. D. (1998). Irregular airline operations: a review of the state-of-the-practice in
airline operations control centers. Journal of Air Transport Management, 4(2), 67-76.
DoT (2015). Percentage of Air Travel for Business vs Other Purposes, Available: https://ntl.custhelp.com/app/answers/detail/a_id/252/~/percentage-of-air-travel-for-business-vs-other-
purposes
Eggenberg, N., Salani, M., & Bierlaire, M. (2010). Constraint-specific recovery network for
solving airline recovery problems. Computers & operations research, 37(6), 1014-1026.
Jafari, N., & Zegordi, S. H. (2011). Simultaneous recovery model for aircraft and
passengers. Journal of the Franklin Institute, 348(7), 1638-1655.
Li, Tao, H. Baik, A.A. Trani (2013) A method to estimate the historical US air travel demand.
Journal of Advanced Transportation. Special Issue: Special Issue: Public Transport Systems. Volume 47,
Issue 3, pages 249–265, April 2013
McCarty, L. (2012) Preemptive Rerouting of Airline Passengers Under Uncertain Delays" (2012). Dissertation. Chairs: Amy E. Cohn, Divakar Viswanath. Paper 40.
http://digitalcommons.cedarville.edu/faculty_dissertations/40
Raiteri, A (2015) personal conversation
Sherry, L., G. Calderon-Meza, A. Samant (2010) Trends in Airline Passenger Trip Delays (2007 –
2009). In Proceedings 2010 Integrated Communications Navigation and Surveillance (ICNS) Conference
May 11-13, 2010
Sherry, L. (2014) A Method for Quantifying Travel Productivity for Corporate Travel
Managers. Journal of Air Transport Management, Volume 42, January 2015, Pages 118–124
24
U.S. General Services Administration (2012), GSA: Per Diem Rates, Available:
http://www.gsa.gov/portal/category/104711
Wambsganss, M.C. (2001) New Concepts and Methods in Air Traffic Management. In
Transportation Analysis: Collaborative Decision Making in Air Traffic Management. Editors:
Lucio Bianco, Paolo Dell’Olmo, Amedeo R. Odoni. Springer Berlin Heidelberg: Germany. pp 1-
15
Yan, C. V. Vaze , A. Vanderboll, C. Barnhart (2015) Tarmac Delay Policies: A Passenger-
Centric Analysis. Transportation Research Part A: Policy and Practice. Volume 83, January
2016, Pages 42–62 Elsevier B.V.