enhancing debugging technology -...
TRANSCRIPT

ENHANCING DEBUGGING TECHNOLOGY
A Thesis
Submitted to the Faculty
of
Purdue University
by
Chonchanok Viravan
In Partial Ful�llment of the
Requirements for the Degree
of
Doctor of Philosophy
March 1994

ii
I
dedicate this
thesis to my parent,
Chuchit and Ueychai Viravan.
It is my tribute to their constant
sacri�ce, concern, encouragement, discipline, and love.
iii
ACKNOWLEDGMENTS
I owe my deepest gratitude to my advisor, Dr. Eugene H. Spa�ord, for his e�orts
in training me to be a researcher. I wish to thank him for being patient with my
mistakes, for using kind words to correct them, and for guiding me and helping me
mitigate problems I faced throughout my study.
I would also like to thank members of my advisory committee for their contri-
bution to my research. I thank Dr. Richard DeMillo for suggesting the topic of the
debugging oracle and suggesting ideas for the initial empirical study. I thank Dr.
Michal Young for introducing me to the Transition Axiom method and for suggesting
ways to simplify the formalism used in the earlier draft of this thesis. I thank Dr.
H. E. Dunsmore for reviewing my experimental design and for providing the analysis
program to compute some software metrics for my experiments.
The e�ort required to do my research has been greatly reduced by the work of
Hiralal Agrawal. I wish to thank him for his research in dynamic slicing and his
implementation of Spyder. They formed a solid foundation on which my research is
based.
I owe my accomplishments to my mother, Chuchit Viravan. I would like to thank
her for teaching me the value of education, for the sacri�ces she made in order to sup-
port me through school, for her unconditional love, and consoling words in times of
crisis. I also would like to thank my father, Ueychai Viravan, my sisters Kanokkaew,
Raveephorn, Naphaphen, Benjavan, Phunphilas, and my brother-in-law, Viriya Up-
atising, for their emotional support and encouragement through years of my graduate
study.

iv
My study at Purdue has been made pleasant by a number of friends: Michael
Beaven, Guillermina Cabral, Byoungju Choi, Rajiv Choudhary, Ling-Yu Chuang, Al-
lan Knies, Judy Lalley, Pean Lim, Ronnie Martin, Mary Jo Maslin, Shirley Shrum,
Sumanas Stienvuthchan, and Julia Varshavsky. Their understanding and perspec-
tives of the world have given me comfort when I faced adversities and hardships.
Conversations with them are entertaining as well as intellectually stimulating.
For preparing my experiments, I thank Dr. Thomas Kuzchek for his teaching on
experimental design; Dr. Aditya Mathur for allowing me to conduct an experiment
in his class; Dan Trinkle for providing the program for the �rst study and for acting
as an oracle in that study; Hsin Pan for giving me an overview of Spyder's code; and
Richard Bingle for answering questions about programming the X window interface.
For participating in and/or helping me �nd participants for the experiments, I
thank Amy Ng, Andrew Royappa, Anupam Joshi, Brian Shultz, Brian Fisher, Bryce
Pluckebaum, Chad Piatak, David Bainbridge, David Boardman, David Martelon,
Elton Glaser, Eric Weigman, Garry Adkins, Gregory Bernhardt, Herwig Egghart, Ho
See Leung, HongHai Shen, Ilonaluvina Kusnierz, James Bednorz, Jindon Chen, John
Lawry, John Mitchell, Jon Murray, Joseph Munson, Joseph Nuspl, Katitza Gerdau,
Larry Snyder, Leo Rijadi, Ling-Yu Chuang, Maryjane Scharenberg, Mei-Hwa Chen,
Michael Beaven, Michael Harris, Mike Hiskes, Nicole Sallak, Patrick Muckelbauer,
Rajiv Choudhary, Robert Rusbasan, Robert Anthony Nesius, Robert Frazier, Robert
Hite, Rosman Tawel, Sa�da Mohammed, Sean Ahern, Sean Vyain, Sharon Decker,
Sriram Ramkrishna, Steve Chapin, Steve Schnelker, Terrence Neal, Tim Liu, Varun
Sehgal, Victor Carlos, Victor Norman, Vinod Anupam, William Ray Anderson, Yan
Xiao, and Zakri Md Sallen.
Lastly, I wish to thank my statistical consultant, Sean X. Tang, for answering
several statistical questions and checking the validity of my statistical analysis result.
I also thank Ginny Quasny and Mary Jo Maslin for proofreading earlier drafts of this
thesis.

DISCARD THIS PAGE

v
TABLE OF CONTENTS
Page
LIST OF TABLES : : : : : : : : : : : : : : : : : : : : : : : : : : : : : : : : : viii
LIST OF FIGURES : : : : : : : : : : : : : : : : : : : : : : : : : : : : : : : : ix
ABSTRACT : : : : : : : : : : : : : : : : : : : : : : : : : : : : : : : : : : : : x
1. INTRODUCTION : : : : : : : : : : : : : : : : : : : : : : : : : : : : : : : 1
1.1 Debugging Background : : : : : : : : : : : : : : : : : : : : : : : : : : 21.2 Debugging Oracle Problem : : : : : : : : : : : : : : : : : : : : : : : : 41.3 Statement of Thesis : : : : : : : : : : : : : : : : : : : : : : : : : : : : 71.4 Overview : : : : : : : : : : : : : : : : : : : : : : : : : : : : : : : : : : 8
2. TERMINOLOGY AND RELATED WORK : : : : : : : : : : : : : : : : : 10
2.1 Terminology : : : : : : : : : : : : : : : : : : : : : : : : : : : : : : : : 102.1.1 Program : : : : : : : : : : : : : : : : : : : : : : : : : : : : : : 102.1.2 Program speci�cation : : : : : : : : : : : : : : : : : : : : : : : 122.1.3 Faults : : : : : : : : : : : : : : : : : : : : : : : : : : : : : : : 122.1.4 Failure : : : : : : : : : : : : : : : : : : : : : : : : : : : : : : : 142.1.5 Program slicing : : : : : : : : : : : : : : : : : : : : : : : : : : 14
2.2 Related Work in Debugging : : : : : : : : : : : : : : : : : : : : : : : 162.2.1 Evaluation of hypotheses on program behavior : : : : : : : : : 162.2.2 Formulation of hypotheses on fault identity : : : : : : : : : : : 182.2.3 Formulation of hypotheses on fault location : : : : : : : : : : 192.2.4 Shortcomings in previous work in debugging : : : : : : : : : : 24
2.3 Related Work in Critic Systems : : : : : : : : : : : : : : : : : : : : : 262.4 Summary : : : : : : : : : : : : : : : : : : : : : : : : : : : : : : : : : 28
3. EMPIRICAL STUDIES OF DEBUGGING ASSISTANTS : : : : : : : : : 29
3.1 Overview of the Studies : : : : : : : : : : : : : : : : : : : : : : : : : 303.1.1 Program : : : : : : : : : : : : : : : : : : : : : : : : : : : : : : 303.1.2 Faults : : : : : : : : : : : : : : : : : : : : : : : : : : : : : : : 30

vi
Page
3.1.3 Participants : : : : : : : : : : : : : : : : : : : : : : : : : : : : 313.1.4 Procedures : : : : : : : : : : : : : : : : : : : : : : : : : : : : : 313.1.5 Measurements : : : : : : : : : : : : : : : : : : : : : : : : : : : 31
3.2 Pilot Study #1 : : : : : : : : : : : : : : : : : : : : : : : : : : : : : : 323.2.1 The assistant : : : : : : : : : : : : : : : : : : : : : : : : : : : 323.2.2 The study : : : : : : : : : : : : : : : : : : : : : : : : : : : : : 323.2.3 The results : : : : : : : : : : : : : : : : : : : : : : : : : : : : 32
3.3 Pilot Study #2 : : : : : : : : : : : : : : : : : : : : : : : : : : : : : : 333.3.1 The assistant : : : : : : : : : : : : : : : : : : : : : : : : : : : 333.3.2 The study : : : : : : : : : : : : : : : : : : : : : : : : : : : : : 333.3.3 The results : : : : : : : : : : : : : : : : : : : : : : : : : : : : 34
3.4 Pilot Study #3 : : : : : : : : : : : : : : : : : : : : : : : : : : : : : : 373.4.1 The assistants : : : : : : : : : : : : : : : : : : : : : : : : : : : 373.4.2 The study : : : : : : : : : : : : : : : : : : : : : : : : : : : : : 383.4.3 The results : : : : : : : : : : : : : : : : : : : : : : : : : : : : 39
3.5 Debugging Pitfalls : : : : : : : : : : : : : : : : : : : : : : : : : : : : 393.5.1 The \Fixation on the wrong location" problem : : : : : : : : : 403.5.2 The \Underuse" problem : : : : : : : : : : : : : : : : : : : : : 40
3.6 Programmers' Needs : : : : : : : : : : : : : : : : : : : : : : : : : : : 413.7 Desirable Debugging Assistance : : : : : : : : : : : : : : : : : : : : : 42
3.7.1 Self-assistance : : : : : : : : : : : : : : : : : : : : : : : : : : : 423.7.2 Assistance from assistants under test : : : : : : : : : : : : : : 453.7.3 Assistance for debugging fault of omission : : : : : : : : : : : 48
3.8 Summary : : : : : : : : : : : : : : : : : : : : : : : : : : : : : : : : : 50
4. DEBUGGING CRITIC : : : : : : : : : : : : : : : : : : : : : : : : : : : : : 52
4.1 Overview of the Debugging Critic : : : : : : : : : : : : : : : : : : : : 524.1.1 Functions of a debugging critic : : : : : : : : : : : : : : : : : 534.1.2 Design of a debugging critic : : : : : : : : : : : : : : : : : : : 534.1.3 Scope : : : : : : : : : : : : : : : : : : : : : : : : : : : : : : : 58
4.2 The Concept Underlying a Debugging Critic : : : : : : : : : : : : : : 584.2.1 Knowledge representation for failure symptoms : : : : : : : : 594.2.2 Execution path slicing : : : : : : : : : : : : : : : : : : : : : : 624.2.3 Characteristics of fault-manifesting occurrences : : : : : : : : 67
4.3 Debugging Critic Operations : : : : : : : : : : : : : : : : : : : : : : : 744.3.1 Overview : : : : : : : : : : : : : : : : : : : : : : : : : : : : : 744.3.2 Evaluation of output statements : : : : : : : : : : : : : : : : : 774.3.3 Initialization of search spaces for a manifested fault : : : : : : 794.3.4 Formulation of hypotheses about fault location : : : : : : : : : 814.3.5 Evaluation of statements outside search spaces : : : : : : : : : 85

vii
Page
4.3.6 Evaluate statements inside search spaces : : : : : : : : : : : : 864.4 A Sample Session with a Debugging Critic : : : : : : : : : : : : : : : 904.5 Summary : : : : : : : : : : : : : : : : : : : : : : : : : : : : : : : : : 94
5. IMPLEMENTATION AND EVALUATION : : : : : : : : : : : : : : : : : 95
5.1 A Debugging Critic Prototype : : : : : : : : : : : : : : : : : : : : : : 955.1.1 Spyder : : : : : : : : : : : : : : : : : : : : : : : : : : : : : : : 955.1.2 Spyder's critic extension : : : : : : : : : : : : : : : : : : : : : 965.1.3 Implementation limitations : : : : : : : : : : : : : : : : : : : : 103
5.2 Experimental Evaluation : : : : : : : : : : : : : : : : : : : : : : : : : 1045.2.1 Experimental design : : : : : : : : : : : : : : : : : : : : : : : 1055.2.2 Participants : : : : : : : : : : : : : : : : : : : : : : : : : : : : 1085.2.3 Procedures : : : : : : : : : : : : : : : : : : : : : : : : : : : : : 1085.2.4 Analysis results : : : : : : : : : : : : : : : : : : : : : : : : : : 1095.2.5 Qualitative results : : : : : : : : : : : : : : : : : : : : : : : : 112
5.3 Questions about Debugging Critic : : : : : : : : : : : : : : : : : : : : 1165.4 Summary : : : : : : : : : : : : : : : : : : : : : : : : : : : : : : : : : 118
6. CONCLUSIONS : : : : : : : : : : : : : : : : : : : : : : : : : : : : : : : : 119
6.1 Support for Statement of Thesis : : : : : : : : : : : : : : : : : : : : : 1196.2 Contributions : : : : : : : : : : : : : : : : : : : : : : : : : : : : : : : 1216.3 Future Research Directions : : : : : : : : : : : : : : : : : : : : : : : : 1226.4 Concluding Remarks : : : : : : : : : : : : : : : : : : : : : : : : : : : 124
LIST OF REFERENCES : : : : : : : : : : : : : : : : : : : : : : : : : : : : : 125
APPENDICES
Appendix A: Data from Empirical Studies on Debugging Assistants : : : 133Appendix B: Proofs for Search Spaces on a Manifested Fault : : : : : : : 138Appendix C: Survey from Experimental Study on Debugging Critic : : : 143
VITA : : : : : : : : : : : : : : : : : : : : : : : : : : : : : : : : : : : : : : : : 146

DISCARD THIS PAGE

viii
LIST OF TABLES
Table Page
4.1 Output statement evaluation and derived failure symptoms : : : : : : : 78
4.2 Occurrences of prime suspect statements for each failure symptom : : : 82
4.3 Hypotheses about missing statements for each failure symptom when theprime suspect statements are absent : : : : : : : : : : : : : : : : : : : : 84
4.4 Update for a failure symptom : : : : : : : : : : : : : : : : : : : : : : : : 88
5.1 Critic's command buttons : : : : : : : : : : : : : : : : : : : : : : : : : : 101
5.2 Statistical result : : : : : : : : : : : : : : : : : : : : : : : : : : : : : : : 111
AppendixTable
C.1 Average helpfulness rating of Spyder features : : : : : : : : : : : : : : : 144
C.2 Percentage of programmers who did not use Spyder features : : : : : : : 145
C.3 Number of programmers who recommended Spyder features as an exten-sion of conventional debuggers : : : : : : : : : : : : : : : : : : : : : : : 145

DISCARD THIS PAGE

ix
LIST OF FIGURES
Figure Page
1.1 A debugging process model : : : : : : : : : : : : : : : : : : : : : : : : : 3
3.1 The requests made to the active and passive oracle in pilot study #1 and#2 : : : : : : : : : : : : : : : : : : : : : : : : : : : : : : : : : : : : : : : 43
3.2 Percentage of programmers who found/�xed the fault : : : : : : : : : : 44
4.1 A concept model for a debugging critic : : : : : : : : : : : : : : : : : : : 57
4.2 A sample faulty program (in a psuedo-language) : : : : : : : : : : : : : 70
4.3 A faulty program trityp.c : : : : : : : : : : : : : : : : : : : : : : : : : : 91
5.1 New Spyder's Main Window : : : : : : : : : : : : : : : : : : : : : : : : : 98
5.2 Critic's Window : : : : : : : : : : : : : : : : : : : : : : : : : : : : : : : 99
5.3 Sample dialogue entry : : : : : : : : : : : : : : : : : : : : : : : : : : : : 100
5.4 A window to enter erroneous variables : : : : : : : : : : : : : : : : : : : 102
5.5 Experimental design : : : : : : : : : : : : : : : : : : : : : : : : : : : : : 106
5.6 Debugging speed comparison : : : : : : : : : : : : : : : : : : : : : : : : 110
5.7 Percentage of programmers who identi�ed wrong fault location : : : : : 113
AppendixFigure
A.1 Debugging time comparison : : : : : : : : : : : : : : : : : : : : : : : : : 136
A.2 Debugging accuracy comparison : : : : : : : : : : : : : : : : : : : : : : 137

x
ABSTRACT
Viravan, Chonchanok. Ph.D., Purdue University, May 1994. Enhancing DebuggingTechnology. Major Professor: Dr. Eugene H. Spa�ord.
This dissertation presents a new debugging assistant called a Debugging Critic. As
an alternative to an automated debugging oracle, the debugging critic evaluates hy-
potheses about fault locations. If it cannot con�rm that the code at the hypothesized
location contains a fault, it formulates an alternative hypothesis about the location
of a faulty statement or the location of omitted statements. The debugging critic
derives knowledge of possible locations of a fault that manifested itself under a given
test case from failure symptoms. It derives information about failure symptoms from
programmers' replies to its questions. Therefore, it can operate without a line-by-line
speci�cation and a knowledge base of faults.
A prototype of our debugging critic has been implemented as an extension of
an existing debugger, Spyder. An experiment with Spyder shows that programmers
debug two to four times faster on the average with the debugging critic than without
it. Ninety-two percent of the critic's users recommend the critic as an extension of
conventional debuggers.
The research in this dissertation contributes to debugging and critic systems. In
debugging, our experiment shows that an active debugging assistant can e�ectively
improve debugging performance. Another contribution is our approach to evaluate
and formulate hypotheses about fault locations, especially the locations of omitted
statements. In critic systems, our contribution is the use of questions to present
informative and non-insulting criticism.

1
1. INTRODUCTION
There are two ways to write error-free programs;
only the third one works.
{ Perlis (Epigrams on Programming, 1982)
Program errors are a fundamental phenomenon in the real world of software
[Sch71]. Because software designers and programmers are only human, they are likely
to take inappropriate actions during software development that ultimately may cause
the software to fail. These actions are what we call errors [IEE83]. The physical
manifestations of errors in the program text are known as faults or bugs [IEE83]. We
can realize the presence of errors if we can �nd an error-revealing test case that causes
the program to fail. A program failure is a departure of program operation from pro-
gram speci�cation [IEE83]. A program speci�cation is a document that prescribes
in a complete, precise, and veri�able manner the requirements, design, behavior, or
other characteristics of a program or a program component [IEE83].
The objective of testing is to explore the input space of a program to �nd error-
revealing test cases that cause the program to fail, whereas the objective of debugging
is to �nd and �x the faults responsible for failures [Agr91, Pan91]. Despite the fact
that over 50% of total software development costs have been reported spent on the
testing and debugging phases [Boe81, Mye79, Pre82], debugging remains one of the
least developed areas in software engineering [AFC91].
Debugging, unlike testing, is an unstructured and spontaneous process [Tra79,
Lau79]. The process is still human-oriented even when a debugging facility is used
[Joh83]. It is regarded as more of an art than a science [GB85].

2
1.1 Debugging Background
Debugging is a process of locating and repairing faults. Research in cognitive
aspects of programming characterizes debugging as an iterative process of synthesiz-
ing, testing, and re�ning hypotheses about fault locations and repairs [Ves85, Gou75,
MW91]. A debugging process model proposed by Araki et al. [AFC91] (see Figure
1.1) echoes these aspects. A programmer develops his initial set of hypotheses when
he observes a program failure. Hypotheses may concern the location of faults, the
types and identity of faults, the expected program behavior, and the fault repairs,
among many other things [AFC91]. Araki's hypothesis-set also includes the program-
mer's empirical knowledge of the software development process, the program, and its
speci�cations. This hypothesis set evolves as a programmer selects and veri�es the
hypotheses. Araki called hypotheses that have been proven fact hypotheses. The
process ends when the fault is �xed.
Current debugging tools and techniques support the evaluation of hypotheses
about program behavior and the formulation of hypotheses about fault location and
fault identity. Most debuggers help a programmer formulate and evaluate a hypothe-
ses about program execution behavior by allowing him to observe actual program
behavior. Conventional debuggers, such as Dbx [Dun86], Sdb [Kat79], and VAX
Debug [Bea83], o�er commands to step through the program execution, set break
points, examine variable values at the break points, and trace program execution.
Experimental debuggers, such as Spyder [Agr91], o�er backward execution [Agr91].
Other prototype systems, such as Powell and Linton's OMEGA [PL83] and LeDoux's
YODA [LeD85], allow the programmer to query program behavior.
Fault recognition techniques help a programmer formulate hypotheses about fault
identity and fault location. These techniques require either a knowledge base of faults
or the program speci�cation as their input. A knowledge base of faults contains
common fault patterns. When part of a program matches a fault pattern in the
knowledge base, the location becomes a hypothesized fault location. Lint [Dar90],

3
Initialize hypothesis-set
Bug Fixed?
Modify hypothesis-set
Select a hypothesis
Verify a hypothesis
NO
YES
END
Figure 1.1 A debugging process model

4
relying on its knowledge of common errors, �nds common portability problems and
certain types of coding errors in C programs. Program speci�cations are used by
systems such as Lukey's PUDSY [Luk80], Adam's LAURA [AL80], and Jackson's
ASPECT [Jac93] to identify faults by identifying discrepancies between the program
and its speci�cation.
Fault localization techniques help a programmer formulate hypotheses about fault
location. Program slicing techniques [Wei82, LW87, Agr91, OO84, HRB90, KL90,
Ven91, YL88, Pan93] extract statements or procedures on which the speci�ed vari-
able or statement depends, according to prede�ned criteria. The programmer can
select a location containing statements in a slice as his hypothesized location. Fault
localization heuristics, such as Collofello and Cousins's decision-to-decision path-
based heuristics [CC87b] and Pan's slicing-based heuristics [Pan93] use test-based
knowledge to enhance their ability to locate a fault. Knowledge of program plans,
as described in several papers [HN90, JS85, Rut76, Luk80, AL80, Let87, KLN91,
KN89, RW88, Sha81, Wil90, Har90] can also be used to identify possible fault loca-
tions. Because a program plan describes a pattern of code to accomplish a speci�c
task, the locations with a mismatch between the code and a program plan pattern
are identi�ed as possible fault locations. Fault localization binary search algorithms
[Sha83, SKF91, KL88, Kup89] can also locate possible fault locations in side-e�ect-
free programs.
Although debugging techniques to help formulate fault-related hypotheses are
abundant, techniques to help verify these hypotheses are scarce. It is reasonable to
investigate whether techniques to help verify fault-related hypotheses can enhance
current debugging technology.
1.2 Debugging Oracle Problem
According to Weinberg [Wei71], programmers have di�culty �nding errors because
their conjectures become too prematurely �xed, blinding them to other possibilities.

5
This problem occurs when the programmer spends too much time looking for errors
in the wrong place [Gou75, MM83, SV93]. This problem is called \�xation on the
wrong location."
As a fault localization process can consume up to 95% of the overall debugging
e�ort [Mye79], it is desirable to overcome the problem of \�xation on the wrong
location." Current debugging assistance methods do not yet address this problem
adequately for three reasons:
� Traditional assistance which helps programmers to observe program execution
behavior does not prevent the problem of \�xation on the wrong location." A
programmer inspects the program execution to �nd anomalous behavior. Our
studies [SV93] show that programmers can confuse a location with anomalous
behavior with a fault location. This leads to, rather than solves, the problem
of \�xation on the wrong location."
� Fault recognition tools cannot recognize all faults. When the code does not
match any fault pattern in the knowledge base of faults, the code location
can neither be con�rmed nor rejected as a fault location. This is because the
knowledge base of faults is always incomplete (see page 6). Also, when the tool
generates an error message or a warning message about a non-faulty location,
it can cause rather than solve the problem of \�xation on the wrong location".
� A programmer with access to program slices for erroneous variables can still
develop a �xation on the wrong location within program slices [SV93]. When the
fault is the result of omitted statements, a location that contains no statement in
a program slice for an erroneous variable can neither be con�rmed nor rejected
as a fault location.
A debugging oracle is a person or a system that decides whether hypotheses about
fault location, fault identity, and fault repair are true [SV93]. A programmer is usually
responsible for making these decisions. If a debugging oracle can be automated, its

6
ability to verify a location has the potential to overcome the problem of \�xation on
the wrong location."
However, automating a debugging oracle is made di�cult by several factors. To
answer \Is the statement at the given location faulty?" automatically, an oracle would
need a line-by-line formal speci�cation of the program, a complete knowledge of pos-
sible faulty patterns, and/or a capability to prove correctness of the code.
� A line-by-line speci�cation can be used to evaluate every execution of the given
code to identify discrepancies. The problem with this approach is the lack of
line-by-line speci�cations in practice.
� Knowledge of possible fault patterns can be used to recognize whether a location
contains a fault. The problem with this approach is the incompleteness of any
knowledge base of faults. A knowledge base of faults is complete when no
new fault and no new program can be introduced. As one can always write a
new program and introduce new programming language constructs, a complete
knowledge of all possible fault patterns cannot be attained.
� A capability to prove correctness of code can be used to verify whether the
code is faulty. The problem with this approach is that the time required to
prepare the input for a proof-checker can outweigh debugging time saved by
the oracle. The di�culty in proving correctness of the code is that it may
not always be feasible to characterize many real-life programs mathematically
[DLP79]. Also, existing automatic program provers, such as the one de�ned
by Goldschlag [Gol90], act as proof-checkers rather than proof-generators, as
they take a rough draft of a proof as input. Proofs, even in a draft format, are
generally much more di�cult to construct and understand than the programs
themselves [DLP79]. Debugging time may even increase if a programmer has
to construct a proof draft for every hypothesis he makes.
This dissertation approaches the debugging oracle problem with the conjecture
that it is possible to construct an alternative, automatable tool that can operate in

7
the absence of both a line-by-line speci�cation and a knowledge-base of fault patterns.
It is desirable for such an alternative assistant to overcome the problem of \�xation
on the wrong location."
1.3 Statement of Thesis
Thesis
Programmers can debug faster when they have a tool to help evaluate hy-
potheses about fault locations in addition to tools that help formulate fault-
related or program behavior-related hypotheses.
To support the statement of thesis, we propose an alternative to a debugging
oracle. This alternative answers the question, \Is it conclusive that the statement
at location loc contains the fault that was manifested under the given test case t?"
instead of \Is the statement at location loc faulty?"
The primary mechanism of our proposed assistant is to evaluate hypotheses about
fault location. Given a hypothesized location of a fault and a test case, the assistant
evaluates whether the statement contains the fault that causes the program to fail un-
der the given test case. This method can work in the absence of a formal speci�cation
and a knowledge base of common fault patterns.
This method works under the assumptions that (1) the program is sequential and
structured, (2) when the program may contain multiple faults, only one fault is man-
ifested by a given error-revealing test case, (3) the program is written in statement-
oriented language, (4) the program has no in-line side-e�ects (such as i++ in the
C language), and (5) the programmer has access to the high-level natural language
speci�cation of the program. This method is operational in the absence of a formal
speci�cation and a knowledge base of faults.
As this alternative is also a debugging assistant, we proposed addition mechanisms
to support the hypotheses evaluation process in ways that can improve debugging
speed:

8
Maintain knowledge about the program.
Araki suggested that knowledge about the program is enhanced when a hypoth-
esis is evaluated, even if it can be neither con�rmed nor rejected [AFC91]. It is
desirable to identify what types of knowledge can be collected and applied to
enhance the assistant.
Formulate an alternative hypothesis about fault location.
When the programmer's hypothesis cannot be con�rmed, our assistant formu-
lates an alternative hypothesis. This alternative hypothesis may indicate either
a possible location of a faulty statement or of omitted statements. This assis-
tance is desirable because it has a potential to help remedy the \�xation on the
wrong location" problem.
Augment existing fault localization or fault recognition tools.
If our proposed assistant can augment other existing fault localization or fault
recognition tools, then it can be integrated into other debuggers. For this
research, the fault localization tool used is a program slicing tool. The fault
recognition tool used is a pattern matching tool for which the programer can
de�ne a fault pattern to search.
1.4 Overview
Chapter 2 describes terminology and work related to both debugging and to our
alternative to a debugging oracle. Chapter 3 describes an empirical study to identify
the form of an oracle's assistance that can improve debugging speed and accuracy.
As this study involved expert programmers who debugged a program with omitted
statements, the methods they used to locate omitted statements are also reported.
Chapter 4 describes a debugging critic as an alternative to a debugging oracle. It
describes how the critic system evaluates hypotheses about fault locations, maintains
knowledge about the program, and formulates an alternative hypothesis. The method
9
of formulating a hypothesis about the location of omitted statements is also described.
Chapter 5 describes a prototype of a debugging critic and an experimental study to
evaluate its e�ectiveness. Chapter 6 presents the summary, the contributions, and
suggestions for future research directions.

10
2. TERMINOLOGY AND RELATED WORK
This chapter presents terminology and work related to debugging and our alter-
native assistant to a debugging oracle. Our alternative assistant is categorized as a
critic system.
2.1 Terminology
This section presents terms pertaining to programs, program speci�cations, faults,
failures, and program slicing used in this dissertation.
2.1.1 Program
A program P is a triple (S;A;�), where S is a set of states, A is a set of actions,
and � is a set of a �nite execution sequences of the form
� = s0�0�!s1
�1�!s2
�2�!s3 : : :
�$�1
�!s$
where si 2 S, �i 2 A, and i is an index identifying an execution step. Step i uniquely
determines state si in a given execution sequence. The last execution step is denoted
by $, as the last state is denoted by s$.
A state si represents a \snapshot" of the program at execution step i. A state,
(�; v1; v2; : : : ; vn), is a vector of values of all variables (vi) and of the control point in
the program (�). A control point � represents the location of the code to be executed
next.
An action �i represents a single indivisible statement that is reached at step i.
A statement is an instruction written in a programming language that can change

11
values in states as the program executes. A procedure contains a set of statements.
The location of an action is the position of a statement in the program text. This
position is identi�ed by a line number. The location of a set of actions is identi�ed
by a procedure name.
A state transition si�i�!si+1 represents an execution of a statement reached at step
i that transforms state si to state si+1. An execution of one or more statements that
transform state si to sj, where i < j, is abbreviated as si��!sj.
An execution sequence, �t, denotes a series of state transitions when P is applied
to test case t. An execution path, �i;jt , corresponds to si��!sj in �t. A statement at
a location loc executes in �i;jt when loc is reached at step k, where i � k < j.
An execution occurrence, L(x;y), is the execution of statements at location L that
maps input state sx to output state sy. If more than one statement executes in
this mapping, L represents procedure names. If only one statement executes in this
mapping, L represents a line number. An execution occurrence of one statement is
called a statement occurrence. An occurrence L(x;y) is in �i;jt , when i � x < y � j.
We use Lamport's notation of state function [Lam89, Lam83] to treat program
control ow as if it is another variable. A state function is a function that maps a
state (�; v1; v2; : : : ; vn) to a value.
A program variable is an expression in a program that is associated with a memory
location. Each variable can be treated as a state function that takes a state s as input
and returns the variable value vi in a state s. When a variable is out-of-scope in state
s, its state function is not de�ned. A variable var at step i refers to the variable var
at the statement reached by step i.
The program control indicates the point in the program that is reached by the
ow of control. The program control can be treated as a state function pc that takes
a state s as input and returns the the control point � in a state s.

12
2.1.2 Program speci�cation
A program speci�cation is a document that prescribes in a complete, precise, and
veri�able manner the requirements, design, behavior, or other characteristics of a
program or a program component [IEE83]. A program behavior speci�cation describes
properties that the program execution must satisfy. These properties either specify
what the program is allowed to do or what the program must do. An execution
ocurrence violates a program behavioral speci�cation when it represents a disallowed
state transition or an omitted state transition.
2.1.3 Faults
Software errors are inappropriate actions during software development that ulti-
mately may cause software to fail [IEE83]. A software fault is the physical manifes-
tation of an error in the program [IEE83]. A faulty location means the code at the
location contains a fault or omits one or more statement.
A fault manifests itself when the execution of code at a faulty location yields
an error-revealing state. A value in a state is error-revealing if it deviates from
the program speci�cation. An erroneous variable is a variable whose value is error-
revealing. An erroneous control ow occurs when the value of pc is error-revealing.
For example, if the speci�cation speci�ed (i < j), but (i > j) is used in the program,
then pc can becomes error-revealing after the predicate (i > j) is executed.
An error-revealing state is a state with at least one error-revealing value. A value in
a state is non-error-revealing when it does not deviate from the program speci�cation.
A non-error-revealing state is a state with no error-revealing value. In the absence of
a formal speci�cation, the error-revealing or non-error-revealing status is determined
by the programmer's interpretation of the available speci�cation.
Two classes of faults are faults of commission and faults of omission.
A fault of commission is a fault in an existing statement whose manifestation causes
a value in a program state to change to an error-revealing value.

13
A fault of omission is omitted code that inhibits a change of values in program
states when it manifests itself. Omitted code that might inhibit the change
of variable values includes (1) the omission of an assignment to a variable, (2)
the omission of an input variable in an input statement, and (3) the omission
of an argument in a procedure call. Omitted code that inhibits the change of
control ow to a certain location includes (1) the omission of a predicate in a
predicate statement, (2) the omission of a procedure call statement, and (3)
the omission of a transfer statement (e.g., return, goto statements). Omitted
code that inhibits the production of an output includes the omission of output
statement.
There are circumstances when one error manifests itself as both a fault of omis-
sion and a fault of commission. First circumstance is the case of incomplete predicate
expression. A predicate expression consists of a set of predicates, each of which rep-
resents a condition, that allow the program to perform certain actions. A predicate
expression is incomplete when it does not specify all conditions (as per the speci�-
cation) to control whether the program can perform a certain action. A predicate
statement with an incomplete predicate expression contains a fault of commission
because its execution changes the pc value in an incorrect value. The procedure en-
closing this predicate statement also contains a fault of omission because the omitted
predicate prevents the ow from reaching some statements. For example, when a
predicate expression in an if-statement enclosing x = y + z is incomplete, a new
predicate can be added to an existing predicate expression to repair a fault of com-
mission. However, a new if-statement with a new predicate can also be added to
enclose another x = y + z to repair a fault of omission.
A second circumstance is the case of a wrong variable assignment. This is the
case when an assignment statement assigns the value of a wrong variable or an input
statement reads a value into a wrong variable. Let loc be a location of such statement.
If an erroneous variable depends on the statement at loc, we call the statement at
loc an extra dependency statement and consider that this fault is manifested as a

14
fault of commission. If no erroneous variable depends on the statement at loc, we
call the statement loc a missing dependency statement and consider that this fault is
manifested as a fault of omission.
2.1.4 Failure
A program failure is a departure of the program operation from program speci-
�cation [IEE83]. A program fails when it maps a non-error-revealing state onto an
error-revealing state. When the program that fails is expected to terminate according
to speci�cation, it may not terminate, may terminate abnormally, or may terminate
with erroneous output.
Failure symptoms are visible evidence that a fault has been manifested in the
execution of the given test case. If the detailed and formal speci�cation of a program
are available, failure symptoms can be generated. If a programmer only has access to
a high-level natural language speci�cation, failure symptoms are described according
to his interpretation of such speci�cation.
2.1.5 Program slicing
A program slice is a set of program statements that directly or indirectly con-
tributes to the values assumed by a set of variables at some program point [Wei82].
Di�erent types of program slices are characterized by the type of dependency analysis
and the type of statements in the slice. Two main types of slice analysis, static and
dynamic, are presented below. These descriptions are adapted from Agrawal [Agr91].
Static analysis identi�es statements that, if executed, may a�ect the variable at the
given location. A static slice is computed with respect to the program P, a
variable var, and a location loc.

15
Dynamic analysis identi�es executed statements that actually a�ect the current
value of the variable at the given location. A dynamic slice is computed with
respect to the the program P, a variable var, a location loc, and a test case t.
Types of statements in a slice are assignment statements and predicate statements.
Assignment statements refer to any statement that assigns a value to a variable.
An input statement and procedure call statement are also considered assignment
statements. A simple assignment statement is a statement that can assign value to
at most one variable (e.g., x = y + z). Predicates are in conditional statements such
as if, for-loops, and while-loops.
The variation of static and dynamic slices, de�ned by Agrawal [Agr91], are as
follows.
A reaching de�nition is an assignment statement that can de�ne the variable var
at a given location. The static reaching de�nitions are all reaching de�nitions
of a variable var for all possible execution histories. The dynamic reaching
de�nition is the reaching de�nition that de�nes the current value of var in a
particular execution history.
A data slice includes assignment statements whose computation can propagate into
the value of var at a given location. The static data slice is de�ned as transitive
closure of static reaching de�nitions of var. The dynamic data slice is de�ned
as transitive closure of dynamic reaching de�nitions of var.
A control slice includes predicates that control the ow to the given location (within
one procedure). Agrawal does not distinguish between dynamic and static con-
trol slices.
A program slice includes both assignment and predicate statements. A static program
slice is the transitive closure of static data slices and control slices. A dynamic
program slice is the transitive closure of dynamic data slices and control slices.

16
Current slicing methods do not analyze weak control dependency, inter-statement
control dependency [PC90]. If program slicing was enhanced to consider weak control
dependency, it would be possible to determine the transfer statements (e.g., return,
break, continue, goto's) that a�ect the ow of control to a given location.
2.2 Related Work in Debugging
2.2.1 Evaluation of hypotheses on program behavior
Conventional debuggers help a programmer verify his hypothesis about how the
program behaves. They allow him either to observe or query the program and its
changes in ow of control and values of variables. The programmer recognizes that
the program fails when he observes discrepancies between the hypothesized behavior
and the actual behavior. Techniques to explore program behavior are as follows.
Forward Stepping
In forward stepping, a programmer steps through program execution to observe
the ow of control. Among debuggers that support this feature are Dbx [Dun86],
Sdb [Kat79], and CodeCenter [Cen92].
Backward Stepping
Backward stepping allows the programmer to observe the ow of control in re-
verse order. Some systems, such as EXDAMS [Bal69], save all states in the
execution history so that they can be backtracked by restoring the appropri-
ate state. To backtrack without having to save the whole execution history,
Agrawal, DeMillo, and Spa�ord [ADS91a] introduced a structured backtracking
approach. This approach saves only the latest value of each variable changed in
a statement. Backtracking over a simple or a composite statement is permitted,
but backtracking to the inside of a composite statement is not.
17
Break-and-Examine
The execution of a program suspends at breakpoints to let the programmer
examine the program state. Debugging tools from the 1960's, such as DDT
[SW65], allow the programmer to set breakpoints in assembler programs. Con-
ventional debuggers today, such as Dbx [Dun86], Sdb [Kat79], VAX Debug
[Bea83] and CodeCenter [Cen92] support break-and-examine techniques. These
tools leave it to the programmer to decide where to break and which variables
to examine.
Conditional breakpoints
Conditional breakpoints cause the execution to suspend only when the condition
holds. A programmer can use the condition to represent his hypothesis about
program behavior. He can then reexecute the program to check if and when
the conditions are true, and thus �nd out when anomalous conditions arise
[Hua79, CC87a].
Retrospective observation
A programmer observes program behavior retrospectively if he observes the
execution trace after program execution. A programmer can generate a trace
by inserting print statements in a program. These statements either indicate
that the control reaches certain points or they reveal the values of variables.
Some systems save the execution history to be replayed [Bal69] or redisplayed
in an order that is di�erent from the actual execution (e.g. breadth-�rst order
as in [Duc87, Llo86]).
Query about program behavior
In the design of the OMEGA programming system, Powell and Linton [PL83]
introduced a debugging model that uses a database interface to access both
static and dynamic information. OMEGA supports a rich set of queries on
the values and interconnections of the data, and on where and when certain
18
conditions (events) occur. OMEGA translates the query into machine-level
breakpoints instead of storing run-time information in the database. The initial
experience with OMEGA shows that it is too slow to be useful [LeD85].
Sni�er [Sha81] is a knowledge base interactive debugger for Lisp programs. Its
time rover subsystem supports queries regarding the history of program states.
It is time-consuming to write the query, however, because the programmer must
describe the bug in the query [LeD85].
LeDoux's YODA [LeD85] is a debugger for Ada tasking programs. It supports
time-related queries on a single-trace database as well as queries on a sym-
bol table. A trace database collects time-dependent facts (events) and their
time stamps to answer queries on relationships among events and abstractions
of events. The queries allow a programmer to test assertions about program
properties, including the ordering of states, the sequencing of events, and the
simultaneity of a given set of conditions.
2.2.2 Formulation of hypotheses on fault identity
Formal speci�cation can be used in methods to formulate hypotheses on fault
identity. In Lukey's PUDSY [Luk80], the speci�cation is compared with the abstract
representation of code to �nd the faults. In Adam and Laurent's LAURA [AL80],
the knowledge of the correct algorithms or implementations are used to identify dis-
crepancies with the actual implementation. The discrepancies become hypothesized
faults. In Jackson's ASPECT [Jac93], a static analysis technique uses abstract forms
of speci�cation to detect faults. Given a declarative, data abstraction speci�cation,
ASPECT can detect faults that are not detectable by other static means, such as
missing data or missing dependency relations among data.
A knowledge base of faults can also be used in methods to formulate hypotheses on
fault identity. A knowledge of faults allows a debugger to try to �nd code that matches
the faulty pattern directly. Lint [Dar90], relying on its knowledge of common errors,

19
�nds common portability problems and certain types of coding errors in C programs.
Other debuggers, such as FALOSY [STJ83], PROUST [Joh90] and Sni�er [Sha81],
also operate on common faulty code patterns. A few others, such as Kraut [BH83],
operate on anomalous execution patterns.
2.2.3 Formulation of hypotheses on fault location
Three main categories of methods to formulate hypotheses about fault locations
are based on dependency analysis, on a knowledge base of plans, and on fault local-
ization algorithms. Hypotheses about fault locations derived by these methods are
currently veri�ed by a programmer, not by an automated debugging oracle.
2.2.3.1 Program slicing
Besides the type of program slices we used in this dissertation (as described in
Section 2.1.5), there are several other forms of slicing de�ned:
� Static slice
Weiser's static slice [Wei82, Wei84] is an executable subprogram for computing
variables of interest for any test case. To compute a static slice, Weiser's algo-
rithm decomposes a program by statically analyzing the data- ow and control-
ow of the program. An alternative approach is to compute the slice based on
graph reachability in the program dependence graph, as presented by Ottenstein
and Ottenstein [OO84] and Horwitz, Reps, and Binkeley [HRB90].
� Dynamic slice
Korel and Laski [KL90] de�ne a dynamic (executable) slice as an executable
subprogram that computes the values of variables of interest for the speci�c
test case. Their algorithm is an extension of Weiser's algorithm. In order to
preserve the behavior of the original program, the dynamic executable slice

20
includes extra statements needed in the computation of earlier values of the
output variables.
Agrawal [Agr91] de�nes a dynamic (closure) slice as a closure of all assignment
and predicate statements that a�ect the values of variables of interest for a
speci�c test case. He extends Ottenstein and Ottenstein's program dependence
graph into a dynamic program dependence graph in order to use the graph
reachability approach to compute the slice. By checking overlapping memory
cells among variables, Agrawal's algorithm can also handle a program that uses
pointers, records, and arrays [ADS91b]. The dynamic closure slice excludes any
statement that does not a�ect the current values of the variables.
� Expanded Dynamic slice
Pan [Pan93] expands Agrawal's dynamic slice to include statements in the tran-
sitive closures of executed predicates that enclose a statement in the static slice
of a variable. This slice is a superset of Agrawal's dynamic slice and a subset
of a static slice.
� Critical slice
Pan [Pan93] de�nes a critical slice via mutation analysis. This slice includes
statements whose presence in the program a�ects how the program fails under
a given test case. If a debugging process is integrated with a mutation-based
testing tool, a critical slice is obtained as a by-product. Without such integra-
tion, this slice is computed by (1) removing a statement executed under a given
test case, (2) recompiling, and (3) reexecuting the modi�ed program. This pro-
cess repeats n times, where n is the number of all executable statements in the
original program.
� Forward Slice
A di�erent notion of a program slice, referred to as forward slicing, computes the
set of statements a�ected by the variable of interest. Yau and Liu [YL88] de�ne

21
an algorithm for forward static slicing to support ripple-e�ect analysis. Their
algorithm locates all statements that may be a�ected if the variable of interest
is modi�ed. Forward slicing can help programmers understand the propagation
of a fault (once it has been located).
2.2.3.2 Program Dicing
Lyle and Weiser [LW87] propose the notion of program dicing which uses the static
slices of both correct and incorrect variables to reduce the search space for faults.
Their technique removes statements belonging to static slices of correct variables
from the slices of incorrect variables. The system gains knowledge of the correctness
of variables through the observation of variable values during the execution of the
program with various test cases.
If the term \dicing" is taken literally as a process of cutting up a program to
reduce the search space for faults, then slice operations suggested by Agrawal [Agr91]
present other forms of program dicing. Operations such as union, subtraction, and
intersection, can be used to combine the slices. Pan's heuristics [Pan93], as described
on page 22, apply program dicing to help locate faults.
2.2.3.3 Heuristics that use test-based knowledge
Test-based knowledge encompasses the test data selection strategy and the set of
test data generated. The test data selection strategy suggests the potential faults
it tries to uncover [CR83]. The execution of a set of test data can be subjected to
several forms of anomalous behavior analysis [Pan91]. It is more helpful, however, if
we use an adequate test data set [DLS78] that di�erentiates a program being tested
from incorrect programs.
Collofello and Cousins [CC87b] combine test-based knowledge with dependency
analysis to support fault guessing at statement block levels. Using dependency analy-
sis, the program is �rst partitioned into many decision-to-decision paths (DD paths),

22
which are sections of straight line code existing between predicates in the program.
During the testing session, execution frequency of DD paths is monitored. Based
on these counts in error-revealing and non-error-revealing test cases, they propose
several heuristics to predict which DD paths may contain the faults.
Pan [Pan93] de�nes families of heuristics to locate faults. These heuristics use
dynamic dependency analysis to analyze the execution using error-revealing and non-
error-revealing test data sets. Some heuristics work with mutation-based test knowl-
edge. Execution frequency is used in some heuristics to identify a statement or a
block of code that has high execution frequency in error-revealing test cases, but low
in non-error-revealing test cases.
2.2.3.4 Near-miss recognition of program plans
Plans (also called cliches [RW88]) are the methods for achieving a goal, where a
goal is a task performed in the program [Sol87]. Levels of plans range from common
programming constructs and data structures to the algorithms of the whole program
[HN90]. A plan may be represented in the same programming language as the code
[JS85, Rut76, Luk80] or in some other abstract representation [AL80, Let87, KLN91,
KN89, RW88, Sha81, Wil90, Har90, HN90].
Near-miss recognition of the plan suggests possible faulty locations in an almost
correct section of code. The basic idea is to match plans with the code. The location
where discrepancies arise between the best-matched plan and the code becomes the
hypothesis about fault location.
2.2.3.5 Fault localization algorithms
� Shapiro's Divide and Query algorithm [Sha83] applies a binary search heuristic
over a computation tree. A computation tree, which represents the legal com-
putations of a program, is constructed from traces of the procedure calls in the
program. In the tree, the parent node is the caller of its children nodes.

23
This approach weighs the number of procedure calls each subtree makes, then
divides a computation tree rooted at p into two subtrees of roughly equal weight.
The upper half of the original tree has p as its root, the lower half has another
node q as its root. The algorithm then queries the programmer to verify input-
output values of the procedure call at node q. If the programmer decides that
the output values at q are correct, then the algorithm will continue the search
on the upper half subtree. Otherwise, the search continues in the lower half
subtree.
This diagnostic system operates under the assumptions that if a program is cor-
rect, then all of its subprograms must be correct, and if a program is incorrect,
then one of its subprograms must be incorrect. The binary search algorithm
works well for a logic programming language, such as Prolog, because it has
no side e�ects. An execution of each procedure does not use values other than
those that pass to it and does not de�ne global values that it does not return.
The presence of side-e�ects would disable the \halve the search space" scheme.
� Shahmehri, Kamkar, and Fritzon [SKF91] adapt Shapiro's algorithm to work
with Pascal at the procedure-call level. However, it works under the assumption
that no procedure call introduces side-e�ects.
� Korel and Laski's STAD [KL88] also uses a binary search heuristic, but the
system posts a request for the programmer to verify the correctness of the ow
of control instead of the correctness of the output values. Their technique works
with a subset of Pascal at the intra-procedural level.
� Kuper's DEBUSSI [Kup89] also uses a binary search heuristic, but its break-
and-examine point is the procedure call that lies nearest to the middle of the
partial order determined by the program's data ow. If the procedure is called
correctly, then everything that precedes it by data ow can be exonerated. One
of DEBUSSI's limitations is the assumption that the program contains one bug
only.

24
� Korel's PELAS [Kor88] uses immediate reaching de�nitions of variables as its
guess on fault location. If a programmer judges that a variable has a correct
value, PELAS would not consider the statements on which correct variables
depend as possible fault locations.
2.2.4 Shortcomings in previous work in debugging
The �rst shortcoming is inadequate support to evaluate hypotheses about fault
location. The assistance that allows the programmer to observe program behavior
does not con�rm or reject a fault location. To check whether faults lie in a suspicious
program part, programmers can �x and rerun the program until they obtain correct
output [Gou75, Ves85, ADS91a]. This can lead to the problem of \�xation on the
wrong location" and can introduce more faults into the program.
The second shortcoming is that of inadequate support to formulate hypotheses
about omitted statements and predicates. Program slicing [Agr91] and heuristics
based on a combination of program slices [Pan93] can be used to identify possible
faulty statements. It is up to the programmer to recognize that a slice omits some
statements [Agr91]. An assignment statement that assigns a value to the wrong
variable might not appear in the slice, because of the absence of dependency relations
with the erroneous variables [Pan93].
A fault localization algorithm is not guaranteed to �nd the location of an omitted
statement. As the algorithm uses correctness information to reduce the search space,
the algorithm becomes inaccurate in the presence of coincidental correctness. An
example of coincidental correctness is shown below:
Subroutine F( X, Remainder)
begin
Remainder = mod( X, 10)
end

25
Suppose both X and Remainder have non-error-revealing values before and after
F () is called, the binary search algorithm would rule out F (). However, if F () is
supposed to also compute Quotient, the algorithm would have discarded the faulty
routine. Even for a fault of commission, coincidental correctness can also cause a
fault localization algorithm to be inaccurate. Suppose X is error-revealing when
F () is called, but Remainder is coincentally correct (e.g., set to zero) after F ()
returns. Korel's PELAS [Kor88] uses a data ow analysis to eliminate the statements
preceding the correct variables from the list of possible fault locations. This means
the statement that de�nes X incorrectly would have been ruled out.
It is possible to locate omitted statements when the code can be compared against
a speci�cation. Jackson's ASPECT [Jac93] uses a speci�cation that depicts depen-
dency among data to detect missing static dependency among variables in the pro-
gram. One shortcoming is that the required speci�cation may not be available. An-
other shortcoming is in the limitation of static analysis. ASPECT is not guaranteed
to detect the absence of (1) a statement to establish dynamic dependency among data
when a statement to establish static dependency is present, and (2) a statement to
establish control dependency.
The third shortcoming is inadequate support to prevent the problem of \�xation
on the wrong location." Section 1.2 describes this inadequacy in detail. There is no
experimental evidence about other debugging assistants to indicate that any assistant
can overcome this problem.
The fourth shortcoming is inadequate use of programmers' knowledge about the
failure symptoms and about the program. Debugging assistants do not dynamically
capture the programmers' expertise to enhance their capability. Although fault local-
ization algorithms use programmers' knowledge about correctness of input and output
values of a procedural call, that knowledge is not maintained for further analysis.

26
2.3 Related Work in Critic Systems
Our empirical studies (see Chapter 3) identify that a critic system can serve as an
alternative assistant to a debugging oracle. A critic system takes the user's proposed
solution and its problem as input, then produces comments on the solution as output.
The comments may suggest improvements, draw attention to the possible risks, and
indicate other alternative solutions. The purpose of the critic system is to support
the user's own decision making rather than independently suggesting a solution to
the given problem [H�ag93].
A critic system provides a cooperative problem-solving environment. This en-
vironment combines the user's knowledge with the system's analytical power and
knowledge to solve a problem. Unlike an expert system, the critic system does not
derive the solution autonomously. In medicine, an expert system may take symptoms
of the illness as input and produce a recommended treatment as output. A critic
system would take the symptoms and the physician's prescribed treatment as input.
It would then provide comments on the physician's prescribed treatment. It may also
suggest an alternative treatment that is less risky or identify a lab test that can rule
out diseases with similar symptoms.
Traditional critic systems are passive (user-invoked) and after-task [Sil92]. Such
critic systems become operational after the user arrives at a tentative solution or
decision. Some of the passive critic systems include: Miller's medical critic sys-
tem ATTENDING [Mil83], Langlotz and Shortli�e's medical critic system Oncocin
[LS83], Fischer's LispCritic [Fis87], Spickelmier and Newton's circuit designs critic
[SN88], Fickas and Nagarajan's Speci�cation critic [FN88], Zhou, Simkol, and Silver-
man's critic for antenna placement in ship design, CLEER, and [ZSS89], L�owgren
and Nordquist's user interface critic Kri/AG [LN92].
Researchers [Sil92, FM91, Mil88, Rag91] found that to improve a critic system,
it is desirable for the system to be active during the decision-making process and to
o�er unsolicited help before-, during-, and after-task. An active critic system helps

27
prevent biases before they occur, helps correct the biases after they occur, and helps
promote the use of a tool. In [Sil92], Silverman presents the results of his empirical
study that compares passive and active critic systems for a statistical problem. This
study involves over �fty statisticians and graduate students in statistics. The result
shows that, without a critic system, 82% of the participants failed to solve a bias-
prone statistical problem. With a passive and after-task critic system, 31% failed.
With an active critic system, 0% failed.
Some of the active critic systems include: Fischer's kitchen design critic KID
[FNO93], Raghavan's active decision support prototype JANUS [Rag91], Gertner's di-
agnosis/therapy plan criticTraumaTIQ [Ger93], and Silverman'sTIME [Sil91]. TIME
helps US Army personnel to write decision papers for each new piece of equipment
the Army buys.
According to H�agglund [H�ag93], existing critic systems use either an analytical
critiquing method or di�erential critiquing method. In analytical critiquing, the sys-
tem may not be capable of solving the problem, but it can analyze the proposed
solution by looking for aws. Guidelines or other standard criteria can be used to
evaluate the user's proposed solution [H�ag93, Ran93].
Fischer's LispCritic [Fis87] and Fickas and Nagarajan's Speci�cation critic [FN88]
are examples of critic systems that use the analytical critiquing. LispCritic can-
not write, but it can evaluate, a Lisp program. LispCritic analyzes a Lisp program
and suggests ways to rewrite the code to promote clarity and e�ciency. Fickas and
Nagarajan's Speci�cation critic cannot write a formal speci�cation, yet it analyzes
a petri-net-like formal speci�cation and generates sample scenarios to argue for or
against the user intention to add certain components into the speci�cation.
In di�erential critiquing, the system compares the user's proposed solution with
the solution it derives. This is useful in well-structured domains where solutions can
be evaluated according to objective principles. For example, the critic system may
compare cost and resource consumption between the two solutions [Ran93].

28
Gertner's diagnosis/therapy plan critic TraumaTIQ [Ger93] is an example of a
critic system that uses the di�erential critiquing approach. TraumaTIQ is designed
to be used in connection with TraumAID, a consultation system for multiple trauma
management. TraumTIQ comments on a physician's plan to handle multiple severe
injuries. It addresses errors in scheduling treatments, con icting procedures with
TraumAID, unidenti�ed goals (according to TraumAID) for the action ordered by
the physician, and repetition of ordered action. TraumTIQ works with incomplete
knowledge of the situation. Some diagnostic results may not have been reported yet.
Thus, its comments on the physician's current plan may change as it learns more
about the symptoms of the injuries.
Critic systems have been used in several domains in the past ten years, but not in
the debugging. This dissertation presents an active critic system for debugging that
also serve as an alternative to a debugging oracle.
2.4 Summary
This chapter presented terms used in the dissertation. Previous work in debugging
was presented. Current debugging assistants provide inadequate support to evaluate
hypothesis about fault location, inadequate support to formulate hypothesis on omit-
ted statements, inadequate support to prevent the problem of \�xation on the wrong
location," and inadequate use of programmers' knowledge of failure symptoms and of
the program. Previous work in critic systems was also presented.

29
3. EMPIRICAL STUDIES OF DEBUGGING ASSISTANTS
Pure logical thinking cannot yield us any knowledge of the empirical
world; all knowledge of reality starts from experience and ends in it.
Propositions arrived at by purely logical means are completely empty of
reality.
{ Albert Einstein
A debugging oracle can verify hypotheses about fault identities, locations, and
repairs. Our goal was to design an alternative to a debugging oracle that improved
debugging performance. The objective of this study was to identify the types of oracle-
provided assistance that could improve debugging performance. We could not test
how an automated oracle provides assistance because an automated oracle does not
yet exist. To resolve this problem, we treated the person who wrote and maintained
the program under test as an oracle. This approach allowed us to study oracle-
provided assistance without having to prede�ne di�erent types of assistance. We
could observe what help the programmers needed, what debugging problems the
programmers experienced, and what oracle-provided assistance could satisfy the needs
and overcome the problems.
Our �rst hypothesis was that the presence of appropriate information can help
programmers judge the correctness of hypothesized fault locations signi�cantly faster
or more accurately [SV92]. Information we anticipated to be helpful included program
slices and beacons, de�ned in Brooks [Bro83] as information that suggests the presence
of a particular data structure or operation in the program.
These studies did not support our �rst hypothesis. However, their results led us
to the types of oracle-provided assistance that could improve debugging performance.

30
3.1 Overview of the Studies
Three studies were conducted. They involved a total of 14 expert programmers
who debugged a C program containing over 4300 executable lines of code that in-
cluded faults of omission. In these studies, we used common experimental materials,
experimental procedures, and performance measurements. The di�erence was in the
type of assistance provided to the programmers.
3.1.1 Program
The program under test was Nu, a locally-developed Unix system administrator
program for maintaining a user database. Nu was a screen-oriented program for
adding new users, deleting old users and modifying information about existing users
on departmental hosts. Nu's C source code consisted of one header �le and 16 source
�les. Nu consisted of 167 routines. The total number of lines was approximately
6700. The total number of executable lines was 4320. Nu maintained �ve database
�les that amounted to approximately 1600 lines of data.
3.1.2 Faults
Two faults under study were faults of omission that were found and �xed during
the maintenance phase of the program Nu.1 Fault #1 was a missing initialization
statement. This fault left a pointer uninitialized, causing the program to terminate
abnormally. Fault #2 was a missing data handling task. This fault left a pointer
pointing to a copy of a database entry rather than to the original entry. When the
program freed the copy and later re-allocated the same space, that space was written
over. Ultimately, the program failed by producing wrong output.
1See Appendix A.1 (page 133) for more details.

31
3.1.3 Participants
Expert programmers in our study satis�ed six requirements. First, they had at
least six years of programming experience. Second, they had used C for at least
�ve years. Third, they had spent at least three years as graduate students in the
Department of Computer Sciences at Purdue University. Fourth, they had taken
at least three classes that required them to use the C language. Fifth, they had
previously coded C programs larger than one thousand lines. Sixth, they knew how
to use a debugger, dbx, which o�ered assistance to set break points and to trace the
program execution.
3.1.4 Procedures
Programmers were divided into groups of two. Although the types of assistance
for each group varied, the experimental procedures for all groups were the same. At
the beginning of the session, programmers received the source code listing of Nu, its
data �les, the failure description, and one error-revealing test case. Programmers ran
Nu under SunOS version 4 in the X window environment. Only one debugger, dbx,
was allowed. They were required to use tcsh, a C shell that monitors the time of day
that each commands was issued.
At the end of each hour, each programmer electronically submitted a script of
the debugging session, along with his hypotheses about fault location, identity, and
repair. The debugging session ended when a programmer �xed the fault or when
he exceeded the �ve-hour time limit. We interviewed each programmer after the
debugging session.
3.1.5 Measurements
The debugging performance measurements we used were (1) actual debugging
time, (2) estimated time taken to �nd and to �x the fault, (3) debugging speed, (4)

32
accuracy, and (5) average accuracy of the hypothesized fault location at the end of
each hour. Appendix A.2 lists the de�nitions of these measurements.
3.2 Pilot Study #1
3.2.1 The assistant
The assistant was an oracle: the Unix system administrator who maintained the
program Nu. He could answer any questions from the programmers except \What is
the fault?", \Where is the fault?", and \How can it be �xed?". We nevertheless refer
to this feature as the all-you-can-ask feature.
3.2.2 The study
We studied the programmers' abilities to �nd and �x the fault. This study com-
pared groups of programmers with and without oracle access. Eight programmers
who participated were called S1 to S8. We randomly assigned two programmers to
each fault-assistant combination. S1, S2, S3, and S4 worked with fault #1; S5, S6,
S7, and S8 worked with fault #2. Only S3, S4, S7, and S8 had oracle access.
To prevent any eavesdropping, the oracle was in the room next to the program-
mers' room. Programmers with oracle access worked in di�erent rooms from those
without access. We observed them to make sure they did not interact.
3.2.3 The results
The performance comparison is shown in Appendix A.3. Programmers who de-
bugged fault #1 debugged faster and more accurately than those who debugged fault
#2. The statistical analysis result indicates with at least 95.5% con�dence that the
fault was the source of variation in our �ve measurements.
The analysis result did not indicate that the oracle helped improve debugging
performance. The result was insu�cient to determine whether information that the

33
oracle provided helped the programmers because the programmers asked very few
questions. S3 and S4 each asked only 2-3 questions. S7 and S8 only asked 19 and 11
questions, respectively. One problem was that the oracle in this study was passive
most of the time. He provided information only after the programmer requested help.
To �nd evidence to support our original hypothesis, we decided to conduct a follow-up
study with an active oracle.
3.3 Pilot Study #2
3.3.1 The assistant
We extended the role of the oracle for Nu to allow him to take the initiative.
He could observe, question, warn, and give information without the programmers'
requests. We refer to this oracle as an active oracle. We refer to the oracle in the
previous study as a passive oracle. The oracle was still the same person, however.
3.3.2 The study
We only studied fault #2 in this study because students who debugged Nu with
fault #1 easily found and �xed it with no assistance other than dbx . We studied
two more programmers, S9 and S10. The active oracle worked with S9 and S10 on a
one-on-one basis.
To stimulate the programmer to ask more questions, the oracle sat next to the
programmer and gave a program overview and a failure overview at the beginning.
His location not only permitted him to observe the programmer's progress and take
the initiative, it also made the oracle easier to access. His overview established a
context for the programmer to ask questions. The program overview described the
general functions of Nu, the input and output, the global data variables, and the data
�les. The failure overview described an error-revealing test case, the nature of the

34
failure, and the description of other failing conditions. The oracle also went through
a sample run of an error-revealing test case.
After the oracle's overview, the session was open for questions and answers both
ways. The performance of S9 and S10 was compared with that of S5 and S6 who
received no assistance and that of S7 and S8 who received assistance from the passive
oracle.
3.3.3 The results
The active oracle succeeded in helping programmers debug twice as fast as those
with the passive oracle. The comparison of the performances of all programmers
who debugged fault #2 is shown in Appendix A.3. We used Analysis of Variance
(ANOVA) to statistically analyze these on debugging performance measurements.
ANOVA indicated with at least 96.7% con�dence that the source of di�erence in
accuracy measurements between the group with Nu's active oracle and the group
with no assistant was the use of the active oracle. The result also indicated with at
least 97.3% con�dence that the source of di�erence in speed between the group with
Nu's active oracle and the group with no assistant was the use of the active oracle.
The active oracle also increased the number of programmers' questions seven-fold.
Based on our observation, we identi�ed features of the active oracle that may have
been responsible for the improved debugging performance.
1. The con�rmation feature
To respond to a con�rmation request, the oracle indicated \yes" with reasons
why, or \no" with criticisms. To indirectly criticize, the oracle asked a pro-
grammer to justify the programmer's decision. When a programmer gave his
reasons, the oracle argued why they were wrong. In many cases, a programmer
found his own aws as he tried to explain. To directly criticize a programmer's

35
decision, the oracle explained why he was against it. Note that the oracle's rea-
son was not a proof of correctness. Rather, it gave the programmers reasonable
doubt.
2. The explanation feature
Although answers to the explanation requests varied, the answers to requests
concerning program behavior deserved attention. Because such requests were
often phrased as a \What-If" question (e.g., \What happens when (speci�ed
condition) occurs?"), the answers were both actual and hypothetical. The be-
havior was often explained in terms of the consequence of the speci�ed condi-
tions. One sample question was \What would the program do if it received the
abort command at the top-level?".
3. The observation-and-action feature
This feature helped to remedy or prevent potential problems that could a�ect
debugging performance. Observation enabled the oracle to recognize events that
called for his initiative. The action combined the use of questions and the use
of hints. We categorized the event-and-action pairs, or rules into three classes:
remedial rules, preventive rules, and promotional rules.
(a) Remedial rules
When the oracle recognized events suggesting potential problems, he took
remedial action. The events may have suggested that a programmer sus-
pected a wrong location, focused on irrelevant code, settled on a repair
with faulty side-e�ects, or misunderstood the program.
The remedy often began with a question, followed by a hint. The oracle
asked questions to con�rm his suspicion of the problem, to determine the
programmer's assumptions and justi�cations, and to enforce schemes to
overcome his �xations. The information was provided later, as the oracle
36
argued with his justi�cations, answered his questions to resolve misunder-
standings, and suggested alternatives.
(b) Preventive rules
The oracle recognized an opportunity to prevent commonly occurring prob-
lems. His preventive action was to ask a programmer to consider certain
hints.
The oracle helped prevent a programmer from reviewing part of the pro-
gram that was irrelevant to the fault and the failure. He gave an overview
of the program before a programmer began to debug it. The oracle also
helped prevent a programmer from reimplementing an existing routine. He
asked a programmer to look at a source �le �le that contained a proce-
dure that could perform the missing task. Both programmers immediately
recognized the procedure they could reuse to repair fault #2.
(c) Promotional rules
The oracle recognized the opportunity for a programmer to use certain
tools or features to improve his debugging time or accuracy. His action
was to stimulate him to use the features.
For example, when a programmer did not make any fault-related decisions
for a while, the oracle asked questions to stimulate a programmer to make
hypothetical decisions. This gave the oracle more opportunities to describe
the consequence of such decisions. Sample questions included: \What
are the possible causes of failure?", \What is the correct value of this
variable?", \How could the problem be �xed?".
The �ndings from this study did not support our �rst hypothesis. In our hy-
pothesis, we assumed that information alone provides the necessary assistance. If
this assumption were true, then the explanation and hints from the oracle would be
su�cient. Perhaps S9 and S10 performed better than S5 � S8 because they asked
more and knew more. Perhaps the location of the active oracle alone, not the oracle's

37
questions, was the factor that encouraged the programmers to ask more questions.
To resolve this uncertainty, we devised two alternatives for an active oracle and tested
them in our follow-up study.
3.4 Pilot Study #3
3.4.1 The assistants
In place of the all-you-can-ask feature, we summarized debugging information
from previous studies into a set of hints. These hints were intended to help the
programmers understand the program, formulate better fault-related decisions, and
self-criticize their decisions.
We acted as the assistant. For one group, we provided Information-only (I-only)
assistance by giving all hints simultaneously. The hints included a program overview,
a failure overview, a test data set, output statements, data abstractions of erroneous
data, a routine-level trace, a calling path, and dynamic slices of output variables.2
For another group, we provide Observation-Information-Question (OIQ) assis-
tance by giving away both hints and questions when one of the four events below was
observed. We looked for these events from the reports the programmers submitted
electronically at the end of each hour. The hints provided after each event were the
same as the hints in I-only assistance.
Event 1: A programmer entered the fault-�nding phase.
First, we gave the overview verbally. Afterward, we asked \What are the er-
roneous output variables (if any)?" and gave the statement that printed the
erroneous output. Once the programmer identi�ed the erroneous variable(s),
he received the calling paths, the dynamic slices, and the routine-level trace of
that variable(s).
2Our paper [SV93] describes these hints in more detail.

38
Event 2: A programmer suspected a wrong location.
If this event occurred after the programmer already had time to review the
hints, this event would trigger us to suggest a strategic inspection of the trace.
We made the programmer inspect the routine-level trace while we repeatedly
asked \Is this program state correct?".
Event 3: A programmer claimed that he �xed the fault.
This event would trigger us to ask \Does your �x work with other test cases?"
and to give the test data description. This question was repeated for each
combination in the description.
Event 4: A programmer identi�ed the missing task.
This event would trigger us to ask \Do you know of any existing code to �x the
problem?" and to introduce the data abstraction of the erroneous global data
that contained the reusable routine.
3.4.2 The study
We studied four more programmers: S11, S12, S13, and S14. S11 and S12 received
the OIQ assistant. S13 and S14 received the I-only assistant. All four programmers
worked with the second faulty version of Nu.
For both groups, we gave a 15-minute verbal overview �rst. For S13 and S14,
we gave all hints at once and allowed them to work on their own. For S11 and S12,
we gave the hints and asked questions about the hints gradually as we observed the
trigger events. Afterward, we surveyed the programmers on the helpfulness of the
assistance.

39
3.4.3 The results
The group that received the OIQ-assistance debugged almost as fast as the group
that received the assistance from the active oracle. The group which received the
I-only assistance performed worse than the group with no assistance.
The statistical analysis indicated with at least 96.7% con�dence that the group
with the OIQ assistance found and �xed the fault more accurately than the group
with no assistance. The analysis result also indicated with at least 96% con�dence
that the group with the OIQ assistance debugged Nu faster and located the fault
more accurately than the group with the I-only assistance.
The group with the OIQ assistance performed almost as well as the group with the
active oracle. With the OIQ assistance, the programmers took about 234 to 3
14 hours
to arrive at the right solution { about 15 - 45 minutes longer than the group with the
active oracle. Their performance di�erences were not statistically signi�cant.3
The group with the I-only assistance took longer to derive wrong solutions than
the group with no assistance. Programmers in both groups settled for solutions
which repaired the failure symptoms rather than the cause of the program failure.
As a result, the repair introduced new faulty side-e�ects. However, with the I-only
assistance, the programmers took about 312 to 4 hours { about twice as long as the
group with no assistance.
3.5 Debugging Pitfalls
We observed two major pitfalls. One was the \�xation on the wrong location"
problem; the other was the \underuse" problem. The �rst hindered the debugging
process. The second hindered the e�ectiveness of debugging assistance. This study
provided some insight as to why the problems occured.
3The term signi�cant in statistics means the p-value (produced by statistical analysis such asANOVA, contrast analysis, etc.) was less than .05. The p-value indicated the chance that a givenoutcome was a function of the technique employed rather than a result of chance. The p-value � :05means there is no more than 5% chance that the outcome might have occurred by chance alone[WL79].

40
3.5.1 The \Fixation on the wrong location" problem
Eight out of fourteen programmers experienced this problem. A review of the
debugging process and follow-up interviews revealed three causes of this problem.
The �rst cause was that the programmers with the passive oracle assistant did not
make their requests to con�rm a fault location until they spent time investigating the
code at that location. According to our follow-up interview, we asked the program-
mers why they delayed making a request con�rmation on fault location. The common
response was that they were sure they already found the fault, therefore they found
it unnecessary to request con�rmation.
The second cause was that the programmers chose a poor starting point. Pro-
grammers who did not start to debug by identifying erroneous output variables were
more likely to develop a �xation on a wrong location than programmers who did.
The third cause was that the programmers mistook the location with the failure
symptoms for the fault location and ended the search for the fault prematurely. When
the repair was made at the location that exhibited failure symptoms instead of at the
fault location, the repair was prone to create other faulty side-e�ects.
In the case of fault #2 (see Appendix A.1), the absence of the code to reset the
pointer before freeing it caused another pointer to become dangling. That dangling
pointer caused the same memory location to be reallocated and overwritten. Four
programmers found the routine that wrote over the old memory location, and con-
cluded that the routine was faulty. Their repairs masked the old failure symptoms,
but created new ones.
3.5.2 The \Underuse" problem
Programmers did not bene�t from our passive assistants { the passive oracle and
the I-only assistant { because of underuse problems. One underuse problem occurred
when programmers underused the assistants that could have help them debug. The
programmers did not really know how to use an intelligent, but passive, assistant

41
such as an oracle. They admitted they did not always know what to ask for, or
when to ask for it even when they needed help (e.g., when they were stuck at a
wrong location). Programmers with the I-only assistant did not always know how to
assimilate debugging hints. One of the programmers used only one hint and ignored
the rest.
Another underuse problem occurred when the assistant underused the knowledge
of the programmers that could have helped the assistant customize the assistance for
each programmer. The passive oracle underused the knowledge of the programmers
because he could not observe them. He would not know that the programmers mis-
understood something until they asked for help. Thus, he was unable to resolve their
misunderstandings early enough to prevent them from wasting their time.
We underused the programmer's knowledge when we provided I-only assistance.
Programmers who received the OIQ assistance had to identify erroneous output vari-
ables. In turn, we only provided hints related to the erroneous variables they identi-
�ed. Because we did not ask the programmers who received the I-only assistance to
identify erroneous output variables, we gave hints related to all output variables.
3.6 Programmers' Needs
Programmers needed and asked for help to con�rm their hypotheses. They needed,
but did not frequently ask for, help to formulate their fault-related hypotheses.
1. Need for con�rmation
Con�rmation requests constituted 86% of the total requests that programmers
who debugged fault #2 made to the oracle (see Figure 3.1). Each con�rmation
request was either a hypothesis statement or a yes-or-no question. Explanation
requests (e.g., the \what," \when," \where," \why," and \how" questions) made
up the other 14%.
One of the �rst two questions programmers asked the passive oracle was for
con�rmation of the fault location. Other questions followed after the oracle

42
rejected the location. The request to con�rm the fault-related hypotheses con-
stituted two out of three requests from programmers who debugged fault #1;
and one out of every seven requests from programmers who debugged fault #2.
We noticed that expert programmers preferred to arrive at a tentative decision
or understanding before they asked for help. This coincided with psychological
research by Lange and Harandi [LH85] which suggests that expert users prefer
to solve the problem on their own �rst before they consult an expert system.
2. Need for help to formulate fault-related hypotheses
Programmers needed help to formulate fault-related hypotheses. The percent-
age of rejected fault-related hypotheses was 40%. In comparison, the percentage
of rejected program understanding-related hypotheses was only 23%. None of
the hypotheses about correctness of program behavior and data values were
rejected.
3.7 Desirable Debugging Assistance
3.7.1 Self-assistance
As we anticipated, we observed that programmers in our studies looked for beacons
to gain understanding about the program. This result agreed with Brook's observa-
tion [Bro83]. However, the programmers did not request that information from our
assistants. Instead they used a pattern matching command in Unix, grep, to locate
the beacons. The grep command �nds the text lines in the speci�ed �les that match
the given name or expression [Pla86]. Next to dbx, grep was the most frequently
used command. This phenomenon suggested that instead of providing beacons as
assistance, a debugger could provide a pattern matching tool to look for beacons.

43
86%
14%
Confirmation Requests
Explanation Requests
Requests made to the oracle
14%
13%
73%Fault-related hypotheses
Behavior-related hypotheses
Program Understanding-related hypotheses
Confirmation Requests
23%
77%
Reject
Confirm
Program Understanding-related
100%
Behavior-related
40%
60%
Fault-related
Figure 3.1 The requests made to the active and passive oracle in pilot study #1 and#2
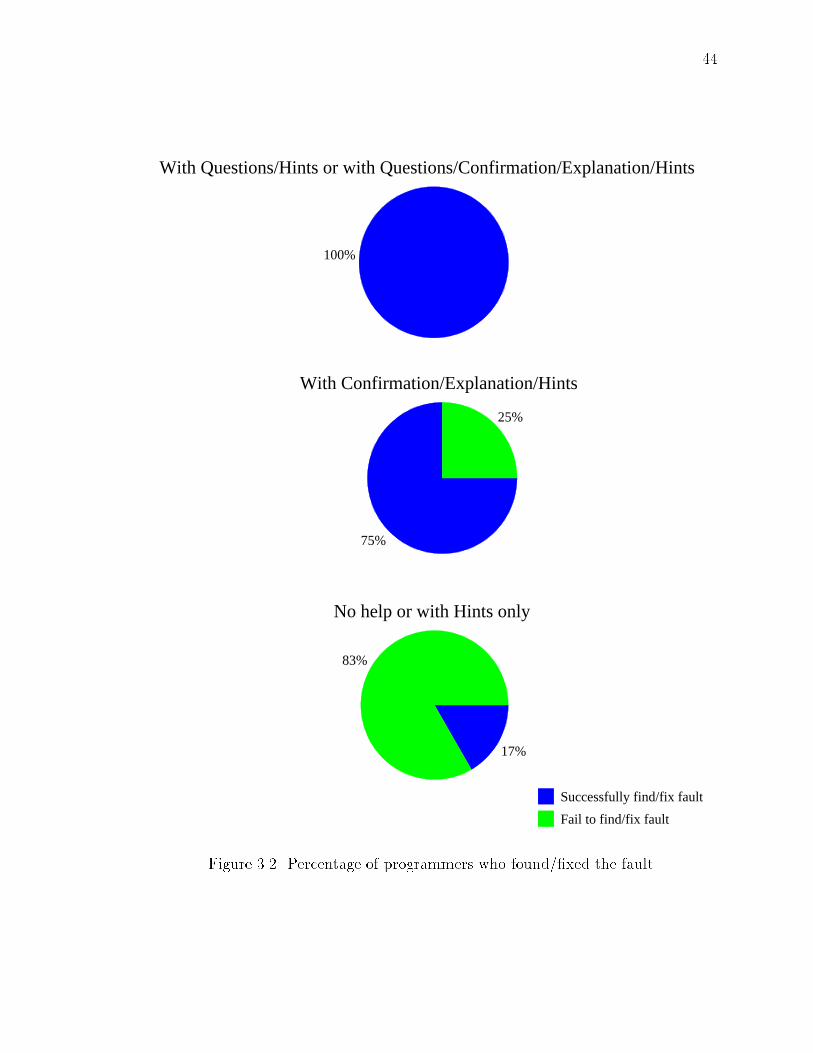
44
17%
83%
Successfully find/fix fault
Fail to find/fix fault
No help or with Hints only
75%
25%
With Confirmation/Explanation/Hints
100%
With Questions/Hints or with Questions/Confirmation/Explanation/Hints
Figure 3.2 Percentage of programmers who found/�xed the fault

45
3.7.2 Assistance from assistants under test
The two active assistants that worked were the active oracle and the OIQ assistant.
Both helped overcome the �xation and the underuse problems. When compared with
the passive oracle, the active oracle increased the number of programmers' questions
sevenfold. When compared with I-only assistance, the OIQ quadrupled the number
of hints programmers used.
3.7.2.1 Con�rmation
This feature helped con�rm or reject hypotheses. The purpose was not to prove
a hypothesis, but to present a convincing argument as to why a hypothesis was
true. To reject a hypothesis about a fault location, the oracle often used dependency
information. The common argument was that the failure did not depend on the code
at the speci�ed locations. To reject a hypothesis about a fault identity, the oracle
often explained why the failure was not the consequence of such a fault. To reject a
hypothesis about a fault repair, the oracle identi�ed the undesirable consequence and
the test conditions under which the program would fail.
3.7.2.2 Explanation
This feature accompanied the con�rmation feature, as the explanation was em-
bedded in the argument for or against the hypothesis. The explanations which the
programmers frequently requested were about the consequence of a speci�ed condition
on the program behavior.
3.7.2.3 Hints
This feature helped the programmer formulate hypotheses. According to our
survey, the following hints helped to formulate fault-related hypotheses.

46
For formulating hypotheses about fault location, the programmers indicated that
slice-related hints helped programmers most. In order of preference, these hints were
the routine-level trace, the calling path, and a dynamic slice of an erroneous output
variable. A routine-level trace could be considered as a slice through an execution
path of the program. A calling path could be considered as a routine-view of a
dynamic slice. These hints helped them narrow the search for the fault.
For formulating hypotheses about fault identity, the programmers identi�ed the
three hints that helped them most as the failure overview, the routine-level trace,
and the statement that printed the output. These hints helped enhance their under-
standing of the failure symptoms, which subsequently helped them hypothesize about
possible causes of the symptoms.
For formulating hypotheses about fault repair, three hints that helped were the
test data description, the data abstraction of erroneous data, and the routine-level
trace. Test data and the routine-level trace helped them recognize the impact of a
repair. The data abstraction of erroneous data helped them identify reusable code.
All programmers who received the hints indicated that they could not have de-
bugged as fast (if at all) without them. But while hints worked well when we posed
questions to help assimilate them, hints alone did not guarantee debugging improve-
ment, as evidenced by the performance of the I-only group.
3.7.2.4 Questions
Questions played three major roles: preventing problems, remedying problems,
and promoting the use of the assistant. They helped overcome both the \underuse"
problems and \�xation on a wrong location" problem. They also promoted the use of
an oracle (by stimulating the programmers to ask more) and the use of the hints in the
OIQ assistant. As shown in Figure 3.2, in the groups where the assistant could take
the initiative by questioning the programmers during the debugging process, 100% of
the programmers correctly identi�ed the fault location. In comparison, in the group
that received no help in evaluating hypothesized fault locations, only 17% of the

47
programmers succeeded. In the groups of programmers provided with con�rmation,
explanation, and hints from a passive oracle, 75% of the programmers succeeded.
This result is strikingly similar to Silverman's results [Sil92] which support the need
for an active assistant (see Chapter 2).
The roles of questions varied according to the event that triggered the assistant
to pose the questions. Three types of questions that helped overcome debugging
problems were as follows.
1. Remedial questions
We observed two types of questions that remedied the \�xation on a wrong
location" problem. One was the request for the programmer to justify why he
hypothesized at a location that did not a�ect the program failure. Another
was the request for the programmer to evaluate the value of erroneous variables
in the execution trace prior to the execution of the code at his hypothesized
location.
These questions helped remedy the �xation problem in the following ways. First,
when the programmer could not justify why he examined a particular location,
the oracle had an opportunity to explain why the location he suspected could
not a�ect the program failure. Second, when the programmer realized that a
variable value was erroneous before the execution of the routine he suspected,
he overcame his �xation and looked elsewhere.
2. Preventive questions
We observed that questions pertaining to the variables or routines that exhibited
failure symptoms helped prevent the \�xation on the wrong location" problem.
When programmers asked a series of irrelevant questions, the oracle asked a
programmer to explain a routine or a variable relevant to the failure. Sample
questions included: \What is the role of the (speci�ed variable)?", \What hap-
pens when the (speci�ed condition) occurs?", and \What does this routine do?".
Unable to reply, the programmer requested an explanation. In most cases, the

48
oracle's questions were su�cient to shift the programmer's attention. To end a
series of irrelevant questions in one case, the oracle also gave as a hint a calling
path to the procedure that used an erroneous variable.
In the OIQ assistant, we prevented the problem by asking programmers to iden-
tify erroneous output variables before they started to debug. We gave overview
hints and the output statement to help them answer. Based on the erroneous
variable identi�ed, we gave the appropriate routine-level trace, a calling path,
and a dynamic slice.
3. Promotional questions
We observed that questions which promoted the formulation of fault-related hy-
potheses and the use of hints helped overcome the \underuse" problems. When
programmers did not ask for help, the oracle asked them to propose fault-related
hypotheses with questions such as: \What could possibly cause this failure?",
\What is the correct value of the variable?", and \How could the problem be
�xed?". This gave the oracle the chance to evaluate the programmer's hy-
pothesis and eliminate some misunderstanding. In the OIQ assistant, questions
promoted the use of hints. They promoted the use of the data abstraction hint
and the test data set. Although both hints were used by the oracle to help
programmers �nd the right repair, they were ignored by programmers with the
I-only assistance. We successfully promoted use of the data abstraction hint
by asking whether a programmer knew of existing code that would repair the
missing task he identi�ed. We successfully promoted use of the test data set by
asking whether their repair worked with other test cases.
3.7.3 Assistance for debugging fault of omission
Programmers in our study suggested that the fault location for omitted statements
was the location where they added the statements. However, there could be more

49
than one place in a procedure where statements could be added to repair the same
fault. Neither the location nor the repair for a fault of omission were unique.
For fault #1, the use of dbx and grep commands were su�cient to locate the
routine that was missing an initialization statement. Dbx's where command iden-
ti�ed routines and source �les in the calling path leading to the point when the
program abnormally terminated. Dbx's print command revealed an unde�ned value
of pointer pde. The grep command on pde and other keywords in �les speci�ed by
the where command assisted in locating the routine that should have initialized pde.
As programmers traced through this routine, they realized that none of the existing
initialization statements for pde were executed. Hence, they knew they found the
fault location.
Numerous repairs for fault #1 included adding the initialization statement for pde
at the beginning of the routine, adding code to check for null pointer before passing
pde to a routine, etc. The code could also be restructured to allow the ow to reach
an existing initialization statement for pde.
For fault #2, the assistants helped programmers to locate fault #2 by repeatedly
asking them to verify the correctness of the erroneous global variable pde in a structure
home dir list in the routine-level trace. The question led to the location below where
the value of the variable pde was �rst found erroneous.
568: delete home dir( start pde, NULL);
569: free pde(pde);
The memory location being freed at line 569 was also pointed to by global pde in
a structure home dir list. Before the execution of the statement at line 569, pde in
home dir list was correctly pointed to a memory location. After the statement at line
569 executed, pde in home dir list became a dangling pointer. Once the programmer
recognized that the same pointer changed its status from correct to erroneous because
its value was not reset, he realized that code to reset pde in home dir list was missing
in between line 568 and line 569. In short, he recognized a symptom of omitted code,

50
which was the value of the variable was not changed, but its status changed from a
correct value to an erroneous value.
Numerous repairs for fault #2 included adding code to reset the pointer, or adding
a calling statement to change home dir() which handles this task. The data abstrac-
tion hint, which encapsulated the routines that operated on the record to which pde
points, helped a programmer �nd the right repair. However, this hint alone was not
su�cient. It only worked when the assistant also asked whether the programmer
knew about existing code to handle the task.
3.8 Summary
The results suggested a more direct approach to provide alternative support for a
debugging oracle. The oracle in this study rejected a hypothesis about a fault location
by arguing that the failure did not depend on the code at the speci�ed location. Thus,
knowledge of program failure and dependency analysis could be used to con�rm/reject
a hypothesis about fault location.
Our results did not support our �rst hypothesis which stated that the presence
of appropriate information can help programmers judge the correctness status of
hypothesized fault locations signi�cantly faster or more accurately. Providing more
information alone was inadequate to increase the speed of the debugging process.
Available information was useless when the programmers did not ask for it, did not
know what to ask for, or did not know how to assimilate it.
Instead, our results indicated that an active debugging assistant is e�ective. Four
types of desirable assistance are con�rmation, explanation, hints, and questions.
Questions play three roles: (1) remedy problems, (2) prevent problems, and (3) pro-
mote the use of the debugging assistant. To support these roles, the assistant has to
know which questions to pose and when to pose them.
We observed two major problems to remedy and to prevent. They were the
\�xation on a wrong location" and the \underuse" problems. To overcome these

51
problems, both the assistant and the programmer could take the initiative. The
assistant could improve its e�ectiveness by learning what the programmer knows and
customizing its assistance to augment that knowledge.
The next chapter describes the types of systems that match the desirable charac-
teristics of a debugging assistant. We design a new debugging assistant, a debugging
critic, on the basis of these results.

52
4. DEBUGGING CRITIC
critic n. [One who makes adverse comments] fault�nder
{ Webster's New World Thesaurus
An alternative to a debugging oracle is an assistant that answers the question \Is
it conclusive that the statement at location L contains the fault that was manifested
under the given test case t?" One approach to answer this question is to check all
statement occurrences against a speci�cation. Because a line-by-line speci�cation is
usually unavailable, this approach is infeasible.
Our empirical studies suggest an alternative approach. Given knowledge about
how the program fails and a hypothesis about fault location, the assistant determines
whether the statement at the given location causes the failure. The system that takes
a problem and its tentative solution as input and produces comments on the solution
as output is classi�ed as a critic system.1
This chapter presents an overview of our debugging critic, its underlying sup-
ports, and its approaches to evaluate and formulate hypotheses about fault locations.
A sample session with a debugging critic is also presented as an illustration. The
implementation of a prototype of a debugging critic is presented in Chapter 5.
4.1 Overview of the Debugging Critic
A debugging critic is a system that takes knowledge about how the program fails
and a fault-related hypothesis as input, then produces a con�rmation, a rejection,
1See Chapter 2 for more details.

53
or an argument why the hypothesis may or may not hold as output. A fault-related
hypothesis is a hypothesis about fault location, fault identity, or a fault repair.
4.1.1 Functions of a debugging critic
Our debugging critic works with hypotheses about fault location. It uses the
di�erential critiquing approach,2 which means our critic derives its own hypotheses
from the given failure symptoms, compares the programmers' hypotheses with its own,
and comments on the di�erences. Therefore, our debugging critic has two primary
functions:
1. To evaluate a hypothesis about a fault location, and
2. To formulate hypotheses about fault location.
As a debugging assistant, our debugging critic should help improve debugging
speed. Thus, its secondary function is to help avoid the \�xation on the wrong
location" and \underuse" problems.
Our debugging critic can function with an incomplete knowledge of failure symp-
toms. It does not require knowledge of all the erroneous variables and all the erroneous
control ow to support its functions. As it acquires more knowledge about failure
symptoms, it can formulate more accurate hypotheses about fault locations.
4.1.2 Design of a debugging critic
A debugging critic can be designed as a passive assistant or as an active assistant.
If a debugging critic is passive, then it may take as input an error-revealing test case
t, failure symptoms, and a hypothesized fault location L. It may (1) con�rm L as
a fault location, (2) reject L, or (3) explain the conditions under which L may or
may not contain a statement with a manifested fault. If the debugging critic cannot
2See Chapter 2 for de�nition.

54
con�rm loc, it formulates an alternative hypothesis about a fault location and hints
that location to the programmer.
If a debugging critic is active, it can also take the initiative. The use of questions
is the key to making a debugging critic active. The critic's questions can be designed
to prevent biases before they occur, help correct the biases after they occur, and
promote tool use. Bias in debugging occurs when the programmer develops a �xation
on a wrong location. Thus an active debugging assistant may help avoid both the
\�xation on the wrong location" and \underuse" problems. Because our studies (see
Section 3.7) showed that an active assistant improved debugging performance, but a
passive assistant did not, we chose an active critic.
Our active debugging critic is designed to provide a cooperative problem-solving
environment. This environment features con�rmation, explanation, hints, questions,
and a pattern matching tool.
Con�rmation
In order to con�rm a hypothesis about a fault location, our debugging critic
evaluates an execution occurrence of code at L to determine whether the occur-
rence reveals a manifestation of a fault. Characteristics of such an occurrence
are de�ned in Section 4.2.3.1 and Section 4.2.3.2.
To reduce the number of occurrences to evaluate, our debugging critic analyzes
failure symptoms to de�ne and to maintain search spaces for possible occur-
rences that could have caused the failure symptoms. These search spaces are
de�ned in Section 4.3.3.
Hints
When our debugging critic cannot con�rm that a manifested fault is at the
hypothesized location, it can identify the code whose occurrences likely cause
one of the known failure symptoms. To identify on which statement occurrence
a symptom depends, our critic uses the dependency analysis (de�ned in Section
4.2.2) to analyze the failure symptoms (de�ned in Section 4.2.1).

55
Explanation
When our debugging critic cannot con�rm that the fault is manifested in the
evaluated occurrence, it explains whether unevaluated occurrences of the code
at L can possibly cause the known failure symptoms.
Questions
Our debugging critic poses questions that can help evaluate a hypothesis as
well as avoid the \�xation on the wrong location" and \underuse" problems.
Questions include:
Acquire knowledge about failure symptoms
Instead of requiring the programmer to learn a special format to describe
failure symptoms, our debugging critic uses questions to incrementally ac-
quire knowledge about speci�c failure symptoms. The internal representa-
tion for failure symptoms can be derived from the programmer's answers.
Evaluate a statement at a hypothesized fault location
Questions to evaluate a statement and its occurrences are referred to
as evaluation questions. The replies to evaluation questions determine
whether a statement occurrence is fault-manifesting, new failure symp-
toms are found, or old symptoms should be updated.
Prevent the \�xation on the wrong location" problem
To encourage the programmer to inspect failure symptoms in the output
�rst, the critic asks the programmer to evaluate the output statements at
the beginning of a debugging session.
Remedy the \�xation on the wrong location" problem
If a programmer suspects a statement that does not execute in the search
space, our debugging critic uses questions and explanations to remedy
the problem. For example, suppose the hypothesis is about a location
L that contains an unexecuted assignment statement in a static slice of
56
an erroneous variable var. Our debugging critic poses the question \The
statement at L is not executed by this test case. Should it be? If so, it could
have a�ected the value of an erroneous variable var," before it rejects L
and recommends an alternative location.
Prevent the \Underuse" problem
To prevent the assistant from underusing the programmer's knowledge, our
debugging critic acquires failure symptoms via evaluation questions. To
prevent the programmer from underusing our debugging critic, our debug-
ging critic promotes its usage with questions. These questions are asked
when (1) our debugging critic's evaluation result does not yet identify the
fault location or (2) when the programmer does not formulate a hypothe-
sis for our debugging critic to evaluate within a prespeci�ed time period.
Examples of promotional questions are: \Would you like to guess again?",
\Do you wish to continue evaluating line 10?", \Would you like me to make
another suggestion?", \Would you like to examine my suggested location?
I can automatically set break points for you."
To communicate with a programmer, our debugging critic has access to a
dialogue-base which contains our debugging critic's comment templates, ques-
tion templates, and actions to be taken for each answer. Customized comments
and questions can be generated from the template.
A pattern matching tool
This tool is o�ered to promote the use of the programmer's expertise in fault
localization. The programmer can use this tool to look for patterns or beacons
that, according to his expertise, may be associated with the fault location.
The conceptual model of our debugging critic, with components discussed in this
section, is shown in Figure 4.1.

57
Debugging
Critic
fault locationGuess on
Questions
Answers
Evaluation Resultfor the guess location
An error-revealing test case
Failure
Symptoms
Search
Spaces
for Fault
Dialogue
base Program
Figure 4.1 A concept model for a debugging critic

58
4.1.3 Scope
Our debugging critic evaluates �ve types of statements: (1) simple assignment,
(2) procedure call, (3) predicate, (4) input, and (5) output. The line number is used
to denote a statement location. A procedure name is used to denote a location with
omitted statements. We assume a statement does not have a function call \nested"
in its expression that can cause side-e�ects.
Our debugging critic operates under the assumption that only one fault is mani-
fested with respect to a given test case. The program itself can contain multiple faults.
An omission of multiple statements is treated as one fault if the missing statements
are supposed to handle the single task of de�ning one variable.
Our debugging critic can recognize a statement with either a fault of commission
or a fault of omission (e.g., missing dependency statement). Depending on the pro-
grammer's replies to our debugging critic's questions, an incomplete predicate may
be recognized as either a fault of commission or a fault of omission. Our debugging
critic recognizes the statements that are placed in the incorrect sequence as either
faulty or extraneous statements.
Our debugging critic formulates an alternative fault location hypothesis to help
locate a manifested fault of omission, if any. The critic can sometimes identify whether
the missing statements should (1) de�ne a value (e.g., simple assignment, procedure
call, and output statements), (2) allow the control ow to reach a location (e.g.,
procedure call and predicate statements), (3) block the control ow to a location
(e.g., predicate statements), and (4) produce the output.
4.2 The Concept Underlying a Debugging Critic
The key to a debugging critic's operation is its capability to recognize when an
execution occurrence of the code at L reveals the manifestation of a fault at L. We

59
refer to such an execution occurrence as the fault-manifesting occurrence. We iden-
tify two basic characteristics of a fault-manifesting occurrence. First, the execution
occurrence represents a violation of a program behavior speci�cation. It may carry
out a disallowed state transition or omit a state transition. Second, such a violation
is not a consequence of a previous error-revealing state.
In general, the problem of evaluating a statement at a hypothesized fault location
L is the problem of �nding an occurrence of a statement at L whose output state is
error-revealing, but not as a consequence of an error-revealing input state (according
to the programmer). If such an occurrence is found, the hypothesis that L is the fault
location is con�rmed.
If a fault-manifesting occurrence is not found because an input state is error-
revealing, the debugging critic records the characteristics of the violation of a program
behavior speci�cation. The violation is described as either erroneous variables or
evidence of erroneous ow of control. Both are referred to collectively as failure
symptoms. To formulate a hypothesis about a fault location, we de�ne an execution
path slicing method to �nd statement occurrences that can cause a given failure
symptom. The absence of these occurrences indicates the presence of a manifested
fault of omission.
This section presents knowledge representation for failure symptoms and the ex-
ecution path slicing method. The notations for both are used in describing speci�c
characteristics of fault-manifesting occurrence when either the fault of commission or
fault of omission manifests itself.
4.2.1 Knowledge representation for failure symptoms
We de�ne failure symptoms,Symptoms(P; t), as a collection of erroneous variables
and erroneous ow of control3 in a program P when it executes an error-revealing
3This is not a claim that the symptoms only appear on erroneous variables and ow of control.

60
test case t.4 Each symptom is represented as a triple: (g; �tc;e; errcond), where g is a
state function,5 �tc;e is a path to search for an erroneous transition on g, and errcond
describes the erroneous condition associated with transition on g in �c;et .
Lamport's state function allows us to use g to identify either a variable or a
program control point (pc). Thus, we can uniformly represent both the erroneous
variable and the erroneous control ow.
The erroneous path �tc;e limits the path to search for an immediate cause of the
failure symptom. If g is a variable, the value of g is non-error-revealing at step c but is
error-revealing at step e. If g is pc, then the ow of control reaches a location at step c
properly, but the ow of control in �c;et is erroneous. A special case c = e can identify
the exact location of an omitted statement. This case occurs when g is de�ned with
a non-error-revealing value in the transition prior to state sc, but when the value of
g from state sc is used by the subsequent transition, the value is considered to be
error-revealing. In this case, a fault of omission is located between the statement
whose output state is sc and the statement whose input state is sc.
Note that the inclusion of an erroneous path �tc;e does not imply that the critic
system must store the execution sequence from step c to e for each symptom. It can
uniquely identify this erroneous path by step c, step e, and test case t.
The erroneous condition for �c;et is de�ned by a predicate state transition func-
tion. We de�ne a predicate state transition function as a function that maps a state
transition to a boolean value. It may indicate whether a transition on g in �c;et is
disallowed or is omitted.
The failure symptoms used by our debugging critic are listed below. This set is
su�cient to support our debugging critic. We do not claim that this set is complete.
If a detailed speci�cation is available, more detailed and application-speci�c failure
symptoms can always be de�ned.
4Note that we de�ne failure symptoms according to a program P and test case t. This is possibleunder the assumption that an execution sequence �t is �nite and deterministic. If the execution isnon-deterministic, �t should be used instead.
5See Chapter 2 for de�nition.

61
(var; �tc;e; erroneous(var))
This symptom describes an erroneous variable var that is non-error-revealing at
step c, but the value of var changes and becomes error-revealing at step e. The
change of value of var means the dynamic reaching de�nition of var executes
in �c;et .
(var; �tc;e; unchange(var))
This symptom describes an erroneous variable var that is non-error-revealing
at step c, but the unchanged value of var becomes error-revealing at step e.
The value of var does not change when the dynamic reaching de�nition of var
does not execute in �c;et .
(var; �tc;e; undefine(var))
This symptom describes an erroneous variable var that is error-revealing be-
cause its value is unde�ned at the time var is used at step e. The value of var
is unde�ned when var at step e has no dynamic reaching de�nition.
(pc; �tc;e; reach(loc))
This symptomdescribes the ow of control that reaches a location loc by mistake
at step e. It also indicates that the ow properly reaches a location at step c.
(pc; �tc;e; unreach(loc))
This symptom describes the ow of control that does not reach a location loc
in �c;et . It also indicates that the ow properly reaches a location at step c.
(pc; �tc;e;missAction(pattern))
This symptom describes the ow of control in �c;et that does not reach a state-
ment that matches pattern. The pattern is a regular expression pattern. It also
indicates that the ow properly reaches a location at step c.

62
The unreached location symptom cannot be used to describe this symptom
because it is possible that the statement that matches pattern is missing from
the program.
Our debugging critic derives failure symptoms from the programmer's answers
to its questions about program states. The only pattern de�ned by our debugging
critic is a regular expression pattern to match an output statement in a speci�c
programming language. A variety of patterns can be speci�ed if an implementation
of a debugging critic allows a programmer to de�ne failure symptoms directly.
4.2.2 Execution path slicing
We de�ne execution path slicing to identify which statement occurrences may
have caused one (or all) of the known failure symptoms. Unlike program slicing that
identi�es statements on which a variable or a statement depends, execution path
slicing identi�es statement occurrences on which a given variable or control point at
the given program state depend.
This section describes two classes of execution path slices: dynamic path slices and
static path slices. Dynamic path slices are used in producing hints and recognizing
omission-fault-manifesting occurrences. Static path slices are used in de�ning search
spaces for a fault-manifesting occurrence.
4.2.2.1 Dynamic analysis for path slicing
Dynamic path slices are composed of statement occurrences that actually a�ect
the value of a variable or a control point at a given program state. A failure symp-
tom, (g; �ti;j; errcond) 2 Symptoms(P; t), contains the necessary input to compute
dynamic path slices. For an erroneous variable, they are computed with respect to a
program P, a test case t, execution step j, and a variable g. For an erroneous control
point pc, they are computed with respect to a program P, a test case t, an erroneous
path �ti;j, and a location loc (embedded in errcond).

63
We adapt Agrawal's dynamic slicing methods [Agr91] to compute dynamic path
slicing instead of de�ning algorithms for dynamic path slicing from scratch. Agrawal's
dynamic slice is computed by traversing a history graph backwards from the current
execution step. A history graph is created and updated as the program executes.
Nodes in the history graph are occurrences of nodes in the program dependency
graph, each of which is associated with either an assignment statement or a predicate
expression. Under the assumption that the program terminates, the history graph
has a �nite number of nodes, though its size is unbounded.
To compute an execution path slice based on a given failure symptom, our critic
has to reconstruct the history graph up to the state sj when the failure symptom is
observed. As the history graph is constructed, our critic records an execution step
with each history node. Thus, when Agrawal's algorithms are used to traverse the
graph, the resulting slice contains the statement occurrences.
With the exception of dynamic control path slice, Agrawal's algorithm can be used
in de�ning dynamic path slices. A dynamic program path slice includes occurrences
of statements in the dynamic slice of variable g when the program execution reaches
step j. A dynamic reaching de�nition occurrence is the occurrence of a dynamic
reaching de�nition of var at the location reached by step j. A dynamic data path
slice includes occurrences of statements in the dynamic slice of variable g when the
program execution reaches step j.
To de�ne dynamic control path slices, extensions to the computation and semantics
of Agrawal's control slice are required. Agrawal's control slice includes predicates
enclosing a location in one procedure. Agrawal argues that a static and dynamic
control slice are the same because
: : : unlike reaching de�nitions, a statement always has at most one pred-
icate immediately enclosing it. No narrowing of enclosing predicates can
occur at run time. Thus the control slice with respect to a given location
remains the same in both static and dynamic cases. If control incorrectly

64
reaches a statement during program execution, we must examine all pred-
icates enclosing the statement; if on the other hand, a desired statement
is not reached during program execution, we must still examine the same
set of predicates [Agr91].
We dispute this reasoning. First, fewer predicates need to be examined if the con-
trol ow does not reach a location. When a failure symptom indicates that a location
is reached in error, predicates that allow the ow to a given location should be exam-
ined. When a failure symptom indicates that a location loc is not reached in error,
the predicate that blocks the control ow to loc should be examined. The unexecuted
predicates nested under the blocking predicate cannot contain a manifested fault, so
they do not need to be examined. Suppose a procedure R() encloses a location loc.
If the code at loc is not reached because R() has not been called, predicates enclosing
loc in R() are not the ones that block the control ow to loc. Therefore, they do not
need to be examined.
Second, if a control slice is an interprocedural slice, the calling statement, not only
the predicate, can direct the ow of control. If loc is not enclosed by any predicate
in R(), the statement that allows the ow to reach it is the calling statement to R().
As there can be more than one calling statement to R(), there can be more than one
dynamic control slice to loc. Therefore, the static and dynamic control slices are not
identical.
We extend Agrawal's control slice in two ways. First, we extend it into an inter-
procedural control slice. This extension includes procedure call statements and their
enclosing predicates on the path to a given location. Second, we extend its semantics
to distinguish between predicates and statements that direct control ow to reach a
given location (steerers) and predicates that block the control ow to a given location
(blockers). Dynamic control path slices for steerers and blockers are listed below.
De�nition: A dynamic steerers slice, DynSteerer(P; t; loc; step), includes occur-
rences in �0;stept of (1) predicates enclosing loc, (2) procedure call statements in

65
the dynamic calling path up to step step, and (3) predicates enclosing each call-
ing statement in the calling path. A dynamic calling path to step step includes
the transitive closure of procedure call statements to R() that execute in �0;jt ,
where R() is a procedure that executes at step step. 2
De�nition: A dynamic blocker slice,DynBlocker(P; t; loc; i; j), includes occurrences
of predicates that block the ow of control to a statement at loc on �i;jt .
� If the statement at loc executes in �i;jt , then the dynamic blocker slice is
null.
� If the statement at loc does not execute, but the procedure R() that en-
closed loc executes in �i;jt , then dynamic blocker slice includes at most
one unique blocking occurrence, which is the occurrence of a predicate that
blocks the ow to loc.
Let C be a set of predicates in Agrawal's control slice6 for loc. The exe-
cution of any predicate C can determine whether the ow will reach loc.
When an occurrence of a predicate in C allows the ow to reach another
predicate in C in �i;jt , it still is possible that the newly reached predicate
would allow the ow to reach loc. Thus, the blocking occurrence of loc in
�i;jt is the occurrence of a predicate in C that executes last in �i;jt .
� If the procedure R() that encloses loc does not execute in �i;jt , then the
dynamic blocker slice contains predicate occurrences that block the pro-
cedure calls that could have lead the control ow to R(). These calling
statements are in the static calling path to R(), and do not execute in �i;jt .
A static calling path to a procedure R() is the transitive closure of calling
statements to R(). 2
Example: Suppose the program in Figure 4.2 executes test case #3: 1 2 3. The exe-
cution sequence is 4(1;2), 5(2;3), 6(3;4), and 8(4;$). The statement to computeRemainder
6See de�nition in Chapter 2, Section 2.1.5.

66
at line 20 is not reached. In this case, the dynamic blocker of line 20 contains an
execution occurrence 6(3;4) of a statement if (A > B) at line 6.
Example: Suppose the program in Figure 4.2 executes test case #2: 1 �1 0. The
execution sequence is 4(1;2), 5(2;3), 6(3;4), 7(4;5), 13(5;6), 14(6;7), 15(7;8), 20(8;9), 16(9;10),
and 8(10;$). The dynamic steerers to the statement to compute Remainder at line 20
include the occurrences of the statements below.
6: if (A > B) occurrence: 6(3;4)
7: G(X) occurrence: 7(4;5)
15: F(X,Remainder) occurrence: 15(7;8)
In both examples, Agrawal's control slice for line 20 would be null.
4.2.2.2 Static analysis for path slicing
Static path slices are composed of statement occurrences that may a�ect the value
of a variable at a given location. They are computed with respect to a program P, a
test case t, an execution step step, a variable var, and a location loc.
A static program path slice includes occurrences of statements in Agrawal's static
program slice in �0;stept . Static reaching de�nition occurrences are occurrences of
static reaching de�nitions of var at loc that execute in �0;stept . A static data path slice
includes occurrences of statements in a static data slice of var at loc that execute in
�0;stept .
A static control path slice is computed the same way as the dynamic steerers slice,
except the calling statements are from a static calling path instead of a dynamic calling
path. A static blockers slice is a static control path slice minus the occurrences of the
calling statements.

67
4.2.3 Characteristics of fault-manifesting occurrences
4.2.3.1 Commission-fault-manifesting occurrence
If an occurrence L(in;out) is a commission-fault-manifesting occurrence of the code
at L, then the transition from sin to sout is disallowed and this transition does not
take place as a consequence of a previous error-revealing state.
Case C1: The code at L contains a manifested fault of commission.
L(in;out) represents a disallowed transition because it produces as output an
error-revealing value. The output values at sout are error-revealing if (1) they
cause the control ow to reach some other location in error, (2) variable values
de�ned during the execution of code at L are error-revealing at step out, or (3)
program output is erroneous.
This disallowed transition is not a consequence of a previous error-revealing
state when the code at L takes as input non-error-revealing values in sin. The
input values at sin are non-error-revealing if (1) the control ow properly reaches
loc at step in and (2) the variable values used during the execution of code at
L are non-error-revealing at step in.
Commission-error-revealing occurrence L(in;out) for types of statements our de-
bugging critic evaluated are described as follows.
� A simple assignment statement
There is a symptom (var; �tin;out; erroneous(var)) where var is the variable
to which the statement assigned value. Values in state sin that are used
in de�ning var in state sout are non-error-revealing. The control ow also
properly reached the statement at step in.
� An input statement
There is a symptom (var; �tin;out; erroneous(var)) where var is an input
variable. The control ow properly reached the statement at step in.

68
� A procedure call
There is a symptom (var; �tin;out; erroneous(var)) where var is the formal
parameter of the procedure being called. The corresponding actual pa-
rameter used non-error-revealing values in its expression. The control ow
also properly reached the statement at step in.
� A predicate statement
If the predicate evaluates to true instead of false, then there is a symptom
(pc; �tin;out; reach(loc)) where loc is the location of the statement to be
executed next. If the predicate evaluates to false instead of true, then
there is a symptom (pc; �tin;out; unreach(loc)) where loc is the location
that would be reached had the predicate evaluates to true.
In both cases, values in state sin that are used in the predicate are non-
error-revealing. The control ow also properly reached the statement at
step in.
� An output statement
The output at step out is erroneous.7 Values in state sin that are used
in the output statement are non-error-revealing. The control ow also
properly reached the statement at step in.
Case C2: The code at L is extraneous.
When a statement is extraneous, its execution always causes a disallowed tran-
sition. This disallowed transition is not a consequence of a previous error-
revealing state when (1) no statement directs the ow of control to L by mistake,
and (2) the omission of the predicate to block control ow to L is proper.
More precisely, an execution occurrence L(in;out) of an extraneous statement is
commission-fault-manifesting when
7We did not de�ne a failure symptom for erroneous output because the output value is not avalue in a program state (in our de�nition). If the output statement contains the manifested fault,the fault location can be con�rmed without having to store the failure symptom. If the outputstatement produces erroneous output because it uses an error-revealing output variable, then thefailure symptom for an output variable is added instead.

69
� (pc; �t0;in; reach(L)) is in Symptoms(P; t),
� DynSteerer(P; t;L; in) is null or the programmer decides that steerers to
L do not cause any erroneous ow of control, and
� the programmer decides that L is not supposed to be enclosed by any
predicate.
Note that if the programmer decides that an extraneous statement is properly
reached, then the fault manifests itself the same way as described in Case C1.
Example: Suppose in the program in �gure 4.2 the read statement at line 4:
read(A;B;X) should not have read in the value for X. When the program executes
test case #1: 10 5 30, the execution occurrence 4(1;2) (reads: an occurrence of a
statement at line 4 which is reached at step 1 and exits at step 2) maps unde�ned
values for A;B;X to 10, 5, 30. This occurrence is commission-fault-manifesting if the
programmer decides that (1) the control ow reached line 4 properly at step 1, (2)
no error-revealing value is used at step 1, and (3) the value of X is error-revealing at
step 2.
Example: Suppose in the program in �gure 4.2 the read statement is correct, but
the statement at line 5: X = A � B is extraneous. The execution occurrence 5(2;3)
is commission-fault-manifesting if the programmer decides that (1) the control ow
reached X = A � B at step 2 by mistake and (2) X = A � B is not supposed to be
enclosed by a predicate.
4.2.3.2 Omission-fault-manifesting occurrence
If an occurrence L(in;out) is an omission-fault-manifesting occurrence of the code
at L, then the execution from sin to sout omits a state transition, but not as a con-
sequence of a previous error-revealing state. An omitted transition is a consequence
of a previous error-revealing state when (1) the ow reached a location at step in
improperly, or (2) the code to carry out the transition exists, but an execution of
some statements blocks the control ow to the code.

70
main()
begin
Integer A, B, X
read( A, B, X)
X = A * B
if (A > B)
G( X)
end
Subroutine G( X )
Subroutine F( X )
begin
Remainder = MOD( X, 10)
end
begin
Integer Remainder, Quotient
Remainder = 0
Quotient = 0
F( X, Remainder)
print( Remainder, Quotient)
end
1:
2:
3:
4:
5:
6:
8:
7:
9:
16:
17:
18:
19:
20:
21:
10:
11:
12:
13:
14:
15:
5
6
7
9
8
5
6
7
9
8
test case #1 test case #2
execution steps
test case #3
10 5 30 1 -1 0 1 2 3line statements
1
2
3
4
1
2
3
4
1
2
3
410 10
Figure 4.2 A sample faulty program (in a psuedo-language)
71
Conversely, an omitted transition is not a consequence of a previous error-revealing
state when the ow reaches a location at step in properly, and either (a) the code
to carry out the transition does not exist, or (b) the code to carry out the transition
exists, but none of the statements that execute between step in and step out block
the control ow to that code. Note that if none of the statements that execute
between step in and step out block the control ow to such code, then either condition
(a) or (b) would be true (a missing statement has no blocker). Thus, the absence
of blocking statement occurrences can indicate the presence of an omission-fault-
manifesting occurrence.
We de�ne four cases of omission-fault-manifesting occurrences, L(in;out), as follows.
Case O1: Omitted a statement to assign value to variable var
L is the location of the code that omits an input statement, a simple assignment
statement, a variable var in an input statement, or an argument in a procedure
call to de�ne a formal parameter var. L(in;out) omits a transition to change a
value of var, but not as a consequence of a previous error-revealing state when
a static reaching de�nition of var at sout (a) does not exist, or (b) exists but
the statement that can block the ow to it does not execute in �in;outt .
More precisely, L(in;out) is omission-fault-manifesting when
� (var; �tin;out; undefine(var)) or (var; �tin;out; unchange(var)) is in
Symptoms( P; t), and
�Slocj2L
0 DynBlocker( P; t; locj ; in; out) is null, where L0 consists of loca-
tions of static reaching de�nitions of var at loc and loc is the location
reached at step out.
Case O2: Omitted a procedure call
L is the location of the code that omits a procedure call. L(in;out) omits a
transition to change the value of pc to loc. This means the control ow does not
reach the procedure R() enclosing location loc between step in and step out.

72
This omitted transition is not a consequence of a previous error-revealing state
when the control ow properly reached a location at step in, and procedure call
statements that allow the ow to reach R() (a) do not exist, or (b) exist, but a
statement that can block the ow to it does not execute in �in;outt .
More precisely, L(in;out) is omission-fault-manifesting when
� (pc; �tin;out; unreach(loc)) is in Symptoms(P; t), and
DynBlocker(P; t; loc; in; out) is null, or
� (pc; �tin;out;missAction(pattern)) is in Symptoms(P; t),Slocj2L0
DynBlocker( P; t; locj; in; out) is null, where L0 consists of loca-
tions of code that match pattern.
Case O3: Omitted a predicate
L is the location of the code that omits a predicate statement or omits a predi-
cate within a predicate expression (incomplete predicate). An execution of this
incomplete predicate causes an erroneous ow of control that skips some loca-
tion loci, reaches some locations locj , or both. If a location loc is unreached
by mistake, then the characteristic of the omission-fault-manifesting occurrence
for L is the same as in Case O2.
If a non-extraneous location loc is reached by mistake,L(in;out) omits a transition
that can block a control ow from reaching loc at step out. This omitted
transition is not a consequence of a previous error-revealing state when the
control ow reaches the location at step in properly, and predicates that a ow
of control to reach a location loc (a) does not exist, or (b) exists, but does not
execute in �in;outt .
In this case L(in;out) is an omission-fault-manifesting when
� (pc; �tin;out; reach(loc)) is in Symptoms(P; t),
� DynSteerer(P; t; loc; out) is null, and

73
� the programmer decides that the code at loc is not extraneous.
Case 4: Omitted an output statement
L(in;out) omits a transition that can produce the expected output. This omitted
transition is not a consequence of a previous error-revealing state when the
output statement to print expected output (a) does not exist, or (b) exists, but
a statement to block its execution does not execute in �in;outt .
More precisely, an execution occurrence L(in;out) is omission-fault-manifesting
when
� (pc; �tin;out;missAction(print: � (:�)) is in Symptoms(P; t), and
�Slocj2L0
DynBlocker( P; t; locj; in; out) is null, where L0 consists of loca-
tions of print statements.
With an omission-fault-manifesting occurrence Lin;out, our debugging critic's hy-
pothesized location for a fault of omission includes all procedures that enclosed a
statement that executed in �in;outt .
Example: Suppose in the program in Figure 4.2, the fault is the omission of a
statement to compute Quotient. Given test case #1: 10 5 30, the execution sequence
is 4(1;2), 5(2;3), 6(3;4), 7(4;5), 13(5;6), 14(6;7), 15(7;8), 20(8;9), 16(9;10), and 8(10;$).
L(7;9) is omission-fault-manifesting if a programmer decides that (1) after the
statement that initializes Quotient at line 14, the zero value for Quotient at step 7
is non-error-revealing, (2) the zero value of Quotient in the print statement reached
at step 9 is error-revealing, and (3) none of the statements which execute from steps
7 to 9 block the execution of the static reaching de�nition of Quotient at line 14.
With this omission-fault-manifesting occurrence, our critic hypothesizes that pro-
cedures F () and G() may omit one or more statements. The missing statement may
either be (1) a static reaching de�nition of Quotient, or (2) a statement to redirect
the ow of control to an existing static reaching de�nition of Quotient at line 14.
Example: Suppose in the program in Figure 4.2, the fault is the omission of a
predicate statement to block ow of control to subroutine F () when X is less than

74
zero. Given test case #2: 1 �1 0, X = �1 when the control ow reaches line 7: G(x)
at step 4.
L(5;7) is an omission-fault-manifesting occurrence if a programmer decides that (1)
the ow of control properly reaches line 13: Remainder = 0 in G() at step 5, (2)
the ow reaches the calling statement at line 15: F (X;Remainder) by mistake at
step 7, (3) none of the statements which execute from steps 5 to 7 direct the ow of
control to line 15 by mistake, and (4) the call to F () is not extraneous. With this
omission-fault-manifesting occurrence, our critic would hypothesize that procedure
G() omits a predicate that should have blocked the ow of control to line 15.
Note that the di�culty in locating a fault of omission is in acquiring the symptoms
of omitted transition, rather than in analyzing the symptoms. Our debugging critic is
designed to acquire these symptoms as it evaluates hypotheses about fault location.
4.3 Debugging Critic Operations
4.3.1 Overview
Our debugging critic operates in two phases. The �rst phase is when it takes
the initiative at the beginning of a debugging session. The second phase is when it
responds to the programmer's requests to evaluate a hypothesized fault location.
In phase 1, our debugging critic takes the initiative when Symptoms(P; t) is empty
for the newly selected error-revealing test case t. The critic poses questions about
output statements. If the fault is not found in an output statement, our debugging
critic acquires an initial set of failure symptoms. It then de�nes search spaces for a
manifested fault from failure symptoms. Our debugging critic formulates a hypothesis
about a fault location, and recommends that location as a starting point for the
programmer.
In phase 2, our debugging critic takes the following steps in response to the pro-
grammer's request to evaluate a hypothesized fault location L.

75
1. Identify types of statements at L
If the statement at L is an assignment, a predicate, a procedure call, or an
input or output statement, our debugging critic proceeds to step 2. For any
other type of executable statement, our debugging critic indicates that it does
not yet evaluate that type of statement.
If the statement at L is not executable, (e.g., blank line, comment), our debug-
ging critic would reject L.
2. Evaluate a statement at location L
Our debugging critic poses evaluation questions about the statement at L. The
allowed replies are \yes", \no", and \do not know."
(a) Check execution status of the statement.
If the statement at L does not execute in the search spaces for a manifested
fault, our debugging critic poses a question to the programmer to determine
whether location L is not reached by mistake. If so, the symptom of
erroneous ow of control is added. Otherwise the evaluation continues to
step 2b.
(b) Determine if it can cause an omitted transition.
The statement itself, not its execution occurrence, is evaluated. Our de-
bugging critic poses a question to the programmer to determine whether
the statement can cause an omitted transition. If so, our debugging critic
proceeds to step 5. Otherwise, the evaluation continues to step 2c.
(c) Select an execution occurrence to evaluate.
An occurrence of a statement at L is selected from the search spaces for the
manifested fault. Note that at this point, our debugging critic does not loop
to evaluate every execution occurrence. If this was done, our critic might
cause the problem of \�xation on the wrong location." Instead, our critic
gives the programmer an option to further evaluate the same location, or

76
examine another location that it recommends, after one selected occurrence
is evaluated.
(d) Evaluate an occurrence.
An occurrence is evaluated for a possible fault-manifesting occurrence.
Even if an occurrence is not in the search space for a manifested fault,
it can exhibit a failure symptom (e.g., uses erroneous variables) that can
reduce the search space further.
If a fault-manifesting occurrence has been identi�ed, the critic proceeds
to step 5. Otherwise, the critic derives or updates failure symptoms from
the evaluation. As a result, our debugging critic may be able to identify
the omission-fault-manifesting occurrence for the code at a location other
than L.
If an omission-fault-manifesting occurrence also is not found, our debug-
ging critic proceeds to step 3.
3. Reduce search spaces for fault
Search spaces for a manifested fault are reduced as each new failure symptom
is added. If the search space for the manifested fault of commission becomes
null, a fault of omission is identi�ed and our debugging critic proceeds to step
5. Otherwise, it proceeds to step 4.
4. Formulate an alternative hypothesis about fault location
Our debugging critic formulates an alternative hypothesis about fault location.
If a new symptom is added, the hypothesis includes locations of code that
may have caused this new symptom. Otherwise, its hypothesis is based on the
earliest occuring symptom.
5. Draw Conclusion
The evaluation result of a hypothesized location L may take one of the following
forms:

77
Case 1: a fault-manifesting occurrence is found at L.
Our debugging critic con�rms that L is the fault location.
Case 2: a fault-manifesting occurrence is found, but not at L.
Our debugging critic rejects L, but identi�es where the fault is.
Case 3: the evaluated occurrence of a statement at L has an error-revealing
output state, but a programmer replies \do not know" to an evaluation
question, Q, about the input state.
Our debugging critic indicates that the fault could be at L if the condition
speci�ed in Q holds.
Case 4: the statement at L does not execute in the reduced search spaces.
Our debugging critic rejects L with an explanation.
Case 5: the evaluated occurrence is not error-revealing, but the statement at
L still executes in one of the search spaces.
Our debugging critic indicates that L needs to be evaluated further before
a conclusion can be made.
Default:
Our debugging critic indicates that it does not have enough information
to reach a conclusion.
If the fault is not yet found, our debugging critic recommends its alternative
hypothesis about fault location. It also recommends the next possible step, such
as examining the statements it recommends or selecting one of the statements it
recommends for evaluation.
4.3.2 Evaluation of output statements
For each output statement occurrence, L(i;j), our debugging critic poses the follow-
ing series of questions (in the sequence shown). The loop terminates when a reply is
\yes" for one of the question or when there are no more output statement occurrences.

78
Table 4.1 Output statement evaluation and derived failure symptoms
Yes to Add symptoms
QomitOutput (pc; �tokstep;j;missAction(\print: � (:�)"))where okstep is a step that properly reached the lastoutput statement. The default okstep is zero.
QerReach (pc; �t0;i; reach(loc)).
QerrUse (var; �t0;j; erroneous(var)) or (var; �t0;j; undefine(var))for each erroneous variable var the programmer identi�es.
QomitOutput : \Is there any output statement that should have executed before the
control ow reaches L at step i [and after the most recent output
statement]?"
QerReach : \At step i, does the control ow reach L by mistake?"
QerUse : \At step i, does L use any erroneous variable values?"
QerOutput : \At step j, does L print an incorrect value?"
If the loop exits when all output statements have been evaluated, our debugging
critic poses the question QomitOutput one last time. The occurrence L(i;j) for this
question is the occurrence where j is the last execution step for �t.
Our debugging critic's reaction for all programmer's replies are as follows.
Case 1: there is a \yes" reply to QomitOutput, QerReach, or QerUse
Our debugging critic adds the corresponding symptom shown in Table 4.1. If
there are more executed output statements, our debugging critic repeats only
QerrUse. The knowledge of more erroneous variables can reduce the search
space for fault of commission. The search space for fault of omission cannot
be reduced further, as the earliest symptom for output statements has already
been identi�ed.

79
Case 2: there is a \yes" reply to QerOutput
Our debugging critic con�rms or conditionally con�rms a fault location. It
con�rms that L is a fault location if the replies for Qomitout, QerReach, or QerUse
with respect to L(i;j), are all \no." Because an erroneous output state is not a
consequence of a previous error-revealing state, a fault-manifesting occurrence
is found. Our debugging critic con�rms that L is the fault location.
If one of the replies is \do not know," our debugging critic conditionally con�rms
L as a fault location. The condition is identi�ed from the question with a \do
not know" reply. An example is the conclusion which states that \if L is properly
reached, L is the fault location."
Default:
In this case, all replies are mixtures of \no" and/or \do not know". Our debug-
ging critic o�ers the programmer a chance to reevaluate the output again. If
he chooses not to, our debugging critic exits with an explanation that it cannot
operate without knowledge of failure symptoms. If he chooses to, our debug-
ging critic repeats the output evaluation process, starting from the �rst output
statement.
4.3.3 Initialization of search spaces for a manifested fault
Our debugging critic �rst de�nes search spaces for a manifested fault that includes
possible occurrences that could have caused the failure symptoms. These search
spaces are updated as our debugging critic acquires new failure symptoms through
its evaluation of hypotheses about a fault location.
4.3.3.1 Search path
The search path for fault, SearchPath(P; t), is a path �top;bottomt to search for a
fault-manifesting occurrence. The step top identi�es the latest non-error-revealing

80
state, stop according to Symptoms(P; t). The step bottom identi�es the earliest error-
revealing state, sbottom according to Symptoms(P; t). SearchPath(P; t) is null if
Symptoms(P; t) is null.
A state si is the latest error-revealing state according to Symptoms(P; t) if (1)
i = 0 and a fault-manifesting occurrence has not yet been found, or (2) a fault-
manifesting occurrence L(i;j) has been found. A state sj is an earliest error-revealing
state according to Symptoms(P; t) when among all erroneous paths �tc;e, the mini-
mum value for e is j.
4.3.3.2 Search space for a manifested fault of commission
The search space for a manifested fault of commission, SSC(P; t), consists of the
possible commission-fault-manifesting occurrences of statements and predicates in �t
that can cause the symptoms in Symptoms(P ; t), with the exception of some missing
dependency statements.
Case 1: Symptoms(P; t) contains an erroneous variable.
SSC(P; t) includes statement occurrences in the intersection of static path slices
of all erroneous variables in Symptoms(P; t).
Case 2: Symptoms(P; t) contains only erroneous ow.
SSC(P; t) includes all execution occurrences in SearchPath(P; t).
Default:
SSC(P; t) is null.
A statement executes in SSC(P ; t) if its occurrence that has not yet been evaluated
as non-fault-manifesting is in SSC(P ; t).
If a fault of commission is the only fault exposed by test case t, then SSC(P; t)
always includes a commission-fault-manifesting occurrence. The proof of this is pre-
sented in Appendix B.2.

81
4.3.3.3 Search space for a manifested fault of omission
The search space for a manifested fault of omission, SSO(P; t), speci�es a path
to search for an omission-fault-manifesting occurrence. SSO(P; t) is the same path
as SearchPath(P; t). A statement occurrence that executes in in the search path
SearchPath(P; t) also executes in SSO(P; t), unless that occurrence has already
been evaluated as a non-fault-manifesting occurrence.
If a fault of omission is the only fault exposed by test case t, then SSO(P; t) always
encloses an omission-fault-manifesting occurrence. The proof of this is presented in
Appendix B.1.
4.3.4 Formulation of hypotheses about fault location
Our debugging critic identi�es a prime suspect, which consists of a hypothesis
about fault location and optionally, a hypothesis about fault identity. A prime suspect
can be prime suspect statements (for fault of commission) or prime suspect procedures
(for fault of omission).
PrimeSuspect(symp) is the prime suspect of symp = (g; �ti;j; errcond) that
executes in the search path �top;bottomt and in the erroneous path �
i;jt . The �rst choice
for symp is the newly added symptom. If the erroneous path �i;jt in symp does not
overlap with the search path �top;bottomt then the next choice is the symptom at the
earliest error-revealing state, sbottom.
4.3.4.1 Formulation of a hypothesis for a location of fault of commission
Our debugging critic �rst identi�es prime suspect statements, statements executed
in �i;jt that could have caused errcond in the symptom (g; �ti;j; errcond). The occur-
rence of the prime suspect statement is derived through dynamic path slicing, with
respect to g, �i;jt , and a location loc identi�ed in an errcond. Table 4.2 matches the
symptoms and the dynamic path slices.

82
Table 4.2 Occurrences of prime suspect statements for each failure symptom
(var; �ti;j; erroneous(var)) Dynamic reaching de�nition occurrence of var atstep j.
(var; �ti;j; undefine(var)) Dynamic blockers for unexecuted static reaching(var; �t
i;j; unchange(var)) de�nitions of var at location reached by step j.
(pc; �ti;j; reach(loc)) Dynamic steerers to the statement at location loc
at step j.
(pc; �ti;j; unreach(loc)) Dynamic blockers that prevent the statement atlocation loc from executing in �
i;jt .
(pc; �ti;j;missAction(pattern)) Dynamic blockers that prevent the statement thatmatches pattern from executing in �i;jt .

83
The type of the prime suspect depends on the types of g and errcond. If g repre-
sents an erroneous variable, the prime suspect can be its dynamic reaching de�nitions,
the predicate that blocks the execution of some of its static reaching de�nitions, or the
extraneous reaching de�nitions. If g represents erroneous ow pc, the prime suspect
can be statements that can steer the ow of control to locations reached in error, or
predicates that can block the ow of control to locations not reached in error.
If there are no prime suspect statement occurrences, then our debugging critic
formulates a hypothesis on a location for a fault of omission. Otherwise, statements
whose occurrences are prime suspect occurrences and also are executed in the search
path �top;bottomt form our debugging critic's hypothesis for fault of commission.
If the existing prime suspect occurrences do not execute in the search path, the
hypothesis consists of statements executed in both the search space for fault of com-
mission and the erroneous path �i;jt .
4.3.4.2 Formulation of a hypothesis for a location of fault of omission
The absence of statements that can cause a failure symptom symp in an erro-
neous path �i;jt indicates the presence of an omission-fault-manifesting occurrence.
The procedures that execute in �(i;j)t are referred to as prime suspect procedures. Our
debugging critic's hypotheses about the type of the missing statement are listed in
Table 4.3. When symp is not a symptom of a statement reached in error, our de-
bugging critic would con�rm that a fault of omission is in one of the prime suspect
procedures.
When symp is the symptom of a statement reached in error, our debugging critic
formulates a hypothesis that if the statement at loc is not extraneous, a statement is
missing from one of the the prime suspect procedures.
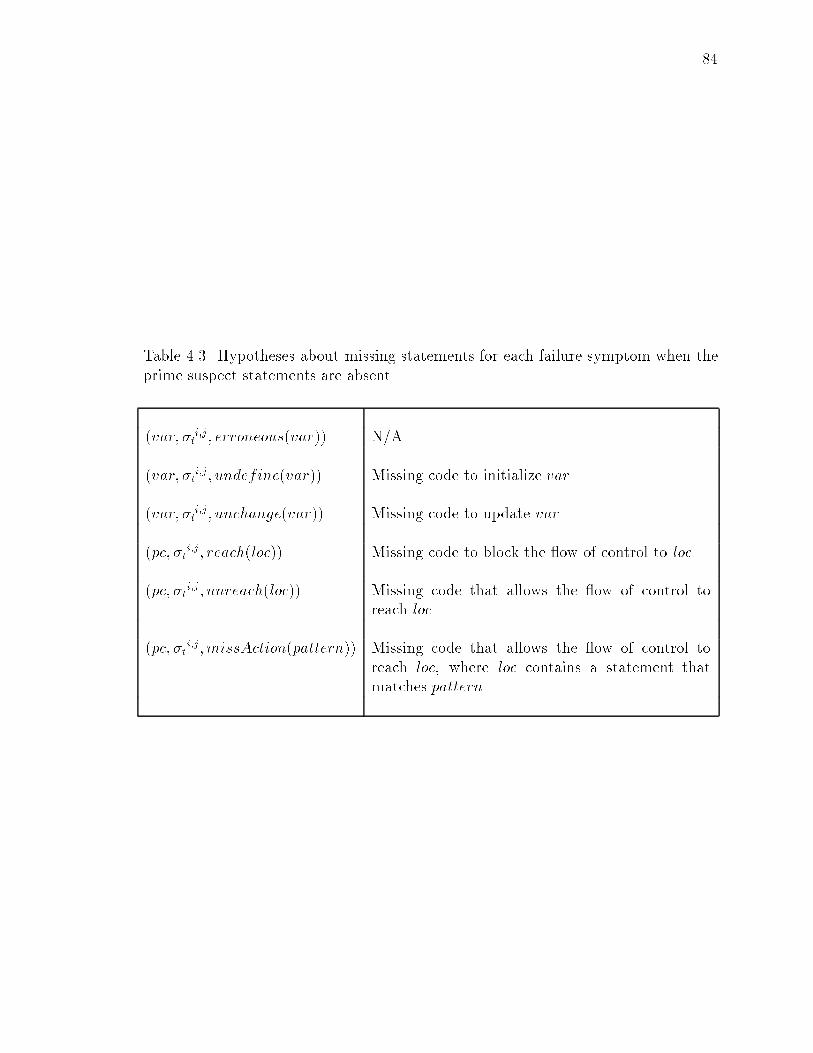
84
Table 4.3 Hypotheses about missing statements for each failure symptom when theprime suspect statements are absent
(var; �ti;j; erroneous(var)) N/A
(var; �ti;j; undefine(var)) Missing code to initialize var.
(var; �ti;j; unchange(var)) Missing code to update var.
(pc; �ti;j; reach(loc)) Missing code to block the ow of control to loc.
(pc; �ti;j; unreach(loc)) Missing code that allows the ow of control toreach loc.
(pc; �ti;j;missAction(pattern)) Missing code that allows the ow of control toreach loc, where loc contains a statement thatmatches pattern.
85
4.3.5 Evaluation of statements outside search spaces
A hypothesized location L is outside the search path for test case t, �top;bottomt
when it contains a statement that (1) has already been rejected as a fault location,
(2) does not execute in �t, (3) executes after step bottom, or (4) executes before step
top.
Our debugging critic rejects L in all four cases. In case 1, it rejects L on the
grounds that L has been rejected earlier. In case 4, it rejects L because the fault
location has already been found. Recall that our debugging critic sets step top to
value greater than zero only when an error-revealing occurrence has been identi�ed.
In cases 2 and 3, our debugging critic poses the following question before it rejects L.
QoutsideSS : \The statement at L is not executed by this test case
[beforesymptom] Should it be? [consequence]"
In this question, our debugging critic speci�es beforesymptom if the statement at
L executes. This term is a description of the symptom observed at the state sbottom in
the search path. Our debugging critic speci�es a general consequence of an erroneous
variable or erroneous ow had the statement at L executed. If the statement at L is
in a static program slice of a known erroneous variable var, the consequence is \the
statement could have changed the erroneous value of var." If the statement at L is
a calling statement that could have led the ow of control to an unreached location
loc in an unreached procedure R(), the consequence is \the statement at loc might
be reached."
A \yes" reply for QoutsideSS leads our debugging critic to add an unreached location
symptom. The added symptom is (pc; �t0;$; unreach(L)) if the statement does not
execute. The added symptom is (pc; �ttop;bottom; unreach(L)) if the statement does
not execute in search path �top;bottomt . Our debugging critic adds no symptom when
the reply is \no" or \do not know". Despite this reply, our debugging critic would
reject L and recommend an alternative location.

86
4.3.6 Evaluate statements inside search spaces
4.3.6.1 Evaluate a statement
Our debugging critic evaluates whether the statement at L can cause an omitted
transition by posing one of the following questions.
QomitAssign: \Does the statement at L assign a value to a wrong variable?"
QomitCall: \Does a procedure call at L pass too few parameters?"
QomitInput: \Does an input statement at L read too few values?"
QomitOutput2: \Does an output statement at L print too few values?"
QomitPred: \Is a predicate at L incomplete?"
A \yes" reply implicates L as a location of a fault of omission. A \no" or \do
not know" reply leads our debugging critic to select an occurrence of the statement
to evaluate.
4.3.6.2 Select an execution occurrence
Our debugging critic selects an occurrence of a statement at L, L(i;j) to evaluate.
The order of preference is listed below. The �rst choice that is not null is selected.
1. Prime suspect occurrence of statement at L in SSC(L; t)
2. Prime suspect occurrence of statement at L in SSO(L; t)
3. Last occurrence of statement at L in SSC(L; t)
4. Last occurrence of statement at L in SSO(L; t)
A prime suspect occurrence is chosen because it has a cause-e�ect relationship
with a known failure symptom. Therefore, it is likely to be faulty. If it is not faulty,
it should exhibit failure symptoms (e.g., uses an erroneous variable value). The last

87
occurrence is also likely to exhibit a failure symptom, even if L is not faulty. A
common o�-by-one fault in a loop predicate, for example, would manifest itself in the
last execution occurrence of the loop body.
4.3.6.3 Evaluate a statement occurrence
Our debugging critic poses questions about L(i;j) to determine whether it is a
commission-fault-manifesting occurrence. The �rst two questions determine if the
values used from the input state si are non-error-revealing.
QerReach : \At step i, does the control ow reach L by mistake?"
QerUse : \At step i, does L use any erroneous variable values?"
If the reply is \yes" for QerReach or QerUse, the corresponding symptom shown in
Table 4.1 is added. Our debugging critic proceeds to draw a conclusion about L (see
Section 4.3.1).
If the reply is \no" or \do not know" for QerReach or QerUse, our debugging critic
poses the question, QerDef , to determine if L de�nes an error-revealing value. This
question is phrased according to the type of statement at L.
QerAssign : \At step j, does L de�ne an incorrect value?"
QerCall : \At step j, is there any parameter that gets
assigned to an incorrect value?"
QerPred : \At step j, does the predicate evaluate to an
erroneous boolean value?"
QerInput : \At step j, does L read in an incorrect
value?"
QerOutput : \At step j, does L print an incorrect value?"

88
Table 4.4 Update for a failure symptom
No to QerDef De�ne Update erroneous path for
QerAssign var (var; �tc;e; errcond)QerInput
QerCall
QerPred pc (pc; �tc;e; errcond)
QerOutput output (pc; �tc;e;missAction(\print: � (:�)"))
If the reply is \yes" for QerDef , our debugging critic con�rms or conditionally
con�rms a fault location. If the replies for QerReach or QerUse are both \no", then a
commission error-revealing occurrence is found. Our debugging critic con�rms that
L is the fault location. If one of the replies for QerReach or QerUse is \do not know",
our debugging critic conditionally con�rms L. The condition is identi�ed from the
question with the \do not know" reply.
If the reply is \no" for QerDef , our debugging critic may be able to reduce an
erroneous path of some failure symptoms. Recall that the erroneous path �tc;e in a
symptom (g; �tc;e; errcond) indicates that at step c, g is non-error-revealing and at
step e, g is error-revealing. If the statement under evaluation assigns a non-error-
revealing value to g at step j, then the erroneous path �tc;e can be reduced to �tj;e, if
j > c. Table 4.4 shows which symptoms can be reduced according to a \no" reply to
each type of QerDef .
If L(i;j) is a prime suspect occurrence, a \no" reply to QerDef may change a
symptom of an erroneous transition to a symptom of an omitted transition.
1. L(i;j) is a reaching de�nition occurrence of var in (var; �tc;e; erroneous(var)).
The symptom changes to (var; �tj;e; unchange(var)).

89
2. The erroneous path in a symptom (g; �tc;j ; errcond) is reduced to �tj;j.
When g is non-error-revealing after it is de�ned by a statement at L but error-
revealing when it is used in the next statement at L0, then a statement or a
predicate is missing in between.
When our debugging critic formulates a hypothesis based on the newly added
symptom, it may recognize an omission-fault-manifesting occurrence.
Example: Let (balance; �t0;4; erroneous(balance)) be a symptom for the code be-
low. Suppose the execution sequence is 20(1;2), 21(2;3), 22(3;4), 23(4;5).
20: read( deposit, balance)
21: if (deposit < 0)
22: balance = balance + deposit
23: print(balance)
When the prime suspect occurrence 20(1;2) is evaluated, both balance = 100
and deposit = 20 are found to be non-error-revealing at step 2. The symptom
(balance; �t0;4; erroneous(balance)) is updated to (balance; �t2;4; unchange(balance)).
Example: Let (balance; �t0;2; erroneous(balance)) be a symptom for the code be-
low. Suppose the execution sequence is 5(1;2), 6(2;3).
5: read( deposit, balance)
6: print(balance)
When the prime suspect occurrence 5(1;2) is evaluated, balance = 100 is found to
be non-error-revealing at step 2. The symptom (balance; �t0;2, erroneous(balance))
is updated to (balance; �t2;2; unchange(balance)). This implies that a statement to
update balance is missing between line 20 and 21.
Example: Let (pc; �t0;$; unreach(8)) be a symptom for the code below.

90
7: if (match == 4)
8: print(\invalid triangle")
Suppose \invalid triangle" should be printed when match is 0 or 4, and match is
0 when control ow reached line 7 at step 15. When the prime suspect occurrence
7(15;16) is evaluated, the programer �nds (match == 4) = false non-error-revealing.
The symptom (pc; �t0;$; unreach(8)) is updated to (pc; �t16;$; unreach(8)).
4.4 A Sample Session with a Debugging Critic
This section presents a sample debugging session for the program trityp.c (see
Figure 4.3) which is similar to one used in the paper by Ramamoorthy [RHC76].
Given three sides of a triangle as input, this program determines the type of a triangle:
scalene, isosceles, equilateral, or not a triangle.
An error-revealing test case: 2 2 4 causes a fault at line 48 to be exposed. The
fault is that the >= operation is used instead of the > operation. The program
produces the erroneous output: \Return match = 2, the triangle is isosceles."
In phase 1, our debugging critic poses questions about output statements. It
executes the program and breaks at step 13 when it reaches the �rst print statement
at line 57. It then poses the question:
\Is there any output statement that should have executed before control
reaches line 57 at step 13?"
When our debugging critic receives a \no" reply, it poses the next question:
\At step 13, does the control ow reach line 57 by mistake?"
When our debugging critic receives a \no" reply, our debugging critic prints the
values of the variables used before the statement executes, then poses the next ques-
tion:

91
123456789
1011121314151617181920212223242526272829303132333435363738394041
42434445464748495051525354555657585960616263646566676869
707172737475767778
/** trityp -** MATCH is output from the routine* = 1 if triangle is scalene* = 2 if triangle is isosceles* = 3 if triangle is equilateral* = 4 if not a triangle*/
main(){ int i, j, k, match;
printf("Please enter 3 sides:"); scanf("%d %d %d", &i, &j, &k); match_sides( i, j, k, &match); print_output( match);
}
match_sides( i, j, k, match) int i, j, k, *match;{
*match = 0;if (i == j) *match = *match + 1;if (i == k) *match = *match + 2;if (j == k) *match = *match + 3;
/* scalene? */
if (*match == 0) { if (i+j <= k || j+k <= i || i+k <= j) *match = 4; }
#include <stdio.h>
/* Confirm it’s a legal triangle before declaring it to be isosceles or equilateral */
else if (*match > 3) *match = 3;else if (*match == 1 && i+j >= k) *match = 2;else if (*match == 2 && i+k >= j)
else if (*match == 3 && j+k >=i) *match = 2;else *match = 4;
printf("\nReturn match = %d, ", *match);return;}
print_output( match){switch( match) { case 1: printf("the triangle is scalene.\n"); break; case 2: printf("the triangle is isosceles.\n"); break;
printf("the triangle is equilateral.\n"); break;
printf("it is not a triangle.\n"); break; }}
default:
*match = 2;
case 3:
Figure 4.3 A faulty program trityp.c

92
\match is (int *)0xf7�fa94
match is 2
At step 13, does line 57 use any erroneous variable values?"
When our debugging critic receives a \yes" reply, it stops evaluating output state-
ments and poses a request for the programmer to identify the erroneous variable.
After the programmer identi�es �match = 2 at line 57, execution step 13 as erro-
neous, our debugging critic adds (�match; �0;131 ; erroneous(�match)).
Our debugging critic then uses this information to initialize its search space for
fault of omission and fault of commission for test case 1. SSO(trityp:c; 1) is de�ned
as �t0;13. SSC(trityp:c; 1) includes occurrences: 18(2;3); 19(3;4); 28(4;5); 29(5;6); 30(6;7);
31(7;8); 33(8;9); 38(9;10); 46(10;11); 48(11;12); and 49(12;13):
As there are no more executed print statements that used a variable, our debugging
critic ends the output evaluation process. It identi�es the prime suspect occurrence for
(�match; �0;131 ; erroneous(�match)) to be the dynamic reaching de�nition of �match
at line 49. It then makes the following recommendation:
\Given what you told me, I would recommend the following statement as
a possible fault location because it de�nes �match
49: �match = 2;
Would you like to guess at a fault location?"
When our debugging critic receives a \yes" reply and line 49 as the programmer's
hypothesis, our debugging critic enters phase 2.
In phase 2, our debugging critic begins to pose evaluation questions. The �rst
question is:
\Does the statement at line 49 assign a value to the wrong variable?"
When our debugging critic receives a \no" reply, it selects a dynamic reaching
de�nition occurrence, 49(12;13), for the symptom (�match; �0;131 ; erroneous(�match)).
It then poses the question:

93
\At step 12, does the control ow reach line 49 by mistake?"
When our debugging critic receives a \yes" reply, it adds (pc; �t0;12; reach(49)).
The search spaces are reduced. SSO(trityp:c; 1) is reduced to (0,12). SSC(trityp:c; 1)
is reduced to: 18(2;3); 19(3;4); 28(4;5); 29(5;6); 30(6;7); 31(7;8); 33(8;9); 38(9;10); 46(10;11); and
48(11;12). As the statement at line 49 no longer executes in either search space, our
debugging critic rejects line 49 and recommends dynamic steerers of line 49.
\Line 49 is not the fault location.
You may want to consider statements that allow the ow of control to
reach line 49 by mistake.
19: match sides(i, j, k,&match);
38: if (�match == 0)
46: else if (�match > 3)
48: else if (�match == 1&&i+ j >= k)
Would you like to guess again?"
When our debugging critic receives a \yes" reply and the programmer speci�es
line 48 as his next hypothesis, our debugging critic poses the question:
\Is a predicate at line 48 incomplete?"
When our debugging critic receives a \do not know" reply, it selects the occurrence
48(11;12), a prime suspect occurrence of (pc; �t0;12; reach(49)). It then continues with
the question:
\At step 11, does the control ow reach line 48 by mistake?"
When our debugging critic receives a \no" reply, it displays the values used at
line 48 and a question about them:
\match is (int *) 0xf7�fa94
�match is 1

94
i is 2
j is 2
k is 4
At step 11, does line 48 use any erroneous variable values?"
When our debugging critic receives a \no" reply, it displays the boolean value of
the predicate:
\(�match == 1&&i+ j >= k) is true
At step 12, does the predicate evaluate to an erroneous boolean value?"
When our debugging critic receives a \yes" reply, it recognizes that 48(11;12) is a
commission-fault-manifesting occurrence. It then con�rms line 48 as the location of
a manifested fault.
\Congratulations, I believe you have discovered the fault location!"
4.5 Summary
This chapter presents an active debugging assistant, a debugging critic, that can
evaluate as well as formulate a hypothesis about a fault location. Our debugging critic
is designed with features identi�ed to overcome debugging pitfalls: con�rmation,
explanation, hints, and questions. In support of our debugging critic's operations,
we de�ne a uniform representation for failure symptoms, an execution path slicing
method, two new types of dynamic control slices, characteristics of fault-manifesting
occurrences for both a manifested fault of commission and omission, and search spaces
for them.

95
5. IMPLEMENTATION AND EVALUATION
Never utter these words: `I do not know this, therefore it is false.'
One must study to know; know to understand; understand to judge.
{ Apothegm of Narada
This chapter covers an implementation of a debugging critic prototype and a
debugging experiment on this prototype. The experimental results support our hy-
pothesis: programmers can debug faster when they have access to a critic system than
when they only have access to fault localization and break-and-examine tools. A fault
localization tool alone does not signi�cantly improve debugging speed. According to
a survey of our experimental subjects, the users of our debugging critic are in favor
of adding a debugging critic and its supporting functions on to other conventional
debuggers.
5.1 A Debugging Critic Prototype
A prototype of a debugging critic was built as an extension to a prototype debug-
ger, Spyder. This section gives an overview of Spyder and discusses the critic system's
extension to Spyder.
5.1.1 Spyder
Spyder is a prototype debugger originated by Agrawal [Agr91] for ANSI C pro-
grams. It was built on top of the GNU C compiler, gcc and the GNU source-level
debugger gdb. The development environment of Spyder is a SUN SPARC workstation

96
running SUN OS 4, a derivative of BSD Unix. Details about Spyder's implementation
can be found in Agrawal's dissertation [Agr91] and Pan's dissertation [Pan93].
Original Spyder commands are grouped into three major sets: break-and-examine
operations, slice-related operations, and heuristics.
Break-and-Examine operations:
This set includes commands that monitor program execution and behavior.
Break commands set and delete break points in the program. Trace commands
allow programmers to step forward or backward through the program execution.
Print commands print values of a marked expression in the program or the
value of a selected variable in a menu. Agrawal's dissertation [Agr91] describes
execution backtracking in more detail.
Slice-related operations:
This set includes commands to compute static and dynamic slice commands to
compute combinations of slices. The slice types are: program slice, reaching
de�nitions, data slice, control slice, and control predicate. These slices can
be added, subtracted, intersected, and saved via slice-operations commands.
Agrawal's thesis [Agr91] covers the implementation of slice-related operations
in more detail.
Heuristics:
This set includes 16 heuristics which, under prede�ned criteria, combine dy-
namic slices of a selected variable from a set of error-revealing and non-error-
revealing test cases. Pan's thesis [Pan93] covers the implementation of the
heuristics in more detail.
5.1.2 Spyder's critic extension
To support the critic system's operations, we added to Spyder's control panel
window (1) an evaluate locations button, (2) an error information button, (3) a grep

97
button, and (4) buttons for enhanced break and print operations. The new Spyder
main window is shown in Figure 5.1. This section presents the operations of these
buttons.
5.1.2.1 Evaluate locations
The evaluate locations button opens the main window for the critic system to
communicate with the programmer. As shown in Figure 5.2, this main window is
divided into four panes.
1. Critic's Dialogue pane:
This window displays the critic's questions, comments, and values associated
with the statement under evaluation.
2. Critic's Label pane:
This pane gives a one-line description of lines listed in the show-list pane.
3. Critic's Show-List pane:
This window displays selected program statements or selected routine names
(without parameters). The initial list includes the names of all routines in the
program. When a programmer makes a hypothesis, this pane lists the state-
ments at the hypothesized location. When the critic system suggests alternative
locations, this pane lists the suggested lines. When the fault location is found,
this pane lists the lines, routine name(s), or a code block that contains the fault.
4. Critic's Button pane:
This pane consists of reply buttons and command buttons. The critic system
selectively activates them during its conversation with the programmer.

98
Figure 5.1 New Spyder's Main Window

99
Figure 5.2 Critic's Window

100
KEY("Blank line or comment line");
COMMENT("Line $GUESS_LINE$ cannot execute.");
QUESTION("You may want to consider $SUGGEST_LOC$. \
Would you like to guess again?");
ANSWERS( BID_YES, cr_guess_again_callback);
ANSWERS( BID_NO, cr_any_command_callback);
ACTIVE_BUTTON( BID_YES);
ACTIVE_BUTTON( BID_NO );
ACTIVE_BUTTON( BID_QUIT);
Figure 5.3 Sample dialogue entry
� Reply buttons
Three buttons, YES, NO, DO NOT KNOW, are activated when the critic
system poses a question. The functions corresponding to these buttons
vary with respect to the question.
� Command buttons
The command buttons and their corresponding functions are shown in
Table 5.1.
The critic system's questions-and-answers interface is controlled by its dialogue-
base. Each dialogue entry includes the key, the critic's comment template and/or the
critic's question template, the allowed responses with their corresponding functions,
and the critic's keys to be activated. An example of a dialogue entry is shown in
Figure 5.3. Keywords in each template are enclosed by $ signs. All dialogue entries
are contained in one C routine. KEY, COMMENT, QUESTION, ANSWERS, and
ACTIVE BUTTON are also C routines.
5.1.2.2 Error information
The error information button opens a submenu. Three buttons on this submenu
are: erroneous variables, erroneously reached lines, and erroneously unreached lines.
Each button opens up a form to add, delete, save, or view records on error information.

101
Table 5.1 Critic's command buttons
Critic command keys Functions
enter guess Enters a line number for the critic
to evaluate.
examine loc Automatically sets break points on
lines listed in the bottom window.
add err var Opens a window to add erroneous
variables.
critic guess Critic hypothesizes at a possible
fault location.
narrow search space Lists statements in SSC(P; t).
broad search space Lists routines on the search path.
reset Erases all known error information
and sets both search spaces to null.
help Displays help message.
quit Closes the critic's window.

102
Figure 5.4 A window to enter erroneous variables
Figure 5.4 shows the entry screen for erroneous variables. Screens for erroneously
reached or unreached lines are similar.
5.1.2.3 Grep
This key opens a dialog box. After the programmer enters the word on which
to do the grep, the critic system highlights the lines that match the given word in
the Spyder window. It also lists these lines in the Critic's dialog pane, if the critic
system's window is opened.
5.1.2.4 Enhanced break and print operations
Some of the enhanced break and print operations that the critic system invokes
internally are made directly available to the programmer.
1. Print values before execution
This key prints the values of all expressions on the current line before the line is
executed. The critic system invokes the function underlying this key implicitly
before it asks a programmer whether he sees any variable with erroneous values.

103
2. Print values after execution
This key executes a step command and print command. If an assignment state-
ment is executed, a variable gets de�ned and its value is printed. If a predicate
is executed, the predicate and its boolean value are printed. If a calling state-
ment is executed, the formal parameter variables and their assigned values are
printed. The critic system invokes the function underlying this key implicitly
before it asks a programmer whether he sees any erroneously de�ned values.
3. Stop in slice
This key automatically sets the break points on lines highlighted by slicing
techniques, grep, or the critic system. The critic system invokes the function
underlying this key to set break points in all lines listed within its show-list
pane.
5.1.3 Implementation limitations
Our �rst prototype version of the debugging critic has a few implementation limi-
tations. First, it operates under the assumption that each line of the program contains
at most one statement. Second, because the program dependency graph underlying
Spyder does not establish weak dependencies among statements, this prototype ver-
sion does not yet evaluate any hypothesis about transfer statements (e.g., return,
continue, break, goto's). Third, it cannot evaluate a statement that contains a func-
tion call in its expression. To handle this case, the critic system could treat both the
values of the parameter and the return values from each function call as input values
to the statement. If the return value is error-revealing, the critic can then compute
the dynamic reaching de�nition from the expression of that function call to identify
the statement that returns that erroneous value. Agrawal's dynamic slicing method
can be extended to accomplish this.
Fourth, it has a limited capability in handling side-e�ects from variable aliasing
(e.g., more than one variable name is associated with the same memory location).

104
If the side-e�ect symptom is identi�ed �rst, the critic system can hypothesize about
the statement that caused it (via Agrawal's dynamic slicing [Agr91]). However, if
the critic system evaluates the statement that causes the side-e�ect before the side-
e�ect symptom is identi�ed, then the critic system may not always con�rm that the
statement is faulty.
For example, suppose variable var1 is an alias of variable var2 and a statement
that de�nes var1 at line 10 causes var2 to become error-revealing. If the erroneous
value of var2 has been identi�ed as a failure symptom, then the critic system can
hypothesize that the dynamic reaching de�nition of var2 at line 10 could have caused
it. However, if the critic system has to evaluate line 10 before the symptom of var2
has been identi�ed, the critic system would recognize line 10 as a fault location only
if the de�ned value of var1 is also error-revealing.
5.2 Experimental Evaluation
This section presents our experiment to evaluate whether a debugging critic can
improve programmers' debugging speed. We compared three groups of programmers
who used Spyder to debug a program. The �rst group used only break-and-examine
operations. The second group used both program slicing and break-and-examine
operations. The third group used a debugging critic, program slicing, and break-
and-examine operations. In this experiment, program-speci�c information was not
available to our debugging critic.
A follow-up pilot study that tested a group of programmers who debugged a
program using a modi�ed version of our debugging critic is presented in Section 5.3.
It is not presented here because not all program versions under test in this experiment
were tested in the pilot study.

105
5.2.1 Experimental design
We used a factorial design for our experiment. Our experimental design and its
mathematical model are shown in Figure 5.5. In the mathematical model,1 Yijkl was a
dependent variable. Ai; Bj; and Pk were factors or independent variables. The error,
�(ijk)l was not synonymous with \mistakes," but included all types of extraneous
variations that tended to mask the e�ect of the treatment [CC57].
A measurement to be compared is debugging speed instead of debugging time.
We did not use debugging time directly because when the programmer cannot �nd
the fault, time was in�nity. The reciprocal of time, on the other hand, is zero. Thus,
debugging speed, computed as a reciprocal of time as shown below, is also zero when
the the programmer could not �nd the fault.
DSPEED =total lines in a program with one fault
TIME
DSPEED is the total lines debugged per minute (lpm). TIME was measured in
minutes and was automatically computed by Spyder when it recorded each debugging
session. TIME excluded the compilation time, test case entering time, and time to
run an error-revealing test case for the �rst time.
The factors in this experiments were as follows:
Spyder
Spyder level 1 only allowed access to the break-and-examine operations. Spyder
level 2 allowed additional access to program slicing and slice operations. Spyder
level 3 allowed additional access to Spyder with a debugging critic based on
the model described in chapter 4. We disabled the heuristics and execution
backtracking features in all three versions of Spyder.
1The interaction terms (e.g., the combined e�ects of the factors) are not in the model. As thee�ects of the interaction terms were found insigni�cant in our study, the terms can be pooled intothe error term, �(ijk)l [Mon91].

106
1 2 1 2 1 2 2 1 2 1 21
1 2 1 2 1 2
1 2 3Spyder
Program
Fault Class
Yijkl = �+Ai +Bj + Ck + �(ijk)l
where
Yijkl = debugging speed
� = average of Y
Ai = Spyder, i = 1; 2; 3
Bk = Program, k = 1; 2
Cj = Fault class, j = 1; 2
�(ijk)l = Error, l = 1
Figure 5.5 Experimental design

107
Programs
Levels of programs represented two syntactically correct C programs. Neither
program contained transfer statements. We wrote both programs.
1. Payday program
This program computes the next three paydays after the given date. Every
last Friday of the month is a payday unless: (1) the last Friday is Christmas
or New Year's Eve, or (2) the month is June or July. In the �rst case, the
following Monday is the payday. In the second case, no pay check is given,
so the next payday would be in August.
The Payday program contains a total of 274 lines, 189 of which are exe-
cutable. It has 8 procedures with a maximum nesting level of �ve. This
program contains an average of 19 characters per line. Comments consti-
tute 13.1% of the program.
2. Shipbook program
This program identi�es the sizes of boxes in which to ship an order of
books. A book order consists of the number of books, length, width, and
total pages per book. Three box sizes are available. Each box is not
allowed to weigh more than 30 pounds. The program prints out the box
size, the total number of books in each box, and the box weight.
The Shipbook program contains a total of 338 lines, 238 of which are
executable. It has 9 procedures with a maximum nesting level of three.
This program contains an average of 18.4 characters per line. Comments
constitute 8.6% of the program.
Fault Class
Fault class level 1 corresponded to a fault of commission. Fault class level 2
corresponded to a fault of omission. All faults used in this experiment were real
faults found during development of the programs.

108
In the Payday program, the fault of commission was in a loop predicate where
an operation < was used instead of <=. This fault was in find last friday(),
nested at level 4. The fault of omission was a missing predicate and assignment
to increment the year when the payday in December was already past. This
fault was in find next month pay day(), nested at level 2.
In the Shipbook program, the fault of commission was in an assignment state-
ment where two operands of the subtract operation were interchanged. This
fault was in compute max books in box(), nested at level 3. The fault of omis-
sion was a missing assignment statement. This fault was in find best fit box(),
nested at level 2.
5.2.2 Participants
Our experimental subjects were senior undergraduate students in the Department
of Computer Sciences at Purdue University. All had at least three years of program-
ming experience and knowledge of the programming language C. All had written at
least one major project using C.
5.2.3 Procedures
One week before the experiment, the participants were given a Spyder homework
assignment. This homework was designed to help them learn break-and-examine
operations and program slicing operations. The debugging critic was not available at
this time.
For the experiment, 39 students were randomly assigned to 12 subgroups. Each
group contained 3 or 4 students. The experiment was carried out in lab sessions for
a senior-level computer science class. Groups that debugged the same program were
tested in the same lab session. Students had a maximum of three hours to �nd the
fault location.

109
At the beginning of the session, programmers received a program listing, its
one-page natural language speci�cation, one error-revealing test case, one non-error-
revealing test case, and a description of how the program failed externally (e.g., which
output values were erroneous). They were instructed to run a script �le that auto-
matically retrieved the faulty program, compiled the program, entered the test cases,
and started Spyder. During a debugging session, Spyder recorded debugging time,
debugging commands used, and output produced by Spyder. When the programmer
was convinced that he had found the fault, he were asked to complete a survey form
(see Appendix C.1) to indicate the fault location. In the survey, each programmer
was asked to rate the helpfulness of the Spyder features to which he had access. He
also was asked to indicate whether he would like to see such features added to other
conventional debuggers.
5.2.4 Analysis results
Comparison of average debugging speed is shown in Figure 5.6. Overall results
showed that programmers debugged twice as fast with the critic system than without
it. For the faults of omission, the programmers debugged four times faster with the
critic system than with only break-and-examine operations. Overall, programmers
who debugged with only the break-and-examine operation (group 1) had an average
debugging speed of 2.1 lpm. Programmers who had additional access to slicing and
slice operations (group 2) had an average speed of 2.3 lpm. Programmers who had
additional access to a debugging critic (group 3) had an average speed of 4.4 lpm.
To analyze possible causes of debugging speed variation, we used the General
linear model (GLM). The General Linear Model consists of several analysis methods,
one of which is Analysis of Variance with unbalanced data.2 The resulting p-value
was used to determine the con�dence level (1 � p-value)% in identifying the source
of variation for debuging speed.
2The underlying statistical theory behind GLM is the same as Analysis of Variance (ANOVA),but ANOVA requires balanced data [Sea71].

110
With Break & Examine With Slicing With Debugging Critic
Debugging Assistance
0.0
0.5
1.0
1.5
2.0
2.5
3.0
3.5
4.0
4.5
5.0
Deb
uggi
ng S
peed
Fault of Commission
Fault of Omission
Overall
Debugging Speed Comparison
Figure 5.6 Debugging speed comparison

111
Table 5.2 Statistical result
Source of speed variation Con�dence P-value
Level
Spyder Version
Version 1 vs. Version 3 99.09% 0.0091
Version 2 vs. Version 3 94.94% 0.0506
Version 1 vs. Version 2 22.49% 0.7751
Program
Payday.c vs. Shipbook.c 95.40% 0.0460
Fault class
Commission vs. Omission 40.58% 0.5942
112
The statistical results shown in Table 5.2 supports our statement of thesis that
programmers can debug faster when they also have access to a tool to help con�rm
hypotheses on fault locations than when they only have access to tools that help for-
mulate the hypotheses. Spyder versions and programs were the source of variation in
debugging speed. Programmers who had access to the critic system (Spyder verion
3) debugged signi�cantly faster than those who had access to the break-and-examine
features only (Spyder version 1), and faster than programmers who had access to
program slicing and break-and-examine features (Spyder version 2). Programmers
debugged program Payday.c signi�cantly faster than they debugged program Ship-
book.c. However, they did not debug a fault of commission signi�cantly faster than
they debugged a fault of omission.
5.2.5 Qualitative results
Our survey results and our observation indicated that the critic system helped
overcome the two previously identi�ed debugging pitfalls: \�xation to the wrong
location" and \underuse" problems. It helped the programmers to bene�t from the
fault localization technique (program slicing). It also worked in conjunction with a
fault recognition tool (grep).
5.2.5.1 Overcoming the \Fixation on the wrong location" problem
A debugging critic helped overcome the \�xation on the wrong location" problem.
We counted the number of programmers who identi�ed a wrong fault location to
determine how many programmers did not overcome this problem. Figure 5.2.5.1
shows that with break-and-examine operations alone, 33% of the programmers did
not overcome the �xation problem. When the programmers had additional access to
slicing operations, 43% of the programmers did not overcome the �xation problem.
However, when the programmers had additional access to the critic system, only 8%
did not overcome the �xation problem.

113
92%
8%
Find fault location
Find wrong fault location
With the critic added on
57%
43%
With slicing and slice operations added on
67%
33%
With break-and-examine operation
Figure 5.7 Percentage of programmers who identi�ed wrong fault location

114
From our observation, programmers who had access to the critic system did ex-
perience the �xation problem, but the critic system helped them overcome it. Once
the critic system rejected their hypothesized location and suggested an alternative
location, the programmer investigated the program further. Afterward, some pro-
grammers hypothesized at the location that the critic system recommended. Some
examined the program to �nd other possibilities.
5.2.5.2 Overcoming the \Underuse" problems
The critic system did not underuse a programmer's knowledge, as it incrementally
acquired his knowledge of the failure symptoms. Further analysis on the symptoms
allowed it to formulate and evaluate hypotheses about fault locations.
Programmers did not underuse the critic system. All programmers who had access
to the critic system used it. In our survey, the programmers were asked to rate the
helpfulness of all Spyder's features under test, as N/U (for unused), or as a number
between 0 to 10, where 0 indicates no help and 10 indicates the most help. The rating
for our debugging critic was 8.5385, the highest rating among all Spyder's features
under test (see Table C.1) It was also the only feature with no N/U rating (see Table
C.2). Also, 12 out of 13 programmers recommended that the critic system to be
added on to conventional debuggers (see Table C.3).
5.2.5.3 Augmenting program slicing techniques
Programmers bene�ted more from program slicing when the critic system com-
puted the relevant slices for them than when they had to compute the slices on their
own. Without the critic system, program slicing and slice operations were underused.
According to the survey, 8 out of 13 programmers did not use program slicing and 10
out of 13 programmers did not use slice operations (see Table C.2). The programmers
indicated that program slicing would be more helpful to them if (1) they had more
experience in using it, (2) on-line help with numerous examples were available, or

115
(3) a manual that thoroughly described di�erent program slices was available. From
our observation, it appeared that programmers did not know which slices to use and
when to use them.
With the critic system, the programmers bene�ted from program slices without
the overhead of training time. (Recall that the programmers did not have access
to the critic system during the one week before the experiment.) The knowledge of
program slices, when presented as the critic system's recommendation, did persuade
programmers to look elsewhere. Without the critic system, we observed programmers
develop a �xation on a wrong statement in a dynamic slice, such as the dynamic
reaching de�nition of an erroneous variable.
The critic system also promoted the understanding of program slices. When the
programmer used program slicing without the critic system, the programmers had
to determine what types of statements they were searching for and what types of
slices (or their combinations) would identify those statements. The critic system
determined which slices might contain faulty statements, recommended them, and
explained how they a�ected the known failure symptoms.
5.2.5.4 Augmenting fault recognition tool
A pattern matching tool, such as grep, can be considered a primitive fault recog-
nition tool, as a programmer can use the tool to �nd code that matched a speci�ed
pattern. From our observation, programmers did use grep in conjunction with the
critic system. Programmers used grep to locate code with a keyword that was re-
lated to the failure symptom. For example, the word \Friday" was used when the
program payday:c failed to identify the last Friday of the month. A programmer then
requested that the critic evaluate one of the statements from the matched statements
or from the code block near the matched comments. In one case, the critic system
con�rmed a statement before the programmer knew what the fault was.

116
The use of the critic system with grep complimented the critic's analysis capabil-
ities with the programmer's expertise in pattern recognition. The result was a coop-
erative problem-solving environment that signi�cantly improved debugging speed.
5.3 Questions about Debugging Critic
1. \Would any question and any hint also help overcome debugging pitfalls and
improve debugging speed?"
According to our follow-up pilot study on a \mock" critic system, the answer is
\no." A mock critic system was developed to pose questions about the program
that did not pertain to output statements, did not acquire failure symptoms,
and did not promote the use of the critic system. We studied three computer
science students who used Spyder with the mock critic system, program slicing
and break-and-examine assistance to debug the program Shipbook.c with the
fault of omission.
The results show that the programmers did not �nd the mock critic system
useful. The average helpfulness rating was 2.3. In comparison, the rating of
the real debugging critic from programmers who debugged the same version of
Shipbook.c was 8. In this pilot study, the mock critic system did not overcome
the �xation on the wrong location problem, as two out of three students identi-
�ed the wrong fault location. Programmers who debugged the same version of
Shipbook.c with only break-and-examine and slicing assistance debugged faster
(the average speed was 2.5 lpm) than the programmers who had additional
access to the mock critic system (the average speed was 1.5 lpm).
2. \Can a debugging critic work as a standalone tool? If so, how?"
The answer is \yes." Two out of thirteen programmers used the critic system
alone to �nd the fault. Both programmers used the critic system to indirectly

117
evaluate hypotheses about program behavior as well as formulate hypotheses
about a fault location.
To query about program states associated with a given location, the programmer
can hypothesize the location. For example, if the programmer hypothesizes
that a statement at line 100 does not execute, he can invoke the critic system
to evaluate line 100. If the critic system poses the question \The statement
at line 100 does not execute, should it?", then the programmer receives his
con�rmation. If the programmer hypothesizes that a statement at line 100 used
an erroneous value of variable var, he can invoke the critic system to evaluate
line 100. To help the programmer evaluate the statement, the critic system
would print values the statement used before its execution.
To trace to the cause of the newly acquire failure symptom, a programmer can
invoke the critic system to evaluate an alternative location it recommended.
The critic system would internally execute the hypothesized statement, display
the values used before the statement executes, and the values de�ned after
the statement executes. After the critic system evaluates the hypothesized
statement, it may acquire another failure symptom and recommend another
location. Thus, the tracing process can continue.
3. \Can a debugging critic operate when multiple faults are manifested under the
same test cases?"
The answer is \yes," although it is not predictable whether all faults that man-
ifested under the given test case can be found. We tried using the critic system
in the setting where we debugged our own program as we implemented it. In
this case, the program did contain several faults that were exposed by the same
test case. The critic system successfully helped us locate at least one fault for
each error-revealing test case. To �nd another fault, however, we had to �x the
one we found �rst, then use the critic system again.

118
5.4 Summary
This chapter described a debugging critic prototype added in to Spyder and an
experimental study based on this prototype. The results showed that programmers
can debug signi�cantly faster with a critic system. In our survey, the debugging critic
had the highest helpfulness rating among Spyder's features under test. The users of
our debugging critic recommended it as an extension to conventional debuggers.

119
6. CONCLUSIONS
The only limit to our realization of tomorrow will be our doubts of today.
{ Franklin D. Roosevelt
6.1 Support for Statement of Thesis
This dissertation presents a new debugging assistant, the Debugging Critic. A
debugging critic is an alternative to a debugging oracle. It answers \Is it conclusive
that the statement at location loc contains the fault that was manifested under the
given test case t?" by recognizing a fault-manifesting occurrence of either a fault of
commission or a fault of omission.
Given a hypothesized location of a statement and a test case, the critic system
can evaluate whether the statement contains the fault that causes a program to fail
under the given test case. The critic system does not rely on a formal speci�cation or
a knowledge base of a common fault pattern. Instead, it poses questions about the
statement and its occurrence to determine whether the statement at the hypothesized
location has a fault-manifesting occurrence, exhibits failure symptoms, or neither.
Because we identi�ed the characteristics of fault-manifesting occurrence for both fault
of commission and fault of omission, we can design the critic system to recognize the
location where either fault manifests.
To design an debugging assistant that can improve debugging speed, we conducted
empirical studies involving expert programmers who debugged a large program. The
results revealed debugging pitfalls and types of assistance to overcome them. The
design of our debugging critic incorporates the four types of assistance identi�ed:
120
con�rmation, explanation, hints, and questions. The results also helped us design the
proposed mechanisms to support the hypotheses evaluation process in ways that can
improve debugging speed:
Maintain knowledge about the program.
The critic system maintains two types of knowledge about the program: failure
symptoms and search spaces for a manifested fault. Failure symptoms are uni-
formly described for both erroneous variables and erroneous ow of control, as
opposed to application-speci�c special cases. The search space for a manifested
fault of commission is de�ned separately from the search space for a manifested
fault of omission.
The critic system's ability is enhanced as it acquires more symptoms. When the
evaluation process does not con�rm a fault location, it may yield new failure
symptoms that can de�ne and reduce the search spaces. A subsequent hypoth-
esis can be rejected without evaluating any of their execution occurrences when
the statement at the hypothesized location does not execute in either search
space.
Formulate an alternative hypothesis on fault location.
Based on a selected failure symptom, the critic system identi�es either prime
suspect statements as a possible fault of commission location or prime suspect
procedures as a possible fault of omission location. We de�ne execution path
slicing as a means for the critic system to identify statements whose occurrences
can cause the symptom and which appear in at least one of the search spaces.
The absence of statements that can cause the symptom indicates a fault of
omitted statements. The critic system can also hypothesize about the type of
missing statement with respect to the failure symptom.

121
Augment existing fault localization or fault recognition tools.
The critic system can augment an existing fault localization tool, program slic-
ing. Our experimental study of a debugging critic prototype showed that the
critic system can promote the programmer's use of knowledge from program
slices to locate faults without a long training period.
The critic system also augments an existing pattern-matching fault recognition
tool, grep. In our experiment, the programmers used grep with keywords re-
lated to program failure to quickly locate relevant code and comments. They
then selected one of the statements for the critic system to evaluate. This pro-
cess forms a cooperative problem-solving environment, where the programmer's
expertise in pattern recognition and the critic system's analysis capabilities are
combined to �nd the fault.
Our experimental study of a debugging critic prototype showed that programmers
who used it can overcome two debugging pitfalls: \�xation on the wrong location"
and \underuse" problems. As a result, these programmers debugged faster than pro-
grammers who had access to break-and-examine tools or both break-and-examine
tools and program slicing tools. Without our debugging critic, programmers un-
derused program slicing and/or could not overcome their �xation on an incorrect
location. The result of this experiment provides evidence to support our statement
of thesis.
6.2 Contributions
The research in this dissertation contributes to debugging and critic systems. In
debugging, our empirical studies of the debugging assistants and our experimental
study of a debugging critic contribute to the knowledge that an active debugging
assistant can e�ectively improve debugging performance. In addition to providing
information about the program, an active debugging assistant would use questions to

122
direct the programmers' focus, to help them develop fault-related hypotheses, and to
evaluate these hypotheses.
Another contribution is our approach to evaluate and formulate hypotheses on
fault location in the absence of formal speci�cation and knowledge base of faults,
especially our approach to locate and recognize locations with a manifested fault of
omission location. Each key component in our approach can form a foundation for
a future debugging assistant. First, characteristics of an omission-fault-manifesting
occurrence make it possible to design other fault localization techniques to locate
omitted statements. Second, our uniform representation of failure symptoms can be
used to de�ne failure symptoms in other failure modes, such as non-termination and
abnormal termination. A uniform failure symptom representation provides support
for a uniform failure analysis method. Third, execution path slicing methods can
be applied to design a variety of fault localization algorithms other than the binary
search algorithms.
In the critic system domain, one of the main concerns is how to present criti-
cism without o�ending users. The solution o�ered by our debugging critic is to use
questions. A question such as \The statement at L is not executed by this test case.
Should it be?" o�ers an informative and non-insulting criticism.
6.3 Future Research Directions
Large scale experimental evaluation of an automated debugging critic
The goal is to conduct experiments where our debugging critic is used in de-
bugging programs in natural settings. Several possibilities include testing the
e�ectiveness of a debugging critic when:
� programmers debug their own programs.
� programmers debug other's programs ranging in size from hundreds to
thousands of lines.

123
� programmers have access to the critic system during the program imple-
mentation phase.
� programmers have no access to any other debugging assistance except the
critic system.
It is desirable to conduct these experiments with a debugger that also supports
languages and features found in large software systems (such as preprocessor
statements) and also build a program dependency graph that depicts weak
dependency among statements [PC90]. It is also desirable to enhance our de-
bugging critic to evaluate and formulate hypotheses about transfer statements
and to become more active during the debugging process. The critic system
may interrupt a programmer when he repeatedly inspects locations on which
erroneous variables did not depend, and o�er to evaluate such locations.
Evaluation of a procedure as a possible fault location
There are two subgoals. The �rst subgoal is to minimize the the number of
program states and the number of values associated with the hypothesized pro-
cedure that the critic system would ask the programmers to evaluate. The
second subgoal is to de�ne methods to recognize when a procedure omits state-
ments.
Debugging critic with knowledge base of faults
The goal is to investigate how a knowledge base of faults can enhance a de-
bugging critic. Some possibilities include customizing questions to evaluate
locations where the code matches a fault pattern, and formulating and evalu-
ating hypotheses about fault identity. The enhanced critic system may be able
to check whether an existing set of failure symptoms is the consequence of the
hypothesized fault.

124
Debugging critic with test-based knowledge
The goal is to investigate how a test data set and other test-based knowledge
can enhance a debugging critic. Some possibilities include the added capability
to formulate and evaluate hypotheses about fault repair. The enhanced critic
system may be able to determine whether existing failure symptoms would
remain if the hypothesized repair is made. The enhanced debugging critic may
also identify the test cases that reveals when the hypothesized repair leads to a
new set of failure symptoms.
Fault localization algorithms for omitted statements
The goal is to extend our technique to locate omitted statements to also lo-
cate other types of statements beside assignment statements, procedure calls,
predicate statements, initialized statements, and output statements. The tech-
nique can also be extended to locate faults of omission that lead to abnormal
termination or non-termination.
6.4 Concluding Remarks
Our debugging critic dispels two myths about debugging. The �rst myth is that
it is impossible to con�rm a fault location because of the lack of detail and formal
speci�cation. Our research shows that failure symptoms and dependency analysis
can be used to con�rm the location of a statement with a fault, when only one fault
is manifested under a given test case. The second myth is that it is impossible to
de�ne a method to locate faults of omission. Our research shows that it is possi-
ble to locate procedures that omit assignment statements, procedure calls, predicate
statements, initialized statements, or output statements when the fault of omission
is manifested under the given test case. This research establishes a foundation for
debugging research in both areas.

LIST OF REFERENCES

125
LIST OF REFERENCES
[ADS91a] Hiralal Agrawal, Richard A. DeMillo, and Eugene H. Spa�ord. An Ex-ecution Backtracking Approach to Program Debugging. IEEE Software,pages 21{26, May 1991.
[ADS91b] Hiralal Agrawal, Richard A. DeMillo, and Eugene H. Spa�ord. ProgramSlicing in the Presence of Unconstrained Pointers. In Fourth ACM Sym-posium on Testing, Analysis, and Veri�cation, Victoria, Canada, October1991. ACM/IEEE-CS. Also issued as SERC Technical Report SERC-TR-93-P.
[AFC91] Keijiro Araki, Zengo Furukawa, and Jingde Cheng. A General Frameworkfor Debugging. IEEE Software, pages 14{20, May 1991.
[Agr91] Hiralal Agrawal. Towards Automatic Debugging of Computer Programs.PhD thesis, Purdue University, West Lafayette, IN, 1991.
[AL80] A. Adam and J. P. Laurent. LAURA:A system to debug student programs.Arti�cial Intelligence, 15:75{122, 1980.
[Bal69] R. M. Balzer. Exdams: Extendible debugging and monitoring system. InAFIPS Proceedings, Spring Joint Computer Conference, volume 34, pages567{580, Monvale, New Jersey, 1969.
[Bea83] Bert Beander. VAX DEBUG: An interactive, symbolic, multilingual de-bugger. SIGPLAN Notices, 18(8):173{179, August 1983.
[BH83] Bernd Bruegge and Peter Hibbard. Generalized Path Expressions: A HighLevel Debugging Mechanism. SIGPLAN Notices, 18(8):34{44, August1983.
[Boe81] Barry W. Boehm. Software Engineering Economics. Prentice-Hall, Inc.,Englewood Cli�s, New Jersey, 1981.
[Bro83] R. Brooks. Towards a theory of the comprehension of computer programs.International Journal of Man-Machines Studies, 18:543{554, 1983.

126
[CC57] William G. Cochran and Gertrude M. Cox. Experimental Designs. JohnWiley and Sons, Inc., New York, 1957.
[CC87a] Fun Ting Chan and Tsong Yueh Chen. AIDA - a dynamic data owanomaly detection system for pascal programs. Software Practice andExperience, 17(3):227{239, March 1987.
[CC87b] James S. Collofello and Larry Cousins. Toward automatic software faultlocalization through decision-to-decision path analysis. In Proceedings ofAFIP 1987 National Computer Conference, pages 539{544, 1987.
[Cen92] CenterLine Software, Inc., Cambridge, MA. CodeCenter User's Guide,1992.
[CR83] Lori A. Clarke and Debra J. Richardson. The Application of Error-Sensitive Testing Strategies to Debugging. In Proceedings of the ACMSIGSOFT/SIGPLAN Software Engineering Symposium on High-Level De-bugging, pages 45{52, August 1983.
[Dar90] Ian F. Darwin. Checking C Programs with Lint. O'Reilly and Associates,Inc., Sebastopol, CA, 1990.
[DLP79] R. A. DeMillo, R. J. Lipton, and A. J. Perlis. Social processes and proofsof theorems and programs. Communications of the ACM, 22(5):271{280,May 1979.
[DLS78] R. A. DeMillo, R. J. Lipton, and F. G. Sayward. Hints on test dataselection: Help for the practicing programmer. Computer, 11(4):34{43,April 1978.
[Duc87] Mireille Ducasse. Opium, An Extensible Tracer for Prolog, PrototypeDescription, Further Speci�cations. Technical report, ECRC, Arabellastr17, 800 Muenchen 81, West Germany, January 1987.
[Dun86] Kevin J. Dunlap. Debugging with Dbx. In Unix Programmers Manual,Supplementary Document. University of California, Berkeley, CA, April1986.
[Fis87] Gerhard Fischer. A Critic for Lisp. In Proceedings of the 10th Inter-national Joint Conference on Arti�cial Intelligence, pages 177{184, SanMateo, CA, 1987. Morgan Kaufmann.
[FM91] Gerhard Fischer and Thomas Mastaglio. A conceptual framework forknowledge-based critic systems. Decision Support Systems, 7:355{378,1991.
[FN88] Stephen Fickas and P. Nagarajan. Critiquing Software Speci�cation. IEEESoftware, pages 37{47, November 1988.

127
[FNO93] Gerhard Fischer, Kumiyo Nakakoji, and Jonathan Ostwald. Critics: Facili-tating Knowledge Deliver and Knowledge Construction in Integrate DesignEnvironment. In Expert Critiquing Systems, pages 115{124, Washington,D.C., July 1993. AAAI-93 Workshop Program, Eleventh National Confer-ence on Arti�cial Intelligence.
[GB85] M. E. Garcia and W. J. Berman. An Approach to Concurrent SystemsDebugging. In Proceedings of the Fifth International Conference on Dis-tributed Computing Systems, pages 507{514, Denver, CO, May 1985.
[Ger93] Abigail S. Gertner. Real-time Critiquing of Integrated Diagnosis/TherapyPlans. In Expert Critiquing Systems, pages 6{13, Washington, D.C., July1993. AAAI-93 Workshop Program, Eleventh National Conference on Ar-ti�cial Intelligence.
[Gol90] David M. Goldschlag. Proving proof rules: A proof system for concurrentprograms. In Proceedings of the 5th Annual Conference on ComputerAssurance, pages 95{101, 1990.
[Gou75] J. D. Gould. Some psychological evidence on how people debug com-puter program. International Journal of Man-Machines Studies, 7:151{182,March 1975.
[H�ag93] Sture H�agglund. A Framework for Expert Critiquing. In Expert CritiquingSystems, pages 1{5, Washington, D.C., July 1993. AAAI-93 WorkshopProgram, Eleventh National Conference on Arti�cial Intelligence.
[Har90] John Hartman. Understanding Natural Programs Using Proper Decom-position. Technical report, Univeristy of Texas at Austin, Austin, Texas78712, July 1990.
[HN90] Mehdi T. Harandi and Jim Q. Ning. Knowledge-Based Program Analysis.IEEE Software, January 1990.
[HRB90] Susan Horwitz, Thomas Reps, and David Binkeley. Interprocedural Slic-ing Using Dependence Graphs. ACM Transactions on Programming Lan-guages and Systems, 12(1):26 { 60, January 1990.
[Hua79] J. C. Huang. Detection of data ow anomaly through program instru-mentation. IEEE Transactions on Software Engineering, SE-5(3):226{236,May 1979.
[IEE83] IEEE Standard Glossary of Software Engineering Terminology, 1983. IEEEStd. 729-1983.
[Jac93] Daniel Jackson. Abstract Analysis with Aspect. In Proceedings of the1993 International Symposium on Software Testing and Analysis, pages19{27. ACM Press, 1993.

128
[Joh83] Mark Johnson, editor. Proceedings of the ACM SIGSOFT/SIGPLANSoftware Engineering Symposium on High-Level Debugging, volume 8, Pa-ci�c Grove, California, August 1983.
[Joh90] W. Lewis Johnson. Understanding and Debugging Novice Programs.Arti�cial Intelligence, 42:51{97, 1990.
[JS85] W. L. Johnson and E. Soloway. PROUST: Knowledge-Based ProgramUnderstanding. IEEE Transactions on Software Engineering, pages 267{275, March 1985.
[Kat79] H. Katso�. Sdb: a symbolic debugger. In Unix Programmer's Manual.University of California, Berkeley, CA, 1979.
[KL88] Bogdan Korel and Janusz Laski. STAD - a system for testing and debuging:User perspective. In Proceedings of the Second Workshop on SoftwareTesting, Veri�cation, and Analysis, pages 13{20, Ban�, Canada, July 1988.
[KL90] Bogdan Korel and Janusz Laski. Dynamic slicing of computer programs.Journal of Systems and Software, 13(3):187{195, November 1990.
[KLN91] W. Kozaczynski, E. Liongosari, and J. Ning. BAL/SRW: An AssemblerRe-Engineering workbench. submitted to Information and Software Tech-nology, 1991.
[KN89] W. Kozaczynski and J. Q. Ning. SRE: A Knowledge-Based Environmentfor Large Scale Software Re-Engineering Activities. In 11th InternationalConference on Software Engineering, pages 113{122, May 1989.
[Kor88] Bogdan Korel. PELAS - Program Error-Locating Assistant System. IEEETransactions on Software Engineering, 14(9):1253{1260, September 1988.
[Kup89] Ron I. Kuper. Dependency-Directed Localization of Software Bugs. Mas-ter's thesis, Massachusetts Institute of Technology, Massachusetts, May1989.
[Lam83] Leslie Lamport. Specifying Concurrent Program Modules. ACM Transac-tions on Programming Languages and Systems, 5(2):190{222, April 1983.
[Lam89] Leslie Lamport. A Simple Approach to Specifying Concurrent Systems.Communications of the ACM, 32(1):32{45, January 1989.
[Lau79] Soren Lauesen. Debugging techniques. Software Practice and Experience,9(1):51{63, January 1979.
[LeD85] C. H. LeDoux. A Knowledge-Based System for Debugging ConcurrentSoftware. PhD thesis, University of California, Los Angeles, December1985.

129
[Let87] Stanley Letovsky. Program Understanding with Lambda Calculus. InProceedings IJCAI-87, pages 512{514, Milan, Italy, 1987.
[LH85] Rense Lange and Mehdi T. Harandi. Human Engineering Aspects of a Pro-gram Debugging Expert System. In The IEEE Computer Society's NinthInternational Computer Software and Applications Conference, Chicago,IL, October 1985.
[Lip84] Myron Lipow. Prediction of Software Failure. The Journal of Systems andSoftware, 4(4):71{76, November 1984.
[Llo86] J. W. Lloyd. Declarative Error Diagnosis. Technical Report 86/3, Univer-sity of Melbourne, November 1986.
[LN92] J. L�owgren and T. Nordquist. Knowledge-Based Evaluation as DesignSupport for Graphical User Interfaces. In CHI'92, Monterey, 1992.
[LS83] C. P. Langlotz and E. H. Shortli�e. Adapting a Consultation Systemto Critique User Plans. International Journal of Man-Machines Studies,19:479{496, 1983.
[Luk80] F. J. Lukey. Understanding and Debugging Programs. International Jour-nal of Man-Machines Studies, pages 189{202, February 1980.
[LW87] J. R. Lyle and M. Weiser. Automatic Program Bug Localization by Pro-gram Slicing. In The Second International Conference on Computers andApplications, pages 877{883, Beijing, China, June 1987.
[Mil83] P. Miller. ATTENDING: Critiquing a Physician's Management Plan.IEEE Transactions on Pattern Analysis and Machine Intelligence,5(5):449{461, 1983.
[Mil88] Fatma Mili. Framework for a decision critic and advisor. In Proceedingsof the 21th Hawaii International Conference on System Sciences, pages381{386, 1988.
[MM83] J. Martin and C. McClure. Software Maintenance{The Problem and ItsSolution. Prentice-Hall, Inc., Englewood Cli�s, New Jersey, 1983.
[Mon91] Douglas C. Montgomery. Design and Analysis of Experiments. John Wileyand sons, Inc., New York, 1991.
[MW91] Thomas G. Moher and Paul R. Wilson. O�setting Human Limits withDebugging Technology. IEEE Software, pages 11{12, May 1991.
[Mye79] G. J. Myer. The Art of Software Testing. Wiley-Inter-Science, New York,1979.

130
[OO84] Karl J. Ottenstein and Linda M. Ottenstein. The program depen-dence graph in software development environments. SIGPLAN Notices,19(5):177{184, May 1984.
[Pan91] Hsin Pan. Debugging with Dynamic Instrumentation and Test-BasedKnowledge. Technical Report SERC-TR-105-P, Software Engineering Re-search Center, Purdue University, West Lafayette, IN, 1991.
[Pan93] Hsin Pan. Software Debugging with Dynamic Instrumentation and Test-based Knowledge. PhD thesis, Purdue University, West Lafayette, IN,1993.
[PC90] Andy Podgurski and Lori A. Clarke. A formal model of program de-pendences and its implications for software testing, debugging, and main-tenance. IEEE Transactions on Software Engineering, 16(9):965{979,September 1990.
[PL83] Michael L. Powell and Mark A. Linton. A Database Model of Debugging.SIGPLAN Notices, 18(8):67{70, August 1983.
[Pla86] Paul Placeway. Grep. In Unix Programmer's Manual. University of Cali-fornia, Berkeley, CA, May 1986.
[Pre82] Roger S. Pressman. Software Engineering: A Practitioner's Approach.McGraw-Hill Series in Software Engineering and Technology. McGraw-Hill,Inc., New York, 1982.
[Rag91] Sridhar A. Raghavan. JANUS A paradigm for active decision support.Decision Support Systems, 7:379{395, 1991.
[Ran93] Ivan Rankin. Generating Argumentative Discourse in Expert CritiquingSystems. In Expert Critiquing Systems, pages 35{43, Washington, D.C.,July 1993. AAAI-93 Workshop Program, Eleventh National Conferenceon Arti�cial Intelligence.
[RHC76] C. V. Ramamoorthy, S. F. Ho, and W. T. Chen. On the automated gener-ation of program test data. IEEE Transactions on Software Engineering,SE-2(4):293 { 300, December 1976.
[Rut76] G. R. Ruth. Intelligent Program Analysis. Arti�cial Intelligence, 7(1):65{85, 1976.
[RW88] Charles Rich and Richard C. Waters. ProgrammerApprentice: A ResearchOverview. Computer, pages 10{25, November 1988.
[Sch71] Jacob T. Schwartz. An overview of bugs. In Debugging Techniques inLarge Systems, pages 1{16. Prentice-Hall, Englewood Cli�s, New Jersey,1971.

131
[Sea71] S. R. Searle. Linear Models for Unbalanced Data. John Wiley, New York,1971.
[Sha81] D. G. Shapiro. Sni�er: A system that understands bugs. Technical ReportAI Memo 638, MIT Arti�cial Intelligence Laboratory, Cambridge, MA,1981.
[Sha83] E. Y. Shapiro. Algorithmic Program Debugging. MIT Press, Cambridge,MA, 1983.
[Sil91] Barry G. Silverman. Criticism-Based Knowledge Acquisition for Docu-ment Generation. In Proceeding of Conference on Innovative Applicationsof Arti�cial Intelligence, Cambridge, MA, 1991. AAAI Press/MIT Press.
[Sil92] Barry G. Silverman. Building a Better Critic: Recent Empirical Results.IEEE Expert, 7(2):18{25, April 1992.
[SKF91] Nahid Shahmehri, Mariam Kamkar, and Peter Fritzson. Semi-automaticbug localization in software maintenance. In Proceedings of the IEEE Con-ference on Software Maintenance, pages 246{252, San Diego, CA, Novem-ber 1991.
[SN88] R. L. Spickelmier and A. R. Newton. Critic: A Knowledge-Based Pro-gram for Critiquing Circuit Designs. In Proceedings of the 1988 IEEEInternational Conference on Computer Design: VLSI in Computers andProcessors, pages 324{327, Los Alamitos, CA, 1988. CS Press.
[Sol87] E. Soloway. \I can't tell what in the code implementswhat in the specs". InCognitive Engineering in the Design of Human-Computer Interaction andExpert Systems, pages 317{328. Elsevier Science Publishers, Amsterdam,Netherlands, 1987.
[STJ83] Robert L. Sedlmeyer, William B. Thompson, and Paul E. Johnson.Knowledge-based Fault Localization in Debugging. SIGPLAN Notices,18(8):25{31, August 1983.
[SV92] Eugene H. Spa�ord and Chonchanok Viravan. Experimental Designs:Testing a Debugging Oracle Assistant. Technical Report SERC-TR-120-P,Software Engineering Research Center, Purdue University,West Lafayette,IN, 1992.
[SV93] Eugene H. Spa�ord and Chonchanok Viravan. Pilot Studies on DebuggingOracle Assistants. Technical Report SERC-TR-134-P, Software Engineer-ing Research Center, Purdue University, West Lafayette, IN, March 1993.
[SW65] R. Saunders and R. Wagner. On-line debugging systems. In Proceedingsof the IFIP Congress, pages 545{546, 1965.

132
[Tra79] M. Tratner. A fundamental approach to debugging. Software Practice andExperience, 9(2):97{99, February 1979.
[Ven91] G. A. Venkatesh. The Semantic Approach to Program Slicing. SIGPLANNotices, 26(6):107{119, June 1991.
[Ves85] I. Vessey. Expertise in Debugging Computer Programs: A Process Analy-sis. International Journal of Man-Machines Studies, 23:459{494, 1985.
[Wei71] G. Weinberg. Psychology of Computer Programming. Van NostrandReeinhold Company, New York, 1971.
[Wei82] Mark Weiser. Programmers use slices when debugging. Communicationsof the ACM, 25(7):446{452, July 1982.
[Wei84] Mark Weiser. Program Slicing. IEEE Transactions on Software Engineer-ing, SE-10(4):352{357, July 1984.
[Wil90] Linda Mary Wills. Automated Program Recognition: A FeasibilityDemonstration. Arti�cial Intelligence, 45:113{171, 1990.
[WL79] Robert L. Williams and James D. Long. Toward a self-managed life style.Houghton Mi�in Company, Boston, Mass., 1979.
[YL88] S. Yau and S. Liu. Some Approaches to Logical Ripple E�ect Analysis.Technical Report SERC-TR-24-F, Software Engineering Research Center,Purdue University, Gainsville, FL, October 1988.
[ZSS89] H. Zhou, J. Simkol, and B. G. Silverman. Con�guration assessment log-ics for electromagnetic e�ects reduction (cleer). Naval Engineer Journal,101(3):127 { 137, May 1989.

APPENDICES

133
Appendix A: Data from Empirical Studies on Debugging Assistants
A.1 The faults used in the empirical studies
.
66
6 6
Error-revealing
Type
Failure
test data
Reference badpde pointersin mark ml()
pde to mark ml()from get chfn info()
Pass unde�ned
Missing de�nition
is empty
for pde whenGECOS �eld
Overwrite the same
in add home dir()
before freeing the
memory location
Faulty routine
Dangling pointersin home dir list
in edit()
Missing data de�nition
Wrong output
Missing data handling task
Add home directories
for multiple users
Causes ofFailures
get chfn info() edit()
Core dump
Empty GECOS �eld in
chfnadd �le
1 3
Forget to resetpde in home dir list to
point to the original entry
memory of copy of pde
Calling level
Correct �xes
- Initialize pde before
when pde is uninitialized- Do not call mark ml()
- Call change home dir()before freeing pde copy
#1 #2Faults
calling mark ml()
Chain of

134
A.2 The Measurements
1. Accuracy in hypotheses on fault location (ACLOC):
ACLOC =total faulty routines
total routines in search space
ACLOC is 0 if the search space omits the faulty routine. A search space is
regarded as a collection of hypotheses on fault location.
2. Accuracy in hypotheses on fault identity (ACID):
ACID =number of causes of failure identi�ed
total causes of failure
We describe the fault identity in a chain of causes of the program failure. Causes
of fault 1 and 2 are shown in Appendix A.1.
3. Accuracy in hypotheses on fault repair (ACFIX):
ACFIX =
8>>><>>>:
1; if correct solution;
:50; if solution with side e�ect;
0; Otherwise.
A solution is a repair made on one of the causes of failures (see Appendix
A.1). Thus, any repair that merely avoids the failures does not count. A print
statement that echos the known correct output, for example, is not considered
a solution.
4. Overall accuracy (AC):
AC = 33 �ACLOC + 33 �ACID+ 34 �ACFIX

135
5. The average accuracy in locating faulty routine (AACLOC):
AACLOC is the sum of ACLOC reported at end of each hour divided by the
number of hours.
6. The accuracy gained per hour (SPEED)
SPEED = 60 �AC
TIME
7. The actual time (TIME):
TIME is measured in minutes. This excludes (1) the time to copy over the
tar �le, expand it, compile and run Nu for the �rst time, (2) the time to write
fault-related hypotheses and mail it with the script at the end of each hour, and
(3) the break time. The consulting time with the oracle is included.
8. The estimated time taken to �x the fault correctly (ETIME):
ETIME = 100 �TIME
AC

136
A.3 The Result
1 2 3 4 5 6 7 8 9 10 11 12 13 14
FaultAssistant
1 2
1 2 1 2 3 4 5
Subjects
Assistant: 1 = no assistant, 2 = passive oracle assistant, 3 = active oracle assistant4 = OIQ assistant, 5 = I-only assistant
1 2 3 4 5 6 7 8 9 10 11 12 13 14
0100200300400500600700800
SUBJECT
ETIME
1 2 3 4 5 6 7 8 9 10 11 12 13 14
0
100
200
300
SUBJECT
TIME
Figure A.1 Debugging time comparison

137
0
50
100
150
1 2 3 4 5 6 7 8 9 10 11 12 13 14
SUBJECT
SP
EE
D
1 2 3 4 5 6 7 8 9 10 11 12 13 14
FaultAssistant
1 2
1 2 1 2 3 4 5
Subjects
Assistant: 1 = no assistant, 2 = passive oracle assistant, 3 = active oracle assistant4 = OIQ assistant, 5 = I-only assistant
1 2 3 4 5 6 7 8 9 10 11 12 13 140
50
100
ACLOCACID
ACFIX
SUBJECT
AC
1 2 3 4 5 6 7 8 9 10 11 12 13 140
50
100
SUBJECT
AA
CL
OC
Figure A.2 Debugging accuracy comparison

138
Appendix B: Proofs for Search Spaces on a Manifested Fault
This appendix presents proofs by contradiction that the search spaces de�ned for
a manifested fault contains a fault-manifesting occurrence.
B.1 Proof for Search Space for a Manifested Fault of Omission
Theorem: If a fault of omission is the only fault exposed by test case t, then
SSO(P; t) always includes a omission-fault-manifesting occurrence.2
Proof: Let L represent either a location of a procedure or a statement. Suppose
L contains a fault that is manifested as a fault of omission under test case t, but the
code at L
To prove by contradiction, we have to consider the following cases when the code
containing fault of omission is not executed in SSO(P; t). The code is either executed
or not executed in �t. If it is not executed, then it is not executed in SSO(P; t). If
it is executed in �t, �t may associate with no failure symptoms or at least one failure
symptom. If there is no failure symptom, SSO(P; t) is null and no code can execute
in it. If there is at least one failure symptom, SSO(P; t) is de�ned as �ttop;bottom
minus the execution occurrences that have already been evaluated to be non-fault-
manifesting occurrences. In this case, the code is not executed in SSO(P; t) when it
is executed before step top, is executed after step bottom, or all of its execution oc-
currences have already been evaluated to be non-fault-manifesting occurrences Thus,
there are �ve cases to contradict:
Case 1: The code at L is not executed.
In this case, the fault at L cannot be manifested. This contradicts the assump-
tion that a fault in L is manifested.

139
Case 2: Symptoms(P; t) is null.
In this case, the program P does not fail under test case t. This means no fault
is manifested under test case t, which contradicts the fact that L contains a
manifested fault.
Case 3: The code at L executes at step j where j > bottom
In this case, the failure symptom at step bottom can be observed before the
fault at L is manifested. This contradicts the assumption that only one fault is
manifested.
Case 4: The code at L executes at step j where j < top.
There are three cases.
1. j < 0: This is not possible, as zero is minimum step number.
2. sj�!stop maps an error-revealing state to a non-error revealing state.
This happens when coincidental correctness occurs. This means the fault
at L is not manifested into the output. Therefore, another fault is mani-
fested after step top. This contradicts the assumption that only one fault
is manifested.
3. L has an occurrence L(i;j) that is a fault-manifesting occurrence. As the
last state sn of an error-revealing test case, the execution occurrence of loc
from step top to n is fault-manifesting. This contradicts the assumption
that only one fault is manifested.
Case 5: All occurrences of the code at L have already been evaluated as non-fault-
manifesting occurrences.
This condition contradicts the assumption that an occurrence of the code at L
is an omission-fault-manifesting occurrence.
140
B.2 Proof for Search Space for a Manifested Fault of Commission
Theorem: If a fault of commission is the only fault exposed by test case t, then
SSC(P; t) always includes a commission-fault-manifesting occurrence.
Proof: Let L represent the location of a statement. Suppose L contains a fault
that is manifested as a fault of commission under test case t, but it is not executed
in SSC(P; t).
To prove by contradiction, we consider the following cases when the code contain-
ing the fault of commission is not executed in SSC(P; t). The statement is either
executed or not executed in �t. If it is not executed, then it is not executed in
SSC(P; t). If it is executed in �t, �t may associate with no failure symptoms or at
least one failure symptom. If there is no failure symptom, SSC(P; t) is null and no
statement can execute in it. If there is at least one failure symptom Symptoms(P; t)
either includes or does not include a symptom of an erroneous variable.
If Symptoms(P; t) includes a symptom of an erroneous ow of control only, then
SSC(P; t) is de�ned as statement occurrences in search path �ttop;bottom minus state-
ment occurrences that have been evaluated to be non-fault-manifesting occurrences.
In this case, a statement is not executed in SSC(P; t) when it is executed before step
top, is executed after step bottom, or all of its execution occurrences have already
been evaluated to be non-fault-manifesting occurrences.
If Symptoms(P; t) includes one or more symptoms of erroneous variables, then
SSC(P; t) is de�ned as statement occurrences in the intersection of static path slices
of all erroneous variables, minus statement occurrences that have been evaluated to
be non-fault-manifesting occurrences. In this case, a statement is not executed in
SSC(P; t) when a statement does not executes in a static path slice of at least one
erroneous variable or all of its execution occurrences have already been evaluated to
be non-fault-manifesting occurrences.
Thus, there are six cases to contradict:

141
Case 1: The code at L is not executed.
In this case, the fault at L cannot manifest itself. This contradicts the assump-
tion that L contains a manifested fault.
Case 2: Symptoms(P; t) is null.
In this case, the program P does not fail under test case t. This means no fault
is manifested under test case t, which contradicts the fact that L contains a
manifested fault.
Case 3: The code at L is not executed in the search path �ttop;bottom.
In this case, the proof by contradiction is the same as for Case 3 and 4 in
Appendix B.1.
Case 4: The statements at L do not belong to the static slice of any erroneous
variable in Symptoms(P; t).
In this case, the statements at L can a�ect erroneous variables only when L
contains a missing dependency statement. Threfore, the fault at L is manifested
as a fault of omission. This contradicts the assumption that the fault at L is
manifested as a fault of commission.
Case 5: The statement at L is in a static slice of an erroneous variable var1 but is
not in a static slice of an erroneous variable var2.
There are two cases.
� The statement at L causes only var1, not var2, to have an erroneous value.
This means another fault is manifested to cause var2 to be erroneous. This
contradicts the assumption that only one fault is manifested.
� The statements at L causes both var1 and var2 to have erroneous values.
This can happen when L contains a missing dependency statement with
respect to var2 and is an extra dependency statement with respect to var1.

142
In our context, the fault at L is manifested as a fault of omission. This
contradicts the assumption that it is manifested as a fault of commission.
Case 6: All occurrences of the code at L have already been evaluated as a non-fault-
manifesting occurrence.
This condition contradicts the assumption that an occurrence of the code at L
is a commission-fault-manifesting occurrence.

143
Appendix C: Survey from Experimental Study on Debugging Critic
C.1 Spyder Survey Form
Please let me know how each of Spyder's features help you debug faster.
Put N/A if the feature was disabled. Put N/U if the feature was enabled,
but you did not use it.
Features Degree of helpfulness Would you like to see(range from 0 to 10, this feature added on towhere 0 = no help and conventional debuggers10 = the most help) like dbx? (YES/NO)
1) Evaluate a location(Debugging critic)
2) Program slicing:(r-defs, c-preds,d-slice, c-slice,program-slice)
3) Operations on slices:(add, subtract,intersect, swap,save)
4) Break operations:(stop in slice)
5) Grep
6) Print multiple valuesbefore or after executinga line without havingto select a variablename
7) Print from menu
8) Maintain records onerror information

144
C.2 Survey Results
The survey results were calculated from 37 out of 39 programmers. One program-
mer did not �ll out the survey; the other provided a descriptive answer instead of a
numerical rating.
Table C.1 Average helpfulness rating of Spyder features
Features Group 1 Group 2 Group 3
Critic N/A N/A 8.5385
Record error info N/A N/A 5.0000
Grep N/A N/A 6.6923
Slicing N/A 1.4615 3.0000
Slice operations N/A 0.6923 0.6154
Multiple breaks 7.2727 5.6154 4.4615
Print before/after 8.1818 6.8460 6.6154
Print from menu 2.8182 3.8461 2.6923
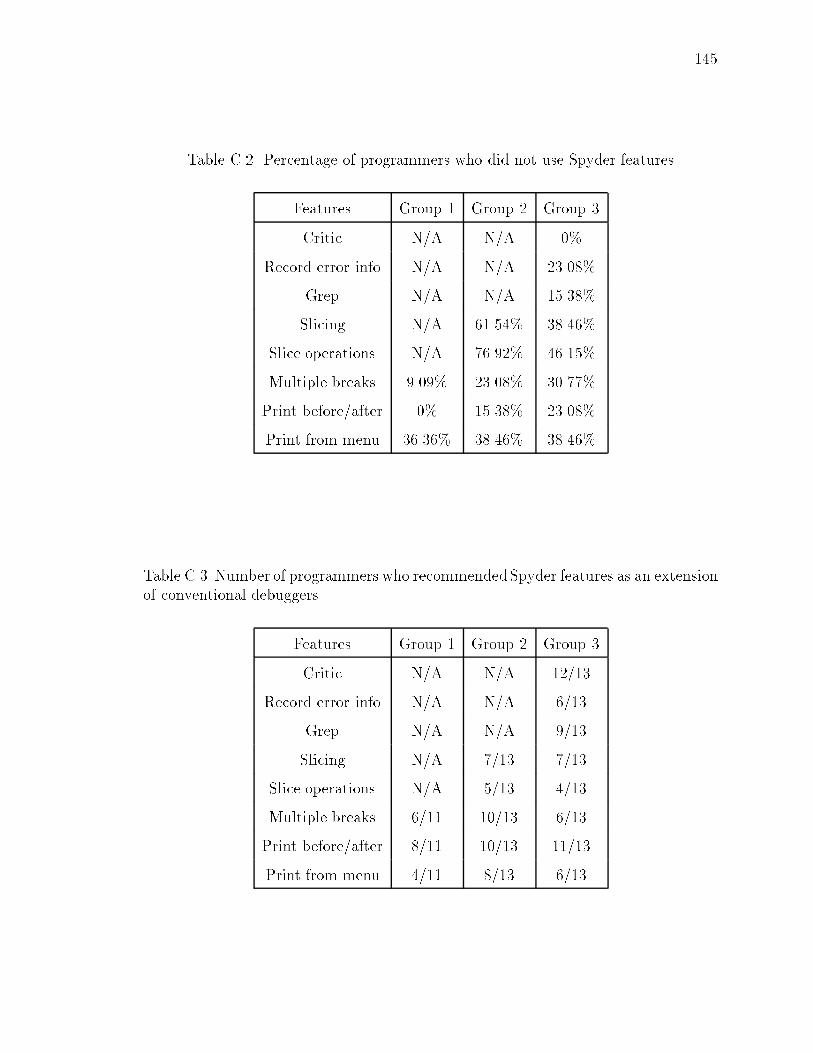
145
Table C.2 Percentage of programmers who did not use Spyder features
Features Group 1 Group 2 Group 3
Critic N/A N/A 0%
Record error info N/A N/A 23.08%
Grep N/A N/A 15.38%
Slicing N/A 61.54% 38.46%
Slice operations N/A 76.92% 46.15%
Multiple breaks 9.09% 23.08% 30.77%
Print before/after 0% 15.38% 23.08%
Print from menu 36.36% 38.46% 38.46%
Table C.3 Number of programmers who recommended Spyder features as an extensionof conventional debuggers
Features Group 1 Group 2 Group 3
Critic N/A N/A 12/13
Record error info N/A N/A 6/13
Grep N/A N/A 9/13
Slicing N/A 7/13 7/13
Slice operations N/A 5/13 4/13
Multiple breaks 6/11 10/13 6/13
Print before/after 8/11 10/13 11/13
Print from menu 4/11 8/13 6/13

VITA

146
VITA
Chonchanok Viravan was born in Bangkok, Thailand. She entered the University
of South Carolina in August, 1980. While completing her Bachelor of Science degree,
she was initiated into three honor societies: Phi Beta Kappa, Gamma Beta Phi,
and Phi Eta Sigma. In the 1982-1983 academic year, she was the vice-president of
Gamma Beta Phi honor society and was a recipient of a President's scholarship from
the University of South Carolina. From 1981-1983, she was on the National Dean's
list. She received her Bachelor of Science degree (magna cum laude) in Computer
Science from the University of South Carolina in May, 1983.
She entered graduate school at Purdue University in August 1983 and received her
Master of Science degree in Computer Sciences in May, 1985. She began her research
in software debugging under the supervision of Dr. Eugene Spa�ord in January 1991.
She received her Ph.D. degree in May, 1994.
Her current interests are in critiquing systems, software debugging, software en-
gineering, and arti�cial intelligence.