entorf lauk peer effects - gwdgwebdoc.sub.gwdg.de/ebook/serien/lm/cege/57_entorf_lauk.pdf · 5 rs =...
TRANSCRIPT
ISSN 1439-2305
CeGE-Discussion Paper
57
Horst Entorf Martina Lauk
Peer Effects, Social Multipliers and Migrants at School:
An International Comparison
GEORG-AUGUST-UNIVERSITÄT GÖTTINGEN
July 2006
1
Peer Effects, Social Multipliers and Migrants at School: An International Comparison1
Horst Entorf, Martina Lauk
Darmstadt University of Technology
June 2006 Abstract: This article analyses the school performance of migrants dependent on peer groups in different international schooling environments. Using data from the international OECD PISA test, we consider social interaction within and between groups of natives and migrants. Results based on social multipliers (Glaeser et al. 2000, 2003) suggest that both native-to-native and migrant-to-migrant peer effects are higher in ability-differencing school systems than in comprehensive schools. Thus, non-comprehensive school systems seem to magnify the prevailing educational inequality between students with a low parental socioeconomic migration background and children from more privileged families. Students with a migration background and a disadvantageous parental status benefit from higher diversity within schools.
JEL Classification: I21 Key words: Peer effects, migration, education, social multipliers, school systems, parental socioeconomic background Corresponding Author: Horst Entorf Darmstadt University of Technology Department of Economics Marktplatz 15 64283 Darmstadt Germany Email: [email protected]
1 This paper is prepared as contribution to the research output of Module B2 of the Study Group ‘Diversity, Integration and the Economy’. We thank the Volkswagen Foundation (VolkswagenStiftung) for financial support. We are grateful to Christina Boswell and Peter Mueser as well as participants of the HWWI Study Group meetings for helpful comments on an earlier version of this paper. Paper presented at the CeGE Re-search Workshop on June 29, 2006.
2
1. Introduction
Recent research based on the data of the Programme for International Student Assessment (PISA) revealed that the performance of children with a parental migration background differs strongly across nations. The reasons for these internationally differing performances of migrant students are not clear and rarely discussed in the literature. Most of the existing contributions focus on the relatively poor socioeconomic background of migrants (see, among others, Gang and Zimmermann, 2000, Frick and Wagner, 2001, Ammermüller 2005). In some countries, the parental effect on the schooling performance of children is reinforced by a particularly low intergenerational educational transmission. Entorf and Minoiu (2005) show that for both migrants and non-migrants so called socioeconomic gradients, i.e. the degree of intergenerational correlation, are relatively high in Germany, the UK and the US, whereas they are much smaller in Finland, Sweden and Canada. Stanat (2003) and Baumert et al. (2003) argue that in almost no other country social and ethnic background seems to determine student achievement as much as in Germany. Van Ours and Veenman (2003) and Bauer and Riphahn (2004) compare the intergenerational education transmission of natives and immigrants in the Netherlands and Switzerland, respectively. Bauer and Riphahn (2004) conclude that for immigrants, even after controlling for various characteristics, the probabilities of high education among those with poorly educated parents are only one third of those with well educated parents, whereas van Ours and Veenman (2003) found that natives and immigrants do not differ in intergenerational education transmission. Results in Entorf and Minoiu (2005) reveal that the very high PISA scores of migrant students from the traditional countries of immigration Australia, Canada, and New Zealand are not surprising given the high socioeconomic status of selected business migrants in these countries.
Some authors discuss whether, in addition, the early tracking into different-ability schools at age 10 as in Austria and Germany might have consequences for efficiency and distribution of educational outcomes (see Dustmann, 2004, for a critical assessment of the selective German school systems, and Hanushek and Wössmann, 2005, for recent econometric evidence). Educational researchers argue that the system of early differentiation by skill level has a negative impact on the school performance of children who come to school with language and social deficits, a high proportion of whom come from families with migration background. Early division may not give these children the basic skills before they are separated into the better or weaker school systems.
It thus seems that poor results of badly integrated children from socially less advantaged families and schooling systems contribute to the problem of poor migrant school performance. However, theory is inconclusive about the impact of tracking on both the level and distribution of schooling outcomes (see Doppelsteen et al, 2002, Epple et al. 2002, Brunello and Giannini, 2004, and Meier 2004; see Hanushek and Wössmann 2005 for a survey of main arguments of this literature) and predictions of the overall effect of schooling

3
systems seems to depend on the social interaction between high and low ability students and resulting peer effects. On the one hand, if individuals are better off with peers of their own ability level, ability grouping could improve the level of performance. On the other hand, heterogeneous classrooms might give rise to efficiency because less gifted students benefit from the social interaction with high ability peers.
Given its importance for individual student achievements, it is not surprising that there is a rapidly growing literature on peer effects and social interaction in schooling (Hoxby 2000, Sacerdote 2001, Levin 2001, McEwan 2003, Hanushek et al. 2003, Robertson and Symons 2003, Winston and Zimmerman 2003, Angrist and Lang 2004, Lalive and Cattaneo 2004, Frölich and Michaelowa 2005, Fertig 2003, and Schneeweiss and Winter-Ebmer 2005), with the latter two articles especially dealing with PISA data. Most of the aforementioned studies find significant peer effects.
In this article we investigate the role social integration of migrants plays for their schooling achievements in selected nations. More specifically, we estimate and compare peer effects based on the idea of social mulipliers (Glaeser and Scheinkman, 2000, and Glaeser et al. 2003) for migrant and non-migrant students and study the impact of social interaction on PISA scores. If lacking integration is a problem, social interaction would mainly take place within the group of migrants on the one hand and within the separated group of natives (and not across these groups) on the other hand and we would expect that such a form of segregation would lead to strong migrant-to-migrant peer effects, whereas the native-to-migrant effect would be expected to be low (analogous results should be observed for native-to-native and migrant-to-native peer effects). As argued above, the question of peer effects cannot be disentangled from the influence of prevailing national schooling systems. We test the hypothesis that early tracking reinforces segregation effects such that migrants from nations such as Austria, Germany and Switzerland, who mainly attend the lowest-level secondary school (e.g. the German ‘Hauptschule’), should receive relatively low peer effects from separated high-ability natives of the same age. This would lead to adverse peer effects in the sense that prevailing differences between children from families which a disadvantaged (migration) background and more advantaged families would be amplified. Our results confirm this hypothesis.
This article is organized as follows. Section 2 presents the theoretical framework of analysing social multipliers. After presenting the data in Section 3, we describe the degree of educational segregation for several groups of countries in Chapter 4. Econometric results and resulting direct and indirect social multipliers are presented in Section 5. Section 6 summarizes results and provides some conclusions.
4
2. Identification of peer effects and social multipliers
Econometric research on the identification of peer effects has been strongly influenced by Manski’s (1993, 1995, 2000) work on the social reflection problem and endogenous effects. The existence of positive externalities from social interaction requires that individual student i’s achievement will improve the achievement of student j, and that this impulse will propagate throughout the class room or school, finally leading to a multiplier effect of the exogenous change. Theoretical research by Glaeser and Scheinkman (2000) and Glaeser et al. (2003) focuses on the identification of these so called ‘social multipliers’ and their dependence on segregation. Sacerdote (2001) has applied this approach and found significant multipliers effects for Dartmouth roommates.
Extending the basic framework of Glaeser et al. (2000, 2003) to a two-equation system, we estimate the impact of student achievements of peer groups on individual PISA scores and calculate resulting social multipliers. Potential asymmetries between migrants and natives are considered by estimating effects in separate group-specific regressions equations. Each (migrant and native) student can be influenced by the average achievements of both peer groups, i.e. from both migrants and natives.
Peer effects and multipliers depend on the social background of peer groups and thus on the migrant population and schooling systems. We therefore employ evidence from different groups of countries to study the heterogeneity of peer effects in response to national peculiarities. We select four different groups: a) traditional countries of immigration with highly qualified ‘business migrants’: Australia, Canada, New Zealand, b) countries of ‘labour migration’ and non-comprehensive school systems: Austria, Germany, Switzerland, c) countries of ‘labour migration’ and comprehensive school systems: Denmark, Sweden, Norway, d) countries of Central and Eastern Europe: Czech Republic, Hungary, Russia.
Based on theoretical and econometric considerations mentioned above and below, individual PISA scores of migrants and natives are modelled as
(1) β δ γ γ ε
β δ γ γ ε
= + + + +
= + + + +
' ' ,
' ' ,s s s
s s s
m m m m m m n mi s i s s m s n s i s
n n n n m n n ni s i s s m s n s i s
P X R P P
P X R P P
where
s = 1, , ,S =S number of schools in national sample
si = 1, , ,sn sn = number of students at school s
s
mi sP = PISA score of migrant student si at schools s
s
ni sP = PISA score of native student si at schools s
si s
X = vector of student-specific explanatory variables
5
sR = vector of school-specific factors (‘resources’) at school s
jsP = average PISA score for schools, disregarding contribution of is ,
j = m, n. Peer effects are estimated at the school level (PISA data do not include class identifiers). The
parametersγ jk , j, k = m, n, measure the degree of social interaction. The higherγ j
k is, the
larger the impact of the respective average peer group on individual achievements is. In
econometric estimations, averages jsP , j = m, n, are calculated without the individual
contribution of the endogenous achievement of student is. Equation (1) is estimated for migrants and natives of all four country groups presented above.
Equation (1) follows along the lines of Manski (1993, 1995, 2000) and Glaeser et al. (2000, 2003), who provided the theoretical framework for the description and identification of social interaction and social multipliers. Manski has drawn attention to the fact that individual behaviour not only reacts to exogenous individual characteristics of the individual herself, but also to actions and characteristics of other individuals in the relevant group in which interaction takes place. In more detail, Manski distinguishes between exogenous individual effects, endogenous effects, correlated exogenous group effects and correlated environmental effects. Applied to schooling problems (see also Cipollone and Rosolia 2003, Lalive and Cattaneo 2004, Schneeweiss and Winter-Ebmer 2005), exogenous individual effects arise due to characteristics such as gender, parental income or education etc. Endogenous effects are described by the process of social interaction: Student achievement depends positively on the average achievement of the peer group. Obviously, omitting average achievements in regressions of student achievements would cause an omitted variable bias. However, including the result of the peer group might lead to a classical simultaneity bias because the result of the group is influenced by the achievement of the student in question. Thus, there is a trade-off between two potential sources of biases. As we are mainly interested in estimating social multipliers and parameters of social interaction, we need to include the student achievements of peer groups (see Glaeser et al., 2000, 2003, see also below). As a consequence, we have to omit exogenous group averages from our regression model because they would be perfectly collinear with the achievement of the peer groups (see, for instance, Manski 1995). Inclusion of observed mean group achievements allows us to control for unobserved group effects such as the general level of empathy within classes, delinquent peers, love or lack of love from parents, pedagogical talents of parents etc. To reduce the problem of simultaneity, we calculate average peer group achievements by omitting the contribution of student i to the peer group average.
Correlated environmental effects arise because students share similar environments such as common teachers, schooling resources or geographical location. Unlike group effects stemming from averaging individual exogenous effects, correlated environmental effects hint
6
at factors common to all students of a group as a source of within-group homogeneity and between-group heterogeneity.
Econometric results might also suffer from some sorting bias. This arises when students (or their parents) select themselves into schools and peer groups. If some sorting process lead better students to choose better schools, peer effects might be overestimated. We try to reduce this bias by controlling for rich information on students’ individual family backgrounds, i.e. by considering observable causes of sorting, and by including school-specific effects such as student-teacher ratios, share of students with a migration background or variables indicating some school-specific problem with command of national languages. In the case of Germany, for instance, the best way of avoiding the sorting bias would be to control for types of school (i.e. ‘Hauptschule’, ‘Realschule’ and ‘Gymnasium’). Unfortunately, this information is not available.
The identification of social multipliers is possible by aggregating individual results within groups, i.e. schools (see Glaeser et al., 2000, 2003). Assuming that average peer groups achievements are calculated including student si as an approximation, aggregation of both
individual migrant and native students within school s leads to
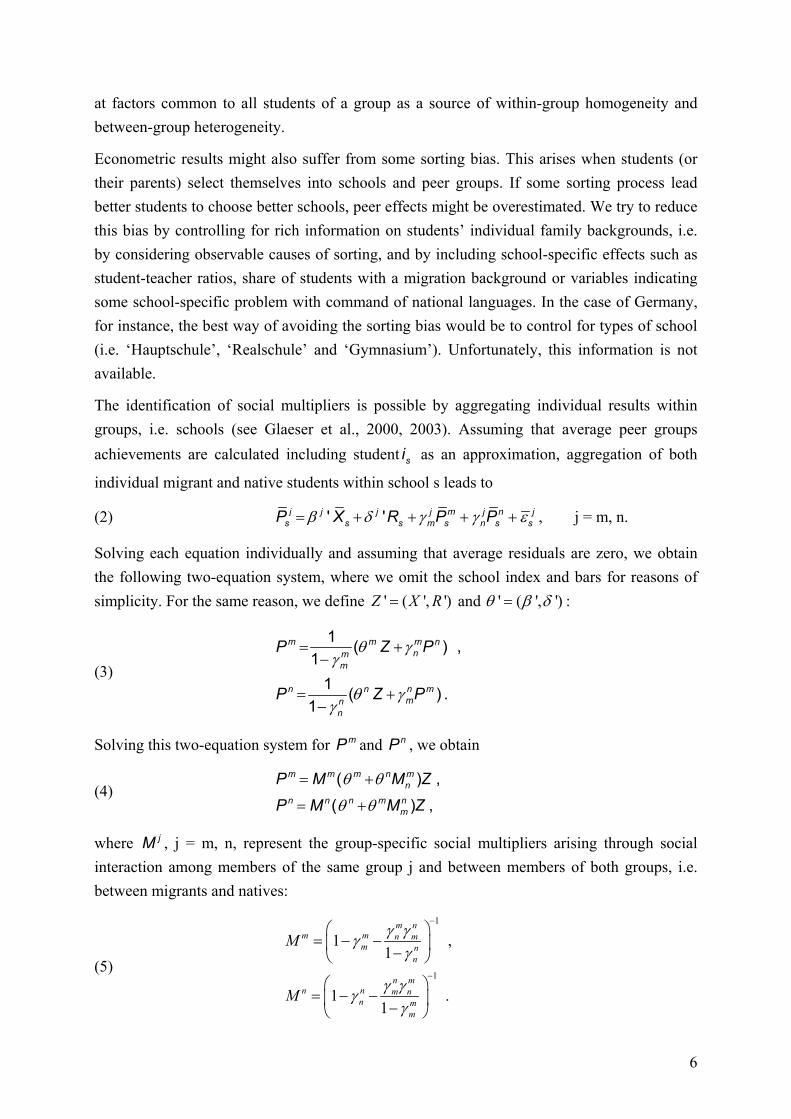
(2) β δ γ γ ε= + + + +' 'j j j j m j n js s s m s n s sP X R P P , j = m, n.
Solving each equation individually and assuming that average residuals are zero, we obtain the following two-equation system, where we omit the school index and bars for reasons of simplicity. For the same reason, we define ' ( ', ')Z X R= and ' ( ', ')θ β δ= :
(3) θ γ
γ
θ γγ
= +−
= +−
1 ( ) ,1
1 ( ) .1
m m m nnm
m
n n n mmn
n
P Z P
P Z P
Solving this two-equation system for mP and nP , we obtain
(4) θ θ
θ θ
= +
= +
( ) ,( ) ,
m m m n mn
n n n m nm
P M M ZP M M Z
where jM , j = m, n, represent the group-specific social multipliers arising through social interaction among members of the same group j and between members of both groups, i.e. between migrants and natives:
(5)
1
1
1 ,1
1 .1
m nm m n m
m nn
n mn n m n
n mm
M
M
γ γγγ
γ γγγ
−
−
= − − −
= − − −
7
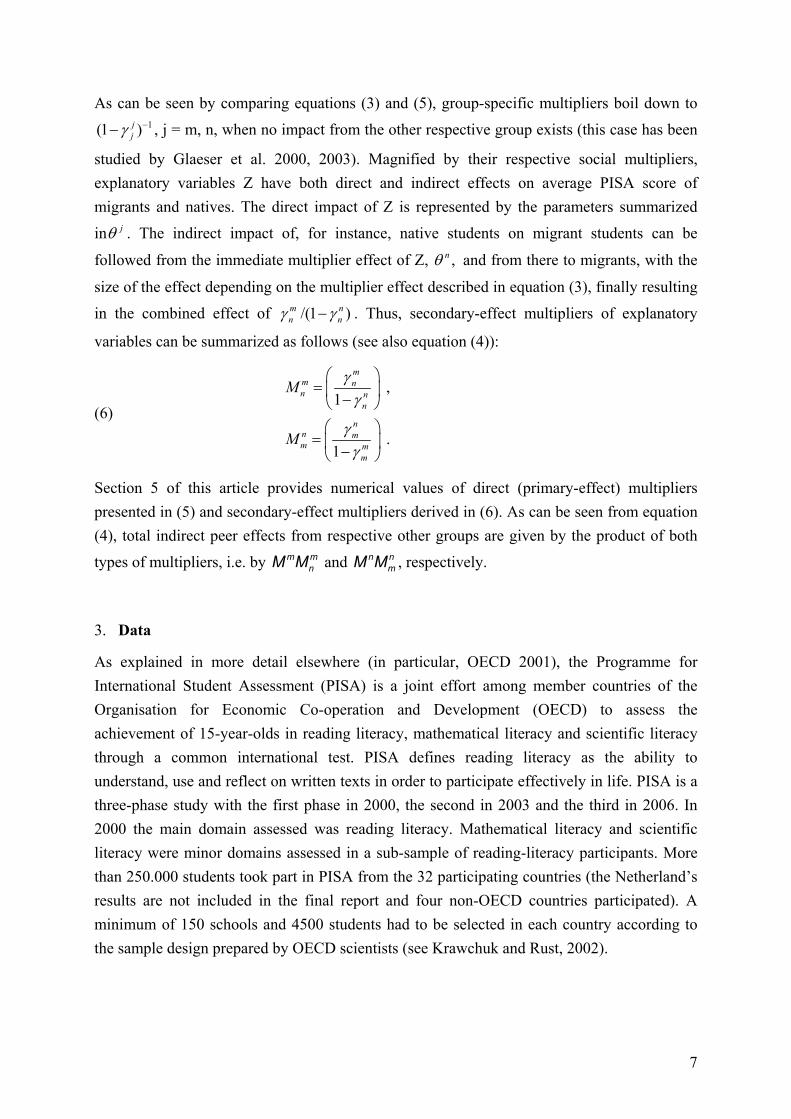
As can be seen by comparing equations (3) and (5), group-specific multipliers boil down to 1(1 )j
jγ−− , j = m, n, when no impact from the other respective group exists (this case has been
studied by Glaeser et al. 2000, 2003). Magnified by their respective social multipliers, explanatory variables Z have both direct and indirect effects on average PISA score of migrants and natives. The direct impact of Z is represented by the parameters summarized
in jθ . The indirect impact of, for instance, native students on migrant students can be
followed from the immediate multiplier effect of Z, ,nθ and from there to migrants, with the
size of the effect depending on the multiplier effect described in equation (3), finally resulting
in the combined effect of /(1 )m nn nγ γ− . Thus, secondary-effect multipliers of explanatory
variables can be summarized as follows (see also equation (4)):
(6) ,
1
.1
mm nn n
n
nn mm m
m
M
M
γγ
γγ
= −
= −
Section 5 of this article provides numerical values of direct (primary-effect) multipliers presented in (5) and secondary-effect multipliers derived in (6). As can be seen from equation (4), total indirect peer effects from respective other groups are given by the product of both
types of multipliers, i.e. by m mnM M and n n
mM M , respectively.
3. Data
As explained in more detail elsewhere (in particular, OECD 2001), the Programme for International Student Assessment (PISA) is a joint effort among member countries of the Organisation for Economic Co-operation and Development (OECD) to assess the achievement of 15-year-olds in reading literacy, mathematical literacy and scientific literacy through a common international test. PISA defines reading literacy as the ability to understand, use and reflect on written texts in order to participate effectively in life. PISA is a three-phase study with the first phase in 2000, the second in 2003 and the third in 2006. In 2000 the main domain assessed was reading literacy. Mathematical literacy and scientific literacy were minor domains assessed in a sub-sample of reading-literacy participants. More than 250.000 students took part in PISA from the 32 participating countries (the Netherland’s results are not included in the final report and four non-OECD countries participated). A minimum of 150 schools and 4500 students had to be selected in each country according to the sample design prepared by OECD scientists (see Krawchuk and Rust, 2002).
8
4. Characterisation of migrants and segregation across schools: International Evidence
To cover the heterogeneity of schooling systems and types of migrants, we selected data from 12 countries. A first group of countries consists of the traditional countries of immigration Australia, Canada and New Zealand. These countries follow an immigration policy that seeks to admit selected applicants with high education, good language skills and the flexibility to contribute to the countries’ human resources by quickly and efficiently matching their skills with opportunities in these countries. Perhaps not surprisingly, these three countries ranked second (Canada), third (New Zealand) and fourth (Australia) in the ranking of the OECD PISA 2000 reading test (see Entorf and Minoiu, 2005, for the importance of the immigration policy in these counties on schooling achievements).
The second group consists of ‘Scandinavia’ which is represented by Denmark, Norway and Sweden in our data set. The schooling system in these countries is different from the one in Austria, Germany and Switzerland which represent our third group of countries. Whereas Scandinavian countries keep their entire secondary-school system comprehensive, Austria, Germany and Switzerland track students into different-ability schools. In Austria and Germany selection takes place by age 10.2 Migrants in both groups of countries can be characterised as ‘labour migrants’ with a relatively low socioeconomic status as opposed to ‘business migrants’ in the traditional countries of immigration (see Entorf and Minoiu, 2005).
The Czech Republic, Hungary and Russia are united in a fourth group representing countries from Central and Eastern Europe. Here, migratory trends have quickly been shifting towards those typical of the developed western world. Romanians, Slovaks, Ukrainians, Vietnamese and Poles are the most important source countries of immigration to the Czech Republic and Hungary (see IOM 2004, Juhasz 2003), whereas the influx of ethnic Russians from eastern states (Kazakhstan, eastern Ukraine, Uzbekistan and Kyrgyzstan) and Baltic states (Estonia, Latvia) of the former Soviet Union form the majority of migrants to Russia (Heleniak 2002). However, although immigration problems are increasingly important in these countries, the share of migrants is still small relative to the one in the other groups (see Table 1).
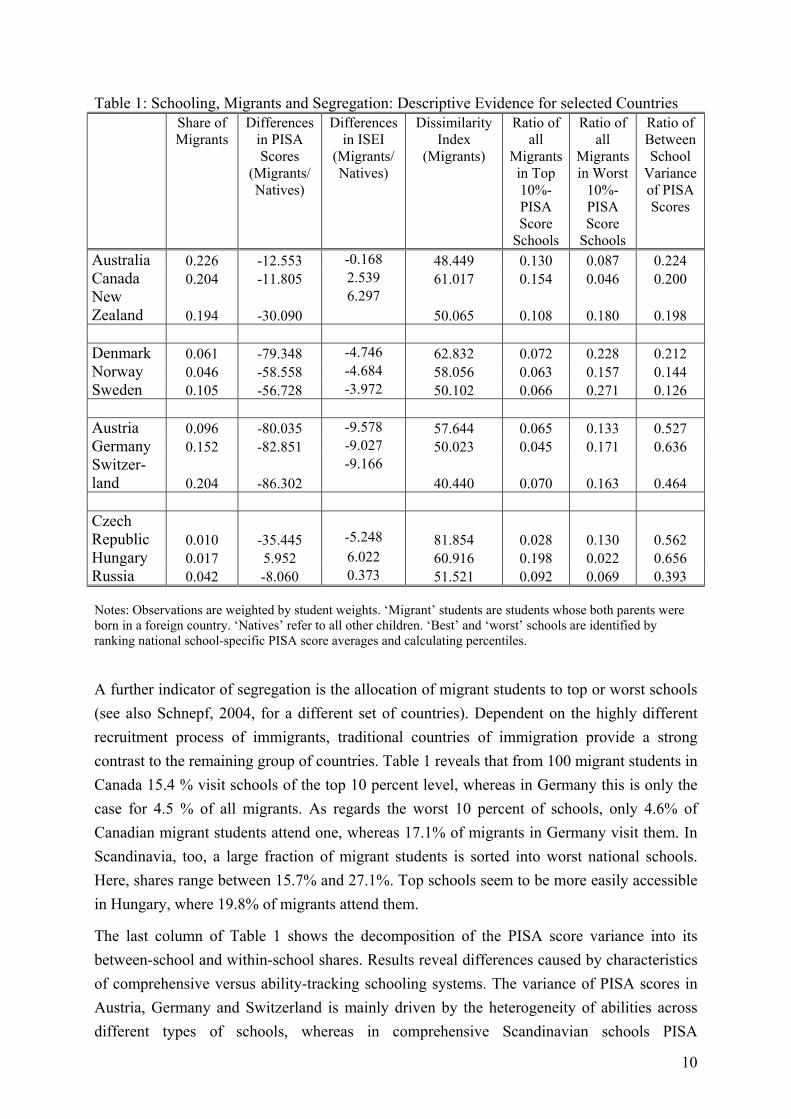
Before estimation results are presented in Section 5, Table 1 gives some descriptive information on migrants, their schooling achievements (PISA reading literacy) and the degree of educational segregation across schools. The share of migrants (defined as students both of whose parents were born abroad) in selected western countries ranges between 4.6% in Norway and 22.6% in Australia, whereas ratios in Eastern and Central Europe range between 1.0% and 4.2%. The overall impression is that the share of migrants in traditional countries of immigration is significantly above the share of migrants in all other countries.
2 In Austria, Germany and Switzerland, there are 4 school types available to 15-year-olds, whereas in Denmark, Sweden and Norway only one comprehensive school exists. The first age of selection in the education system is 10 in Austria and Germany, 15 in Switzerland, and 16 in all Scandinavian countries (OECD 2004, p. 262, Figure 5.20a).

9
The selective immigration mechanism prevailing in Australia, Canada and New Zealand leads to a parental socioeconomic background of migrants (measured by ISEI, i.e. the International Socio-Economic Index of Occupational Status, see below) that is comparable or even higher than the socioeconomic background of natives (see column 3 of Table 1). Given the general intergenerational transmission of education, it is thus not surprising that for this group of countries differences in PISA scores between migrant and native students are smaller than in Western European countries of ‘labour migration’. Within the latter groups, migrants from countries with non-comprehensive systems (Austria, Germany, Switzerland) have lower average scores (differences are below –80.0) than migrants in comprehensive Scandinavian schooling systems (differences range between –56.7 and –79.3). However, once again, comparisons between groups are biased without considering the different socioeconomic background of parents. Measured in terms of ISEI, immigrants in Scandinavia have a significantly lower socioeconomic gap with respect to natives than in Austria, Germany and Switzerland. PISA scores of migrants in Eastern and Central Europe, finally, do not differ all that much from the performance of natives, with the slight exception of the Czech Republic.
Segregation and high clustering of migrants in neighbourhoods might have a negative impact on immigrants’ educational achievement since there is less social interaction with natives than in mixed environments. Pupils are likely to be influenced by their peers’ school ambitions and these are likely to be different in highly segregated schools. We follow Schnepf (2004) by calculating what she dubbed ‘school segregation’. It measures the distribution of immigrants and natives across schools and is calculated according to the Duncan (Duncan and Duncan, 1955) segregation index of dissimilarity. Its formula is as follows:
(7) 1
1 1002
Ss s
s country country
M NDISM N=
= −∑
where s refers to the school and ‘country’ to the average result in the country. M measures the number of migrants in respective school of country and N the number of natives in respective school or country. DIS ranges between 0 and 1. It can be interpreted as the fraction of migrant students that need to be moved to different schools in order to achieve equal distribution of migrants across all schools in the country. In line with Schnepf (2004), DIS is high in most countries. More than 50 % of immigrants in all countries except Switzerland and Australia would need to be shifted to different schools to achieve proportional representation in all schools. DIS is lowest in Switzerland, but here DIS is still about 40. The highest ratio can be observed for the Czech Republic although the reliability of this figure is uncertain given the small share of migrants in this country. Summing up, 10 out of 12 countries have a dissimilarity index above of 50 confirming Schnepf’s (2004) conclusion that migrants’ integration into national educational system appears to be rather limited.
10
Table 1: Schooling, Migrants and Segregation: Descriptive Evidence for selected Countries Share of
Migrants Differences
in PISA Scores
(Migrants/ Natives)
Differences in ISEI
(Migrants/ Natives)
Dissimilarity Index
(Migrants)
Ratio of all
Migrants in Top 10%-PISA Score
Schools
Ratio of all
Migrants in Worst
10%-PISA Score
Schools
Ratio of Between School
Variance of PISA Scores
Australia 0.226 -12.553 -0.168 48.449 0.130 0.087 0.224 Canada 0.204 -11.805 2.539 61.017 0.154 0.046 0.200 New Zealand 0.194 -30.090
6.297 50.065 0.108 0.180 0.198
Denmark 0.061 -79.348 -4.746 62.832 0.072 0.228 0.212 Norway 0.046 -58.558 -4.684 58.056 0.063 0.157 0.144 Sweden 0.105 -56.728 -3.972 50.102 0.066 0.271 0.126 Austria 0.096 -80.035 -9.578 57.644 0.065 0.133 0.527 Germany 0.152 -82.851 -9.027 50.023 0.045 0.171 0.636 Switzer-land 0.204 -86.302
-9.166 40.440 0.070 0.163 0.464
Czech Republic 0.010 -35.445
-5.248 81.854 0.028 0.130 0.562
Hungary 0.017 5.952 6.022 60.916 0.198 0.022 0.656 Russia 0.042 -8.060 0.373 51.521 0.092 0.069 0.393 Notes: Observations are weighted by student weights. ‘Migrant’ students are students whose both parents were born in a foreign country. ‘Natives’ refer to all other children. ‘Best’ and ‘worst’ schools are identified by ranking national school-specific PISA score averages and calculating percentiles.
A further indicator of segregation is the allocation of migrant students to top or worst schools (see also Schnepf, 2004, for a different set of countries). Dependent on the highly different recruitment process of immigrants, traditional countries of immigration provide a strong contrast to the remaining group of countries. Table 1 reveals that from 100 migrant students in Canada 15.4 % visit schools of the top 10 percent level, whereas in Germany this is only the case for 4.5 % of all migrants. As regards the worst 10 percent of schools, only 4.6% of Canadian migrant students attend one, whereas 17.1% of migrants in Germany visit them. In Scandinavia, too, a large fraction of migrant students is sorted into worst national schools. Here, shares range between 15.7% and 27.1%. Top schools seem to be more easily accessible in Hungary, where 19.8% of migrants attend them.
The last column of Table 1 shows the decomposition of the PISA score variance into its between-school and within-school shares. Results reveal differences caused by characteristics of comprehensive versus ability-tracking schooling systems. The variance of PISA scores in Austria, Germany and Switzerland is mainly driven by the heterogeneity of abilities across different types of schools, whereas in comprehensive Scandinavian schools PISA

11
performance mainly varies within schools. Whereas the ratio of between-school variance ranges between 0.464 and 0.636 in the different-ability group of countries, corresponding shares in Scandinavia range between 0.126 and 0.212. As in Scandinavia, classical countries of immigration also have relatively small ratios of between-school variance, which does not come as a surprise given their comprehensive schooling system (as in Scandinavia, all three countries have one single school type available to 15-year-olds, see OECD 2004, p. 262, Table 5.20a). On the other hand, according to the same source (OECD 2004) students in the Czech Republic (5 school types) and Hungary (3 school types) are allocated to distinct ability levels, and the first age of selection in both education system is 11, such that the high ratio of between-school variance is indeed very close to the one in Austria and Germany.3
Summing up, the selection of countries into four groups that are rather homogeneous within their respective country group and heterogeneous across groups consisting of a) Australia, Canada and New Zealand, b) Denmark, Norway and Sweden, c) Austria, Germany and Switzerland and d) the Czech Republic, Hungary and Russia is confirmed by the descriptive evidence in Table 1, in particular with respect to student achievements, parental socioeconomic status and the ratio of between-school variance.
5. Econometric evidence and estimation of social multipliers
The econometric modelling of individual PISA scores benefits from previous experiences with this data set in the literature (see, among others, Wößmann 2003, Fuchs und Wößmann 2004, Jürges und Schneider 2004, Entorf and Minoiu 2005, Ammermüller 2005, Schneeweiss and Winter-Ebmer 2005). The following individual characteristics as well as school-specific variables are included in the list of regressors of equations (1):
a) individual characteristics and backgrounds of students
• READING SCORE: Students' performance score in reading
• FEMALE: Binary Dummy variable, which takes the value 1 if the respective pupil is female
• GRADE_8: Binary Dummy variable, which takes the value 1 if the respective pupil attends grade 8th or lower
• GRADE_9: Binary Dummy variable, which takes the value 1 if the respective pupil attends grade 9th
• FOREIGN BORN: Binary Dummy variable, which takes the value 1 if the respective pupil is not born in the country of test
3 The same source (OECD 2004) does not contain corresponding information on the Russian education system.
12
• NATIONAL LANGUAGE AT HOME: Binary Dummy variable, which takes the value 1 if the respective pupil deploys mostly (the) national language(s) or other national dialects at home
• LIVING WITH TWO PARENTS/ GUARDIANS: Binary Dummy variable, which takes the value 1 if the respective pupil lives in a nuclear family or a mixed family (OECD 2000a, p. 30)
• MORE THAN 100 BOOKS AT HOME: Binary Dummy variable, which takes the value 1 if the respective pupil reported on more than 100 books at his home
• HOME EDUCATIONAL RESOURCES: Index of home educational resources, derived from students' reports on the availability of a dictionary, a quiet place to study, a desk for study and the number of calculators at home. Positive values indicate possession of more educational resources and negative values indicate possession of fewer educational resources by the student’s family (OECD 2000b, p. 224)
• HOMEWORK TIME: Index of time spent on homework, derived from students' reports on the amount of time dedicated to homework in national language, mathematics and science (per week). Positive values indicate more and negative values indicate less time spent on homework (OECD 2000b, p. 226)
• ISEI: PISA International Socio-Economic Index of Occupational Status, derived from students' responses on parental occupation
b) school-specific factors
• STUDENT-TEACHING STAFF RATIO: Total number of pupils divided by the total number of teachers (whereby part-time teachers make up one half of the total number of teachers)
• QUALITY OF SCHOOLS' EDUCATIONAL RESOURCES: Index of the quality of schools' educational resources, derived from school principals' reports on lack of instructional materials, laboratory equipment etc. concerning the learning by 15-year-olds. Positive values indicate that the learning of 15-year-olds was not hindered by the school’s physical infrastructure, and negative values indicate the perception that the learning of 15-year-olds was hindered by the school’s physical infrastructure (OECD 2000b, p. 249)
• SPECIAL LANGUAGE COURSES AT SCHOOL: Binary Dummy variable, which takes the value 1 if the respective school principal reported on special training in national language for low achievers (concerning the group of 15-year-olds)
• VILLAGE/ SMALL TOWN: Binary Dummy variable, which takes the value 1 if the respective school is located in a village or a small town (up to 15,000 people)
13
• HOURS OF SCHOOLING PER YEAR: Index of hours of instructional time for 15-year-olds per year, derived from school principals' reports
• DISS: Schools' contribution to the aggregated dissimilarity index (Duncan and Duncan, 1955)4
• SCHOOL AUTONOMY: Index of school autonomy, derived from the numbers of categories that principals classified as being as not being a school responsibility. Positive values indicate higher levels of school autonomy (OECD 2000b, Technical Report, p. 245)
• TEACHER AUTONOMY: Index of teacher autonomy, derived from the numbers of categories that principals classified as being mainly the responsibility of teachers. Positive values indicate higher levels of teacher participation in school decisions (OECD 2000b, p. 245)
• SELECTION BY RESIDENCE: Binary Dummy variable, which takes the value 1 if the respective school always considers residence in a particular area when students are admitted to the school
• SELECTION BY PERFORMANCE: Binary Dummy variable, which takes the value 1 if the respective school always considers student's record of academic performance when students are admitted to the school
• PRIVATE SCHOOL: Binary Dummy variable, which takes the value 1 if the respective school is managed directly or indirectly by a non-government organisation
c) MEAN OF READING SCORE: Mean of classmates' performance scores in reading. The
variable is calculated both as the mean of the reading score of natives and as the mean of the reading score of migrants
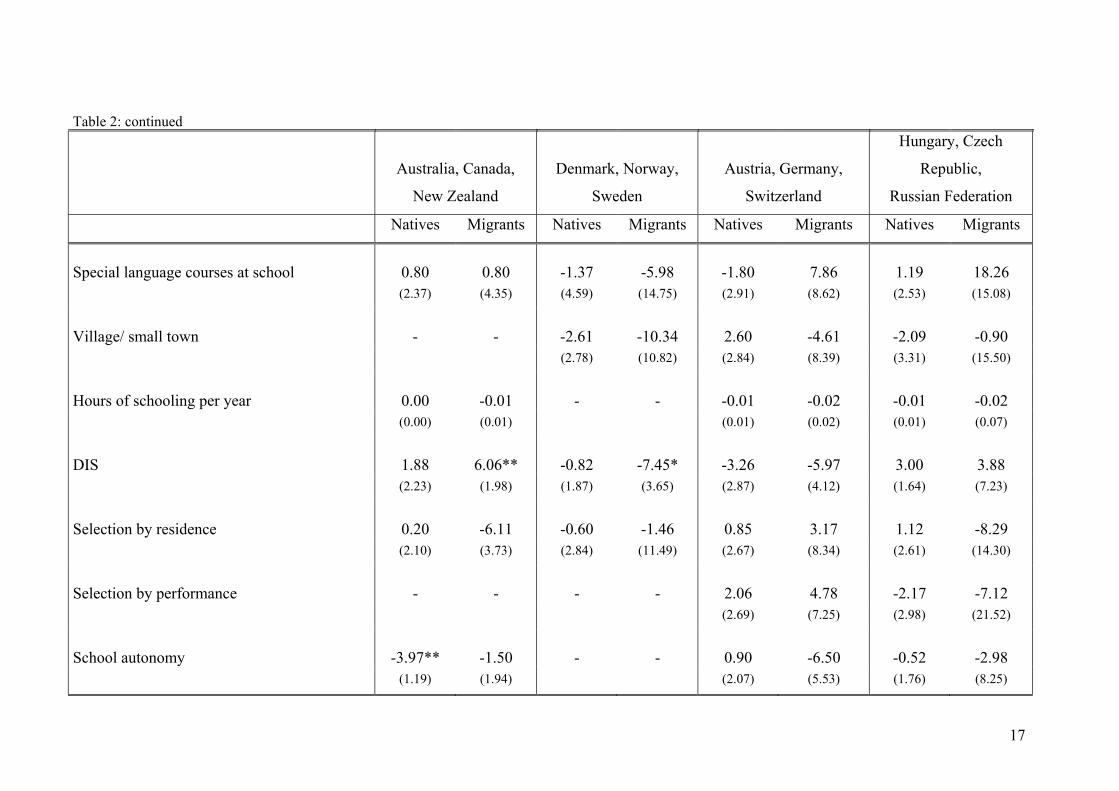
Results are presented in Table 2. Note that we define ‘migrants’ as students both of whose parents were born abroad. The novelty of our approach lies in separate modelling of migrant and native achievements and in considering peer effects arising from the influence of both migrant and native mean achievements. Looking at natives first, estimated coefficients are widely as expected from previous research on student PISA achievements. As has been found in the literature, school specific factors turn out to be insignificant when individual factors are controlled for. Among the most significant factors, our results confirm the important role of the parental cultural and socioeconomic background. Throughout all groups of countries, ‘more than 100 books at home’, ‘home educational resources’ and ISEI contribute to the
4 ( )/ / *100s s country s countryDIS M M N N= − , where M = number of migrants in respective school or country, and
N = number of natives in respective school or country (see also Schnepf, 2004).
14
variance of PISA in a highly significant way. Likewise, in all countries female native students have higher scores than their male compatriots.
Estimation results for migrants deviate from those of natives in different aspects. Besides strong effects arising from the fact that the test was performed by pupils attending lower than 10th grade, for them the language spoken at home becomes the most important factor of educational success (this variable is not available for Hungary, with the result that it could not be considered as an explanatory variable for the group of Central and Eastern Europe). For instance, given all other explanatory factors considered in the equation, the PISA score of children from Scandinavia who do not speak their national language at home is 33.0 points below that of children who do speak the national language at home. Females are still more successful than males, although the difference is significant only for traditional countries of immigration and Scandinavia. As regards the background of parents, only ISEI remains significant in three out of four groups, whereas ‘more than 100 books at home’ and ‘home educational resources’ still have positive effects on PISA achievements but become insignificant except for the group of the traditional countries of immigration.
The somewhat surprising insignificance of ‘books at home’ in the migrant equation (see, for instance, Ammermüller 2005, who finds significant effects for migrants also) might be the result of dominant and highly significant peer effects which were not considered in previous explanations of PISA scores. Irrespective of whether we consider migrants or natives, the direct influence of the native peer group achievement is larger than the direct influence of the migrant peer group. The peer group impact of natives is particularly high in Austria, Germany and Switzerland as well as in countries of Central and Eastern Europe. The educational systems of both groups are characterised by non-comprehensive schools. The lowest peer group effects can be observed for the comprehensive Scandinavian school system, where only the native-to-native link appears to be significant. The migrant peer group influence becomes important in traditional countries of immigration and in ‘Austria, Germany, Switzerland’. In both country groups natives, too, are affected by migrant mean achievements, though the stronger impact is on migrants themselves.

15
Table 2: Econometric results
Australia, Canada,
New Zealand
Denmark, Norway,
Sweden
Austria, Germany,
Switzerland
Hungary, Czech
Republic,
Russian Federation
Natives Migrants Natives Migrants Natives Migrants Natives Migrants
Student-specific factors:
Female 24.36** 23.35** 26.56** 23.46** 12.06** 10.50 22.02** 5.07 (1.93) (3.40) (2.42) (8.39) (2.46) (6.82) (2.56) (13.80)
Grade 8 -66.79** -49.71** -61.69** -96.78** -68.26** -60.10** -86.91** -131.17** (6.60) (14.83) (11.68) (18.01) (4.78) (11.78) (9.47) (26.26)
Grade 9 -44.86** -50.69** 5.66 13.13 -24.58** -34.89** -30.97** -27.59 (3.35) (7.79) (3.38) (12.68) (2.89) (9.73) (2.96) (14.85)
Foreign born -0.74 -14.81** -7.08 7.60 -9.09 -4.64 23.92** 7.36 (7.19) (3.68) (9.84) (9.11) (9.22) (7.07) (6.93) (13.96)
National language at home 37.05** 22.65** 28.31* 33.00** 19.96 17.33* - - (6.89) (3.72) (11.19) (9.36) (11.73) (6.80)
Living with two parents/ guardians 5.77* 10.27* 12.08** 16.62 -1.51 6.65 2.99 -14.23 (2.42) (4.73) (3.11) (10.35) (3.34) (12.11) (3.19) (14.97)

16
Table 2: continued
Australia, Canada,
New Zealand
Denmark, Norway,
Sweden
Austria, Germany,
Switzerland
Hungary, Czech
Republic,
Russian Federation
Natives Migrants Natives Migrants Natives Migrants Natives Migrants
More than 100 books at home 20.62** 22.34** 31.28** 10.92 18.72** 12.98 18.97** 23.29 (2.03) (3.65) (2.72) (9.65) (2.80) (7.55) (2.68) (15.02)
Home educational resources 6.39** 9.37** 8.91** 6.07 4.86** 1.64 3.39* 4.99 (1.03) (2.06) (1.37) (5.67) (1.75) (3.95) (1.40) (7.79)
Homework time 11.27** 8.39** 0.04 0.57 0.91 -0.92 10.72** 7.14 (1.03) (1.93) (1.51) (4.52) (1.49) (3.91) (1.27) (5.96)
ISEI 0.78** 0.78** 1.05** 0.68* 0.29** 0.52* 0.49** 0.36 (0.06) (0.10) (0.08) (0.27) (0.08) (0.25) (0.08) (0.48)
School-specific factors:
Student-teaching staff ratio - - 0.22 -1.62 -0.47 -0.19 -0.41 -1.82 (0.48) (1.83) (0.29) (0.70) (0.27) (1.69)
Quality of schools' educational resources -1.99* -2.32 -1.17 -7.82 0.65 -0.61 -0.99 3.65 (1.02) (1.85) (1.51) (4.84) (1.48) (3.75) (1.13) (6.64)
17
Table 2: continued
Australia, Canada,
New Zealand
Denmark, Norway,
Sweden
Austria, Germany,
Switzerland
Hungary, Czech
Republic,
Russian Federation
Natives Migrants Natives Migrants Natives Migrants Natives Migrants
Special language courses at school 0.80 0.80 -1.37 -5.98 -1.80 7.86 1.19 18.26 (2.37) (4.35) (4.59) (14.75) (2.91) (8.62) (2.53) (15.08)
Village/ small town - - -2.61 -10.34 2.60 -4.61 -2.09 -0.90 (2.78) (10.82) (2.84) (8.39) (3.31) (15.50)
Hours of schooling per year 0.00 -0.01 - - -0.01 -0.02 -0.01 -0.02 (0.00) (0.01) (0.01) (0.02) (0.01) (0.07)
DIS 1.88 6.06** -0.82 -7.45* -3.26 -5.97 3.00 3.88 (2.23) (1.98) (1.87) (3.65) (2.87) (4.12) (1.64) (7.23)
Selection by residence 0.20 -6.11 -0.60 -1.46 0.85 3.17 1.12 -8.29 (2.10) (3.73) (2.84) (11.49) (2.67) (8.34) (2.61) (14.30)
Selection by performance - - - - 2.06 4.78 -2.17 -7.12 (2.69) (7.25) (2.98) (21.52)
School autonomy -3.97** -1.50 - - 0.90 -6.50 -0.52 -2.98 (1.19) (1.94) (2.07) (5.53) (1.76) (8.25)
18
Table 2: continued
Australia, Canada,
New Zealand
Denmark, Norway,
Sweden
Austria, Germany,
Switzerland
Hungary. Czech
Republic
Russian Federation
Natives Migrants Natives Migrants Natives Migrants Natives Migrants
Teacher autonomy 0.46 0.88 - - -0.98 -2.07 -1.14 2.69 (0.88) (1.55) (1.43) (3.89) (1.90) (9.93)
Private School - - -4.79 21.24 -0.96 5.66 15.74** 48.63 (5.57) (19.42) (5.74) (21.40) (5.67) (34.44)
Mean of reading score: Non-Migrants 0.48** 0.30** 0.40** 0.17 0.67** 0.63** 0.71** 0.77** (0.03) (0.04) (0.04) (0.11) (0.03) (0.09) (0.04) (0.20)
Mean of reading score: Migrants 0.04** 0.21** 0.03 0.08 0.09** 0.15* 0.03 -0.11 (0.01) (0.04) (0.02) (0.07) (0.02) (0.07) (0.02) (0.11)
(adj.) R2 0.25 0.29 0.20 0.21 0.57 0.56 0.47 0.37
Obs. 17456 4087 5151 486 7003 1206 5581 202
Note: Constant included, results not reported. The significance levels indicated by stars refer to the customary levels of 95% (*) and 99% (**). Standard errors in parantheses.
19
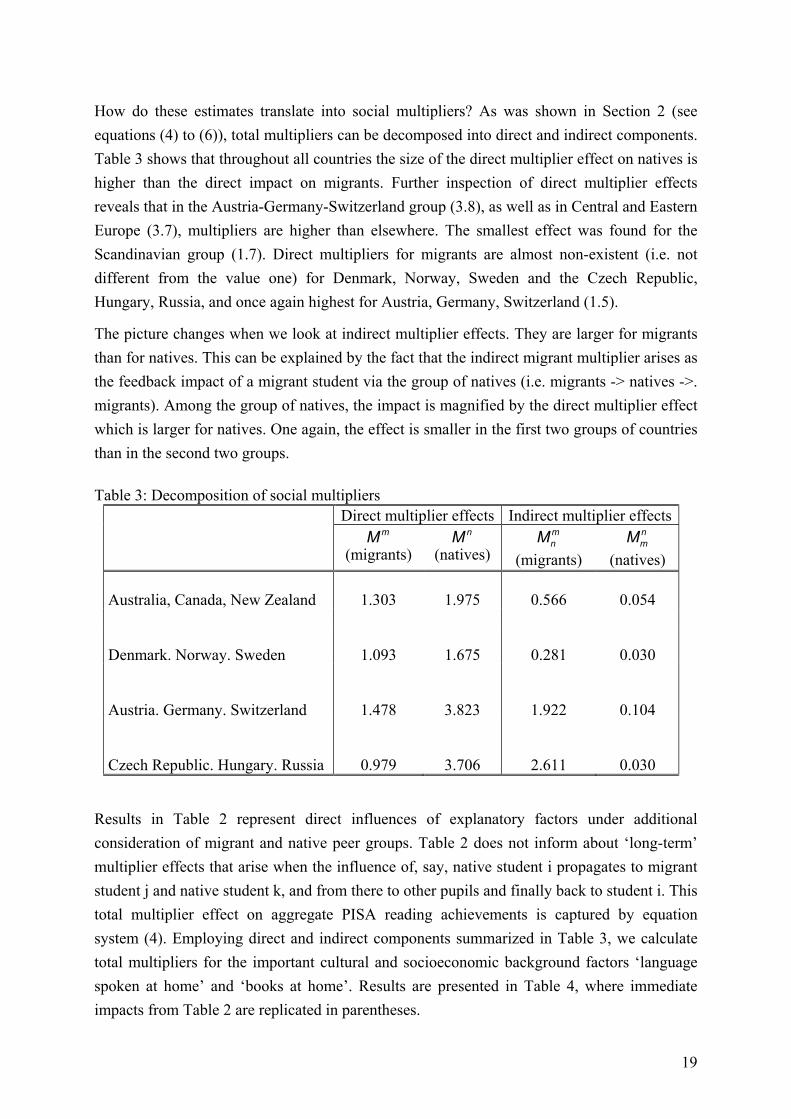
How do these estimates translate into social multipliers? As was shown in Section 2 (see equations (4) to (6)), total multipliers can be decomposed into direct and indirect components. Table 3 shows that throughout all countries the size of the direct multiplier effect on natives is higher than the direct impact on migrants. Further inspection of direct multiplier effects reveals that in the Austria-Germany-Switzerland group (3.8), as well as in Central and Eastern Europe (3.7), multipliers are higher than elsewhere. The smallest effect was found for the Scandinavian group (1.7). Direct multipliers for migrants are almost non-existent (i.e. not different from the value one) for Denmark, Norway, Sweden and the Czech Republic, Hungary, Russia, and once again highest for Austria, Germany, Switzerland (1.5).
The picture changes when we look at indirect multiplier effects. They are larger for migrants than for natives. This can be explained by the fact that the indirect migrant multiplier arises as the feedback impact of a migrant student via the group of natives (i.e. migrants -> natives ->. migrants). Among the group of natives, the impact is magnified by the direct multiplier effect which is larger for natives. One again, the effect is smaller in the first two groups of countries than in the second two groups. Table 3: Decomposition of social multipliers
Direct multiplier effects Indirect multiplier effects mM
(migrants) nM
(natives) mnM
(migrants)
nmM
(natives)
Australia, Canada, New Zealand 1.303 1.975 0.566
0.054
Denmark. Norway. Sweden 1.093 1.675 0.281
0.030
Austria. Germany. Switzerland 1.478 3.823 1.922
0.104
Czech Republic. Hungary. Russia 0.979 3.706 2.611
0.030 Results in Table 2 represent direct influences of explanatory factors under additional consideration of migrant and native peer groups. Table 2 does not inform about ‘long-term’ multiplier effects that arise when the influence of, say, native student i propagates to migrant student j and native student k, and from there to other pupils and finally back to student i. This total multiplier effect on aggregate PISA reading achievements is captured by equation system (4). Employing direct and indirect components summarized in Table 3, we calculate total multipliers for the important cultural and socioeconomic background factors ‘language spoken at home’ and ‘books at home’. Results are presented in Table 4, where immediate impacts from Table 2 are replicated in parentheses.
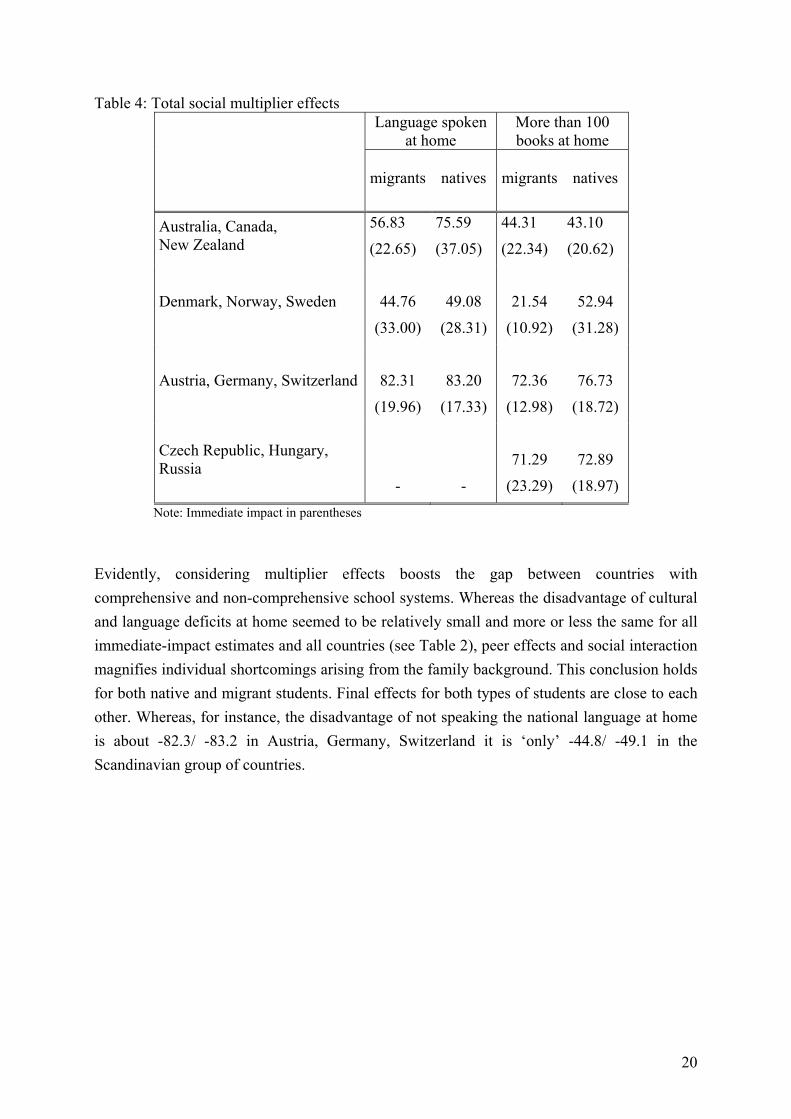
20
Table 4: Total social multiplier effects Language spoken
at home More than 100 books at home
migrants
natives
migrants
natives
Australia, Canada, New Zealand
56.83
(22.65)
75.59
(37.05)
44.31
(22.34)
43.10
(20.62)
Denmark, Norway, Sweden 44.76
(33.00)
49.08
(28.31)
21.54
(10.92)
52.94
(31.28)
Austria, Germany, Switzerland 82.31
(19.96)
83.20
(17.33)
72.36
(12.98)
76.73
(18.72)
Czech Republic, Hungary, Russia
- -
71.29
(23.29)
72.89
(18.97) Note: Immediate impact in parentheses
Evidently, considering multiplier effects boosts the gap between countries with comprehensive and non-comprehensive school systems. Whereas the disadvantage of cultural and language deficits at home seemed to be relatively small and more or less the same for all immediate-impact estimates and all countries (see Table 2), peer effects and social interaction magnifies individual shortcomings arising from the family background. This conclusion holds for both native and migrant students. Final effects for both types of students are close to each other. Whereas, for instance, the disadvantage of not speaking the national language at home is about -82.3/ -83.2 in Austria, Germany, Switzerland it is ‘only’ -44.8/ -49.1 in the Scandinavian group of countries.
21
6. Conclusions
This article analyses the school performance of migrants dependent on different schooling systems and immigration policy regimes. The novelty of our approach lies in considering peer effects from both natives and migrants and aggregating individual peer group effects to social multipliers. Taking all multiplier effects of social interaction into account, we confirm the hypothesis that non-comprehensive school systems reinforce segregation and magnify the prevailing educational inequality between students with a low parental socioeconomic migration background and children from more privileged families. This conclusion is based on the international data set of the OECD PISA test.
Looking for reasons and inspecting interactions between groups by disentangling total multipliers into direct and indirect effects, results show that both native-to-native and migrant-to-migrant peer effects are much higher in ability-differencing school systems (represented by a group consisting of Austria, Germany and Switzerland in our data set) than corresponding effects in comprehensive Scandinavian schools. The overall effect of schooling systems thus seems to depend on the degree of diversity within schools and on the social interaction between high and low ability students and resulting peer effects.
22
7. References
Ammermüller, A. (2005), Poor Background or Low Returns? Why Immigrant Students in Germany Perform so Poorly in PISA, ZEW Discussion Paper No. 05-18, ZEW, Mannheim.
Angrist, J. and K. Lang (2004), Does School Integration Generate Peer Effects? Evidence from Boston’s Metco Program, IZA Discussion Paper No. 976, Bonn.
Bauer, P. and R. Riphahn (2004), Heterogeneity in the Intergenerational Transmission of Educational Attainment: Evidence from Switzerland on Natives and Second Generation Immigrants, IZA Discussion Paper No. 1354, Bonn.
Baumert, J.. Artelt, C.. Klieme, E. et al. (2003), PISA 2000. Ein differenzierter Blick auf die Länder der Bundesrepublik Deutschland. Zusammenfassung zentraler Befunde, Berlin: Max-Planck-Institut für Bildungsforschung.
Brunello, Giorgio, Massimo Giannini (2004). Stratified or Comprehensive? The Economic Efficiency of School Design, Scottish Journal of Political Economy 51 (2), 173-193.
Cippollone, P. and A. Rosolia (2003), Social Interaction in Schooling, mimeo, Bank of Italy, Rome.
Dobbelsteen, Simone, Jesse Levin, Hessel Oosterbeek (2002). The Causal Effect of Class Size on Scholastic Achievement: Distinguishing the Pure Class Size Effect from the Effect of Changes in Class Composition, Oxford Bulletin of Economics and Statistics 64 (1), 17-38.
Dustmann, C. (2004), Parental Background, Secondary School track Choice, and Wages, Oxford Economic Papers 56, 209-230.
Duncan, O. and B. Duncan (1955), A methodological analysis of segregation indexes, American Sociological Review 20, 210-217.
Entorf, H. and N. Minoiu (2005), What a Difference Immigration Policy Makes: A Comparison of PISA Results in Europe and Traditional Countries of Immigration, German Economic Review 6(3), 355-376.
Epple, D., E. Newlon and R. Romano (2002). Ability Tracking, School Competition, and the Distribution of Educational Benefits, Journal of Public Economics 83(1), 1-48.
Fertig, M. (2003), Who’s to Blame? The Determinants of German Students’ Achievements in the PISA 2000 study, IZA Discussion Paper No 739, IZA (Bonn).
Frick, J.R. and G. Wagner (2001), Economic and Social Perspectives of Immigrant Children in Germany, IZA Discussion Paper No 301, IZA, Bonn.
Frölich, M. and K. Michaelowa (2005), Peer Effects and Textbooks in Primary Education: Evidence from Francophone Sub-Saharan Africa, HWWA Discussion Paper 311, Hamburg.
Fuchs, T. and L. Wößmann (2004), What Accounts for International Differences in Student Performance? A Re-examination using PISA Data, CESifo, Munich, Paper presented to the annual meeting of the Verein für Socialpolitik in Dresden, 2004.
Gang, I. N. and K. F. Zimmermann (2000), Is child like Parent? Educational Attainment and Ethnic Origin, Journal of Human Resources 35, 550-569.
Glaeser, E. and Scheinkman (2000), Non-Market Interactions, NBER Working Paper 8053, Cambridge.
Glaeser, E.L., B.I. Sacerdore und J.A. Scheinkman (2003), The Social Multiplier, Journal of the European Economic Association 1 (2-3), 345-353.

23
Hanushek, E.A., J. Kain, J. Markman and S.G. Rivkin (2003), Does Peer Ability Affect Student Achievement? Journal of Applied Econometrics 18(5), 527-544.
Hanushek, E.A., L. Wössmann (2005), Does Educational Tracking Affect Performance and Inequality? Differences-in-Differences Evidence Across Countries, NBER Working Paper 11124, Cambridge.
Heleniak, T. (2002), Migration Dilemmas Haunt Post-Soviet Russia, www.migrationinformation.org (30 January 2005).
Hoxby, C. (2000), Peer Effects in the Classroom: Learning from Gender and Race Variation, NBER Working Paper 7867, Cambridge.
IOM (2004), Migration Trends in Selected Applicant Countries, Volume II – Czech Republic: The Times they are A-Changin, http://www.iom.int/DOCUMENTS/PUBLICATION /EN/IOM_II_CZ.pdf
Jürges, H. and K. Schneider (2004), International Differences in Student Achievement: An Economic Perspective, German Economic Review 5(3), 357-380.
Juhász, J. (2003), Hungary: Transit Country Between East and West, www.migrationinformation.org (30 January 2005).
Krawchuk, S. and K. Rust (2002) Sample Design, in: Adams, R. and M. Wu (eds.), PISA 2000 Technical Report, OECD, Paris, 39-56.
Lalive, R. and A. Cattaneo (2004), Social Interactions and Schooling Decisions, mimeo, University of Zurich, http://www.smye2005.org/pdf/D3.1.pdf (6 June 2005).
Levin, J. (2001), For Whom the Reductions Count? A Quantile Regression Analysis of Class Size and Peer Effects on Scholastic Achievement, Empirical Economics 26, 221-246.
Manski, C.F. (1993), Identification of Endogenous Social Interactions: The Reflection Problem, Review of Economic Studies 60(3), 531-542.
Manski, C.F. (1995), Identification Problems in the Social Sciences, Cambridge: Harvard University Press.
Manski, C.F. (2000), Economic Analysis of Social Interactions, Journal of Economic Perspectives, 14(3), 115-136.
McEwan, P. (2003), Peer Effects on Student Achievement: Evidence from Chile, Economics of Education Review 22, 131-141.
Meier, V. (2004), Choosing between School Systems: The Risk of Failure, Finanzarchiv 60 (1), 83-93.
OECD (2000a), Manual for the PISA 2000 Database, http://www.pisa.oecd.org/ (30 January 2005).
OECD (2000b), PISA 2000 Technical Report, http://www.pisa.oecd.org/ (30 January 2005).
OECD (2001), The OECD Programme for International Student Assessment (PISA), http://www.pisa.oecd.org/ (October 5, 2004).
OECD (2004), Learning for Tomorrow’s World – First Results from PISA 2003, OECD, Paris, http://www.pisa.oecd.org/ (30 January 2005).
Robertson, D. and J. Symons (2003), Do Peer Groups Matter? Peer Groups versus Schooling Effects on Academic Achievement, Economica 70, 31-53.

24
Schneeweiss, N. and R. Winter-Ebmer (2005), Peer Effects in Austrian Schools, Johannes Kepler University of Linz, Department of Economics, Discussion Paper No. 0502, http://www.econ.jku.at/papers/2005/wp0502.pdf (6 June 2005)
Sacerdote, B. (2001), Peer Effects with Random Assignment: Results for Dartmouth Roommates, Quarterly Journal of Economics , 681-704.
Schnepf, S. (2004), How different are immigrants? A cross-country and cross-survey analysis on educational achievement, University of Southampton.
Stanat, P. (2003), Schulleistungen von Jugendlichen mit Migrationshintergrund: Differenzierung deskriptiver Befunde aus PISA und PISA-E, in: Deutsches PISA-Konsortium (Ed.), PISA 2000. Ein differenzierter Blick auf die Länder der Bundesrepublik Deutschland, Opladen, 243-260.
Van Ours, J.C. and J. Veenman (2003), The Educational Attainment of Second-Generation Immigrants in The Netherlands, Journal of Population Economics 16(4), 739-754.
Winston, G. C. and D.J. Zimmerman (2003), Peer Effects in Higher Education, NBER Working Paper No. 9501, Cambridge.
Wößmann, L. (2003), Schooling Resources, Educational Institutions and Student Performance: the International Evidence, Oxford Bulletin of Economics and Statistics 65, 117- 170.
25
Bisher erschienene Diskussionspapiere Nr. 57: Entorf, Horst; Lauk, Martina: Peer Effects, Social Multipliers and Migrants at School: An
International Comparison, Juli 2006 Nr. 56: Görlich, Dennis; Trebesch, Christoph: Mass Migration and Seasonality Evidence on
Moldova’s Labour Exodus, Mai 2006 Nr. 55: Brandmeier, Michael: Reasons for Real Appreciation in Central Europe, Mai 2006 Nr. 54: Martínez-Zarzoso, Inmaculada; Nowak-Lehmann D., Felicitas: Is Distance a Good Proxy
for Transport Costs? The Case of Competing Transport Modes, Mai 2006 Nr. 53: Ahrens, Joachim; Ohr, Renate; Zeddies, Götz: Enhanced Cooperation in an Enlarged EU,
April 2006 Nr. 52: Stöwhase, Sven: Discrete Investment and Tax Competition when Firms shift Profits, April
2006 Nr. 51: Pelzer, Gesa: Darstellung der Beschäftigungseffekte von Exporten anhand einer Input-
Output-Analyse, April 2006 Nr. 50: Elschner, Christina; Schwager, Robert: A Simulation Method to Measure the Tax Burden on
Highly Skilled Manpower, März 2006 Nr. 49: Gaertner, Wulf; Xu, Yongsheng: A New Measure of the Standard of Living Based on
Functionings, Oktober 2005 Nr. 48: Rincke, Johannes; Schwager, Robert: Skills, Social Mobility, and the Support for the
Welfare State, September 2005 Nr. 47: Bose, Niloy; Neumann, Rebecca: Explaining the Trend and the Diversity in the Evolution of
the Stock Market, Juli 2005 Nr. 46: Kleinert, Jörn; Toubal, Farid: Gravity for FDI, Juni 2005 Nr. 45: Eckel, Carsten: International Trade, Flexible Manufacturing and Outsourcing, Mai 2005 Nr. 44: Hafner, Kurt A.: International Patent Pattern and Technology Diffusion, Mai 2005 Nr. 43: Nowak-Lehmann D., Felicitas; Herzer, Dierk; Martínez-Zarzoso, Inmaculada; Vollmer,
Sebastian: Turkey and the Ankara Treaty of 1963: What can Trade Integration Do for Turkish Exports, Mai 2005
Nr. 42: Südekum, Jens: Does the Home Market Effect Arise in a Three-Country Model?, April 2005 Nr. 41: Carlberg, Michael: International Monetary Policy Coordination, April 2005 Nr. 40: Herzog, Bodo: Why do bigger countries have more problems with the Stability and Growth
Pact?, April 2005 Nr. 39: Marouani, Mohamed A.: The Impact of the Mulitfiber Agreement Phaseout on
Unemployment in Tunisia: a Prospective Dynamic Analysis, Januar 2005 Nr. 38: Bauer, Philipp; Riphahn, Regina T.: Heterogeneity in the Intergenerational Transmission of
Educational Attainment: Evidence from Switzerland on Natives and Second Generation Immigrants, Januar 2005
Nr. 37: Büttner, Thiess: The Incentive Effect of Fiscal Equalization Transfers on Tax Policy, Januar 2005
Nr. 36: Feuerstein, Switgard; Grimm, Oliver: On the Credibility of Currency Boards, Oktober 2004 Nr. 35: Michaelis, Jochen; Minich, Heike: Inflationsdifferenzen im Euroraum – eine
Bestandsaufnahme, Oktober 2004 Nr. 34: Neary, J. Peter: Cross-Border Mergers as Instruments of Comparative Advantage, Juli 2004 Nr. 33: Bjorvatn, Kjetil; Cappelen, Alexander W.: Globalisation, inequality and redistribution, Juli
2004
26
Nr. 32: Stremmel, Dennis: Geistige Eigentumsrechte im Welthandel: Stellt das TRIPs-Abkommen ein Protektionsinstrument der Industrieländer dar?, Juli 2004
Nr. 31: Hafner, Kurt: Industrial Agglomeration and Economic Development, Juni 2004 Nr. 30: Martinez-Zarzoso, Inmaculada; Nowak-Lehmann D., Felicitas: MERCOSUR-European
Union Trade: How Important is EU Trade Liberalisation for MERCOSUR’s Exports?, Juni 2004
Nr. 29: Birk, Angela; Michaelis, Jochen: Employment- and Growth Effects of Tax Reforms, Juni 2004
Nr. 28: Broll, Udo; Hansen, Sabine: Labour Demand and Exchange Rate Volatility, Juni 2004 Nr. 27: Bofinger, Peter; Mayer, Eric: Monetary and Fiscal Policy Interaction in the Euro Area with
different assumptions on the Phillips curve, Juni 2004 Nr. 26: Torlak, Elvisa: Foreign Direct Investment, Technology Transfer and Productivity Growth in
Transition Countries, Juni 2004 Nr. 25: Lorz, Oliver; Willmann, Gerald: On the Endogenous Allocation of Decision Powers in
Federal Structures, Juni 2004 Nr. 24: Felbermayr, Gabriel J.: Specialization on a Technologically Stagnant Sector Need Not Be
Bad for Growth, Juni 2004 Nr. 23: Carlberg, Michael: Monetary and Fiscal Policy Interactions in the Euro Area, Juni 2004 Nr. 22: Stähler, Frank: Market Entry and Foreign Direct Investment, Januar 2004 Nr. 21: Bester, Helmut; Konrad, Kai A.: Easy Targets and the Timing of Conflict, Dezember 2003 Nr. 20: Eckel, Carsten: Does globalization lead to specialization, November 2003 Nr. 19: Ohr, Renate; Schmidt, André: Der Stabilitäts- und Wachstumspakt im Zielkonflikt zwischen
fiskalischer Flexibilität und Glaubwürdigkeit: Ein Reform-ansatz unter Berücksichtigung konstitutionen- und institutionenökonomischer Aspekte, August 2003
Nr. 18: Ruehmann, Peter: Der deutsche Arbeitsmarkt: Fehlentwicklungen, Ursachen und Reformansätze, August 2003
Nr. 17: Suedekum, Jens: Subsidizing Education in the Economic Periphery: Another Pitfall of Regional Policies?, Januar 2003
Nr. 16: Graf Lambsdorff, Johann; Schinke, Michael: Non-Benevolent Central Banks, Dezember 2002
Nr. 15: Ziltener, Patrick: Wirtschaftliche Effekte des EU-Binnenmarktprogramms, November 2002 Nr. 14: Haufler, Andreas; Wooton, Ian: Regional Tax Coordination and Foreign Direct Investment,
November 2001 Nr. 13: Schmidt, André: Non-Competition Factors in the European Competition Policy: The
Necessity of Institutional Reforms, August 2001 Nr. 12: Lewis, Mervyn K.: Risk Management in Public Private Partnerships, Juni 2001 Nr. 11: Haaland, Jan I.; Wooton, Ian: Multinational Firms: Easy Come, Easy Go?, Mai 2001 Nr. 10: Wilkens, Ingrid: Flexibilisierung der Arbeit in den Niederlanden: Die Entwicklung
atypischer Beschäftigung unter Berücksichtigung der Frauenerwerbstätigkeit, Januar 2001 Nr. 9: Graf Lambsdorff, Johann: How Corruption in Government Affects Public Welfare – A
Review of Theories, Januar 2001 Nr. 8: Angermüller, Niels-Olaf: Währungskrisenmodelle aus neuerer Sicht, Oktober 2000 Nr. 7: Nowak-Lehmann, Felicitas: Was there Endogenous Growth in Chile (1960-1998)? A Test of
the AK model, Oktober 2000 Nr. 6: Lunn, John; Steen, Todd P.: The Heterogeneity of Self-Employment: The Example of Asians
in the United States, Juli 2000
27
Nr. 5: Güßefeldt, Jörg; Streit, Clemens: Disparitäten regionalwirtschaftlicher Entwicklung in der EU, Mai 2000
Nr. 4: Haufler, Andreas: Corporate Taxation, Profit Shifting, and the Efficiency of Public Input Provision, 1999
Nr. 3: Rühmann, Peter: European Monetary Union and National Labour Markets, September 1999
Nr. 2: Jarchow, Hans-Joachim: Eine offene Volkswirtschaft unter Berücksichtigung des Aktienmarktes, 1999
Nr. 1: Padoa-Schioppa, Tommaso: Reflections on the Globalization and the Europeanization of the Economy, Juni 1999
Alle bisher erschienenen Diskussionspapiere zum Download finden Sie im Internet unter: http://www.wiso.uni-goettingen.de/diskussion.htm.