pisa results: what a difference immigration law makesftp.iza.org/dp1021.pdf · pisa results: what a...
TRANSCRIPT

IZA DP No. 1021
PISA Results: What a DifferenceImmigration Law Makes
Horst EntorfNicoleta Minoiu
DI
SC
US
SI
ON
PA
PE
R S
ER
IE
S
Forschungsinstitutzur Zukunft der ArbeitInstitute for the Studyof Labor
February 2004

PISA Results: What a Difference
Immigration Law Makes
Horst Entorf Darmstadt University of Technology,
ZEW and IZA Bonn
Nicoleta Minoiu Darmstadt University of Technology
Discussion Paper No. 1021 February 2004
IZA
P.O. Box 7240 53072 Bonn
Germany
Phone: +49-228-3894-0 Fax: +49-228-3894-180
Email: [email protected]
Any opinions expressed here are those of the author(s) and not those of the institute. Research disseminated by IZA may include views on policy, but the institute itself takes no institutional policy positions. The Institute for the Study of Labor (IZA) in Bonn is a local and virtual international research center and a place of communication between science, politics and business. IZA is an independent nonprofit company supported by Deutsche Post World Net. The center is associated with the University of Bonn and offers a stimulating research environment through its research networks, research support, and visitors and doctoral programs. IZA engages in (i) original and internationally competitive research in all fields of labor economics, (ii) development of policy concepts, and (iii) dissemination of research results and concepts to the interested public. IZA Discussion Papers often represent preliminary work and are circulated to encourage discussion. Citation of such a paper should account for its provisional character. A revised version may be available on the IZA website (www.iza.org) or directly from the author.
IZA Discussion Paper No. 1021 February 2004
ABSTRACT
PISA Results: What a Difference Immigration Law Makes∗
The purpose of this article is to evaluate the importance of social class, migration background and command of national languages for the PISA school performance of teenagers living in European countries (France, Finland, Germany, United Kingdom, and Sweden) and traditional countries of immigration (Australia, Canada, New Zealand and the US). Econometric results show that the influence of the socioeconomic background of parents differs strongly across nations, with the highest impact found for Germany, the UK and US, whereas social mobility is more likely in Scandinavian countries and in Canada. Moreover, for all countries our estimations imply that for students with a migration background a key for catching up is the language spoken at home. We conclude that educational policy should focus on integration of immigrant children in schools and preschools, with particular emphasis on language skills at the early stage of childhood. JEL Classification: I20, J15, J18, O15, Z13 Keywords: PISA tests, socioeconomic status, migration, social mobility, language skills Corresponding author: Horst Entorf Darmstadt University of Technology Department of Economics Marktplatz 15 (Schloss) 64283 Darmstadt Germany Tel.: +49 6151 16 2436 Email: [email protected]
∗ We are grateful to Andrea Weber for helpful comments and Philip Savage for proofreading the paper.

2
1. Introduction
Students from three traditional countries of immigration, Australia, Canada, and New Zealand, performed surprisingly well compared with students from the other remaining 29 countries participating in the Programme for International Student Assessment (PISA). Looking at the assessment of reading literacy, which has been the focus of the OECD PISA tests in 2000 (see OECD, 2001, for details), Canada is ranking second, New Zealand is third and Australia is ranking fourth.1 Only teenagers from Finland had a significantly better score. Some other European countries such as France and Ger-many but also the US performed significantly worse than these top-performing coun-tries. In response to these results, there is an ongoing discussion about the reasons for differing average reading proficiency levels across countries. In particular Germans were stunned to learn that the performance of their school system that produced the Goethes and Einsteins was well below the OECD average.
It seems that poor results of badly integrated children from socially less advantaged families contribute to the problem. First results based on a national German sample ex-tension (PISA-E) of the international test (PISA 2000) confirm that as in almost no other country social and ethnic background seem to determine student achievement as much as in Germany (Stanat 2003, Baumert et al. 2003). Educational researchers argue that the system of early differentiation by skill level (as it is applied in Germany) has a negative impact on the school performance of children who come to school with lan-guage and social deficits, a high proportion of whom come from families with migration background. Early division may not give these children the basic skills before they are separated into the better or weaker school systems. The average German reading score result of PISA 2000 seems to be negatively affected by the weak results of teenagers who attend the less challenging middle-level secondary school (’Realschule’) and in particular by the very poor results of pupils from the lowest-level secondary school (’Hauptschule’), which is mainly attended by children with a low socioeconomic status.2
The German school environment stands in striking contrast to the situation in Aus-tralia, Canada, and New Zealand. Whereas in Germany and other European countries socially less privileged children often come from families with (labour) migration back-ground, so-called ‘traditional countries immigration’ (from which the USA needs to be omitted because of its different immigrant situation mainly influenced by the Mexican border) follow an immigration policy that seeks to admit selected applicants with high education, good language skills and the flexibility to contribute to the countries’ human resource base by quickly and effectively matching their skills with opportunities in 1 Scientific and mathematical literacy will be the focus in 2003 and 2006, respectively. In 2000, there were fewer mathematics and science items included in the assessment and administered to a sub-sample of participants. In these tests, too, Australia, Canada, and New Zealand were among the top performing nations. Only Japan, Korea and Finland performed better than this group of countries (OECD, 2001). 2 Whereas the average of the so-called ‘highest socioeconomic index’ (HISEI, see also below) of families in Germany in lowest-secondary schools (‘Hauptschulen’) is 39.9, it is 57.2 in the highest secondary school (‘Gymnasium’). Moreover, 31.1 percent of all children in ‘Hauptschulen’ have parents with a full migration background (both parents are foreign born), whereas only 8.2 percent of students in ‘Gymna-sium’ have both parents born abroad (Baumert et al. 2003, p. 273).

3
these countries (see, Inglis 2002, Ray, 2002, and Bedford, 2003, for recent surveys on immigration policies in Australia, Canada and New Zealand, respectively).
The purpose of this article is to highlight the importance of social class and migra-tion background for the PISA school performance of teenagers. A special focus of this article is to provide information on the performance of immigrants, a topic rarely dis-cussed in the literature.3 As different regimes of immigration policy produce quite dif-ferent immigrant populations, we include, on the one hand, a group of European coun-tries (France, Germany, United Kingdom, and Sweden) with labour migrants represent-ing the majority of immigrant populations, though with different countries of origin. Whereas in France, Germany and Sweden immigrants mainly come from less industrial-ised non-Western countries such as Turkey, North Africa, former Yugoslavia, Poland, Russia and other countries from Eastern or Central Europe, or from outside Europe (France also has large inflows from former colonies, see Hamilton, Simon and Veniard, 2002, for details), labour migrants from EU countries and from India account for a large share of the foreign work force in UK.4 On the other hand we include the four tradi-tional countries of (selected) immigration Australia, Canada, New Zealand and the USA. Mainly for reasons of a benchmarking comparison, we also consider the best-performing country of the international PISA test, Finland - a country which is almost unaffected by major immigration flows.5
Our econometric results show that the impact curves of the socioeconomic status of parents (’socioeconomic gradients’) on the school performance of their children differ strongly across countries, with steepest ascents for Germany, UK and US, whereas flat-test slopes were estimated for Finland and Canada. Moreover, we find that educational inequalities between social classes can be enormous, as can be seen from the difference in PISA reading scores of students with and without migration background. Calculation of different scenarios shows that the gap of the most disadvantaged migration group (foreign parents, foreign language spoken at home) when compared to the group of na-tives (students born in the country, national language spoken at home) amounts to 105.7 PISA score points for Germany and 83.8 for France. In contrast to these results, differ-ences in Australia (27.5) and Canada (25.5) are much smaller. However, empirical re-sults also show that a key for catching up is the language spoken at home. Reading pro-ficiency scores of migrant students improved substantially when the language spoken at home is the national language instead of some foreign language. Imputation of respec-tive migration backgrounds reveals that most significant upward shifts in reading liter-
3 Notable exceptions with German focus are Gang and Zimmermann (2000), Frick and Wagner (2001), Stanat (2003) and Weber (2003). 4 According to SOPEMI 2002 (OECD 2003), 2.59 million (which equals 4.3 percent of the British popu-lation) non-nationals were living in Great Britain of which the biggest group (436 thousand) is Irish, fol-lowed by migrants from the US (148 thousand), India (132 thousand), Italy (102 thousand), France and Pakistan (both 82 thousand). 5 In Finland, only 1.2 percent of students participating in PISA 2000 have parents with a full migration background (both parents born abroad), whereas these figures are much higher in all other countries under consideration (Australia: 22.8, Canada: 20.5, New Zealand: 19.7, USA: 13.6, France: 12.0, Germany: 15.3, Sweden: 10.5, United Kingdom: 9.2, source: Baumert and Schümer, 2001, p. 348).

4
acy due to language skills can be observed for New Zealand (71.5), Germany (61.9) and the US (60.3).6
This paper is organized as follows. Section 2 presents descriptive evidence and characterises our sample of countries with respect to migration background, socioeco-nomic status and PISA reading literacy scores. In Section 3 the educational gap between migrants and non-migrants is analysed using econometric methods. Imputation of PISA scores dependent on hypothetical migration/non-migration backgrounds is presented in Section 5. Section 6 sums up and concludes.
2. Characterisation of Countries by Migration Background, Socioeconomic Status and PISA Scores As explained in more detail elsewhere (in particular, OECD 2001; further interesting sources are national institutes which cooperated with OECD; see, for instance, Statistics Canada, 2003), the Programme for International Student Assessment (PISA) is a joint effort among member countries of the Organisation for Economic Co-operation and Development (OECD) to assess the achievement of 15-year-olds in reading literacy, mathematical literacy and scientific literacy through a common international test. PISA defines reading literacy as the ability to understand, use and reflect on written texts in order to participate effectively in life. PISA is a three-phase study with the first phase in 2000, the second in 2003 and the third in 2006. In 2000 the main domain assessed was reading literacy. Mathematical literacy and scientific literacy were minor domains as-sessed in a sub-sample of reading literacy participants. More than 250,000 students took part in PISA from the 32 participating countries (Netherlands’s results are not included in the final report and four non-OECD countries participated). A minimum of 150 schools and 4500 students had to be selected in each country according to the sample design prepared by OECD scientists (see Krawchuk and Rust, 2002). As an exception to the rule, in Canada, approximately 30,000 students from more than 1,000 schools took part. A large Canadian sample was drawn upon so that information could be provided at both national and provincial levels (see Statistics Canada, 2003, for details). Students from the United Kingdom represent a further exception with more than 9,000 teenagers in the PISA data set (see Adams and Carstensen, 2002, for the number of sampled stu-dents by country).
Table 1 presents average reading literacy scores for all nine nations of interest.7 It first replicates the well known fact that traditional countries of immigration (except the US) perform much better than the European countries (except Finland).8 In addition,
6 Note that the official OECD average is normalised to 500, with Finland’s top score being 546, and Germany’s score published by the OECD being 484. 7 The scores represent six levels of knowledge and skills. Level 5 corresponds to a score of more than 625, level 4 to scores in the range 553 to 625, level 3 to scores from 481 to 552, level 2 to scores from 408 to 480, level 1 to scores from 335 to 407. Students scoring below 335 points are not able to show the most basic skills that PISA sought to measure. 8 Note that we use unweighted statistics of the OECD PISA data set. Most average means show only very small or no deviations from official statistics published by the OECD which have undergone complex weighting schemes (Krawchuk and Rust, 2002): see, for instance, official numbers for Australia, Finland, France and Sweden, respectively (in parentheses: unweighted means): 528 (526), 546 (549), 505 (503)
5
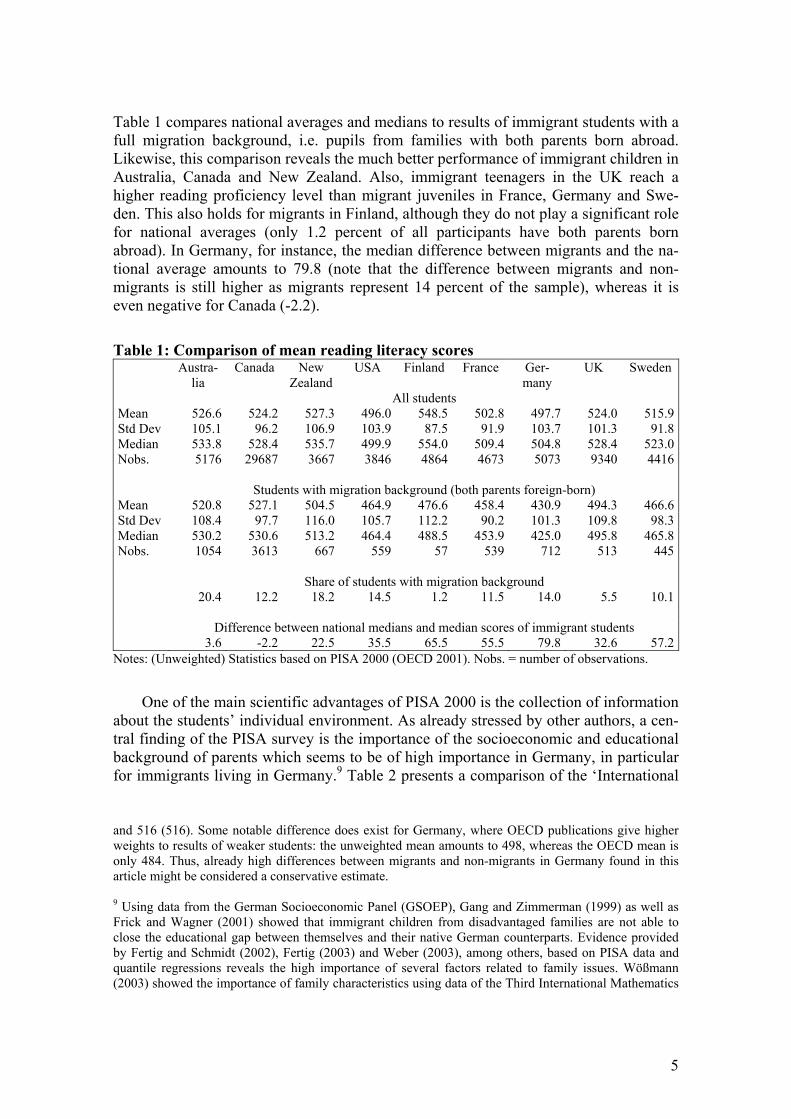
Table 1 compares national averages and medians to results of immigrant students with a full migration background, i.e. pupils from families with both parents born abroad. Likewise, this comparison reveals the much better performance of immigrant children in Australia, Canada and New Zealand. Also, immigrant teenagers in the UK reach a higher reading proficiency level than migrant juveniles in France, Germany and Swe-den. This also holds for migrants in Finland, although they do not play a significant role for national averages (only 1.2 percent of all participants have both parents born abroad). In Germany, for instance, the median difference between migrants and the na-tional average amounts to 79.8 (note that the difference between migrants and non-migrants is still higher as migrants represent 14 percent of the sample), whereas it is even negative for Canada (-2.2).
Table 1: Comparison of mean reading literacy scores Austra-
lia Canada New
Zealand USA Finland France Ger-
many UK Sweden
All students Mean 526.6 524.2 527.3 496.0 548.5 502.8 497.7 524.0 515.9Std Dev 105.1 96.2 106.9 103.9 87.5 91.9 103.7 101.3 91.8Median 533.8 528.4 535.7 499.9 554.0 509.4 504.8 528.4 523.0Nobs.
5176 29687 3667 3846 4864 4673 5073 9340 4416
Students with migration background (both parents foreign-born) Mean 520.8 527.1 504.5 464.9 476.6 458.4 430.9 494.3 466.6Std Dev 108.4 97.7 116.0 105.7 112.2 90.2 101.3 109.8 98.3Median 530.2 530.6 513.2 464.4 488.5 453.9 425.0 495.8 465.8Nobs.
1054 3613 667 559 57 539 712 513 445
Share of students with migration background 20.4 12.2 18.2 14.5 1.2 11.5 14.0 5.5 10.1
Difference between national medians and median scores of immigrant students 3.6 -2.2 22.5 35.5 65.5 55.5 79.8 32.6 57.2
Notes: (Unweighted) Statistics based on PISA 2000 (OECD 2001). Nobs. = number of observations.
One of the main scientific advantages of PISA 2000 is the collection of information about the students’ individual environment. As already stressed by other authors, a cen-tral finding of the PISA survey is the importance of the socioeconomic and educational background of parents which seems to be of high importance in Germany, in particular for immigrants living in Germany.9 Table 2 presents a comparison of the ‘International
and 516 (516). Some notable difference does exist for Germany, where OECD publications give higher weights to results of weaker students: the unweighted mean amounts to 498, whereas the OECD mean is only 484. Thus, already high differences between migrants and non-migrants in Germany found in this article might be considered a conservative estimate. 9 Using data from the German Socioeconomic Panel (GSOEP), Gang and Zimmerman (1999) as well as Frick and Wagner (2001) showed that immigrant children from disadvantaged families are not able to close the educational gap between themselves and their native German counterparts. Evidence provided by Fertig and Schmidt (2002), Fertig (2003) and Weber (2003), among others, based on PISA data and quantile regressions reveals the high importance of several factors related to family issues. Wößmann (2003) showed the importance of family characteristics using data of the Third International Mathematics

6
Socio-Economic Index of Occupational Status’ (ISEI) of parents (average of both par-ents). ISEI is mainly based on education, income and age of occupational groups in a path analytic model that minimises the direct effect of education on income and maxi-mises the indirect effect of education on income through occupation (see Ganzeboom et al, 1992, for the construction of ISEI). The one-dimensional measurement of socioeco-nomic status based on ISEI (instead of multidimensional treatment of underlying socio-economic variables) has been made popular by the OECD PISA research group (OECD 2001), which calculated many statistics and provided rich and detailed background in-formation on school performance by use of ISEI. We try to make our results compatible to this literature, which is mainly interdisciplinary and touches many fields such as edu-cational economics, social sciences and educational research. We thus contribute to this literature by focussing on ISEI instead of including education, income and age as sepa-rate variables. Some further advantage of this research strategy is that parsimonious and one-dimensional characterization of the socioeconomic status facilitates comparisons between countries.
National averages of ISEI remain in a small range with a (rounded) maximum found for Australia (46) and minimum index values for France and Canada (44). All median values remain below averages indicating positively skewed distributions (right side of distribution extends much farther out than the left).
Table 2: International Socio-Economic Index of Parents (ISEI) Austra-
lia Canada New
Zealand USA Finland France Ger-
many UK Sweden
All students Mean 46.1 43.6 44.9 45.5 44.6 43.7 44.6 45.1 45.4Std Dev 17.7 17.4 18.2 17.2 17.0 16.9 16.7 17.0 16.5Median 43 38 43 43 40 39 40 40 43Nobs.
4939 28751 3523 3242 4770 4389 4934 8843 4313
Students with migration background (both parents foreign-born) Mean 46.3 47.5 49.8 42.7 42.8 38.5 36.9 47.3 42.0Std Dev 18.3 18.3 19.1 18.0 17.2 16.0 13.7 17.5 16.9Median 43 44 50 38 34 34 33 47 36Nobs.
1003 3499 625 437 54 468 674 462 410
Share of students with migration background (in percent) 20.3 12.2 17.7 13.5 1.1 10.7 13.7 5.2 9.5
Difference between national median and median ISEI of foreign-born parents 0 -6 -7 5 6 5 7 -7 7
Notes: (Unweighted) Statistics based on PISA 2000 (OECD 2001). ISEI refers to the parental average. Nobs. = number of observations.
As regards the social background of immigrant families, Table 2 reveals the key differ-ence between the traditional countries of immigration, Australia, Canada and New Zea-land, but also the UK, on the one hand, and France, Germany and Sweden on the other hand. Whereas median ISEI is at least 43 for the first group of countries (with a maxi- and Science Study (TIMSS). Baumert et al (2003) and Stanat (2003) highlight the importance of ethnic origin and socioeconomic background using data from the extended German PISA-E sample.

7
mum of 50 for New Zealand), it is at most 36 for the latter group of European labour migrants (with a minimum of 33 for Germany). Even more symptomatic of a differing immigration policy is that within traditional countries of immigration the socioeco-nomic status of migrants even exceeds that of national averages, partly in a significant way (see Canada and New Zealand). At the other extreme, nation-wide ISEI median values of parents exceed that of parents from students with a migration background by 7 points in Germany and Sweden.
Somewhat surprising is the role of the UK, which performs similar to Australia, Canada and New Zealand. As mentioned above, dominant immigration flows from Western countries most probably contribute to this specific feature. The US, though a classical member of the traditional countries of immigration, is situated in a mid posi-tion. Despite effective border controls, illegal or unauthorized immigrants enter the US mainly across the Mexican border. In response to the growing undocumented popula-tion in the US, repeated amnesties led to legalisation of unauthorized migrants. Accord-ing to an MPI documentation (MPI 2002), as of the year 2000, 28.4 million foreign-born (excluding most of the undocumented population) lived in the US, representing about 10 percent of the entire population. Some 51 percent of these foreign-born per-sons originate from Latin America (including Central America, South America and the Caribbean). These figures show that despite selective US Visa and Green Card policies, a large share of migrants in the US consists of labour migrants similar to migrants in (continental) Europe.
3. Econometric Estimation of Educational Gaps between Migrants and non-Migrants In all countries, students from families with privileged high socioeconomic backgrounds performed better than students from low socioeconomic backgrounds. However, the impact of class differences is varying across countries. Table 3 shows the total or un-conditional effect of ISEI on reading performance of students. This so called socioeco-nomic gradient10 does not account for other factors which are potentially responsible for the variance of the socioeconomic status within and between countries such as different shares of the immigrant population and their educational levels. Moreover, other factors such as the German system of differentiation by skill level which likewise would “ex-plain” variation of school performance are not controlled for, because it might be just country-specific school systems which reinforce or weaken lack of social mobility, and because we are interested just in the overall effect of socioeconomic background in dif-ferent groups of countries, though we are aware of several socio-demographic and insti-
10 The study of the relationships between children’s outcomes and the socioeconomic status of their par-ents has a long tradition in the sociology and economics of education (Sewell and Hauser 1975, Bielby 1982, White 1982, Adler et al. 1994). Recent examples include applications to the International Adult Literacy Survey (IALS, performed in 1994, see Willms 1998) and also to PISA. OECD (2001) display the scatterplot of the socioeconomic gradient for the OECD area as a whole (http://www.pisa.oecd.org/knowledge/chap8/f8_1.htm) and present country-specific results (http://www.pisa.oecd.org/knowledge/annexb/t8_1.htm). Willms et al. (2003) give a recent survey and bibliography on the topic.

8
tutional characteristics which contribute to this result (see, among others, Fertig, 2003, Wößmann, 2003).
Table 3 reveals that socioeconomic background has a smaller impact on reading achievement in Finland (1.06) and Canada (1.35) than in other countries (in statistical terms parameter estimates are highly significantly different from zero for all countries). High importance of social-class origin is found for the US (1.77), UK (1.86) and in par-ticular Germany (2.20). Here, increasing ISEI by ten points from, say, 33 to 43 would improve the PISA reading score by 22 points, i.e. from roughly 475 to 497.11 Our results suggest that achievement scores are less equivalent among students with different so-cioeconomic backgrounds in Germany than elsewhere.
Table 3: Estimation of the total impact of parental socioeconomic status on stu-dents’ reading achievement Austra-
lia Canada New
ZealandUSA Finland France Ger-
many UK Sweden
Explana-tory var.
Dependent variable: PISA reading literacy score Sample: all students
Constant 452.9 (3.87)
468.1 (1.47)
464.6(4.49)
425.8(4.76)
502.7(3.45)
433.7(3.54)
402.7 (3.85)
445.9 (10.7)
448.4(3.85)
ISEI 1.70 (0.08)
1.35 (0.03)
1.51(0.09)
1.77(0.10)
1.06(0.07)
1.69(0.08)
2.20 (0.08)
1.86 (0.06)
1.53(0.08)
R-squared 0.087 0.061 0.070 0.091 0.043 0.103 0.131 0.103 0.079Nobs. 4939 28751 3523 3242 4770 4389 4934 8843 4313
Sub-sample: students with both parents foreign-born Constant 457.4
(8.74) 461.1 (4.32)
416.3(11.6)
386.2(12.3)
478.2(40.2)
407.2(10.3)
362.6 (10.7)
405.1 (12.8)
435.9(12.4)
ISEI 1.47 (0.18)
1.46 (0.08)
1.97(0.22)
2.10(0.27)
0.11(0.88)
1.52(0.25)
1.99 (0.27)
2.15 (0.25)
0.91(0.27)
R-squared 0.066 0.078 0.117 0.125 0.000 0.075 0.074 0.136 0.026Nobs. 1003 3499 625 437 54 468 674 462 410
Sub-sample: students with both parents born in the country Constant 446.8
(4.95) 470.7 (1.65)
472.9(5.40)
434.2(5.29)
502.2(3.50)
446.9(4.00)
431.2 (4.12)
448.7 (3.05)
454.4(4.29)
ISEI 1.82 (0.10)
1.28 (0.04)
1.46(0.12)
1.71(0.11)
1.09(0.07)
1.55(0.08)
1.85 (0.08)
1.83 (0.06)
1.50(0.09)
R-squared 0.102 0.053 0.068 0.089 0.046 0.093 0.112 0.100 0.078Nobs. 2870 22387 2210 2582 4565 3288 3854 7419 3425
Notes: Ordinary least squares (OLS) estimation based on PISA 2000 (OECD 2001). Nobs. = number of observations. (Asymptotic) Standard errors in parentheses. 11 In addition to ISEI, also ISEI-squared was tested as regressor of the PISA reading score. While ISEI-squared was significant for Germany, it was insignificant for all other countries. Calculating the slope parameter of the estimated equation 369.1+3.74 ISEI – 0.0154 ISEI^2 (R-squared = 0.132) at the German average of ISEI, 44.6, gives 2.36, i.e. an even somewhat higher impact than reported in Table 3.

9
However, it has to be taken into account that societies differ with respect to both the average level and the degree of inequality of socioeconomic status, a feature that changes with size and characteristics of the immigrant population. We thus compare country samples with and without migration background. As can be seen from the sec-ond panel of Table 2, also within the group of German students with both parents born abroad ISEI has a strong impact (1.99), but we also see that other countries even have larger effects from socioeconomic status within the group of migrants. The UK (2.15) as well as the US (2.10) both have estimates well above 2. Relatively low impact slopes exist for Sweden (0.91), Canada (1.46) and Australia (1.47) (Finland is disregarded be-cause of its small share of migrants). It has to be kept in mind, however, that the esti-mated regression constant – representing the general skill level of migrants in respective countries – is much higher in Sweden (435.9), Canada (461.1) and Australia (457.4) than in Germany (362.6), the UK (405.1) and the US (386.2). Whereas this is expected for the traditional countries of immigration Canada and Australia, the result for Sweden suggests that reading scores are less dependent on different socioeconomic backgrounds here than elsewhere.
The last panel of Table 3 considers the sub-sample of students with both parents born in the country. It mainly consists of national citizens and thus represents the most homogeneous sample of all three cases studied in Table 3. As it is almost unaffected by immigration biases, it should give the most reliable estimate with respect to social mo-bility. Results confirm previous impressions. Smallest impacts are found for Finland (1.09) and Canada (1.28), high dependency on social status does exist in Australia (1.82), UK (1.83) and Germany (1.85).
OECD researchers found the language spoken at home to be a similarly or even more important variable than socioeconomic status: ”Not surprisingly, students not speaking the majority language at home perform much less well than those who do and are much more likely to score among the lowest quarter of students in each country which can affect a country’s average reading score significantly” (OECD 2001)12. Table 4 shows the large gap between students with the national language as their major lan-guage spoken at home and students from foreign language speaking backgrounds.13 The language handicap is smaller in the UK (26.7 PISA points), Australia (30.8) and France (31.9), and highest in New Zealand (63.2) and Germany (57.4).14 There might be differ-ent explanations for this heterogeneity of results. In the UK, non-English speaking mi-grants mainly come from European countries such as Italy, France and Germany (re-member that the majority come from Ireland, the US and India). As English is the first foreign language taught in European schools, most foreign parents and children living in the UK are bilingual. For them, changing between the language spoken at home and the
12 http://www.pisa.oecd.org/knowledge/chap6/h.htm 13 The variable ‘national language spoken at home’ is a dichotomous dummy variable, which takes the value 1 if the language of the national majority is spoken at home, and is valued 0 if not. Note that in Canada both English and French (Quebec) are ‘national languages’ such that ‘language spoken at home’ refers to the language of the respective region. 14 Finland, too, shows a large difference (57.7) which is omitted from the discussion because of the minor importance of immigration for Finland.

10
language spoken at school is less a problem, though language problems accounting for PISA differences of around thirty points are still quite substantial. Similar to the UK is the situation in Australia, where selected migrants (from western countries) will more likely master the problem of bilingualism (note, however, that differences arising from the higher socioeconomic status of migrants are controlled for by including ISEI). The majority of migrants entering France originate from North Africa (Morocco, Algeria and Tunisia) where people are familiar with French. Thus, parents not speaking French to their children very likely come from Western European countries, mainly from Por-tugal, Spain and Italy15 with all three nations being countries with languages of Latin origin such as the French language. For these families living in France, well functioning bilingualism of two related languages is not unlikely.
The situation in Germany differs strongly from that in Australia, France and UK. Here the large majority of immigrants without German citizenship living in Germany have neither a German-speaking nor Germanic background, nor a high socioeconomic status, nor originates from western countries. Almost two million of all 7.3 million non-Germans are Turkish citizens, and another almost two million migrants originate from Yugoslavia (respectively former Yugoslavia) and Eastern Europe.16 The high gap be-tween the reading performance of students from these groups and students who speak German at home shows that successful integration of migrants into the German society is highly dependent on whether or not they have a good command of the German lan-guage.
Given its nature as a traditional country of immigration, the high difference of edu-cational achievements between those who speak English at home and those who do not found for New Zealand is somewhat surprising. However, New Zealand is distinctive among the four ‘traditional countries of immigration’ in the emphasis that is given to biculturalism and ethnic diversity. Fourteen per cent of New Zealanders identify them-selves as being Maori (the indigenous population) and this ethnic group has the most prominent role in debates about the development of social and economic policy (Bed-ford 2003). In particular, there is a widening educational inequality which has left many Maori children left relatively worse off. (Blaiclock et al. 2002). As the Maori have their own language (and are encouraged to cultivate it), the reason for the large language-dependent gap most likely arises from the particular situation of Maori children.
Besides language problems (and effects controlled by ISEI), there are other prob-lems due to lack of integration into society which are likewise responsible for the infe-
15 More than 1.1 million migrants without French passport living in France are from North Africa (Mo-rocco: 504 thousand, Algeria: 478 thousand, Tunisia: 154 thousand). Other main countries of origin are Portugal (554 thousand), Turkey (208 thousand), Italy (202 thousand) and Spain (162 thousand). In France, the total of non-nationals amounted to 3.26 million in 1999 which corresponded to 5.6 percent of the French population (Source: SOPEMI 2002, OECD 2003). 16 In 2002, 7.34 million citizens living in Germany (representing 8.9 percent of the resident population) did not have German citizenship. Looking at the stock of foreign population by country, the biggest groups stems from Turkey (1.91 million) and Yugoslavia, respectively former Yugoslavia (1.04 million). A further 891 thousand are of Eastern European origin, of which Polish citizens (317 thousand) and per-sons from countries constituting the former USSR (Russia, Ukraine, Belarus: 310 thousand) are the big-gest groups. As regards migrants from Western countries, Italy (610 thousand) and Greece (359 thousand) are major sources. (Source: Statistisches Bundesamt, German Federal Statistical Office, see also MPI 2003).

11
rior performance of migrants in international PISA test scores. For instance, social capi-tal of migrant families which falls behind that of natives, peer effects of migrants living in disadvantaged urban areas, as well as schooling systems not suitable for the needs of children from foreign cultural backgrounds, all have effects on the school performance of immigrant students. Estimations reported in Table 4 try to capture these residual dif-ferences between migrants and non-migrants which eventually stem from the fact that students are born abroad, or that father or mother are not born in the country of school attendance. Table 4 distinguishes between these effects by using three dichotomous dummy variables (which take the value 1 if logical expressions are correct and 0 if not). All three effects are summarized at the bottom of the table.
Table 4: Estimation of the impact of parental socioeconomic status, country of birth, and language spoken at home on reading literacy Austra-
lia Canada New
ZealandUSA Finland France Ger-
many UK Sweden
Dependent variable: PISA reading literacy score Sample: all students
Constant 423.9** (5.79)
437.3** (2.98)
411.7**(7.64
377.2**(7.71)
425.9**(12.0)
371.0**(9.36)
345.3** (6.35)
404.5** (8.17)
398.4**(6.71)
Student born in the country
23.9** (5.32)
20.1** (2.99)
10.9 (6.25)
17.2* (7.99)
14.8 (10.5)
23.3** (8.15)
16.5* (7.64)
8.70 (5.44)
11.9 (6.62)
Mother born in the country
-15.0** (3.86)
-12.0** (2.24)
-6.92 (5.03)
-1.58 (8.08)
4.36 (12.6)
7.72 (4.43)
-5.51 (7.22)
-1.90 (4.29)
3.72 (5.18)
Father born in the country
-7.43* (3.67)
-14.6** (2.11)
-1.53 (4.87)
-3.02 (7.52)
1.35 (11.0)
13.1** (4.12)
18.3** (6.32)
10.5* (4.42)
2.54 (5.16)
National lan-guage spoken at home
30.8** (4.73)
40.8** (3.08)
63.2** (7.46)
46.5** (7.57)
57.7** (15.5)
31.9** (8.20)
57.4** (7.67)
26.7** (7.68)
39.1** (8.33)
ISEI 1.68** (0.08)
1.33** (0.03)
1.48** (0.09)
1.68** (0.10)
1.09** (0.07)
1.57** (0.08)
1.86** (0.08)
1.86** (0.06)
1.49** (0.08)
R-squared 0.102 0.074 0.096 0.116 0.055 0.117 0.168 0.104 0.099 Nobs. 4798 26657 3262 3181 4505 4130 4443 8472 4156
Total effect of places of birth: herself, father and mother not born in the country 1.4 -6.5 2.4 12.6 20.5 44.0 29.3 17.3 18.2
Foreign places of birth + foreign language spoken at home 32.2 34.3 65.6 59.1 78.2 75.9 86.7 44.0 57.3
Notes: Ordinary least squares (OLS) estimation based on PISA 2000 (OECD 2001). Nobs. = number of observations. (Asymptotic) Standard errors in parentheses. *), **) denotes significance at the 5 percent, and 1 percent level, respectively.
Students from all counties benefit from the fact that they were born and have grown up in the country. Estimated effects are positive and range between 8.70 (UK) and 23.9 (Australia) (though they are only weakly significant for New Zealand, Finland, the UK and Sweden). Thus, in addition to differences in PISA scores originating from the lan-guage spoken at home and the individual socioeconomic status, factors associated with

12
the students’ place of birth also play a role. Though interpretation can only be tentative at this stage, one might think of well-settled networks and more efficient integration (attendance of Kindergarten and primary schools, networks of parents) which have started in the very early stage of life and which contributed to better school perform-ances of immigrant children in later years.
Whereas there is no evident statistical discrimination between countries of immi-gration and European countries with respect to the country of birth of students, the situation changes when the place of birth of parents comes into play. While within all traditional countries of immigration students of parents born abroad achieve better read-ing literacy scores than students whose parents are born in the country, children of par-ents born in the country perform better than children from foreign-born parents in Europe. However, the general impression is that most results turn out to be insignificant which is not surprising given the presence of the highly important impact of parents’ ISEI in all regressions. Thus, it is interesting to focus on significant results. We find that in Australia and Canada both parents are associated with negative effects on PISA scores when both are born in the country, conversely there are positive effects if they are born abroad. Thinking of indirect effects arising from multipliers of social interac-tion (see, for instance, Glaeser et al. 2002), this result might be due to some positive externalities from networks within the group of highly educated and highly skilled im-migrants typical for these countries. This contrasts with Germany, France and UK where students perform better when their parents (in particular their father) is native. As impacts from mothers are insignificant, in Europe positive externalities from integration seem to depend on the person whose socioeconomic status is highest within the family which coincides with the father for all three countries under consideration (see Baumert and Schuemer 2001, p. 348, for ISEI dependent on gender).
Summing up, we observe that the marginal effect of place of birth significantly matters for France (44 points) and Germany (29.3), and to a lesser extent for the UK (17.3) and Sweden (18.2), whereas the effects are much smaller or even negative for Australia (1.4), Canada (-6.5) and New Zealand (2.4), i.e. countries which select immi-gration according to well-defined criteria. Adding the more important impact from the language spoken at home, the gap between non-migrants and migrants (here defined as students born abroad, with both parents born abroad, and foreign language spoken at home) is widening dramatically. In Germany, the effect amounts to 86.7 points which is even more than the difference between the OECD average (500) and the Mexican score (422). Also French (75.9) and Finnish (78.2) migration gaps are quite high, followed by the difference in New Zealand (65.6) which is mainly caused by language problems. Least important differences show up for Australia (32.2) and Canada (34.3). Moreover, as positive net effects in Australia and Canada arise due to externalities associated with the foreign birthplace of children, the effect will almost vanish when foreign parents have children born in these countries (Australia: 32.2-20.1=12.1, Canada: 14.2), whereas the migrant malus remains highly relevant for Germany (70.2) and France (52.6).
Given the consideration of migration status and language spoken at home, is there any change of country-specific socioeconomic gradients? Comparing Table 3 and Table 4 reveals that curves have become somewhat flatter when controlling for migration is-sues, but only the change in Germany is statistically significant. Notwithstanding, Ger-many still has the steepest socioeconomic gradient, being now on a par with the United

13
Kingdom (1.86). Flatter curves do exist for Sweden (1.49) and for Canada (1.33) as well as for New Zealand (1.48), with the latter two countries starting from a higher level (see estimated constants, which are 437.3 for Canada, 411.7 for New Zealand and 398.4 for Sweden). Again, the flattest gradient is confirmed for Finland (1.09).
4. Calculation of Scenarios Dependent on the Presence or Absence of Migration Backgrounds Previous results have shown that PISA scores can differ dramatically between migrants and non-migrants within countries. However, estimated gaps such as, for instance, the one for Germany are still underestimated because the relevant socioeconomic status of migrants is lower than the average of all observations which underlie respective OLS regressions and differences deduced from them, whereas migration effects for Canada and New Zealand are overestimated because here ISEI of migrants exceeds that of na-tives (see Table 2). We therefore run three different scenarios:
I. Non-migrants (natives): Student is born in the country, both par-ents are born in the country, the national language is spoken at home
II. Non-integrated migrants (minor knowledge of national language): Student is born in a foreign country, both parents are born in a foreign country, a foreign language is spoken at home
III. Integrated migrants (knowledge of national language): Student is born in a foreign country, both parents are born in a foreign coun-try, the national language is spoken at home
All scenarios are based on regressions performed above, i.e. on
PISA = c + (Foreign_born=0) + (Father_foreign_born=0) (Mother_foreign_born=0) + (Language_at_home=national)
+ (ISEI) + residual
α βγ δλ
+
Imputation of PISA scores according to scenarios I, II and III requires mean ISEI of corresponding sub-samples:
PISA_I = c + α + β + γ + δ + λ (ISEI_I),
PISA_II = c + λ (ISEI_II),
PISA_III = c + δ + λ (ISEI_III),
where
ISEI_i, i= I, II, III = mean of sub-samples I, II, III.17
17 As OLS refers to deviations from mean values, we only calculate fitted values based on means.
14
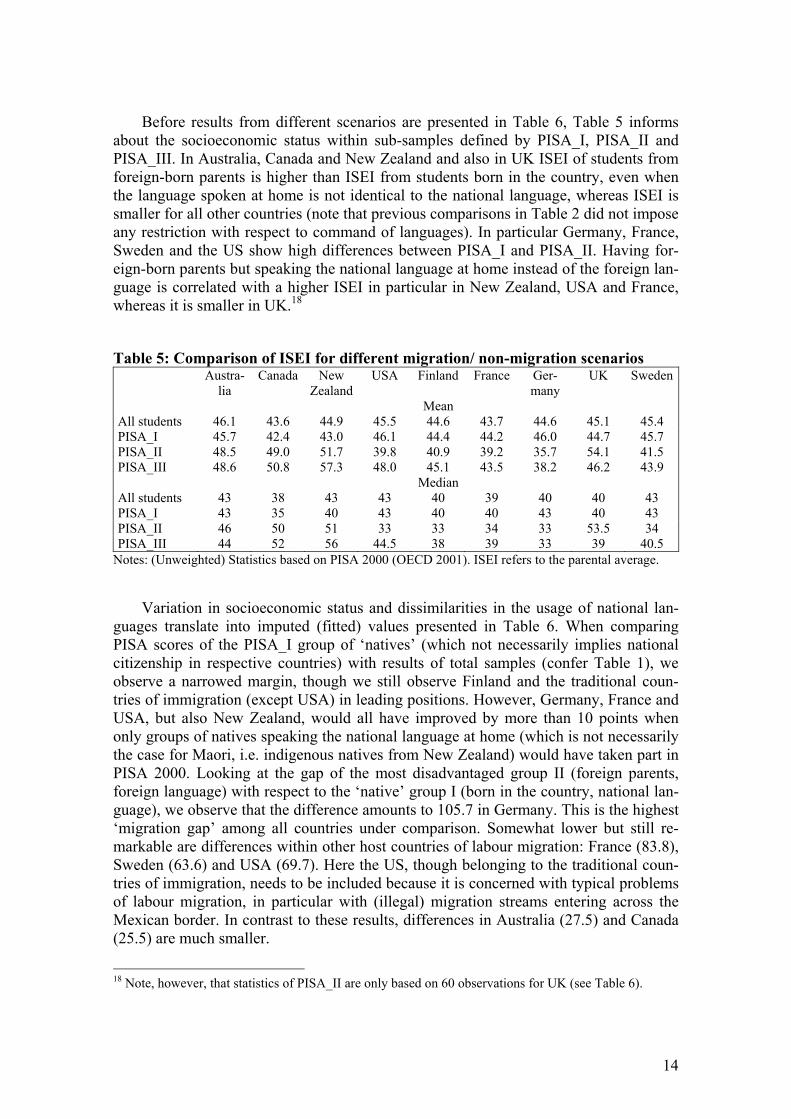
Before results from different scenarios are presented in Table 6, Table 5 informs about the socioeconomic status within sub-samples defined by PISA_I, PISA_II and PISA_III. In Australia, Canada and New Zealand and also in UK ISEI of students from foreign-born parents is higher than ISEI from students born in the country, even when the language spoken at home is not identical to the national language, whereas ISEI is smaller for all other countries (note that previous comparisons in Table 2 did not impose any restriction with respect to command of languages). In particular Germany, France, Sweden and the US show high differences between PISA_I and PISA_II. Having for-eign-born parents but speaking the national language at home instead of the foreign lan-guage is correlated with a higher ISEI in particular in New Zealand, USA and France, whereas it is smaller in UK.18
Table 5: Comparison of ISEI for different migration/ non-migration scenarios Austra-
lia Canada New
ZealandUSA Finland France Ger-
many UK Sweden
Mean All students 46.1 43.6 44.9 45.5 44.6 43.7 44.6 45.1 45.4 PISA_I 45.7 42.4 43.0 46.1 44.4 44.2 46.0 44.7 45.7 PISA_II 48.5 49.0 51.7 39.8 40.9 39.2 35.7 54.1 41.5 PISA_III 48.6 50.8 57.3 48.0 45.1 43.5 38.2 46.2 43.9 Median All students 43 38 43 43 40 39 40 40 43 PISA_I 43 35 40 43 40 40 43 40 43 PISA_II 46 50 51 33 33 34 33 53.5 34 PISA_III 44 52 56 44.5 38 39 33 39 40.5
Notes: (Unweighted) Statistics based on PISA 2000 (OECD 2001). ISEI refers to the parental average.
Variation in socioeconomic status and dissimilarities in the usage of national lan-guages translate into imputed (fitted) values presented in Table 6. When comparing PISA scores of the PISA_I group of ‘natives’ (which not necessarily implies national citizenship in respective countries) with results of total samples (confer Table 1), we observe a narrowed margin, though we still observe Finland and the traditional coun-tries of immigration (except USA) in leading positions. However, Germany, France and USA, but also New Zealand, would all have improved by more than 10 points when only groups of natives speaking the national language at home (which is not necessarily the case for Maori, i.e. indigenous natives from New Zealand) would have taken part in PISA 2000. Looking at the gap of the most disadvantaged group II (foreign parents, foreign language) with respect to the ‘native’ group I (born in the country, national lan-guage), we observe that the difference amounts to 105.7 in Germany. This is the highest ‘migration gap’ among all countries under comparison. Somewhat lower but still re-markable are differences within other host countries of labour migration: France (83.8), Sweden (63.6) and USA (69.7). Here the US, though belonging to the traditional coun-tries of immigration, needs to be included because it is concerned with typical problems of labour migration, in particular with (illegal) migration streams entering across the Mexican border. In contrast to these results, differences in Australia (27.5) and Canada (25.5) are much smaller.
18 Note, however, that statistics of PISA_II are only based on 60 observations for UK (see Table 6).

15
Table 6: Comparison of different migration/ non-migration scenarios: imputation of PISA scores Austra-
lia Canada New
ZealandUSA Finland France Ger-
many UK Sweden
PISA_I 532.9 528.0 540.9 513.8 552.7 516.4 517.4 531.4 523.9 Nobs. PISA_I 2827 21306 2113 2748 4381 3319 3803 7467 3357 PISA_II 505.4 502.5 488.1 444.1 470.7 432.6 411.7 504.8 460.3 Nobs. PISA_II 325 1007 230 193 37 49 205 60 177 PISA_III 536.4 545.6 559.6 504.4 532.9 471.3 473.6 516.9 503.1 Nobs. PISA_III 197 519 184 67 9 30 106 110 33
Notes: Imputations are based on Table 4 and on sub-sample means of ISEI presented in Table 5. Nobs. = number of observations. See the text for details.
Use of the national language at home instead of a foreign language would improve the reading literacy score of students whose parents are born abroad. Most significant upward shifts (PISA_III vs. PISA_II) can be observed for New Zealand (71.5), Ger-many (61.9) and the US (60.3). Children from migrants in New Zealand strongly benefit from speaking the majority language at home, and also in Australia and Canada imputed PISA_III scores are even above those of the group of natives represented by PISA_I. Obviously, within these countries PISA_III mainly consists of children of highly edu-cated and high-skilled business migrants, whereas in countries like Germany and France, though assimilation of labour migrants (in terms of practising the national lan-guage) would lead to a highly significant improvement of reading achievements, school performance of immigrants would still clearly lag behind that of native inhabitants.
5. Results for Mathematical and Scientific Literacy
Calculations and estimation procedures have been replicated for OECD data sets on mathematical and scientific literacy. Results are presented in the Appendix. They strongly confirm our findings based on reading literacy. As regards effects from the simple fact that parents and students are born abroad (given that we control for language and socioeconomic background), which we interpret as consequences of lacking inte-gration, we again observe that these effects are highest in France, Germany and (to a smaller degree) in Sweden (see ‘total effects of place of birth’ in Tables 4, M3 and S3), and that in particular for Germany and France school problems in either discipline are dramatically reinforced by language problems (see bottom lines of same tables). The high socioeconomic gradient is confirmed for Germany (though it is somewhat smaller for scientific literacy, see Table S3), but it turns out that besides the UK the US society also seems to be characterized by a relatively high degree of social immobility. This result holds particularly for students with migration background where the parameter estimate on ISEI (i.e. the socioeconomic gradient) for both the UK and US is above two in Tables M2 and S2 (see Appendix). The US result challenges the popular view of high social mobility (“from dishwasher to millionaire”) in the US.
Summing up, results based on mathematical and scientific literacy confirm the grouping of countries discussed before. Large differences in educational achievements can be explained by the presence or absence of migration backgrounds, combined with socioeconomic background and potential language problems of immigrants. Using these

16
criteria we have a first cluster consisting of France, Germany and Sweden (though re-sults for Sweden are somewhat less significant), while Australia, Canada and New Zea-land differ from the first cluster with respect to national PISA scores but also with re-spect to population characteristics of migrants. The US and UK cannot be identified as unambiguously belonging to one or the other group, though all in all the US might be more affected by problems of labour migration (like most European countries), whereas the UK is somewhat closer to the situation of traditional countries of immigration due to the large share of West-European labour migrants.
6. Summary and Conclusions Results of the Programme for International Student Assessment (PISA) revealed that the school performance of 15-year-olds seems to be dependent on whether or not partici-pants live in traditional countries of immigration (namely Australia, Canada or New Zealand). Only teenagers from Finland had a significantly better score than students from this group of nations. Some other European countries such as France and Germany but also the US performed significantly worse than these top ranking countries. In re-sponse to these results, there is an ongoing discussion about the reasons of differing average proficiency levels across countries.
The purpose of this article is to evaluate the importance of social class, migration background and command of national languages for the PISA school performance of teenagers living in European countries (France, Finland, Germany, United Kingdom, and Sweden) and traditional countries of immigration. Whereas mainly France, Ger-many and Sweden are considered as typical countries concerned with labour migration, Australia, Canada and New Zealand mainly select business migrants according to cur-rent national needs for high-skilled workers. The situation in the US is different because of its high share of labour migrants entering across the Mexican border.
In keeping with our aims, we present several country-by-country comparisons. Some initial descriptive analysis shows that the key difference between the traditional countries of immigration, Australia, Canada and New Zealand, but also the UK, on the one hand, and France, Germany and Sweden on the other hand is the social background of immigrant families. While within traditional countries of immigration and the UK the socioeconomic status of migrants (measured by ISEI) even exceeds that of national av-erages, ISEI values of natives exceed that of inhabitants with a migration background in France, Germany, Sweden and the US.
Our econometric results show that the impact curves of the socioeconomic status of parents on the school performance of their children differ strongly across nations, with the steepest rises found for Germany, the UK and US, whereas the socioeconomic gra-dient appears to be smaller in Scandinavian countries and in Canada. These results are important for comparing chances of social mobility of immigrants across countries. Within countries of labour migration as in Germany, for instance, where the large ma-jority of citizens without German citizenships have a poor socioeconomic background, the consequence of the high socioeconomic gradient is that immigrants are trapped by lack of social mobility and more probably keep within lowest social classes.
Educational inequalities between such social classes can be enormous, as can be seen from the difference in PISA reading scores of students with and without migration

17
background. Calculation of different scenarios shows that the gap of the most disadvan-taged migration group (foreign parents, foreign language spoken at home) with respect to the group of natives (students born in the country, national language spoken at home) amounts to 105.7 PISA score points for Germany, 83.8 for France, 69.7 for the US and 63.6 for Sweden. In contrast to these results, differences in Australia (27.5) and Canada (25.5) are much smaller.
However, our empirical results also show that a key for catching up is the language spoken at home. Reading proficiency scores of migrant students improved significantly when the language spoken at home is the national language as opposed to some foreign language. Our results suggest that a substantial share of the ‘migration gap’ can be re-duced within countries of labour migration (in Germany, the upward shift would amount to 61.9 points of the aforementioned gap of 105.7), whereas practising national languages at home would even lead to the outperformance of native students in tradi-tional countries of immigration.
The high gap between the school performance of immigrant students who speak na-tional languages at home and those who do not shows that successful integration of la-bour migrants into European societies is highly dependent on whether or not they have a good command of national languages. Educational policies in countries like Germany should focus on integration of immigrant children in schools and preschools, with par-ticular emphasis on language skills at the early stage of childhood. Improved school performance, higher labour productivity and lower social costs in later stages of life would make such investments in human and social capital highly profitable.
7. References Adams, R. and C. Carstensen (2002), Scaling Outcomes, in: Adams, R. and M. Wu
(eds.), PISA 2000 Technical Report, OECD, Paris, 149-162.
Adler, N. E., T. Boyce, M.A. Chesney, S. Cohen, S. Folkman, R.L. Kahn, and S.L. Syme (1994), Socioeconomic status and health: The challenge of the gradient, American Psychologist 49, 15-24.
Blaiklock, A. J., C.A. Kiro, M. Belgrave, W. Low, E. Davenport and I. B. Hassall (2002), When the Invisible Hand Rocks the Cradle: New Zealand Children in a Time of Change, Innocenti Working Paper No. 93, Florence: UNICEF Innocenti Research Centre.
Baumert, J. and G. Schümer (2001), Familiäre Lebensverhältnisse, Bildungsbeteiligung und Kompetenzwettbewerb, in: Deutsches PISA-Konsortium (Ed.), PISA 2000. Basiskompetenzen von Schülerinnen und Schülern im internationalen Vergleich. Opladen: Leske und Budrich, 323-407.
Baumert, J., U. Trautwein and C. Artelt (2003), Schulumwelten – institutionelle Bedin-gungen des Lehrens und Lernens, in: Deutsches PISA-Konsortium (Ed.), PISA 2000. Ein differenzierter Blick auf die Länder der Bundesrepublik Deutschland, Opladen: Leske und Budrich, 261-331.

18
Bedford, R. (2003), New Zealand: The Politicization of Immigration, Migration Policy Institute (MPI), http://www.migrationinformation.org (January 15, 2004).
Bielby, W. T. (1981), Models of status attainment, Social Stratification and Mobility 1, 3-26.
Fertig, M. And C.M. Schmidt (2002), The Role of Background Factors for Reading Literacy: Straight National Scores in the PISA 2000 Study, IZA Discussion Pa-per No 545, IZA (Bonn).
Fertig, M. (2003), Who’s to Blame? The Determinants of German Students’ Achieve-ments in the PISA 2000 study, IZA Discussion Paper No 739, IZA (Bonn).
Frick, and G. Wagner (2001), Economic and Social Perspectives of Immigrant Children in Germany, IZA Discussion Paper No 301, IZA (Bonn).
Gang, I.N. and K.F. Zimmerman (2000), Is Child like Parent? Educational Attainment and Ethnic Origin, Journal of Human Resources 35, 550-569.
Ganzeboom, H.B.G., P.M. De Graaf, D.J. Treiman, J. De Leeuw (1992), A Standard International Socio-Economic Index of Occupational Status, Social Science Research 21, 1-56.
Glaeser, E.L., B.I. Sacerdore and J.A. Scheinkman (2002), The Social Multiplier, NBER Working Paper 9153.
Hamilton, K., P. Simon, C. Veniard (2002), The Challenge of French Diversity, Migra-tion Policy Institute (MPI), http://www.migrationinformation.org (January 15, 2004).
Inglis, C. (2002), Australia's Transformation, Migration Policy Institute (MPI), http://www.migrationinformation.org (January 15, 2004).
Krawchuk, S. and K. Rust (2002) Sample Design, in: Adams, R. and M. Wu (eds.), PISA 2000 Technical Report, OECD, Paris, 39-56.
MPI (2002), A New Century: Immigration and the US, Migration Policy Institute (MPI), http://www.migrationinformation.org (January 15, 2004).
MPI (2003), Migration Information Source, http://www.migrationinformation.org/ GlobalData/countrydata/data.cfm.
OECD (2001), The OECD Programme for International Student Assessment (PISA), http://www.pisa.oecd.org/ (January 15, 2004).
OECD (2003), Trends in International Migration, SOPEMI 2002, Paris.
Ray, B. (2002), Canada: Policy Legacies, New Directions, and Future Challenges, Mi-gration Policy Institute (MPI), http://www.migrationinformation.org (January 15, 2004).
Sewell, D. H. and R.M. Hauser (1975), Education, Occupation and Earnings, New York: Academic Press.
Stanat, P. (2003), Schulleistungen von Jugendlichen mit Migrationshintergrund: Diffe-renzierung deskriptiver Befunde aus PISA und PISA-E, in: Deutsches PISA-Konsortium (Ed.), PISA 2000. Ein differenzierter Blick auf die Länder der Bun-desrepublik Deutschland, Opladen: Leske und Budrich, 243-260.

19
Statistics Canada (2003), Measuring up: The performance of Canada’s youth in reading, mathematics and science, http://www.statcan.ca/english/freepub/81-590-XIE/free.htm (January 15, 2004).
Weber, A.M. (2003), What Influences the Performance of Immigrant Children? An analysis using German PISA data, mimeographed, ZEW (Mannheim).
White, K. R. (1982), The Relation Between Socioeconomic Status and Academic Achievement, Psychological Bulletin 91, 461-481.
Willms, J. D. (1998), Community Differentials in Adult Literacy Skills in Northern Ire-land, in: K. Sweeney (Ed.), Adult Literacy in Northern Ireland, Belfast: Northern Ireland Statistics and Research Agency.
Willms, J. D. (2003), Ten Hypotheses about Socioeconomic Gradients and Community Differences in Children’s Developmental Outcomes, Final Report, Applied Re-search Branch of Strategic Policy, Human Resources Development Canada.
Wößmann, L. (2003), Schooling Resources, Educational Institutions and Student Per-formance: the International Evidence, Oxford Bulletin of Economics and Statis-tics 65, 117- 170.
Appendix Mathematics Table M1: Comparison of mean MATHEMATICAL literacy scores Austra-
lia Canada New
Zealand USA Finland France Ger-
many UK Sweden
All students Mean 530.85 524.93 537.53 482.56 537.99 517.12 500.09 529.52 510.06Std Dev 93.39 84.52 98.56 97.52 79.29 89.33 99.70 92.22 92.94Median 535.74 526.58 543.02 485.39 539.81 522.03 505.28 534.24 513.6Nobs.
2859 16489 2048 2135 2703 2597 2830 5195 2464
Students with migration background (both parents foreign-born) Mean 531.40 527.90 525.19 456.33 493.97 477.51 434.95 498.12 457.46Std Dev 93.73 85.92 106.95 97.38 119.19 89.68 99.04 99.28 96.71Median 536.75 529.46 535.79 454.00 508.52 483.26 431.95 509.82 459.22Nobs.
607 2015 380 298 29 278 402 281 250
Share of students with migration background (in percent) 21.23 12.22 18.55 13.96 1.07 10.70 14.20 5.41 10.15 Difference between national medians and median scores of immigrant students -1.01 -2.88 7.23 31.39 31.29 38.77 73.33 24.42 54.38
Notes: (Unweighted) Statistics based on PISA 2000 (OECD 2001). Nobs. = number of observations.

20
Table M2: Estimation of the total impact of parental socioeconomic status on stu-dents’ MATHEMATICAL achievement Austra-
lia Canada New
ZealandUSA Finland France Ger-
many UK Sweden
Explana-tory var.
Dependent variable: PISA mathematical literacy score Sample: all students
Constant 458.1** (4.56)
478.5** (1.74)
482.7** (5.48)
410.5** (6.01)
497.4** (4.16)
462.3** (4.71)
411.7** (4.92)
459.1** (3.41)
436.3**(5.23)
ISEI 1.66**
(0.09) 1.11** (0.03)
1.33** (0.11)
1.81** (0.12)
0.93** (0.08)
1.36** (0.10)
2.05** (0.10)
1.68** (0.07)
1.67** (0.10)
R-squared 0.105 0.053 0.066 0.107 0.042 0.070 0.126 0.103 0.089 Nobs. 2740 15972 1960 1788 2644 2435 2738 4902 2406
Sub-sample: students with both parents foreign-born Constant 472.4**
(9.70) 476.0** (5.24)
446.2** (14.71)
378.1** (15.51)
515.9** (50.31)
437.9** (14.75)
374.6** (14.15)
413.8** (15.60)
405.9**(16.34)
ISEI 1.38**
(0.20) 1.13** (0.10)
1.71** (0.26)
2.03** (0.32)
-0.20 (1.09)
1.27* (0.35)
1.77** (0.36)
2.05** (0.31)
1.33** (0.35)
R-squared 0.07 0.059 0.102 0.145 0.001 0.050 0.060 0.148 0.059 Nobs. 577 1951 355 228 28 239 381 251 232
Sub-sample: students with both parents born in the country Constant 450.1**
(6.04) 478.0** (1.95)
487.8** (6.77)
418.0** (6.68)
497.0** (4.25)
477.5** (5.31)
441.1** (5.28)
461.9** (3.69)
442.6**(5.76)
ISEI 1.79**
(0.12) 1.09** (0.04)
1.35** (0.14)
1.75** (0.13)
0.95** (0.08)
1.19** (0.11)
1.70** (0.10)
1.67** (0.07)
1.66** (0.11)
R-squared 0.118 0.050 0.066 0.103 0.043 0.057 0.108 0.102 0.092 Nobs. 1574 12434 1205 1441 2524 1842 2122 4107 1924
Notes: Ordinary least squares (OLS) estimation based on PISA 2000 (OECD 2001). Nobs. = number of observations. (Asymptotic) Standard errors in parentheses. *), **) denotes significance at the 5 percent, and 1 percent level, respectively.

21
Table M3: Estimation of the impact of parental socioeconomic status, country of birth, and language spoken at home on MATHEMATICAL literacy Austra-
lia Canada New
ZealandUSA Finland France Ger-
many UK Sweden
Dependent variable: PISA mathematical literacy score Sample: all students
Constant 445.3** (6.78)
467.5** (3.55)
455.7**(9.63)
364.8**(10.1)
452.2**(14.5)
399.0**(12.64)
356.0** (8.65)
423.6** (9.83)
385.2**(9.04)
Student born in the country
18.63** (6.21)
8.22* (3.61)
5.42 (7.69)
19.11 (10.35)
-1.32 (12.99)
39.26**(11.27)
-2.30 (9.94)
-7.50 (6.53)
6.53 (9.09)
Mother born in the country
-7.7 (4.51)
-6.45* (2.71)
4.01 (6.29)
-15.98 (10.63)
-0.08 (14.70)
12.88* (6.04)
0.72 (9.37)
-1.82 (5.18)
17.04* (7.19)
Father born in the coun-try
-13.06** (4.36)
-3.46 (2.53)
-3.04 (6.07)
13.62 (9.55)
-12.17 (13.52)
12.53* (5.51)
25.18** (8.53)
19.84** (5.36)
7.28 (6.96)
National lan-guage spoken at home
16.4** (5.55)
15.05** (3.67)
28.78**(9.14)
38.93**(9.33)
58.97**(17.76)
12.70 (11.14)
61.06** (10.26)
27.35** (9.18)
29.11**(10.98)
ISEI 1.63** (0.09)
1.10** (0.03)
1.35** (0.11)
1.72** (0.12)
0.96** (0.89)
1.23** (0.10)
1.72** (0.10)
1.69** (0.07)
1.63** (0.10)
R-squared 0.113 0.056 0.073 0.128 0.048 0.083 0.163 0.107 0.113 Nobs. 2657 14819 1807 1752 2494 2292 2473 4692 2329
Total effect of places of birth: herself, father and mother not born in the country -2.12 -1.69 6.39 16.75 -13.58 64.69 23.62 10.50 30.86
Foreign places of birth + foreign language spoken at home 14.28 13.36 35.17 55.69 45.38 77.39 84.68 37.86 59.98
Notes: Ordinary least squares (OLS) estimation based on PISA 2000 (OECD 2001). Nobs. = number of observations. (Asymptotic) Standard errors in parentheses. *), **) denotes significance at the 5 percent, and 1 percent level, respectively. Table M4: Comparison of different migration/ non-migration scenarios: imputa-tion of MATHEMATICAL literacy scores Austra-
lia Canada New
ZealandUSA Finland France Ger-
many UK Sweden
PISA_I 534.52 527.65 548.97 499.87 540.40 530.69 519.81 536.50 519.33 Nobs. PISA_I 1534 11822 1153 1526 2426 1861 2101 4133 1890 PISA_II 525.44 522.39 529.20 433.17 492.17 446.91 416.45 519.22 455.32 Nobs. PISA_II 188 581 137 95 22 28 102 33 102 PISA_III 539.58 537.45 563.11 486.77 554.76 462.45 478.80 524.66 493.01 Nobs. PISA_III 108 285 99 38 3 20 57 64 22
Notes: Imputations are based on Table M3 and on sub-sample means of ISEI calculated from the OECD-data base on mathematical literacy. Nobs. = number of observations. See the text for details.

22
Sciences Table S1: Comparison of mean SCIENTIFIC literacy scores Austra-
lia Canada New
Zealand USA Finland France Ger-
many UK Sweden
All students Mean 524.97 520.79 526.45 490.53 538.48 500.46 495.54 528.65 511.47Std Dev 98.30 88.84 100.10 99.56 86.35 103.56 101.68 100.25 93.54Median 529.82 523.31 533.23 489.93 540.51 503.49 501.1 530.87 517.21Nobs.
2860 16488 2029 2129 2710 2592 2855 5179 2444
Students with migration background (both parents foreign-born) Mean 518.56 516.51 506.42 458.33 468.08 438.38 422.52 501.53 454.50Std Dev 104.27 92.20 108.32 98.64 98.01 98.07 100.29 105.51 95.01Median 524.55 520.67 510.87 448.92 455.95 429.49 418.21 504.14 450.62Nobs.
555 1960 370 312 32 291 392 286 241
Share of students with migration background (in percent) 19.41 11.89 18.24 14.65 1.18 11.23 13.73 5.52 9.86
Difference between national medians and median scores of immigrant students 5.27 2.64 22.36 41.01 84.56 74.00 82.90 26.74 66.59
Notes: (Unweighted) Statistics based on PISA 2000 (OECD 2001). Nobs. = number of observations.

23
Table S2: Estimation of the total impact of parental socioeconomic status on stu-dents’ SCIENTIFIC achievement Austra-
lia Canada New
ZealandUSA Finland France Ger-
many UK Sweden
Explana-tory var.
Dependent variable: PISA scientific literacy score Sample: all students
Constant 465.2** (4.93)
469.7** (1.81)
458.3** (5.59)
420.6** (6.04)
496.8** (4.61)
420.4** (5.40)
406.4** (5.12)
448.7** (3.72)
449.1**(5.32)
ISEI 1.40**
(0.10) 1.23** (0.03)
1.62** (0.11)
1.77** (0.12)
0.95** (0.09)
1.93** (0.11)
2.06** (0.10)
1.89** (0.07)
1.42** (0.11)
R-squared 0.066 0.059 0.091 0.101 0.035 0.105 0.118 0.107 0.064 Nobs. 2736 15977 1954 1800 2662 2428 2773 4925 2391
Sub-sample: students with both parents foreign-born Constant 461.8**
(11.78) 453.2** (5.46)
417.7** (14.36)
348.7** (14.57)
431.5** (53.71)
396.1** (15.65)
343.0** (14.42)
404.6** (16.84)
447.6**(16.35)
ISEI 1.34**
(0.23) 1.40** (0.10)
1.96** (0.26)
2.72** (0.31)
0.85 (1.15)
1.19* (0.37)
2.27** (0.36)
2.20** (0.32)
0.31 (0.37)
R-squared 0.056 0.083 0.131 0.223 0.019 0.039 0.093 0.150 0.003 Nobs. 531 1891 350 252 30 255 373 260 223
Sub-sample: students with both parents born in the country Constant 460.2**
(6.20) 473.0** (2.04)
468.0** (6.70)
438.0** (6.80)
497.2** (4.67)
434.6** (6.02)
440.9** (5.52)
450.2** (4.05)
456.7**(5.92)
ISEI 1.54**
(0.12) 1.18** (0.04)
1.55** (0.14)
1.55** (0.13)
0.97** (0.09)
1.82** (0.12)
1.62** (0.11)
1.89** (0.08)
1.38** (0.12)
R-squared 0.084 0.053 0.084 0.081 0.037 0.102 0.088 0.107 0.063 Nobs. 1596 12492 1240 1425 2554 1827 2153 4133 1901
Notes: Ordinary least squares (OLS) estimation based on PISA 2000 (OECD 2001). Nobs. = number of observations. (Asymptotic) Standard errors in parentheses. *), **) denotes significance at the 5 percent, and 1 percent level, respectively.

24
Table S3: Estimation of the impact of parental socioeconomic status, country of birth, and language spoken at home on SCIENTIFIC literacy Austra-
lia Canada New
ZealandUSA Finland France Ger-
many UK Sweden
Dependent variable: PISA scientific literacy score Sample: all students
Constant 437.3** (7.54)
439.8** (3.77)
406.5**(9.50)
380.4**(9.63)
420.2**(15.65)
339.1**(13.51)
343.0** (8.43)
398.2** (10.90)
388.0**(9.29)
Student born in the country
12.41 (6.97)
5.97 (3.75)
5.47 (7.85)
-0.13 (9.99)
9.88 (13.85)
33.49**(12.12)
20.88* (10.42)
16.09* (7.32)
20.23**(8.88)
Mother born in the country
-9.30 (4.95)
-5.29 (2.81)
-10.71 (6.45)
13.54 (10.30)
-1.25 (17.21)
18.78**(6.69)
3.88 (10.25)
4.98 (5.71)
2.62 (7.29)
Father born in the country
-7.60 (4.68)
-6.89** (2.66)
9.06 (6.15)
5.50 (9.56)
12.87 (14.83)
25.01**(6.27)
16.00 (8.44)
1.84 (5.83)
5.83 (7.22)
National lan-guage spoken at home
37.39** (6.15)
39.72** (3.91)
61.16**(9.25)
32.47**(10.02)
56.12* (22.21)
18.59 (12.33)
56.87** (10.39)
30.12** (10.08)
41.85**(11.55)
ISEI 1.37** (0.10)
1.22** (0.04)
1.61** (0.11)
1.69** (0.12)
1.00** (0.09)
1.84** (0.11)
1.65** (0.10)
1.89** (0.08)
1.36** (0.11)
R-squared 0.084 0.069 0.124 0.131 0.048 0.140 0.163 0.110 0.094 Nobs. 2648 14778 1808 1768 2522 2301 2483 4728 2297
Total effect of places of birth: herself, father and mother not born in the country -4.49 -6.21 3.83 18.91 21.50 77.29 40.77 22.92 28.69
Foreign places of birth + foreign language spoken at home 32.90 33.51 64.99 51.38 77.63 95.89 97.64 53.05 70.55
Notes: Ordinary least squares (OLS) estimation based on PISA 2000 (OECD 2001). Nobs. = number of observations. (Asymptotic) Standard errors in parentheses. *), **) denotes significance at the 5 percent, and 1 percent level, respectively. Table S4: Comparison of different migration/ non-migration scenarios: imputation of SCIENTIFIC literacy scores Austra-
lia Canada New
ZealandUSA Finland France Ger-
many UK Sweden
PISA_I 532.44 525.06 540.10 509.89 542.37 517.00 517.37 535.43 520.60 Nobs. PISA_I 1581 11884 1176 1526 2450 1849 2135 4160 1856 PISA_II 500.75 499.32 488.81 449.83 463.67 413.90 402.85 501.48 439.24 Nobs. PISA_II 163 530 122 116 21 33 120 35 92 PISA_III 544.09 542.33 555.65 494.88 518.02 435.63 466.99 521.38 485.88 Nobs. PISA_III 102 278 108 28 6 14 56 65 16
Notes: Imputations are based on Table S3 and on sub-sample means of ISEI calculated from the OECD-data base on scientific literacy. Nobs. = number of observations. See the text for details.