entrepreneurial learning and strategic foresight
TRANSCRIPT
Entrepreneurial Learning and Strategic Foresight ∗
Aticus Peterson †
Strategy Unit
Harvard Business School
Andy Wu ‡
Strategy Unit
Harvard Business School
January 29, 2021
Abstract. We study how learning by experience across projects affects an entrepreneur’sstrategic foresight. In a quantitative study of 314 entrepreneurs across 722 crowdfundedprojects supplemented with a program of qualitative interviews, we counterintuitively findthat entrepreneurs make less accurate predictions as they gain experience executing projects:they miss their predicted deadline to bring a product to market by nearly six additionalweeks on each successive project. Although learning should improve prediction accuracyin principle, we argue that entrepreneurs also learn of opportunities to augment each suc-cessive product, which drastically expands the interdependencies beyond what a boundedlyrational entrepreneur can anticipate. We find that in a subsequent project, entrepreneursencounter more unforeseen interdependencies, and they sacrifice on-time delivery to addressthese interdependencies.
Keywords: Entrepreneurship, Learning, Experience, Complexity, Interdependency,Strategic Foresight, Prediction, Crowdfunding, Product Development
∗The authors gratefully acknowledge feedback from Daniel Albert, Juan Alcacer, Goran Calic, DavidClough, Gary Dushnitsky, JP Eggers, Martin Ganco, Giovanni Gavetti, Sourobh Ghosh, Laura Katsnelson,Chengguang Li, Rory McDonald, Cynthia Montgomery, Jan Rivkin, Daniel Sands, Kourosh Shafi, Eric Vanden Steen, Bala Vissa, Maciej Workiewicz, and participants at the HBS Doctoral Student Seminar andHBS Strategy Unit Brown Bag Seminar. This research was made possible by financial support from theHBS Division of Research and Faculty Development. Jaeho Kim and Miaomiao Zhang provided excellentresearch assistance. Jeff Strabone provided copyediting support. All opinions expressed herein are those ofthe authors only, and all errors are the responsibility of the authors.
†Address: Wyss House 202N, 710 N Harvard St, Boston, MA 02134. Telephone: 1 (617) 300-0686. Email:[email protected].
‡Address: Morgan Hall 243, 15 Harvard Way, Boston, MA 02163. Telephone: 1 (617) 495-2795. Email:[email protected]. Corresponding author.
1
1 Introduction
Strategic foresight is the ability to accurately predict the consequences of a strategy and in
turn pursue a superior course of action to build competitive advantage (Ahuja et al., 2005;
Gavetti & Menon, 2016). Heterogeneity in strategic foresight implicitly underlies many the-
ories of competitive advantage (Csaszar & Laureiro-Martınez, 2018): by predicting the value
that resources generate after being developed (Barney, 1986, 1991) and the attractiveness
of potential opportunities (Porter, 1980), entrepreneurs with superior foresight can build
competitive advantage. As such, understanding the antecedents of strategic foresight should
shed critical light on the origins of competitive advantage (Csaszar, 2018), yet research on
this topic has been sparse until recently. Recent studies find that individual cognition (Gary
& Wood, 2011; Kapoor & Wilde, 2020) and organizational structure (Csaszar, 2012) are
determinants of strategic foresight (Csaszar & Laureiro-Martınez, 2018). In particular, re-
cent work emphasizes the specific importance of strategic foresight for entrepreneurs as they
formulate strategy (Eisenhardt & Bingham, 2017; Ott et al., 2017).
Although an entrepreneur may need strategic foresight to build competitive advan-
tage, the conditions that enable an entrepreneur to build strategic foresight are unclear,
particularly as she learns from past experience (Nelson & Winter, 2002) and applies it to
the next entrepreneurial opportunity (Gavetti, 2012). An extensive body of work on serial
entrepreneurship documents how entrepreneurs can improve performance from venture to
venture (e.g., Delmar & Shane, 2006; Gompers et al., 2010; Stuart & Abetti, 1990), but that
improvement could arise from a variety of factors besides improved foresight. Through expe-
rience, a serial entrepreneur accumulates a multitude of advantages (Politis, 2005): resource
access and relationships (Hsu, 2007; Hsu & Ziedonis, 2013), management practices and rou-
tines (Dencker et al., 2009), opportunities (Baron & Ensley, 2006; Gruber et al., 2008), and
knowledge about the consequences of past decisions (Minniti & Bygrave, 2001; Paik, 2014).
Although most of this work does not specifically speak to whether experience improves the
strategic foresight of the entrepreneur, it generally makes this implicit assumption. However,
recent work bringing attention to the bounded rationality of entrepreneurs calls this untested
2
assumption into question altogether. Cognitive limitations constrain what an entrepreneur
can learn from experience and use for effective judgement (Cassar, 2014; Cohen et al., 2019;
Hallen & Pahnke, 2016). In an important study, Eggers & Song (2015) demonstrate that
boundedly rational entrepreneurs may misattribute the sources of past performance and in-
stead come away with the wrong takeaways from a past experience. Thus, it remains an
open question whether entrepreneurs learn from experience to improve strategic foresight.
This study explores this open question for entrepreneurial strategy. Specifically, how
does experience from executing past projects affect the accuracy of an entrepreneur’s strategic
foresight on the subsequent project? Given that tackling complexity is a defining character-
istic of the phenomenon of entrepreneurship and of strategy more generally (Csaszar, 2018;
Leiblein et al., 2018; Nickerson & Argyres, 2018; Van den Steen, 2016), we take the view that
accurate strategic foresight depends on whether the entrepreneur can anticipate the com-
plexity in her strategy. There are two competing mechanisms through which experience can
impact the accuracy of strategic foresight, depending on whether the experience addresses
or exacerbates complexity. On one hand, experience increases the accuracy of strategic fore-
sight if an entrepreneur learns about complexity that can apply to a future project (Ethiraj
et al., 2005). On the other hand, experience decreases the accuracy of strategic foresight if an
entrepreneur learns about opportunities to augment her project, which introduces additional
complexity (Ethiraj et al., 2012). We argue that, when complexity increases rapidly across
projects for a boundedly rational entrepreneur, the latter effect dominates the former. As a
result, we theorize that as entrepreneurs gain experience across projects, they can introduce
additional complexity that causes their strategic foresight to become less accurate.
In a study of 314 entrepreneurs across 722 crowdfunded hardware technology projects
along with a program of qualitative interviews with serial crowdfunding entrepreneurs, we
document a compelling set of empirical relationships consistent with the view of boundedly
rational learning under complexity. In stark contrast to a simple model of learning, we find
that entrepreneurs make less accurate predictions as they gain experience across projects:
they miss their predicted deadline to bring a product to market by a wider margin on
each successive project, even as they actually give themselves more time on later projects.
3

On average, an entrepreneur misses the deadline by nearly six additional weeks on each
subsequent project, and this effect persists: the gap between the predicted deadline and
actual delivery date continues to widen for later and later projects. The ratio between the
delay and the predicted delivery time increases by 53 percentage points on each subsequent
project.
To explain this intriguing pattern, we show that as entrepreneurs gain experience
across projects, their future projects include additions that lead to more and more unfore-
seen interdependencies that they do not account for when making ex ante predictions. In
additional to documenting these patterns in a quantitative analysis, our interviews provide
a detailed view of how these mechanisms result in less accurate predictions. For example,
one entrepreneur initially launched a Bluetooth LEGO brick for his customers to control
motors and lights in their LEGO creations, e.g., a remote-controlled car. From this ini-
tial experience, the entrepreneur learned that it would be valuable for his next project to
also add compatibility with LEGO sensors, e.g., the car could sense darkness to turn on a
light. As the entrepreneur set the timeline for the subsequent product with more features,
he did give himself more time than the previous product by setting the deadline further out.
However, he did not give himself enough time: we show that even with a simple addition,
entrepreneurs encounter an increasing number of unforeseen interdependencies during im-
plementation, suggesting an increase in complexity beyond the ability of an entrepreneur
to foresee. Despite having a working prototype when making his prediction, this LEGO
entrepreneur failed to foresee how adding this feature would have major consequences for
many steps in the manufacturing process, like requiring different, more sophisticated tooling.
His original manufacturer was no longer able to produce the product, and he went through
seven different manufacturers before finding one who could produce the updated brick. Of
course, he then missed his predicted deadline.
This study makes three contributions. First, we build on recent work that highlights
bounded rationality in entrepreneurial learning (Cohen et al., 2019; Eggers & Song, 2015;
Hallen & Pahnke, 2016), and we extend it to encompass the challenge of complexity. We
propose a theory of bounded rationality around complexity that can serve as an alternate
4
or at least more nuanced explanation for documented patterns of entrepreneurial failure
and excess entry which prior literature views as overconfidence (e.g., Camerer & Lovallo,
1999; Cassar, 2010; Chen et al., 2019; Hayward et al., 2006; Wu & Knott, 2006). Second,
we are among the first to leverage product crowdfunding as a setting to study the novel
phenomenon of “serial-product entrepreneurship,” which has properties distinct from both
traditional within-firm studies of organizational learning (e.g., Rapping, 1965; Thompson,
2001) and between-firm studies of serial entrepreneurship (e.g., Eesley & Roberts, 2012; Paik,
2014; Eggers & Song, 2015). Third, this study provides a needed quantitative empirical
examination of strategic foresight, which recent theoretical and qualitative case research
puts forth as an essential but overlooked source of competitive advantage (Eisenhardt &
Bingham, 2017; Gavetti & Menon, 2016; Ott et al., 2017). In doing so, we put forth the
notion that strategic foresight comprises multiple interdependent predictions. Entrepreneurs
who encounter unforeseen challenges face a tradeoff between which initial predictions to fulfill
and which to miss (Ethiraj & Levinthal, 2009; Talbot, 1982). For instance, entrepreneurs
may prioritize some predictions, like that of a new product feature, over other predictions,
like that of a delivery date, when both cannot be achieved.
2 Theoretical Background
2.1 Complexity and Strategic Foresight
To unpack the potential effect of project experience on an entrepreneur’s strategic foresight,
we need to first understand the role that complexity plays in this relationship.
Any given strategy that the entrepreneur might pursue, and needs to make predictions
about, entails complexity. By complexity, we mean the full set of specific interdependen-
cies that exist between the components (or tasks) in the execution of a particular strategy
(Simon, 1962). Thus, the complexity of a given strategy is a function of the number of
components and the dependencies between those components, which together determine the
total number of interdependencies that make up the full complexity of a strategy.1 Com-
1To better align with our empirical context, our terminology for interdependencies differs subtly from how itis described in the NK modeling tradition (Levinthal, 1997; Kauffman, 1995). While what we describe as thenumber of components or features roughly maps to N , what we refer to as the number of interdependenciesis distinct from K. The general notion of K, as the level of interdependence, is traditionally defined as the
5

plexity is not just an idiosyncratic characteristic of some strategies, but a core part of all
strategies: across the board, recent efforts to formally define strategy specifically invoke
complexity and interdependencies as first-order and necessary characteristics of what makes
a course of action strategic at all (Leiblein et al., 2018; Van den Steen, 2016; Nickerson &
Argyres, 2018; Csaszar, 2018). Prior work emphasizes that the complexity of a strategy can
itself be a source of competitive advantage that limits imitation (Rivkin, 2000), such that an
entrepreneur could justify a strategy with high complexity despite its associated difficulty.
The complexity faced by an entrepreneur launching a given project or venture arises
from two categories of interdependencies that make most entrepreneurial strategies meaning-
fully complex. First, interdependencies exist intrinsically to the product design itself (Bald-
win & Clark, 2000; Ethiraj & Posen, 2014), e.g., a working electronics gadget prototype has
interdependencies between the circuit board, sensors, motors, etc. Second, interdependencies
also exist in the broader organization (Heath & Staudenmayer, 2000; Rivkin & Siggelkow,
2003), between individuals or teams within the entrepreneur’s organization, as well as be-
tween an entrepreneur and other organizations, e.g., an entrepreneur is interdependent with
third-party suppliers in the sourcing, manufacturing, distribution, etc., of the product. To-
gether, these make up a significant number of interdependencies that the entrepreneur will
have to work through in execution. Thus, any entrepreneurial strategy for launching a new
venture will be meaningfully complex. A recent review by Townsend et al. (2018) further
emphasizes the core role of complexity in entrepreneurship, while also identifying the need
to better understand how entrepreneurs deal with complexity in their context.
Strategic foresight—and the ability to make accurate predictions related to a poten-
tial strategy—depends critically on the entrepreneur’s ability to anticipate the complexity
and specific interdependencies she will face when later implementing or executing on the
strategy. An accurate strategic prediction requires accounting for the contribution of each
component or task towards performance, but where the contribution of each task depends on
the choices made in other tasks (Gavetti & Menon, 2016). A broad set of work emphasizes
dependencies that a single component n ∈ N has on other components in the system. However, when werefer to the overall project complexity or the (total) number of interdependencies in a project, we mean thesum of all interdependencies across all components, which is closer to N ×K rather than just K.
6

the importance of comprehending interdependencies for effective strategizing for product
design (Pich et al., 2002) and organizational design (Rivkin & Siggelkow, 2003). In more
recent work specifically characterizing the notion of strategic foresight, effective strategic
foresight comes from being able to consider a breadth of complex information (Csaszar &
Laureiro-Martınez, 2018), which guides the execution of interconnected activities (Ott et al.,
2017).
We take the view that entrepreneurship can be characterized as strategic foresight
under complexity. By construction, entrepreneurs pursue more cognitively distant opportu-
nities and then iterate on those opportunities as they learn (Gavetti, 2012). Due to the high
velocity of entrepreneurial markets, entrepreneurship requires operating in novel settings of
interdependencies (Eisenhardt & Bingham, 2017), where the entrepreneur, or anyone else for
that matter, lacks prior experience with the interdependencies to be faced. Given these novel
interdependencies, associative thinking and simple models may not reflect reality (Csaszar &
Laureiro-Martınez, 2018; Eisenhardt & Bingham, 2017; Gavetti, 2012). Thus, entrepreneurs
have a particularly difficult challenge in anticipating the complexity they might face, limiting
their effectiveness in making accurate strategic predictions.
2.2 Experience and Strategic Foresight: Two Channels
Our theory focuses on whether an entrepreneur can learn by experience across projects in
such a way to improve strategic foresight for executing a project. By experience, we mean an
entrepreneurial firm’s past exposure to the execution of tasks relevant to a given prediction;
prior work demonstrates that entrepreneurial experience is most beneficial when directly
relevant to future activities (Dencker et al., 2009; Dencker & Gruber, 2015; Stuart & Abetti,
1990). We identify two competing channels of learning through which past project experience
might impact the accuracy of strategic foresight for a subsequent project.
Learning about Past Complexity On one hand, an entrepreneur can learn about inter-
dependencies by experiencing them when executing past projects: this experience would thus
increase the accuracy of strategic foresight. Prior studies show that both organizations and
individuals can learn from repeating interdependent tasks (Edmondson et al., 2007; Lewis
et al., 2005; Ethiraj et al., 2005). Furthermore, Denrell et al. (2004) show that learning
7
in complex systems is best facilitated when there is continuity of personnel, which is true
by construction for serial entrepreneurship. In theory, if an entrepreneur and her organiza-
tion execute the exact same project over and over again, she will have repeated instances
of exposure to the interdependencies inherent to that project, because the full set of inter-
dependencies that the entrepreneur must address for that project remain the same. With
repetition, the entrepreneur should approach a full understanding of the system of inter-
dependencies in the project. Improved knowledge of the interdependencies that she will
face in execution means that there are fewer interdependencies that she overlooks in her
mental model when she makes predictions prior to execution. Thus, this learning of interde-
pendencies by experiencing them would enable more accurate strategic foresight for future
projects.
A large body of research on entrepreneurial learning from experience points to the idea
that executing projects exposes entrepreneurs to interdependencies, giving them knowledge
they can apply to future projects. As Eisenhardt & Bingham (2017) put it, experience allows
entrepreneurs to “learn more about their strategic playing field.” Baron & Ensley (2006)
find that prototypes of experienced entrepreneurs are richer in content and account for more
dimensions of performance than those of novice entrepreneurs, suggesting that experienced
entrepreneurs consider more interdependencies.
Our theorizing here only focuses on the learning about interdependencies that comes
about from actual experience with execution, independent of heterogeneity in the quality of
that execution. The entrepreneur still needs to run through the motions of executing the
project, which still exposes her to the interdependencies and gives her the knowledge she
can take to future projects.2 While our theorizing here intentionally remains agnostic to
heterogeneity in the performance of past experience, Section 5.1 leverages empirical findings
to post hoc theorize that experience with underperformance in past project execution may
2We also consider an alternative and important behavioral mechanism of performance feedback, wherebypast success or failure relative to aspiration levels may affect future behavior (e.g., Levinthal & March, 1993;Greve, 2003, 1998; Joseph & Gaba, 2015; Eggers & Song, 2015; Cho & Clough, 2015). Appendix SectionA.8 further details this theoretical perspective and presents associated empirical tests evaluating the effectof experiencing success or failure on a past fundraising campaign—as opposed to our main focus of projectexecution—by raising more than or less than the desired amount of money from customers, respectively.
8

be beneficial for making a more accurate future prediction.3
Learning about Opportunities to Increase Complexity On the other hand, project
experience exposes an entrepreneur to opportunities to add new features to her next project,
which increases the complexity by expanding the set of interdependencies faced by the en-
trepreneur: this experience risks decreasing the accuracy of strategic foresight. The en-
trepreneurship literature highlights how entrepreneurs identify opportunities to innovate in
ways that emerge endogenously from their experience (Alvarez & Barney, 2007, 2010). Prior
experience with project execution brings opportunities to an entrepreneur in two key ways.
First, an entrepreneur discovers new opportunities (Shane, 2000) when her experience ex-
poses her to new information about customer needs and ways to serve the market. Second,
an entrepreneur creates new opportunities (Venkataraman, 2003) through an enactment pro-
cess (Aldrich & Ruef, 2006) where in the course of prior experience, she may devise new ways
of combining preexisting knowledge. Both these scenarios lead to new opportunities largely
proximate to prior experience, involving incremental improvements to the prior pursuits.
Acting on these new opportunities by making even just incremental additions to
the product changes the system of interdependencies, increasing the complexity by adding
new, previously unencountered interdependencies (Anderson, 1999). The most promising
new entrepreneurial opportunities are often in the areas with significant new and previously
unencountered interdependencies (Gavetti, 2012). However, operating in a new and larger
system of interdependencies is unfavorable for overcoming the challenge posed by complex-
ity. To eventually execute on the opportunity requires additional inventive effort towards
alleviating the constraints posed by the new interdependencies (Ethiraj, 2007). Thus, to
make predictions about the opportunity, the entrepreneur would have to be able to account
for those interdependencies. In this way, gaining new knowledge through experience could
even exacerbate the challenge of complexity and, as a result, increase the number of ways
strategic foresight could be inaccurate (Townsend et al., 2018).
To conceptually pinpoint the net effect of project experience on strategic foresight,
3In our empirical context, the primary performance dimension for which an entrepreneur can experiencesuccess or failure on past project execution is the accuracy of their prediction of delivery time on the pastproject.
9

we now need to identify which of these two channels dominates.
2.3 Dominance of Increasing Complexity Over Learning
We contend that—under certain conditions common to entrepreneurial settings—the increase
in complexity from learning about opportunities to add to a subsequent project can dominate
the learning about previously encountered interdependencies in past projects. In short, new
complexity can outweigh the benefits of experience. The argument follows from assumptions
we can make about the shapes of two theoretical relationships, described here and visually
illustrated in Figure 1. First, the Project Complexity curve is the relationship between expe-
rience and the total number of interdependencies in a project opportunity pursued at a given
level of experience. Of these total interdependencies in a project, some will be ex ante known
to the entrepreneur, which we refer to as the Foreseen Interdependencies. The remainder
will be unknown to or unanticipated by the entrepreneur, which we refer as the Unforeseen
Interdependencies. Second, the Learning curve is the relationship between experience and
the set of Foreseen Interdependencies that the entrepreneur is aware of ex ante, prior to
executing a given project. When the Project Complexity curve is above the Learning curve,
then the entrepreneur will not be able to foresee all the interdependencies in a given project;
the difference between the two curves represents the Unforeseen Interdependencies that will
be overlooked in her prediction process and impair her strategic foresight.
—– Insert Figure 1 Conceptual Model of Experience and Interdependencies. —–
Under the assumptions detailed below—at least a linearly increasing project com-
plexity curve and a concave learning curve—we theorize that experience in past projects
has a negative relationship with the accuracy of an entrepreneur’s strategic foresight for a
subsequent project.
Increasing Project Complexity Even when an entrepreneur makes merely incremental
additions to a previous project, complexity increases. Adding a new feature requires adding
one or more tasks interdependent with some or many tasks in their system of activities (Ethi-
raj et al., 2012).4 As a result, each new feature added must increase the total number of
4Our study focuses on hardware technology projects that force the entrepreneur to integrate componentsat some level: if there were no interdependencies, there would be no opportunity for value creation by theentrepreneur as the raw inputs could just be purchased separately by customers with no loss of value.
10
interdependencies in the project (Casti, 1994; Daft & Lewin, 1990). The overall theoretical
argument follows from the minimum baseline premise that the total number of interdepen-
dencies increases as least linearly, which assumes that the entrepreneur would have to add
at least one component or task in a subsequent project and the addition should be at least
as interdependent as other components that already exist in the prior project.
That said, we posit that in most entrepreneurial ventures involving nascent projects,
complexity can increase faster than linearly, well above the minimum assumption needed for
the theory to hold. First, it can be the case that an entrepreneur adds multiple features or
tasks in a subsequent project, particularly for a nascent entrepreneur improving on a sparse
project far from a dominant design. Second, for projects with highly interdependent compo-
nents, the addition of a single component can lead to a faster-than-linear increase in the total
number of interdependencies; at the extreme, the number of interdependencies can increase
geometrically.5 While both these conditions vary based on context, entrepreneurs engaged
in launching a new product—particularly a new hardware technology as in our empirical
context—likely meet both of these conditions. The next section describes how these as-
sumptions hold in context. Product development entails highly interdependent components
and tasks (Ulrich et al., 2020), meaning that the entrepreneur faces a complex system that
is inherently nonlinear (Anderson, 1999; Townsend et al., 2018). This cascade of new inter-
dependencies can grow rapidly and may outpace the comparatively incremental discovery of
interdependencies encountered in past experience.
Thus, as an entrepreneur gains experience across projects and implements new fea-
tures for a subsequent project, demonstrating strategic foresight requires that the entrepre-
neur navigate more complexity, and perhaps substantially more, than previously faced.
Bounding Learning As the entrepreneur takes on more complexity, bounded rational-
ity limits the potential benefits of learning about interdependencies from prior experience
by placing an upper bound on the amount of knowledge about interdependencies that the
entrepreneur can practically contemplate and utilize. Ultimately, we propose an implica-
5For instance, a project with X components that are all interdependent with one another would have X(X−1)total interdependencies, a function geometrically increasing in X.
11

tion aligned with the traditional perspective on learning (Kauffman, 1995; Rapping, 1965;
Thompson, 2001), which consistently documents diminishing returns to learning with in-
creasing experience. That said, we make a distinct argument consistent with the view of
strategic foresight as the ability to anticipate interdependencies and following from assump-
tions in recent literature characterizing the associated mental models.
At an individual level, boundedly rational entrepreneurs are only able to consider
a finite subset of interdependencies (Csaszar, 2018; Hallen & Pahnke, 2016; Simon, 1955).
However, vast layers of interdependencies may need to be considered to predict the true
outcome (Brunswik, 1952; Simon, 1955). The numerous permutations of possible interde-
pendencies make it difficult for entrepreneurs to accurately (and often even satisfactorily)
anticipate the actual system of interdependencies (Townsend et al., 2018).
Due to bounded rationality, entrepreneurs operating in complex systems rely on sim-
plified mental models that only account for a subset of the total interdependencies. Describ-
ing this simplification process, Eisenhardt & Bingham (2017) detail entrepreneurs’ use of
simple models, Csaszar (2018) compares different simplified representations of complexity,
and Gavetti (2012) outlines the necessity of associative thinking. Although the frameworks
proposed in these studies make some distinctions about the precise mechanisms and im-
plications of a simplified mental model, the broad consensus of this work is that, due to
bounded rationality, entrepreneurs tend towards simplifying the system of interdependencies
in making judgments. By definition, these simplified models are incomplete. Furthermore,
due to the cognitive constraints on the number of interdependencies a boundedly rational en-
trepreneur is able to consider (Simon, 1990, 1969), these models will be less complete in more
complex systems. As entrepreneurs implement increasingly complex successive projects, the
portion of the total interdependencies the boundedly rational entrepreneur is able to foresee
decreases. In other words, expanding the total number of interdependencies increasingly
penalizes the accuracy of an entrepreneur’s strategic foresight. This penalty can be par-
ticularly acute for organizational interdependencies (Hannan et al., 2003); the entrepreneur
generally has less visibility and less learned expertise about organizational processes (Heath
& Staudenmayer, 2000; Sommer & Loch, 2004), as opposed to the interdependencies within
12
the product itself.
In summary, our conceptual model as illustrated in Figure 1 distinguishes between two
opposing channels of learning from entrepreneurial experience across projects affecting the
ratio of unforeseen to foreseen interdependencies. If unforeseen interdependencies increase
relative to foreseen interdependencies, strategic foresight becomes increasingly impaired.
Experience leads entrepreneurs to learn about the system of interdependencies related to
their experience, which could improve the entrepreneur’s strategic foresight by increasing
the number of foreseen interdependencies. However, experience also leads entrepreneurs to
learn about new opportunities to add features, which introduce new interdependencies that
increase the total number of interdependencies in a project. We argue that the latter effect
dominates the former: when the learning curve representing foreseen interdependencies does
not keep up with that increase in complexity—i.e., when the project complexity curve is
steeper than the learning curve—an entrepreneur ultimately faces an increasing number
of unforeseen interdependencies. The expected net effect is that the strategic foresight of
entrepreneurs becomes increasingly impaired with increased experience across projects.
3 Hypothesis Development
From this conceptual viewpoint, we now develop a series of hypotheses situated in our
empirical context: hardware technology entrepreneurs engaging in product crowdfunding on
Kickstarter. In particular, we consider entrepreneurs serially crowdfunding across multiple
distinct projects of the same subtype. Keeping as many characteristics fixed as possible
across projects should, in principle, keep experience gained on a past project relevant to the
next project, which is ideal for reaping the benefits of learning (Cassar, 2014; Dencker &
Gruber, 2015; Eesley & Roberts, 2012; Eggers & Song, 2015; Toft-Kehler et al., 2014). In
other words, we seek to maximize the potential for learning from past projects to improve
predictive ability by studying entrepreneurs who stay close to their past project experience.
The predictions that crowdfunding entrepreneurs make serve as plausible proxies for
assessing strategic foresight. In general, strategic foresight requires deciding between options
which, in turn, necessarily requires making strategic predictions about each specific option.
13

For example, Csaszar & Laureiro-Martınez (2018) measure strategic foresight by comparing
strategic predictions about distinct opportunities. Instead of evaluating strategic foresight
by ex post assessing entrepreneurs on their ex ante choice across distinct alternatives, we
focus on entrepreneurs as they ex ante make predictions on a single project and ex post assess
whether those predictions were accurate or not. By intentionally focusing our empirical de-
sign in this way, we gain greater visibility towards more granular aspects of strategic foresight,
enabling more precise empirical study.
On most platforms for product crowdfunding, including our empirical context of Kick-
starter, entrepreneurs are ex ante required to make public predictions about the product
specification they will produce and the date on which they will deliver that product. These
predictions are fixed at the start of the fundraising window and cannot be changed after the
fact. Predicting the product specification they will deliver and the date on which they will
deliver it captures knowledge the entrepreneur has about future interdependencies she be-
lieves are relevant to the project. The crowdfunding setting also fixes several key aspects of
strategic foresight, which is helpful for identification. For example, the platform standardizes
the point from which each entrepreneur makes predictions—by requiring a working prototype
prior to fundraising (Kickstarter PBC, 2020)—as well as the method of solicitation and com-
munication. Given these structural advantages, prior work by Csaszar & Laureiro-Martınez
(2018) use the crowdfunding setting to measure the strategic foresight of the investor. We
now use this same setting to measure the strategic foresight of the entrepreneur.
In order to validate our aggregate empirical patterns and understand micro-mechan-
isms that might be at play, we conduct a program of qualitative interviews with 11 en-
trepreneurs from our sample. Appendix Section A.1 describes our qualitative interview
process. We weave in qualitative findings from these interviews into our hypothesis devel-
opment purely for context and clarity. These examples and anecdotes are not intended as
empirical proof for the theory, but as transparent illustrations of the logic underlying the
theoretical mechanisms.6
6We intend for the theory and hypotheses to arise from conventional deductive arguments, which we thenground in our specific context using examples and quotes from the qualitative interviews, rather than usingthe qualitative evidence as a basis for inductive theory development.
14

3.1 Increasing Unforeseen Interdependencies
Based on the above theorizing, we predict that as entrepreneurs gain experience across
projects, they suffer from an increasing number of unforeseen interdependencies. Consistent
with Brunswik (1952) and Csaszar & Laureiro-Martınez (2018), we define unforeseen inter-
dependencies as the interdependencies that the entrepreneur does not consider in her mental
model to generate a strategic prediction for a particular outcome, but that do play a role in
determining the realized outcome. We theorize that as a boundedly rational entrepreneur
gains experience and pursues projects with additional features, the gap increases between the
total number of interdependencies in her actual project and the foreseeable interdependencies
in her mental model.
Each time an entrepreneur executes a project, she gains experience designing, pro-
totyping, manufacturing, and delivering a product. Consider an entrepreneur repeatedly
executing the exact same project with the same set of tasks and interdependencies again
and again. We would expect her to learn as she observes unforeseen interdependencies that
arise, allowing her to update her prior beliefs about the set of interdependencies for the next
related pursuit (Raveendran et al., 2020). Under this scenario, experience improves strategic
foresight. Consider the case of MaskCo, founded by two friends, which creates sound-reactive
LED masks. In 2015, MaskCo launched its first mask project on Kickstarter: a jaguar design
outlined by basic LED strips. On its initial project, MaskCo experienced production delays
due to unforeseen manufacturing challenges. However, if MaskCo continues to produce this
exact same mask again and again, we would not expect it to continue to suffer delays from
the same unexpected manufacturing challenges. Rather, we would expect the number of
unforeseen interdependencies to decrease.
However, this is not the case. As discussed previously, the total number of interde-
pendencies in a subsequent project increases relative to the previous project when an en-
trepreneur implements new features discovered while executing past projects, both through
exposure to new information about customers and the market as well as through discover-
ing new ways of combining pre-existing knowledge. In the example of MaskCo, the initial
15

Kickstarter experience exposed MaskCo to additional opportunities to innovate based on
consumer feedback suggesting demand for additional design options, leading MaskCo to add
a host of new design options—including an owl, wolf, fox, skull, robot, wildcat, and even a
version with President Obama’s face—on its subsequent project. The MaskCo entrepreneur
also discovered new ways of combining pre-existing knowledge: the initial mask would only
light up in response to sound, but the entrepreneur deduced that it would be valuable to
have pre-programmed light patterns so the mask could also light up without sound.
Each new feature added interacts with some or many of the tasks and components
required to complete the prior project, thus introducing additional new interdependencies
with each new feature added (Townsend et al., 2018). But when an entrepreneur makes
predictions about this more complex product specification and the timeline on which she
will deliver it, we theorize that the boundedly rational entrepreneur may do so with an
incomplete view of the interdependencies that might arise. Thus, if new features added to
a subsequent project increase the total number of project interdependencies in excess of the
foreseen interdependencies gained through boundedly rational learning on prior projects, the
number of unforeseen interdependencies will increase on each subsequent project.
Hypothesis 1 As entrepreneurs gain experience from past projects, they encounter an in-
creasing number of unforeseen interdependencies on their next project.
To illustrate this hypothesis in context, we continue with the example of MaskCo and
highlight the seemingly small choice to introduce packaging to the company’s subsequent
project. Adding packaging to a product that is even otherwise the same introduces signif-
icant complexity given all the ways the new packaging is interdependent with the existing
production tasks. This addition required MaskCo to arrange for the packaging to occur at
a separate plant, which necessitated coordinating shipping between the plants and hiring
a contractor to facilitate communication in a different language between the manufacturer
and the packaging plant. Then, when the quality of the first finished batch was poor, cor-
recting the problem was more costly given the additional interdependency of the finished
product with packaging. Going back through the whole process to correct the problem and
16

then repackage cost MaskCo an additional month. Then, the new packaging meant that the
finished products could no longer be shipped by the shipping company used previously, so
MaskCo ultimately had to move all the stock to a different warehouse for shipment.
Our interviewees repeatedly emphasized unexpected organizational issues that came
up during execution. Given Kickstarter’s requirement to have a working prototype before
fundraising, many if not most of the interdependencies intrinsic to the product itself were
already known prior to launching the project. However, “the prototypes are all hand made—
they’re more of a unique product that has more time put into it—but when you’re doing
production, you’re not spending that much time on every single unit. You’re doing large
volume. That’s where we end up having problems” (GPSCo CEO). Another entrepreneur
shared, “our [second product] was more complicated because organizing all the different
sourcing was a lot more difficult. For [the first product], it was basically, ‘go to one supplier
and then just put in an order.’ But with [the second product], there was a lot of back
and forth with a bunch of different suppliers” (CircuitsCo CEO). Indeed, the MaskCo en-
trepreneur noted that the ultimate set of steps required to add packaging involved “things
[he] never thought about” in working with other organizations.
3.2 Strategic Foresight as Multiple Predictions
We now turn to how entrepreneurs respond when they encounter unforeseen interdepen-
dencies that conflict with the strategic foresight of their initial predictions. As a starting
premise, we characterize strategic foresight as a set of multiple predictions.7 When we suggest
in our theory that entrepreneurs make increasingly inaccurate or infeasible predictions on
each subsequent project, we mean that with respect to the aggregate of all the entrepreneur’s
predictions that comprise their strategic foresight as a whole. The individual predictions are
fundamentally connected: entrepreneurs have the choice to absorb the inaccuracy in one
prediction while satisfying another prediction.
It is important to discuss predictions in context because strategic foresight in different
7In our context, entrepreneurs make forward-looking predictions which serve a distinct purpose and arisedifferently from goals. Goals are more aspirational, and meeting them or not is indirectly associatedwith final performance. Goals seek to motivate individuals and organizations to increase productivityand performance, to stretch beyond what they would accomplish otherwise, or to create a common vision(Corgnet et al., 2015; Osterloh & Frey, 2000).
17
contexts comprises different dimensions on which entrepreneurs make predictions. Crowd-
funding entrepreneurs make two important, and readily observable, predictions: product
specification and delivery date.8 Entrepreneurs make these predictions publicly to prospec-
tive customers who finance a project on the possibility that they will receive the specified
product by the specified date. Based on our qualitative interviews, we find that entrepreneurs
make these predictions first by detailing an anticipated product specification, and then defin-
ing a timeline by breaking the production process down into concrete interdependent tasks,
predicting the timeline for each task, and aggregating those timelines. In most cases, en-
trepreneurs also try to be conservative by adding some buffer time to their overall timeline.9
Product specification and delivery date are connected in such a way that the predic-
tion relative to one can be met at the expense of the other. For example, if an entrepreneur
makes an inaccurate delivery date prediction, she could still choose to meet the delivery
date prediction by delivering a product that fails to meet the product specification (and
vice versa).10 In principle, an entrepreneur could choose to prioritize a predicted timeline by
allocating a fixed amount of time to a project, even if the predicted product specification is
not fully achieved, so she can move on to other activities.
3.3 Prioritizing Product Specification Over Delivery Date
However, we argue that entrepreneurs in the crowdfunding context—and perhaps many in
other settings—prioritize achieving the predicted project specification rather than adhere to
8In the product crowdfunding context, the amount of time to deliver a product is the key costly resourceconsumed by the entrepreneur. Because the entrepreneur in principle raises the financial capital needed todeliver a product as part of the campaign itself, the only remaining resource that is not already realized exante is time. In principle, an entrepreneur can under-predict the amount of money she needs to (profitably)deliver on the product in a campaign, which in this context would leave her underfunded. We cannotobserve whether or not an entrepreneur does this, but absent other financing sources, we presume thatunderfunding a project could observably affect whether an entrepreneur delivers on the predicted productspecification and delivery date. Thus, time can be predicted incorrectly. On the other hand, financialresources, in a reductive sense, mechanically cannot be incorrectly predicted in an observable way: theentrepreneur cannot raise additional funds from the backers ex post. Our empirical analyses control forexternal equity financing, and it is unlikely that most entrepreneurs in our sample would be able to raisesubstantial debt financing given the lack of reliable cash flows to serve as collateral.
9Appendix Section A.3 elaborates on this prediction process for hardware technology projects and providesqualitative context from entrepreneur interviews.
10Never delivering a product would be an asymptotic combination of these two ways of missing a prediction,i.e., delivering a product of zero value with an infinite delay. We exclude this situation from our empiricalanalysis because this situation is rare and some potentially substantial number of those situations involvefraud by the entrepreneur (Mollick, 2015).
18

the initially predicted delivery date. In other words, given inaccurate strategic foresight,
most entrepreneurs tend to continue working towards achieving a predicted product speci-
fication, even if it requires going beyond the delivery date they originally predicted. This
tendency to prioritize achieving product specification over deadline follows if an entrepreneur
holds certain beliefs about customer preferences and the resulting consequences of achieving
(or not) either predicted dimension. While there are meaningful consequences for delay,11
these consequences are overshadowed by both the negative consequences of failing to deliver
the specified product as well as the positive benefits of succeeding in doing so. If a customer
receives a product below the promised specification, this can cause severe reputational dam-
age to the entrepreneur. However, delivering a product as specified (even a delayed product)
can still lead to brand-building testimonials and organic growth. Additionally, succeeding in
delivering the specified product allows an entrepreneur to get feedback on her actual intended
product specification which she can then use to develop future projects.
When inaccurate strategic foresight leads to unforeseen interdependencies that make
it impractical to achieve both initial predictions, entrepreneurs can choose which prediction
they will ultimately prioritize and achieve and which to relegate and fail to address. We
argue that most entrepreneurs prioritize achieving the predicted product specification over
the predicted delivery date. As a result, as entrepreneurs gain experience implementing
projects and encounter an increasing number of unforeseen interdependencies on subsequent
projects, we expect achieving their predicted product specification requires failing to achieve
their predicted timeline by increasing margins. This will manifest in increasing delays.
Hypothesis 2 As entrepreneurs gain experience from past projects, they fail to achieve their
predicted delivery date on their next project by a wider margin.
Without exception, our interviews with crowdfunding entrepreneurs confirm this ten-
dency to achieve their predicted product specification at the expense of their predicted
delivery date. One explained, “At the end of the day, you have to make the decision: Do I
want to ship a product that we don’t feel meets the needs of the customer just to be able
11Appendix Section A.10 expounds and quantifies these consequences of delay.
19

to ship it and be done with it? Or do we want to delay and end up shipping a quality
product? I always want to ship a quality product” (GPSCo CEO). Another entrepreneur
believed that “consumers can delay gratification for something better” (TabletCo CEO). To
put it another way, “We wanted to first be able to deliver the highest-quality parts we could,
and then second to do as best we can to deliver them on time. If we had to suffer on the
cost side, we would do that within reason” (3DPrintCo CEO).
We observe this tendency in both the LEGO brick and MaskCo entrepreneurs men-
tioned previously. The LEGO brick entrepreneur referenced in the introduction could have
decided to deliver a product on the predicted delivery date that did not perform the predicted
function of interfacing with LEGO sensors. Similarly, the MaskCo entrepreneur could have
delivered a mask in whatever state it was in (perhaps without packaging) by the predicted
delivery date. However, both entrepreneurs chose to delay in order to continue striving to
meet the predicted product specification. The discussion highlights other prominent exam-
ples where entrepreneurs—like Elon Musk of Tesla—exhibit this tendency to spend more time
working towards their predicted product specification rather than adjusting their product
specification to meet the predicted allocation of time resources.
4 Empirical Methods
4.1 Context
In order to test these hypotheses, we need a sample of entrepreneurs who complete mul-
tiple projects over time with clearly defined markers for experience, complexity, predic-
tions, and outcomes. The crowdfunding platform Kickstarter provides an ideal setting that
meets these criteria. Kickstarter, founded in 2009, is a popular crowdfunding platform that
connects entrepreneurs to customers. Customers pre-purchase specific products that the
entrepreneurs promise to deliver by a future date. This fundraising process requires Kick-
starter entrepreneurs to provide several predictions, including the features and qualities of
the product they will produce and the timeline on which they will deliver the product. This
setting allows us to identify metrics to capture each of the characteristics and outcomes of
interest outlined in our hypotheses. Figure 2 provides specific examples of these metrics
20

using the series of projects implemented by one of the entrepreneurs in our sample.
—– Insert Figure 2 Example Project Series. —–
Using Kickstarter projects favorably standardizes several characteristics. All hard-
ware technology projects are required to have a working prototype before they can raise
capital, helping to reduce some of the variation in the starting point of new projects (Kick-
starter PBC, 2020). The crowdfunded capital then funds the manufacturing and distribution
of the product at scale. In addition, the platform is all-or-nothing, meaning that if the project
does not reach the target financing level, the pledges are refunded to the customers and the
entrepreneur does not receive any capital. As a result, we can assume that the entrepreneurs
have sufficient financial resources to deliver the product relative to their expectations.
While some associate Kickstarter with fun trinkets and board games, our study fo-
cuses on manufactured hardware technology, the most complex products on Kickstarter and
among the most complex that an entrepreneur could generally pursue.12 First, the value
of these products hinges on the entrepreneur precisely and accurately addressing a large
number of interdependencies. If a wire is cut a nanometer too short, it may not connect
the necessary circuits for the product to function. In contrast, if the pair of dice in a board
game is produced a nanometer smaller than planned, it has virtually no impact on the other
pieces of the game. Second, modern manufacturing requires an international supply chain
with multiple suppliers from different organizations, e.g., distinct suppliers for all the parts,
assembly, packaging, and international shipping.13
4.2 Data and Sample
We construct a sample of Kickstarter entrepreneurs who complete multiple projects of the
same project subtype. We collect basic project data and characteristics for all Kickstarter
projects from Web Robots, which runs a monthly scrape of all past and present Kickstarter
projects. We identify the 394 entrepreneurs with two or more projects that met the fundrais-
ing goal in one of the main project subtypes in the hardware technology space (i.e., gadgets,
12Appendix Section A.2 details the high and increasing degree of complexity in crowdfunded hardwaretechnology products.
13Appendix Section A.3 further expounds the complexity inherent in this context as well as the implicationsof that complexity for the prediction process.
21

3D printing, hardware, camera equipment, sound, DIY electronics, wearables, robots, and
fabrication tools) with predicted delivery dates prior to the date of our analysis. We look
specifically at entrepreneurs with multiple projects that meet the fundraising target be-
cause they gain execution experience from actually having to produce and deliver these
projects. In order to maximize the potential impact of learning, we further segment our
sample to the entrepreneurs who specialize in one of the selected project subtypes, refin-
ing our sample to 326 entrepreneurs.14 After reviewing each entrepreneur’s profile, we also
exclude 12 entrepreneurs whose circumstances are disqualifying (e.g., a large, established
company launches the campaign) or where it is apparent we have incomplete data (e.g., the
entrepreneur is clearly doing many other projects outside of Kickstarter, in which case our
data set does not contain data on much of their experience and learning process).
These criteria result in a final sample of 314 entrepreneurs who created 722 projects
from September 2010 through June 2019. For each of these projects, we scrape comprehensive
information from its Kickstarter pages, including the project story and potential risks and
challenges posted by the entrepreneur, the most recent 100 comments, and all project updates
posted by the entrepreneur. Each project has one or more rewards that backers can purchase.
We scrape data for all the rewards of each project, including the reward price, description,
predicted delivery date, and number of backers. A couple of variables of interest were
manually collected: actual delivery time and number of features. The manual data collection
process is described in the subsequent section. In addition, we link Kickstarter entrepreneurs
with their Crunchbase profiles to collect information on external funding from all sources
over time as a control for time-varying entrepreneur quality.15
4.3 Variables
4.3.1 Dependent Variables: Features and Unforeseen Interdependencies
As a starting point, we define a set of measures to test the basic assumption leading into
Hypothesis 1: entrepreneurs pursue increasingly complex projects, i.e., projects with greater
14While an entrepreneur could intentionally shift to a product subtype “distant” from her prior experience(e.g., Eggers & Song, 2015), this possibility falls outside the scope of this study.
15Appendix Section A.4 provides additional detail about the data collection and aggregation process acrossthese data sources.
22

total interdependencies. An ideal measure would exactly measure the total interdependencies
in a predicted project, but this is impossible to identify based on the public information
available since we cannot see inside the product or organization. Instead, we identify a
product’s level of features relative to the other product(s) by the same entrepreneur. We hired
five independent reviewers to rank each entrepreneur’s set of products by number of features
and then aggregated the rankings for each product across reviewers.16 Specifically, we hired
individuals with relevant educational and professional experience—backgrounds in computer
programming, mechanical engineering, and robotics—from a broad set of backgrounds, e.g.,
gender and age. The following measures are intended to at least roughly correlate positively
with the total interdependencies in a planned project.
Features Most Features Most is a binary indicator equal to 1 if the product has the most
features compared to the other products by the same entrepreneur (and 0 otherwise).
Features Rank Features Rank is the relative rank of the product compared to other prod-
ucts by the same entrepreneur, e.g., if an entrepreneur completed two products, the product
with the fewest features would have a Features Rank of 1 and the product with the most
features would have a Features Rank of 2.
Features Percentile Features Percentile specifies the relative percentile of a project for an
entrepreneur, e.g., if an entrepreneur had three projects with Features Rank equal to 1, 2,
and 3, the corresponding Features Percentile would be 0%, 50%, and 100%, respectively.
Unforeseen Interdependencies We then construct a measure of unforeseen interdepen-
dencies in a direct test of Hypothesis 1. Unforeseen Interdependencies is the total num-
ber of updates posted by the entrepreneur during project execution—after the fundraising
campaign has ended and before the product is delivered—that cite unforeseen interdepen-
dencies. A member of our research team reviewed the most common words contained in
updates relevant to unforeseen interdependencies. They identified two categories of rele-
vant words. The first set relate to issues being unforeseen, which includes the words (or
any variants): unforeseen, unexpected, and unanticipated. The second set relate to typical
16Appendix Section A.4 provides additional details on the background of each reviewer as well as the rankingand aggregation process.
23

interdependence-related issues that come up in our context, which includes the words (or
any variants): manufacturing, production, assembly, and factory. When defining Unforeseen
Interdependencies, we include all updates that contain words from either set.17
4.3.2 Dependent Variables: Delivery Time Metrics
Delay Indicator If the actual delivery date is after the predicted delivery date or if the
project has not yet shipped and the predicted delivery date is prior to the date we collected
our sample, Delay Indicator is set equal to 1 (and 0 otherwise). We identify Delay Indicator
for 95% of projects in our sample.
Delay Duration Delay Duration is the time (in days) between the actual delivery date and
the predicted delivery date. We identify the delay for 89% of our sample; for comparison,
Mollick (2014) identifies outcomes for 81% of his sample.
Predicted Time To test whether Delay Duration is driven by more aggressive predictions
versus missing static predictions by wider margins, we define Predicted Time as the time (in
days) between the end of the fundraising campaign and the predicted delivery date.
Actual Time Actual Time is the time (in days) between the end of the fundraising cam-
paign and the actual delivery date, i.e., sum of Predicted Time and Delay Duration.
4.3.3 Main Independent Variable: Project Experience
The main independent variable Project Experience measures an entrepreneur’s total execu-
tion experience as her number of projects prior to and of the same subtype as her current
project. We only count projects that meet the funding threshold because they provide the
entrepreneur with execution experience that exposes her to project interdependencies.
4.3.4 Control Variables
Entrepreneur fixed effects control for any time-invariant variation among entrepreneurs in
our sample, so we add additional controls for other types of entrepreneur experience charac-
teristics that may change over time, as well as project-specific characteristics.
We control for other types of entrepreneurial experience with executed projects (that
meet the funding threshold) and attempts at funding campaigns (most of which become
17The main findings hold when running the analysis separately for either word set.
24

projects). Given the potential impact of fundraising failure on entrepreneur behavior,18
Failed Campaign Experience is the cumulative count of Kickstarter crowdfunding campaigns
of the same product subtype conducted by the entrepreneur where those campaigns did not
reach their funding threshold.19 In a similar vein, to account for the degree and direction of
deviation from the funding threshold, Prior Campaign Funding Deviation is the percentage
by which the entrepreneur’s prior campaign exceeded (or missed) the funding threshold. An-
other way past performance could impact an entrepreneur’s behavior on subsequent projects
is the number of days by which the entrepreneur missed (or beat) their predicted timeline
on the past project. Prior Project Delay is the entrepreneur’s prior project’s Delay Duration
divided by Predicted Time.
We also include controls for changes in the entrepreneur’s circumstance over time. Si-
multaneous execution of multiple projects could impact performance as compared to projects
that are the sole focus of an entrepreneur. Execution Overlap is a binary indicator equal to
1 if the execution start date of the current project comes before the execution completion
date of the prior project (and 0 otherwise).20 To control for changes in entrepreneur quality
over time, we use Crunchbase data and define External Funding as a binary indicator of
whether the entrepreneur had raised venture capital funding prior to launching the current
project. To account for the impact of switching industries documented by Eggers & Song
(2015), among others, we define New Category as a time-variant binary indicator of whether
the project immediately prior to the current project was of a different subtype. We also
control for general experience and learning that may accrue to the entrepreneur naturally
over time and separate from project execution, with Elapsed Time defined as the number of
18Compared to the average 70.9% failure rate of technology Kickstarter projects, only 10.5% of the campaignsattempted by the entrepreneurs in our sample failed to reach their funding threshold. This is likely drivenby key differences between the serial-project entrepreneurs in our sample who generally treat their projectsas full-time jobs and the average person who casually launches a project more as a hobby.
19Project Experience plus Failed Campaign Experience is the total number of Kickstarter campaigns of thespecific product subtype that the entrepreneur had launched; including both of these variables togetheralso controls for the total number of campaigns in aggregate, which would be collinear.
20We look at overlap in execution rather than fundraising given that executing a project takes substantialtime and other resources. This overlap only occurs in 4.7% of our sample (34 out of the 722 projects). Thismakes sense given that the entrepreneurs interviewed noted that executing even a single project is a full-time job for most people. In addition, many of the ideas for subsequent projects come through executingpast projects, so it makes sense that the projects would generally be sequential rather than concurrent.
25
days since the entrepreneur launched her first successful project of the same subtype as the
current project. Baseline Updates is the total number of updates posted prior to the end
of the fundraising campaign, which allows us to control for the entrepreneur’s time-variant
propensity to post updates across projects.
We also control for project characteristics determined ex ante to initiating the fund-
raising campaign. These variables control for whether heterogeneity in project characteristics
account for heterogeneity in measured outcomes. Funding Period is the time (in days) that
the project accepted contributions. This window is set before the fundraising campaign
launches and cannot be changed after the fact. Funding Reward Tiers is the total number of
rewards available for funding backers to purchase. Funding Reward Size is the median price
of the rewards available for funding backers to purchase. Funding Threshold is the amount
of money (in thousands of USD) the entrepreneur set out to raise. This amount is set at the
start of the campaign and cannot be adjusted; all projects meet or exceed this threshold.
In addition, we control for project characteristics determined ex post after the fundrai-
sing period. We include these ex post controls in regressions where the dependent variable is
realized after the fundraising period. Funding Exceeded is the amount of money (in thousands
of USD) the project raised in excess of the Funding Threshold. This is an important control
given that Mollick (2014) finds that the degree to which projects exceed the funding threshold
is a predictor of delay. Funding Backers is the total number of people (in thousands) who
contributed to the project.
4.4 Descriptive Statistics
Table 1 provides summary statistics.21 To validate our measures, we compare our sample
of 722 technology projects to the 843 technology projects in Mollick (2014): our sample
has an average Funding Threshold of $23,272 (versus $21,177) and Funding Period of 33.34
day (versus 40.28 days). In addition, Mollick (2014) uses a similar manual process to collect
actual delivery dates and identifies that “only 24.9% of projects delivered on time” (or 75.1%
of projects are delayed). Our sample identifies a similar pattern, where 76.3% of projects
delay.
21Appendix Section A.5 provides additional statistics and visualizations of variable distributions.
26
—– Insert Table 1 Summary Statistics. —–
Looking at the pairwise correlations between each of our independent variables in
Table 2, we note the high correlation (0.748) between Funding Exceeded and Funding Backers.
Given that, by construction, each new backer contributes additional funds to the project, this
high correlation aligns with expectations. We re-run all regressions taking turns excluding
each of these variables and do not see any meaningful changes to the results. In addition,
there is a high correlation (0.697) between Project Experience and Elapsed Time. Again,
this aligns with expectations given that each subsequent project occurs at a later time. All
the results hold if we remove Elapsed Time and re-run all the regressions.
—– Insert Table 2 Pairwise Correlation Matrix. —–
Given their importance, Figure 3 visualizes the distributions of Predicted Time and
Actual Time. The distribution of Actual Time is shifted and skewed to the right of the
distribution of Predicted Time, of course because the vast majority of projects delay.
—– Insert Figure 3 Distribution of Actual Time and Predicted Time. —–
4.5 Statistical Model
We estimate ordinary least squares (OLS) models across all analyses. These models include
many different fixed effects to control for several dimensions of otherwise unobserved het-
erogeneity that could correlate with the observed independent variables. Entrepreneur fixed
effects control for time-invariant entrepreneur characteristics, such as natural talent, intelli-
gence, work ethic, etc. Product subtype fixed effects absorb any heterogeneity between the
various categories of projects, e.g., DIY electronics versus 3D printing. Month fixed effects
control for seasonal cycles; for example, if projects that predict delivery dates in December
are more likely to delay due to the holidays, month fixed effects would account for that
seasonal heterogeneity. Year fixed effects control for any factors that change year to year but
are common to all entrepreneurs who launch new projects in a given year. To account for
potential correlation in the error term across projects by the same entrepreneur, we cluster
robust standard errors at the entrepreneur level.
The models using the dependent variables Features Most, Features Rank, Features
Percentile, and Predicted Time—determined ex ante to launching the fundraising campaign—
27

include only the controls for project characteristics that exist ex ante and exclude the control
variables realized ex post, Funding Exceeded and Funding Backers.
5 Results
Hypothesis 1 predicts that, as entrepreneurs gain experience, they encounter an increasing
number of unforeseen interdependencies. Before we look at this directly, we first validate
a key assumption leading to this hypothesis: entrepreneurs make their project specification
more complex as they gain experience. We examine this by looking at the relationship
between Project Experience and three measures of how complicated the proposed project
specification is in terms of its observable features. In the first three columns of Table 3, we
find that Features Most (p = 0.047), Features Rank (p = 0.000), and Features Percentile (p
= 0.016) are all positively related to Project Experience.22 Each subsequent project is 11.7%
more likely to be the highest-ranked project in terms of number of features. The ranking
of each subsequent project increases by an average of 0.37 in absolute terms or 13.8% on a
percentile basis. If additional features increase the number of interdependencies, we posit
that more experienced entrepreneurs take on projects with more total interdependencies.
—– Insert Table 3 Complexity and Unforeseen Interdependencies. —–
To explicitly test Hypothesis 1, we examine the effect of experience on the number of
unforeseen interdependencies. In column 3 of Table 3, we find that Unforeseen Interdepen-
dencies (p ∼ 0.000) is positively related to Project Experience. On each subsequent project,
entrepreneurs disclose encountering 1.3 additional unforeseen interdependencies. This in-
crease in unforeseen interdependencies is consistent with our theory of decreasing prediction
accuracy in increasingly complex systems when bounded rationality limits the learning that
might attenuate unforeseen interdependencies. Ln Unforeseen Interdependencies (p = 0.002)
also positively associates with Project Experience. Each subsequent project increases unfore-
seen interdependencies by 21%.23
Hypothesis 2 suggests what entrepreneurs will do when they make inaccurate pre-
22For the binary indicator variable Features Most, the results hold when using a conditional fixed-effectslogit model.
23Appendix Section A.6 shows there is a significant and positive relationship between increasing unforeseeninterdependencies and increasing number of features.
28

dictions. Specifically, we hypothesize that as entrepreneurs gain experience and encounter
increasing unforeseen interdependencies, they miss their predicted delivery date by wider
margins. As outlined in Table 4, we find that Project Experience is positively related to
Delay Indicator (p = 0.010) and Delay Duration (p = 0.001). As a baseline, with each addi-
tional project of experience, the entrepreneur is 11.9% more likely to be delayed. Regarding
the magnitude of delay, with each additional project of experience, the average entrepreneur
is delayed by an additional 39.6 days. Although Delay Duration measures the absolute dif-
ference between the entrepreneur’s actual and predicted timeline, it is also important to
consider the difference on a percentage point basis to account for different predicted project
lengths. We also find that Project Experience is positively related to Delay Duration /
Predicted Time (p = 0.001). With each additional project of experience the average en-
trepreneur is delayed by an additional 53.0% relative to her predicted time. Taken together,
these findings suggest that, given increasing prediction inaccuracies, entrepreneurs choose to
absorb these inaccuracies in the product timeline, leading to increasing delay.
—– Insert Table 4 Delivery and Delay. —–
As important context for the above finding, column 4 of Table 4 shows that Project Ex-
perience positively associates with Predicted Time (p = 0.014). On average, entrepreneurs
increase their Predicted Time by 8.4 days on each subsequent project. This means that
entrepreneurs are not becoming more delayed because they are setting shorter, more aggres-
sive timelines. To the contrary, entrepreneurs give themselves more time on each subsequent
project, seemingly anticipating some increase in complexity or adjusting for time they learned
that they needed, yet they still miss the prediction by a wider margin. Finally, column 5 of
Table 4 shows that Project Experience is positively related to Actual Time (p ∼ 0.001). On
average, entrepreneurs increase their Actual Time by 46.4 days on each subsequent project.
To provide an intuitive illustration for interpreting the empirical findings, Figure
4 plots the relative trends of Actual Time and Predicted Time as the entrepreneur gains
experience. Figure 4 plots coefficient estimates for an alternate non-parametric model of
the relationship between experience and the dependent variables by including indicators
29

for project number instead of Project Experience.24 This figure shows that the actual de-
livery time increases much more sharply relative to the predicted delivery time, with the
gap between actual delivery time and predicted delivery time increasing as entrepreneurs
gain experience. These empirical patterns are consistent with the theorized actual project
complexity curve and learning curve, respectively, in Figure 1.
—– Insert Figure 4 Actual Time and Predicted Time with Experience. —–
5.1 Learning from Prior Project Delay
While Prior Project Delay primarily serves as a control variable in the main analyses, we
find several statistically significant relationships of note. Recall that Prior Project Delay is
the duration of the delay divided by predicted time on the prior project, so a value of 1 or
100% means a project was delayed by the same amount of time the entrepreneur predicted
the project would take. First, Prior Project Delay is significant and negatively related to
Unforeseen Interdependencies (p ∼ 0.000) and its logged value (p ∼ 0.000). Each increase
in days delayed on the prior project equal to the predicted time on the prior project leads
to 0.7 fewer unforeseen interdependencies on the current project.25 Prior Project Delay is
significant and positively related to Predicted Time (p ∼ 0.024). Each increase in days
delayed on the prior project equal to the predicted time on the prior project leads to a 4.3
day increase in the predicted time on the current project, showing that entrepreneurs who
experience delay give themselves more time on their current project. Prior Project Delay
is significant and negatively related to Delay Indicator (p ∼ 0.042), Delay Duration (p ∼
0.020), and Actual Time (p ∼ 0.034). Each increase in days delayed on the prior project
equal to the predicted time on the prior project leads to a 4.2% decrease in the chance the
entrepreneur is delayed on the current project, a 21.7 day decrease in delay on the current
project, and a 19.7 day decrease in the actual delivery time of the current project.
Although we do not formally a priori theorize on the implications of Prior Project
Delay, the observed patterns have important theoretical implications for this line of research.
Based on these empirical findings, we propose two post hoc theoretical explanations. First,
24Appendix Section A.7 details how this figure was created, including the additional underlying regressions.25For example, if the predicted time on the prior project is 45 days, then for every additional 45 days of
delay on the prior project, the current project would have 0.7 fewer unforeseen interdependencies.
30
it may be the case that learning from a delay, which could be characterized as a failure in a
past execution-related prediction, may be more salient to the entrepreneur. From our specific
theoretical view, it could be the case that past delays—that come from not accounting for the
full set of interdependencies in a prediction—make past unforeseen interdependencies more
salient and memorable for the entrepreneur. The mental model of interdependencies she
uses to make predictions on the next project would then better account for more of the total
interdependencies she would face. Prior work identifies several patterns of entrepreneurs
learning from failure of this form (Politis, 2005). Early work by Sitkin (1992) proposes that
failure can be especially valuable for learning when the failure is: large enough to draw the
attention of the entrepreneur; hard to predict; or able to stimulate the entrepreneur to try
new ways of doing things. Indeed, a past delay is a notable experience that was hard to
predict. On the entrepreneur’s next project, this experience can prompt the entrepreneur to
account for a previously unforeseen interdependency or at least to give herself more time.
Second, an entrepreneur suffering from a past delay may gain a sense of the shape
of the complexity curve that she faces. Based on the premise of our main theory, an en-
trepreneur in general cannot fully anticipate the full set of interdependencies she will face
when she executes her next, more complex project. An underlying assumption here is that
the entrepreneur cannot fully anticipate that she cannot fully anticipate the full set of in-
terdependencies. However, through a past delay, perhaps she can learn to anticipate that
she cannot fully anticipate the interdependencies. If she does not experience a delay on the
prior project, she could still be left assuming that she can anticipate the interdependencies
on subsequent projects. To operationalize this awareness that might come from past delay,
the entrepreneur could faster-than-linearly build in more extra time into her timeline on sub-
sequent projects. Based on our interviews, most entrepreneurs already try to build in this
extra time, but clearly they do so insufficiently. Theoretically, the ideal padding process can
be interpreted as an entrepreneur developing an intuitive sense for the shape of the project
complexity curve that she faces: she could make predictions of interdependencies based on an
extrapolation of the curve, rather than direct knowledge of the actual interdependencies she
will face. This argument mirrors early work by Toffler (1985) and others that theorizes best
31

practices for strategic planning and that specifically warns against the pitfalls of straight-line
thinking when extrapolating.
In many ways, this self-awareness of the faster-than-linear nature of complexity and
her inability to directly anticipate the underlying interdependencies might be the ultimate
lesson that can be learned through prior experience. To put this argument in more colloquial
terms: we all face known knowns, known unknowns, and unknown unknowns. The interde-
pendencies that an entrepreneur could face fall into these buckets. Learning from past delay
could make an entrepreneur more aware that there are going to be unknown unknowns—
making them into known unknowns—and to intuitively plan for those unknowns through
extrapolation based on a higher level of intuition.
5.2 Supplemental Analyses
We empirically test for and rule out a number of potential alternative explanations that
could lead to patterns similar to the main empirical findings or otherwise confound the esti-
mates. First, performance feedback from success or failure on prior funding campaigns could
generate an outcome–aspiration gap for the entrepreneur and affect prediction behavior on
subsequent projects due. Second, an entrepreneur may base predictions on the relative pre-
dictions made by her peers, e.g., predict delivery times that match the average as opposed
to predicting how long she actually think it will take to deliver. Third, as an entrepreneur
gains experience, she may learn that there are limited to no consequences to delaying and, as
a result, not care as much about whether she misses the deadline on subsequent projects. In
other words, she may learn that it is “acceptable” to miss deadlines, especially for more com-
plex projects, which would affect the accuracy of her prediction if it was somehow valuable
to promise an aggressive deadline known ex ante to be unrealistic. Fourth, if customers are
more likely to fund projects that predict earlier delivery dates, an entrepreneur may be in-
centivized to overpromise and predict a delivery date that is sooner than her true predicted
value. Fifth, higher-quality entrepreneurs may exit the sample when they gain sufficient
experience, leaving increasingly lower-quality entrepreneurs in the sample at high levels of
project experience. For example, higher-quality entrepreneurs may be able to raise exter-
nal venture capital financing in lieu of crowdfunding and go to customers through another
32

channel (e.g., direct-to-consumer or retail). Sixth, entrepreneurs who experience a project
with significant delay may leave the sample after they “learn their lesson,” resulting in a
sample of entrepreneurs who disproportionately do not learn. In this scenario, the failure of
missing a delivery time by a large margin could lead better-learning entrepreneurs to pursue
an opportunity outside of crowdfunding or to quit altogether. We empirically test each of
these alternative explanations and do not find evidence that these mechanisms drive the
main results. The Appendix provides detailed descriptions of these supplemental analyses
with full regression tables.26
6 Discussion and Conclusion
This study addresses how an entrepreneur’s execution experience affects the accuracy of
predictions for a subsequent project. We theorize that as entrepreneurs gain experience,
they learn about previously unforeseen interdependencies (which would increase the accu-
racy of subsequent predictions), but they also learn about new opportunities to innovate by
implementing new features on a subsequent project, which introduces new, previously unen-
countered interdependencies (which would decrease the accuracy of subsequent predictions).
When project complexity increases rapidly for a boundedly rational entrepreneur, we argue
that the latter effect dominates the former, leading increasingly experienced entrepreneurs
to make increasingly infeasible predictions. In our crowdfunding context, we show that
entrepreneurs take on projects with an increasing number of features and encounter an
increasing number of unforeseen interdependencies. When entrepreneurs make infeasible
predictions, they prioritize achieving the predicted product specification over the predicted
delivery date. In line with our conceptual model, we show that, on average, entrepreneurs
miss their predicted timeline by nearly six additional weeks (on a percentage basis, by an
additional 53.0% relative to their predicted timeline) on each subsequent project.27
26In the order outlined here, the documentation for these analyses appears in Appendix Sections A.8, A.9,A.10, A.11, A.12, and A.13, respectively.
27Our findings are reminiscent of the conventional managerial wisdom embodied by the Peter Principle(Peter & Hull, 1969), often phrased as “Employees rise to their ‘level of incompetence’ in a hierarchy,” i.e.,managers who are promoted due to success in a prior job are then confronted with managing a new set ofresponsibilities unrelated to what made them successful previously. One could summarize the findings ofthis study as, “Entrepreneurs rise to their ‘level of incompetence’ in strategic foresight,” i.e., entrepreneurswho succeed in making a product and then continue to add features and increase the complexity of
33

6.1 Bounded Rationality as an Impediment to Learning Under Complexity
Despite the extensive conceptual work on behavioral perspectives of the firm, there has been
a limited degree of attention paid to how issues of cognition and bounded rationality might
affect entrepreneurial learning and the ability of entrepreneurs to predict and plan for the
future. Recent work highlights the broad value of taking this perspective in the study of
entrepreneurship. For example, bounded rationality limits how entrepreneurs evaluate in-
ventors (Hallen & Pahnke, 2016) and interact with mentors, customers, and other ventures
(Cohen et al., 2019). More specific to the focus of this study, Eggers & Song (2015) demon-
strate the value of applying a behavioral-theory-of-the-firm perspective to entrepreneurial
learning; they apply attribution theory to show that entrepreneurs may incorrectly attribute
the sources of past failure and success and come away with the wrong takeaways.
We consider another dimension of bounded rationality overlooked by past work on
entrepreneurial learning: cognitive limitations in a complex environment with many inter-
dependencies. In a review, Townsend et al. (2018) note that there has been sparse work
on understanding entrepreneurship in a complex environment where the construct of “un-
certainty has been stretched to try to address aspects of unknowingness that are better
conceptualized as complexity” (p. 674). We seek to address this gap by taking a view that,
for boundedly rational entrepreneurs, complexity presents a barrier to what can and can-
not be learned. We assert that it is the cognitive limitation in accounting for complexity,
rather than just uncertainty from a lack of available knowledge, that limits how much an
entrepreneur can improve her ability to make predictions.
The nuanced cognitive mechanism we propose stands in contrast to the view of the
extant literature that entrepreneurs’ prediction inaccuracies stem from a general character-
ization of entrepreneurs as being “overconfident.” Prior literature documents compelling
evidence that entrepreneurial entrants make infeasible predictions about their own future
performance, leading them to enter markets they should not (e.g., Artinger & Powell, 2016;
Camerer & Lovallo, 1999; Cassar, 2010; Chen et al., 2019; Forbes, 2005; Hayward et al., 2006;
that product, are required to manage systems of interdependencies which they have never encounteredpreviously and which they are ill-equipped to manage.
34

Wu & Knott, 2006). This literature generally frames this observed pattern as a consequence
of entrepreneurial overconfidence. However, we assert that bounded rationality may be a
key antecedent to this overconfidence. Our view aligns with Hogarth & Karelaia (2012),
whose simulation model shows how bounded rationality can lead to over-entry among both
overconfident and underconfident entrepreneurs. While an entrepreneur’s lack of a full under-
standing of the complexity she faces may appear as overconfidence to an observer, cognitive
limits on information likely account for at least some of the error in her predictions.
Our study documents empirical evidence for this nuanced characterization of en-
trepreneurs as facing a cognitive limitation around complexity rather than being generically
overconfident. The entrepreneurs in our setting accumulate information through experi-
ence that should help address an overconfidence bias that stems from a lack of information.
However, inconsistent with a basic overconfidence explanation, we show that entrepreneurs
become less accurate as they accumulate knowledge from experience. We argue that experi-
ence drives expansion of the project pursued by the entrepreneur, which drives an increase
in complexity that cannot be fully anticipated by a boundedly rational entrepreneur. While
we show that bounded rationality plays a role in prediction inaccuracies, our arguments do
not rule out the possibility that overconfidence still exists. Future research might establish
boundary conditions by identifying and tracking a set of entrepreneurs who complete very
high numbers of projects.
6.2 Serial-Product Entrepreneurship
Within the last decade, product crowdfunding rose to prominence as one of the few channels
by which nascent entrepreneurs, particularly those developing hardware products, can raise
capital and access customers. Accordingly, a recent but extensive body of management schol-
arship recognizes both the importance of understanding this entrepreneurial phenomenon
itself as well as the opportunity to leverage the unique properties of the empirical context
to test organizational and strategy theory. With respect to this phenomenon, comparatively
early studies document many of the unique aspects of this setting: geographic and social
network effects (Agrawal et al., 2011), the comprehensive representation of both successes
and failures (Mollick, 2014), and entrepreneur privacy (Burtch et al., 2015). More recent
35

studies demonstrate the opportunity to use the setting to study a variety of organizational
and strategy theory: resource mobilization (Bapna & Ganco, 2020), legitimacy spillovers
(Soubliere & Gehman, 2020), slack time and innovation (Agrawal et al., 2018), and strategic
choices and platform performance (Dushnitsky et al., 2020). Extending this body of work,
this study puts forth the concept of serial-product entrepreneurship as a novel and distinct
phenomenon, requiring distinct theory not addressed by prior studies of, or in the setting
of, product crowdfunding. This setting provides a longitudinal way to study entrepreneurs
as they advance from product to product.
We highlight the distinct role and implications of experience in the context of within-
firm serial-product entrepreneurship. In contrast to the classical view of within-firm orga-
nizational experience and learning curves that apply to a specific product or process (e.g.,
Rapping, 1965; Thompson, 2001), serial-product entrepreneurship directly takes on the idea
that products evolve and shift. In doing so, the firm can pursue a new value proposition that
is somewhat or entirely different from the prior product. As a close relative of recent work
characterizing serial entrepreneurship as across-firm learning for an individual entrepreneur
(e.g., Eesley & Roberts, 2012; Eggers & Song, 2015; Paik, 2014), serial-product entrepreneur-
ship allows knowledge, resources, and routines to be carried forward only within the same
organization. For example, intellectual property and contractual relationships belong to the
organization, rather than to the individual entrepreneur. Our study shows that firms carry
over past organizational learning to pursue later products with additional features. The per-
sistent and increasing delay we document may not be intentional or the result of inexperience
but, rather, delay may be an inherent property of serial-product entrepreneurship.
We propose that serial-product entrepreneurship represents an important and distinct
learning channel that warrants independent study. Thus, future studies should consider the
implications of serial-product learning for other performance dimensions and in the context
of different organizational forms, e.g., large vs. small firm, hierarchical vs. flat organization.
6.3 Strategic Foresight as Multiple Predictions
Finally, this research represents one of the few empirical studies of the theoretical construct
of strategic foresight. Recent work brings attention back to this essential component of
36

competitive advantage, but largely from a theoretical and qualitatively inductive perspective
on its consequences (Eisenhardt & Bingham, 2017; Gavetti & Menon, 2016; Ott et al.,
2017), with limited quantitative work unpacking its antecedents (cf. Csaszar, 2018; Csaszar
& Laureiro-Martınez, 2018; Kapoor & Wilde, 2020). In our opinion, the antecedents are
what matter most: strategic foresight is clearly a good thing in theory, but can one build
strategic foresight? By examining strategic foresight over time, we respond to a call in the
extant literature to go beyond a static view of strategic foresight and take a dynamic view
(Csaszar, 2018; Ott et al., 2017).
To empirically study strategic foresight, we make a key advance with our explicit
interpretation of strategic foresight as not just one prediction but the combination of a set
of predictions. In contrast, the broader set of work on strategic decisions—and specific
studies on foresight—focus on whether a manager or other actor can make a sole prediction
or decision, e.g., enter into a market (Camerer & Lovallo, 1999) or invest in a specific firm
(Csaszar & Laureiro-Martınez, 2018). We argue that strategic planning must inherently
invoke several predictions simultaneously, whether articulated or not, because the predictions
depend on one other. Predicting a value proposition also entails predicting a cost structure
for delivering that value proposition such that the aggregate strategy is viable.
At a general level, our findings suggest that as entrepreneurs gain experience across
projects, their strategic predictions on a successive project will be less accurate, but that
characterization would be far from a complete story. By studying value proposition (product
specification), cost (time to deliver), and interdependencies (complexity) simultaneously, we
gain several advantages that prior studies overlook. We show a trade-off among the aggregate
predictions that comprise strategic foresight broadly. In our study, entrepreneurs pursue
success in achieving the predicted product specification but at the cost of delivering their
product on time. But that is a choice they made. In principle, the entrepreneur could deliver
the product on time but at a lower value proposition than they originally predicted.
There are many high-profile examples of entrepreneurs prioritizing the delivery of
an initially specified product over staying within the initially predicted timeline. In July
2017, Elon Musk promised Tesla would deliver 20,000 Model 3 cars in December of that
37
same year. However, Tesla only produced 2,425 cars the entire fourth quarter of 2017,
falling short of Musk’s prediction by 93%. Tesla eventually reached their predicted product
specification, and even exceeded it reaching over 10,000 vehicles per week in 2018, but far
behind the initially predicted timeline. Speaking of Tesla’s tradeoff between delivering on
predicted product specification versus timeline, Musk himself said, “It pretty much always
happens, but not exactly on the time frame.” As another example, the tendency to persist
and achieve predicted product specification is also manifest in the large number of bridge
financings that occur between formal venture capital financing rounds. As the name implies,
these financings bridge the gap between the capital raised in the prior financing round and
the capital it actually takes to achieve what the company predicted it would accomplish
with the capital raised in the prior financing round. In other words, bridge financings occur
when additional time and financial resources, in excess of what was initially predicted, are
required to achieve the predicted product specification.
By considering several predictions simultaneously in a holistic view of strategic fore-
sight, future research can provide more nuance in the ways in which entrepreneurs previously
categorized one-dimensionally as failures (or successes) might actually have succeeded (or
failed) along other overlooked dimensions. In doing so, we might show that some failures are
driven by an intentional choice to succeed on other dimensions. By recognizing the multiple
predictions inherent in strategic foresight and their relative prioritization, entrepreneurs and
investors may be able to improve performance. For example, given that additional costs
may be required to achieve a fixed product specification, especially as entrepreneurs gain
experience from past projects and take on increasingly complex projects, future research
could explore how entrepreneurs and investors can identify situations where adjusting the
product specification may be preferable to accruing high costs or missing deadlines.
38

ReferencesAgrawal, A. K., Catalini, C., & Goldfarb, A. (2011). The geography of crowdfunding. NBER
Working Paper.Agrawal, A. K., Catalini, C., Goldfarb, A., & Luo, H. (2018). Slack time and innovation. Organi-
zation Science, 29(6), 1056–1073.Ahuja, G., Coff, R. W., & Lee, P. M. (2005). Managerial foresight and attempted rent appropriation:
Insider trading on knowledge of imminent breakthroughs. Strategic Management Journal, 26(9),791–808.
Aldrich, H. & Ruef, M. (2006). Organizations evolving. London: SAGE Publications, 2nd edition.Alvarez, S. A. & Barney, J. B. (2007). Discovery and creation: Alternative theories of en-
trepreneurial action. Strategic Entrepreneurship Journal, 1(1), 11–26.Alvarez, S. A. & Barney, J. B. (2010). Entrepreneurship and epistemology: The philosophical
underpinnings of the study of entrepreneurial opportunities. Academy of Management Annals,4(1), 557–583.
Anderson, P. (1999). Perspective: Complexity theory and organization science. OrganizationScience, 10(3), 216–232.
Artinger, S. & Powell, T. C. (2016). Entrepreneurial failure: Statistical and psychological explana-tions. Strategic Management Journal, 37(6), 1047–1064.
Baldwin, C. & Clark, K. (2000). Design rules: The power of modularity. Cambridge, MA: MITPress.
Bapna, S. & Ganco, M. (2020). Does equity crowdfunding facilitate access to capital for userinnovators: Evidence from a randomized field experiment. SSRN Working Paper.
Barney, J. B. (1986). Strategic factor markets: Expectations, luck, and business strategy. Manage-ment Science, 32(10), 1231–1241.
Barney, J. B. (1991). Firm resources and sustained competitive advantage. Journal of Management,17(1), 99–120.
Baron, R. A. & Ensley, M. D. (2006). Opportunity recognition as the detection of meaningfulpatterns: Evidence from comparisons of novice and experienced entrepreneurs. ManagementScience, 52(9), 1331–1344.
Brunswik, E. (1952). The conceptual framework of psychology. Chicago: University of ChicagoPress.
Burtch, G., Ghose, A., & Wattal, S. (2015). The hidden cost of accommodating crowdfunderprivacy preferences: A randomized field experiment. Management Science, 61(5), 949–962.
Camerer, C. & Lovallo, D. (1999). Overconfidence and excess entry: An experimental approach.American Economic Review, 89(1), 306–318.
Cassar, G. (2010). Are individuals entering self-employment overly optimistic? An empirical testof plans and projections on nascent entrepreneur expectations. Strategic Management Journal,31(8), 822–840.
Cassar, G. (2014). Industry and startup experience on entrepreneur forecast performance in newfirms. Journal of Business Venturing, 29(1), 137–151.
Casti, J. (1994). Complexification: Explaining a paradoxical world through the science of surprise.New York: HarperCollins.
Chen, J. S., Croson, D. C., Elfenbein, D. W., & Posen, H. E. (2019). The impact of learning andoverconfidence on entrepreneurial entry and exit. Organization Science, 29(6), 989–1009.
Cho, H. & Clough, D. (2015). ‘If at first you don’t succeed’: Learning and aspiration level ad-justment in venture fundraising on Kickstarter. In Academy of Management Annual MeetingVancouver, Canada.
Cohen, S. L., Bingham, C. B., & Hallen, B. L. (2019). The role of accelerator designs in mitigatingbounded rationality in new ventures. Administrative Science Quarterly, 64(4), 810–854.
Corgnet, B., Gomez-Minambres, J., & Hernan-Gonzalez, R. (2015). Goal setting and monetary
39

incentives: When large stakes are not enough. Management Science, 61(12), 2926–2944.Csaszar, F. A. (2012). Organizational structure as a determinant of performance: Evidence from
mutual funds. Strategic Management Journal, 33(6), 611–632.Csaszar, F. A. (2018). What makes a decision strategic? Strategic representations. Strategy Science,
3(4), 606–619.Csaszar, F. A. & Laureiro-Martınez, D. (2018). Individual and organizational antecedents of strate-
gic foresight: A representational approach. Strategy Science, 3(3), 513–532.Daft, R. L. & Lewin, A. Y. (1990). Can organization studies begin to break out of the normal
science straitjacket? An editorial essay. Organization Science, 1(1), 1–9.Delmar, F. & Shane, S. (2006). Does experience matter? The effect of founding team experience
on the survival and sales of newly founded ventures. Strategic Organization, 4(3), 215–247.Dencker, J. C. & Gruber, M. (2015). The effects of opportunities and founder experience on new
firm performance. Strategic Management Journal, 36(7), 1035–1052.Dencker, J. C., Gruber, M., & Shah, S. K. (2009). Pre-entry knowledge, learning, and the survival
of new firms. Organization Science, 20(3), 516–537.Denrell, J., Fang, C., & Levinthal, D. A. (2004). From T-mazes to labyrinths: Learning from
model-based feedback. Management Science, 50(10), 1366–1378.Dushnitsky, G., Piva, E., & Rossi-Lamastra, C. (2020). Investigating the mix of strategic choices
and performance of transaction platforms: Evidence from the crowdfunding setting. StrategicManagement Journal.
Edmondson, A. C., Dillon, J. R., & Roloff, K. S. (2007). Three perspectives on team learning.Academy of Management Annals, 1(1), 269–314.
Eesley, C. E. & Roberts, E. B. (2012). Are you experienced or are you talented?: When does in-nate talent versus experience explain entrepreneurial performance? Strategic EntrepreneurshipJournal, 6(3), 207–219.
Eggers, J. P. & Song, L. (2015). Dealing with failure: Serial entrepreneurs and the costs of changingindustries between ventures. Academy of Management Journal, 58(6), 1785–1803.
Eisenhardt, K. M. & Bingham, C. B. (2017). Superior strategy in entrepreneurial settings: Think-ing, doing, and the logic of opportunity. Strategy Science, 2(4), 246–257.
Ethiraj, S. K. (2007). Allocation of inventive effort in complex product systems. Strategic Man-agement Journal, 28(6), 563–584.
Ethiraj, S. K., Kale, P., Krishnan, M. S., & Singh, J. V. (2005). Where do capabilities come fromand how do they matter? A study in the software services industry. Strategic ManagementJournal, 26(1), 25–45.
Ethiraj, S. K. & Levinthal, D. (2009). Hoping for A to Z while rewarding only A: Complexorganizations and multiple goals. Organization Science, 20(1), 4–21.
Ethiraj, S. K. & Posen, H. E. (2014). Do product architectures affect innovation productivityin complex product ecosystems? In Collaboration and competition in business ecosystems,volume 30 of Advances in Strategic Management (pp. 127–166). Bingley: Emerald Group Pub-lishing.
Ethiraj, S. K., Ramasubbu, N., & Krishnan, M. S. (2012). Does complexity deter customer-focus?Strategic Management Journal, 33(2), 137–161.
Forbes, D. P. (2005). Are some entrepreneurs more overconfident than others? Journal of BusinessVenturing, 20(5), 623–640.
Gary, M. S. & Wood, R. E. (2011). Mental models, decision rules, and performance heterogeneity.Strategic Management Journal, 32(6), 569–594.
Gavetti, G. (2012). Toward a behavioral theory of strategy. Organization Science, 23(1), 267–285.Gavetti, G. & Menon, A. (2016). Evolution cum agency: Toward a model of strategic foresight.
Strategy Science, 1(3), 207–233.Gompers, P., Kovner, A., Lerner, J., & Scharfstein, D. (2010). Performance persistence in en-
40

trepreneurship. Journal of Financial Economics, 96(1), 18–32.Greve, H. R. (1998). Performance, aspirations, and risky organizational change. Administrative
Science Quarterly, 43(1), 58–86.Greve, H. R. (2003). A behavioral theory of R&D expenditures and innovations: Evidence from
shipbuilding. Academy of Management Journal, 46(6), 685–702.Gruber, M., MacMillan, I. C., & Thompson, J. D. (2008). Look before you leap: Market opportunity
identification in emerging technology firms. Management Science, 54(9), 1652–1665.Hallen, B. L. & Pahnke, E. C. (2016). When do entrepreneurs accurately evaluate venture capital
firms’ track records? A bounded rationality perspective. Academy of Management Journal,59(5), 1535–1560.
Hannan, M. T., Polos, L., & Carroll, G. R. (2003). The fog of change: Opacity and asperity inorganizations. Administrative Science Quarterly, 48(3), 399–432.
Hayward, M. L., Shepherd, D. A., & Griffin, D. (2006). A hubris theory of entrepreneurship.Management Science, 52(2), 160–172.
Heath, C. & Staudenmayer, N. (2000). Coordination neglect: How lay theories of organizingcomplicate coordination in organizations. Research in Organizational Behavior, 22, 153–191.
Hogarth, R. M. & Karelaia, N. (2012). Entrepreneurial success and failure: Confidence and falliblejudgment. Organization Science, 23(6), 1733–1747.
Hsu, D. H. (2007). Experienced entrepreneurial founders, organizational capital, and venture capitalfunding. Research Policy, 36(5), 722–741.
Hsu, D. H. & Ziedonis, R. H. (2013). Resources as dual sources of advantage: Implications forvaluing entrepreneurial-firm patents. Strategic Management Journal, 34(7), 761–781.
Joseph, J. & Gaba, V. (2015). The fog of feedback: Ambiguity and firm responses to multipleaspiration levels. Strategic Management Journal, 36(13), 1960–1978.
Kapoor, R. & Wilde, D. (2020). Peering into a crystal ball: Foresight during periods of industrychange. Wharton School Working Paper.
Kauffman, S. A. (1995). At home in the universe. New York: Oxford University Press.Kickstarter PBC (2020). Our rules. https://www.kickstarter.com/rules.Leiblein, M. J., Reuer, J. J., & Zenger, T. (2018). What makes a decision strategic? Strategy
Science, 3(4), 558–573.Levinthal, D. A. (1997). Adaptation on rugged landscapes. Management Science, 43(7), 934–950.Levinthal, D. A. & March, J. G. (1993). The myopia of learning. Strategic Management Journal,
14(S2), 95–112.Lewis, K., Lange, D., & Gillis, L. (2005). Transactive memory systems, learning, and learning
transfer. Organization Science, 16(6), 581–598.Minniti, M. & Bygrave, W. (2001). A dynamic model of entrepreneurial learning. Entrepreneurship
Theory and Practice, 25(3), 5–16.Mollick, E. (2014). The dynamics of crowdfunding: An exploratory study. Journal of Business
Venturing, 29(1), 1–16.Mollick, E. (2015). Delivery rates on Kickstarter. SSRN Working Paper.Nelson, R. R. & Winter, S. G. (2002). Evolutionary theorizing in economics. Journal of Economic
Perspectives, 16(2), 23–46.Nickerson, J. & Argyres, N. (2018). Strategizing before strategic decision making. Strategy Science,
3(4), 592–605.Osterloh, M. & Frey, B. S. (2000). Motivation, knowledge transfer, and organizational forms.
Organization Science, 11(5), 538–550.Ott, T. E., Eisenhardt, K. M., & Bingham, C. B. (2017). Strategy formation in entrepreneurial
settings: Past insights and future directions. Strategic Entrepreneurship Journal, 11(3), 306–325.
Paik, Y. (2014). Serial entrepreneurs and venture survival: Evidence from U.S. venture-capital-
41

financed semiconductor firms. Strategic Entrepreneurship Journal, 8(3), 254–268.Peter, L. J. & Hull, R. (1969). The Peter principle. London: Souvenir Press.Pich, M. T., Loch, C. H., & Meyer, A. D. (2002). On uncertainty, ambiguity, and complexity in
project management. Management Science, 48(8), 1008–1023.Politis, D. (2005). The process of entrepreneurial learning: A conceptual framework. Entrepreneur-
ship: Theory and Practice, 29(4), 399–424.Porter, M. E. (1980). Competitive strategy: Techniques for analyzing industries and competitors.
New York: Free Press.Rapping, L. (1965). Learning and World War II production functions. Review of Economics and
Statistics, 47(1), 81–86.Raveendran, M., Silvestri, L., & Gulati, R. (2020). The role of interdependence in the micro-
foundations of organization design: Task, goal, and knowledge interdependence. Academy ofManagement Annals, 14(2), 828–868.
Rivkin, J. W. (2000). Imitation of complex strategies. Management Science, 46(6), 824–844.Rivkin, J. W. & Siggelkow, N. (2003). Balancing search and stability: Interdependencies among
elements of organizational design. Management Science, 49(3), 290–311.Shane, S. (2000). Prior knowledge and the discovery of entrepreneurial opportunities. Organization
Science, 11(4), 448–469.Simon, H. A. (1955). A behavioral model of rational choice. Quarterly Journal of Economics, 69(1),
99–118.Simon, H. A. (1962). The architecture of complexity. Proceedings of the American Philosophical
Society, 106(6), 467–482.Simon, H. A. (1969). The sciences of the artificial. Cambridge, MA: MIT Press.Simon, H. A. (1990). Invariants of human behavior. Annual Review of Psychology, 41(1), 1–20.Sitkin, S. B. (1992). Learning through failure: The strategy of small losses. In L. Cumming & B.
Staw (Eds.), Research in organizational behavior (pp. 231–266). New York: JAI Press.Sommer, S. C. & Loch, C. H. (2004). Selectionism and learning in projects with complexity and
unforeseeable uncertainty. Management Science, 50(10), 1334–1347.Soubliere, J.-F. & Gehman, J. (2020). The legitimacy threshold revisited: How prior successes and
failures spill over to other endeavors on Kickstarter. Academy of Management Journal, 63(2),472–502.
Stuart, R. W. & Abetti, P. A. (1990). Impact of entrepreneurial and management experience onearly performance. Journal of Business Venturing, 5(3), 151–162.
Talbot, F. B. (1982). Resource-constrained project scheduling with time-resource tradeoffs: Thenonpreemptive case. Management Science, 28(10), 1197–1210.
Thompson, P. (2001). How much did the Liberty shipbuilders learn? New evidence for an old casestudy. Journal of Political Economy, 109(1), 103–137.
Toffler, A. (1985). The adaptive corporation. New York: McGraw-Hill.Toft-Kehler, R., Wennberg, K., & Kim, P. H. (2014). Practice makes perfect: Entrepreneurial-
experience curves and venture performance. Journal of Business Venturing, 29(4), 453–470.Townsend, D. M., Hunt, R. A., McMullen, J. S., & Sarasvathy, S. D. (2018). Uncertainty, knowledge
problems, and entrepreneurial action. Academy of Management Annals, 12(2), 659–687.Ulrich, K., Eppinger, S., & Yang, M. (2020). Product design and development. New York: McGraw-
Hill Education, 7th edition.Van den Steen, E. (2016). A formal theory of strategy. Management Science, 63(8), 2616–2636.Venkataraman, S. (2003). Foreward. In S. Shane (Ed.), A General Theory Of Entrepreneurship:
The Individual-Opportunity Nexus (pp. xi–xii). Northampton, MA: Edward Elgar.Wu, B. & Knott, A. M. (2006). Entrepreneurial risk and market entry. Management Science, 52(9),
1315–1330.
42

Unforeseen Interdependencies
Experience
LearningForeseen Interdependencies
Project Complexity
Inte
rdep
ende
ncie
s
Figure 1: Conceptual Model of Experience and Interdependencies. The vertical axis Interde-pendencies represents the number of interdependencies. The horizontal axis Experience represents an en-trepreneur’s level of project execution experience. The Project Complexity curve illustrates the total numberof interdependencies in projects pursued by an entrepreneur at different levels of Experience. The shadedgrey area reflects the range of possible Project Complexity curves: linear as a lower bound and geometricas an upper bound; the black dotted line illustrates one possible scenario. The Learning curve illustratesthe total number of interdependencies foreseen (Foreseen Interdependencies) by an entrepreneur at differentlevels of Experience. As Experience increases, the gap between the Learning curve and the Project Complex-ity curve increases and, as a result, the ratio of Unforeseen Interdependencies to Foreseen Interdependenciesalso increases.
Name & Date ImageFeatures
RankDelay
DurationDelay Duration/Predicted Time
Unforeseen Interdependencies
RingoFeb 25, 2015
1 (Fewest) 66 Days 92%“Our machine refused to pick up theprogramming ports. . . this programmingport was just a bit [too] heavy.”
WinkOct 28, 2015
2 (Middling) 73 Days 115%
“The testing procedure is taking longerthan expected. . . finding a few unitswith bad motors.”
“We ran out of motors and our replenish-ment shipment was held up.”
Spirit RoverSept 28, 2016
3 (Most) 340 Days 254%
“Found two mistakes on the boards. . .fixed with an extra step on our end, but Ishould have known better on both ofthese.”
“We finally found sources for all thescrews, fasteners, washers, nuts, andspaces. I was surprised and unprepared athow difficult this part was going to be.”
Figure 2: Example Products by Entrepreneur Over Time. All projects by Plum Geek Robotics,founded by Kevin King, in the robotics subtype of the technology category. The Unforeseen Interdependen-cies column provides quotations from updates by the entrepreneur. All other variables mirror those definedin the paper.
43

Predicted Time Actual Time
0.002
0.004
0.006
0 300 600 900 1200Days
Den
sity
Figure 3: Density Plot of Actual Time and Predicted Time. The distribution of Actual Time isshifted and skewed to the right compared to the distribution of Predicted Time. We adjust the bandwidthto smooth the distributions.
100
150
200
250
300
350
1 2 3 4+
Day
s
Project
Actual Time
Predicted Time
Figure 4: Actual Time and Predicted Time with Experience. Visual representation of the relativecoefficients of the average actual time entrepreneurs take to deliver a product versus the average time theentrepreneurs predict it will take to deliver, with this relative relationship shown over time as entrepreneursgain experience. Figure based on coefficient estimates from a non-parametric model detailed in AppendixSection A.7 that includes indicators for project number instead of Project Experience.
44
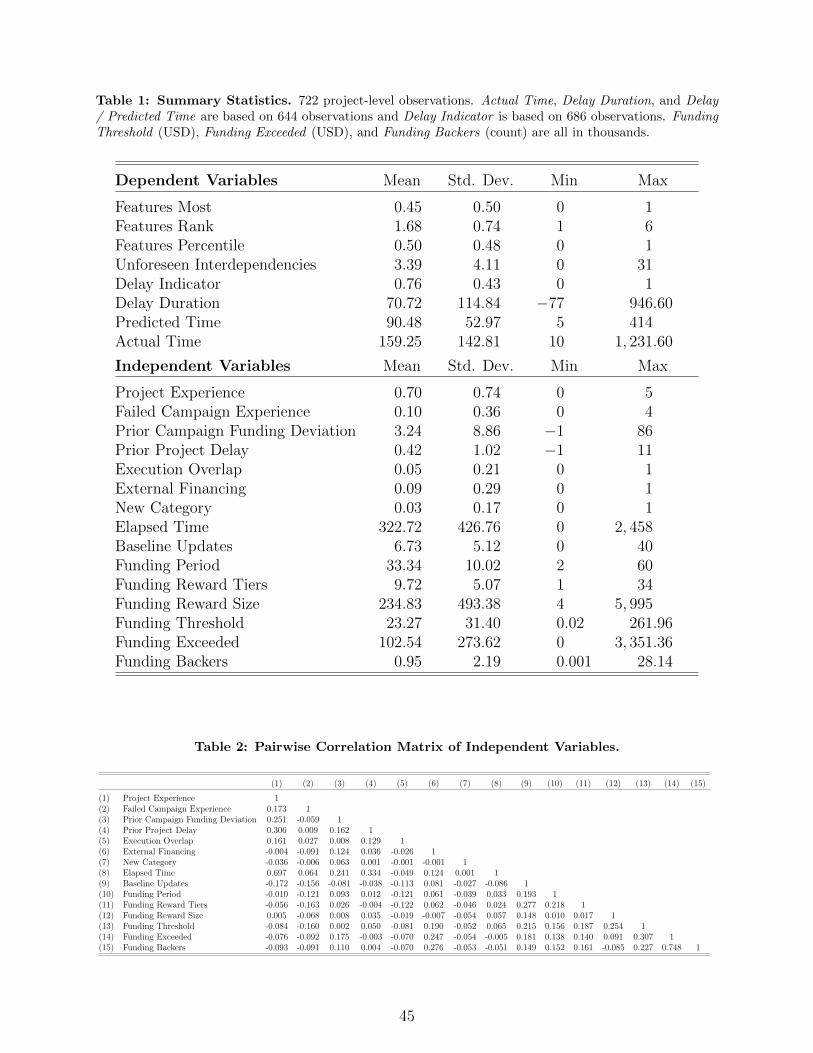
Table 1: Summary Statistics. 722 project-level observations. Actual Time, Delay Duration, and Delay/ Predicted Time are based on 644 observations and Delay Indicator is based on 686 observations. FundingThreshold (USD), Funding Exceeded (USD), and Funding Backers (count) are all in thousands.
Dependent Variables Mean Std. Dev. Min Max
Features Most 0.45 0.50 0 1Features Rank 1.68 0.74 1 6Features Percentile 0.50 0.48 0 1Unforeseen Interdependencies 3.39 4.11 0 31Delay Indicator 0.76 0.43 0 1Delay Duration 70.72 114.84 −77 946.60Predicted Time 90.48 52.97 5 414Actual Time 159.25 142.81 10 1, 231.60
Independent Variables Mean Std. Dev. Min Max
Project Experience 0.70 0.74 0 5Failed Campaign Experience 0.10 0.36 0 4Prior Campaign Funding Deviation 3.24 8.86 −1 86Prior Project Delay 0.42 1.02 −1 11Execution Overlap 0.05 0.21 0 1External Financing 0.09 0.29 0 1New Category 0.03 0.17 0 1Elapsed Time 322.72 426.76 0 2, 458Baseline Updates 6.73 5.12 0 40Funding Period 33.34 10.02 2 60Funding Reward Tiers 9.72 5.07 1 34Funding Reward Size 234.83 493.38 4 5, 995Funding Threshold 23.27 31.40 0.02 261.96Funding Exceeded 102.54 273.62 0 3, 351.36Funding Backers 0.95 2.19 0.001 28.14
Table 2: Pairwise Correlation Matrix of Independent Variables.
(1) (2) (3) (4) (5) (6) (7) (8) (9) (10) (11) (12) (13) (14) (15)
(1) Project Experience 1(2) Failed Campaign Experience 0.173 1(3) Prior Campaign Funding Deviation 0.251 -0.059 1(4) Prior Project Delay 0.306 0.009 0.162 1(5) Execution Overlap 0.161 0.027 0.008 0.129 1(6) External Financing -0.004 -0.091 0.124 0.036 -0.026 1(7) New Category -0.036 -0.006 0.063 0.001 -0.001 -0.001 1(8) Elapsed Time 0.697 0.064 0.241 0.334 -0.049 0.124 0.001 1(9) Baseline Updates -0.172 -0.156 -0.081 -0.038 -0.113 0.081 -0.027 -0.086 1(10) Funding Period -0.010 -0.121 0.093 0.012 -0.121 0.061 -0.039 0.033 0.193 1(11) Funding Reward Tiers -0.056 -0.163 0.026 -0.004 -0.122 0.062 -0.046 0.024 0.277 0.218 1(12) Funding Reward Size 0.005 -0.068 0.008 0.035 -0.019 -0.007 -0.054 0.057 0.148 0.010 0.017 1(13) Funding Threshold -0.084 -0.160 0.002 0.050 -0.081 0.190 -0.052 0.065 0.215 0.156 0.187 0.254 1(14) Funding Exceeded -0.076 -0.092 0.175 -0.003 -0.070 0.247 -0.054 -0.005 0.181 0.138 0.140 0.091 0.307 1(15) Funding Backers -0.093 -0.091 0.110 0.004 -0.070 0.276 -0.053 -0.051 0.149 0.152 0.161 -0.085 0.227 0.748 1
45

Table 3: Features and Unforeseen Interdependencies. Ordinary least squares (OLS) estimation.Robust standard errors are clustered at the entrepreneur level. p-values are shown in parentheses.
Features Features Features Unforeseen Ln UnforeseenMost Rank Percentile Interdependencies Interdependencies
Project Experience 0.117 0.370 0.138 1.298 0.205(0.047) (0.000) (0.016) (0.000) (0.002)
Failed Campaign Experience 0.075 0.169 0.081 0.672 0.185(0.506) (0.245) (0.401) (0.066) (0.057)
Prior Campaign Funding Deviation 0.001 0.000 0.001 0.005 −0.000(0.779) (0.932) (0.858) (0.772) (0.908)
Prior Project Delay 0.011 −0.034 0.003 −0.698 −0.128(0.758) (0.535) (0.941) (0.000) (0.000)
Execution Overlap −0.365 −0.447 −0.338 −0.216 0.096(0.025) (0.031) (0.028) (0.736) (0.410)
External Financing 0.371 0.286 0.367 1.122 0.148(0.006) (0.055) (0.006) (0.317) (0.515)
New Category −0.063 0.156 0.020 1.596 0.246(0.685) (0.464) (0.895) (0.078) (0.231)
Elapsed Time −0.000 0.000 0.000 0.004 0.001(0.665) (0.879) (0.961) (0.009) (0.000)
Funding Period 0.007 0.008 0.007 0.028 0.006(0.101) (0.119) (0.053) (0.172) (0.144)
Funding Reward Tiers 0.006 0.007 0.008 −0.023 −0.003(0.395) (0.539) (0.296) (0.521) (0.646)
Funding Reward Size 0.000 0.000 0.000 −0.000 0.000(0.003) (0.000) (0.002) (0.779) (0.848)
Ln Funding Threshold 0.027 0.048 0.016 0.754 0.157(0.527) (0.356) (0.693) (0.004) (0.000)
Ln Funding Exceeded 0.671 0.076(0.008) (0.109)
Ln Funding Backers −0.018 0.074(0.960) (0.268)
Baseline Updates 0.172(0.001)
Ln Baseline Updates 0.271(0.000)
Entrepreneur FE Yes Yes Yes Yes YesProduct Subtype FE Yes Yes Yes Yes YesYear FE Yes Yes Yes Yes YesMonth FE Yes Yes Yes Yes YesR2 0.284 0.437 0.279 0.744 0.774Entrepreneurs 314 314 314 314 314Observations 722 722 722 722 722
46

Table 4: Delivery and Delay. Ordinary least squares (OLS) estimation. Robust standard errors areclustered at the entrepreneur level. p-values are shown in parentheses.
Delay Delay Delay Duration/ Predicted ActualIndicator Duration Predicted Time Time Time
Project Experience 0.119 39.616 0.530 8.364 46.386(0.010) (0.001) (0.001) (0.014) (0.001)
Failed Campaign Experience 0.139 −2.720 −0.071 15.751 11.345(0.123) (0.870) (0.749) (0.031) (0.620)
Prior Campaign Funding Deviation −0.003 0.094 −0.001 0.095 0.390(0.062) (0.828) (0.864) (0.578) (0.411)
Prior Project Delay −0.042 −21.689 −0.111 4.288 −19.655(0.042) (0.020) (0.690) (0.024) (0.034)
Execution Overlap −0.052 11.587 1.183 −3.993 9.501(0.457) (0.774) (0.233) (0.636) (0.831)
External Financing 0.138 95.312 0.371 21.388 124.811(0.196) (0.234) (0.481) (0.376) (0.205)
New Category 0.082 39.284 0.425 6.012 46.345(0.611) (0.135) (0.156) (0.546) (0.168)
Elapsed Time −0.000 −0.092 −0.001 −0.023 −0.111(0.422) (0.130) (0.353) (0.265) (0.094)
Funding Period 0.009 1.302 0.004 0.147 1.730(0.000) (0.059) (0.848) (0.555) (0.022)
Funding Reward Tiers 0.003 0.785 0.001 −0.150 0.996(0.454) (0.474) (0.977) (0.721) (0.441)
Funding Reward Size 0.000 −0.011 0.000 0.005 −0.008(0.807) (0.721) (0.707) (0.533) (0.830)
Ln Funding Threshold 0.008 22.716 −0.090 19.806 40.817(0.786) (0.103) (0.533) (0.000) (0.011)
Ln Funding Exceeded 0.034 28.728 0.201 27.973(0.195) (0.004) (0.085) (0.014)
Ln Funding Backers 0.008 −34.159 −0.176 −31.278(0.837) (0.009) (0.281) (0.040)
Entrepreneur FE Yes Yes Yes Yes YesProduct Subtype FE Yes Yes Yes Yes YesYear FE Yes Yes Yes Yes YesMonth FE Yes Yes Yes Yes YesR2 0.662 0.717 0.656 0.752 0.744Entrepreneurs 306 303 303 314 303Observations 686 644 644 722 644
47

A Appendix
A.1 Qualitative Interviews
We conducted a program of qualitative interviews after deductively theorizing hypotheses
and testing those hypotheses empirically to determine the mean effect. These interviews
were not used to draw inductive conclusions. Instead, the purpose of these interviews was
to better understand and confirm the mean effect observed in the quantitative data. Given
that intent, we identified and reached out to entrepreneurs in our sample who match the
observed empirical trends to gain additional color on what drove those outcomes. These
interviews confirmed the mechanisms outlined in our theory, which we established prior to
conducting the interviews.
We reached out to entrepreneurs via LinkedIn messages, company contact forms,
Kickstarter messages, or email, depending on what was available in each case. We received
18 responses to our outreach. Two of these entrepreneurs were not willing to participate
and five dropped out in the scheduling process. In the end, we conducted interviews with
11 entrepreneurs from our sample. Table A.1 and Table A.2 provide summary information
and statistics for each of these entrepreneurs. We conducted all interviews via Zoom video-
conferencing except for one interview conducted via Google Hangouts per the entrepreneur’s
request. All interviews conducted via Zoom were recorded after obtaining the entrepreneur’s
verbal consent and transcribed for review. Interviews were conducted between January 29,
2020 and June 24, 2020. The interviews were scheduled for 30 minutes, with most interviews
lasting between 30 and 45 minutes.
—– Insert Table A.1 Qualitative Interview Sample. —–
— Insert Table A.2 Qualitative Interview Sample Summary Statistics. —
Each interview followed a semi-structured format. Interview questions covered a
broad range of topics roughly mirroring the topics outlined in our theory, hypothesis devel-
opment, and supplemental analysis, as well as general background. We asked entrepreneurs:
why they decided to launch crowdfunding projects on Kickstarter (and why they stopped);
what they learned implementing an earlier project and how that impacted future projects;
Appendix - i

what their process was for determining the predicted product specification and predicted
timeline; what unforeseen challenges they encountered; what they did when they encoun-
tered unforeseen challenges, etc.
A.2 Complexity in Crowdfunded Hardware Technology Projects
We provide contextual evidence that: (1) entrepreneurs tend to add multiple features to
subsequent projects, and (2) even relatively “low” complexity projects in our sample were
still highly complex and required addressing a large number of interdependencies.
A.2.1 Within Entrepreneur: Tendency to Add Multiple Features
Close examination of specific products in our sample make it clear that entrepreneurs gen-
erally add multiple features as they advance from project to project, leading to increased
complexity across an entrepreneur’s hardware technology crowdfunding projects. Continuing
from Figure 2, we use the example of Plum Geek Robotics to illustrate this progression across
various quantitative and qualitative measures. Figure A.1 presents a detailed breakdown of
the product features in Plum Geek Robotics’s first and third projects.
—– Insert Figure A.1 Plum Geek Robotics Product Features. —–
The first project, Ringo Robot, has six colored lights, multi-frequency sound abilities,
a light sensor, 360-degree visibility edge sensors, an accelerometer, a gyroscope, etc. By the
time the company reached their third project, the Spirit Rover, the product had significantly
more features, with a total of 27 colored lights, new computer vision capabilities, retractable
gripper arms, wireless network capabilities, etc.
If we consider this example in the language of the NK model (Kauffman, 1995), N
increased rapidly from the first to the third project. Based on our oversimplification of the
product, we might imagine that N went from 5 to 15 to 35 across three projects. This
increase in N is one way that the total number of interdependencies can increase rapidly
from project to project.
A.2.2 Across Entrepreneur: “High” Complexity on Different Project Types
The hardware technology projects in our sample generally have high complexity, with both
a large number of features and high level of interdependencies. That said, there is certainly
variation in both the number of features and the level of interdependencies among those
Appendix - ii
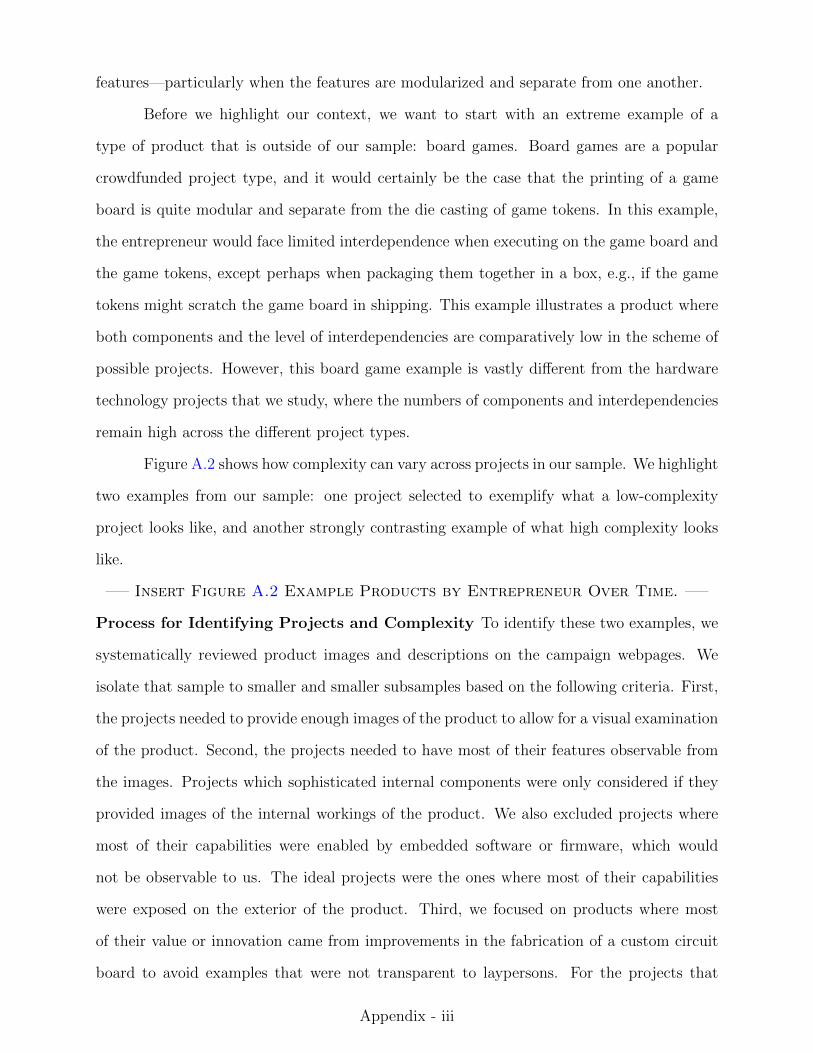
features—particularly when the features are modularized and separate from one another.
Before we highlight our context, we want to start with an extreme example of a
type of product that is outside of our sample: board games. Board games are a popular
crowdfunded project type, and it would certainly be the case that the printing of a game
board is quite modular and separate from the die casting of game tokens. In this example,
the entrepreneur would face limited interdependence when executing on the game board and
the game tokens, except perhaps when packaging them together in a box, e.g., if the game
tokens might scratch the game board in shipping. This example illustrates a product where
both components and the level of interdependencies are comparatively low in the scheme of
possible projects. However, this board game example is vastly different from the hardware
technology projects that we study, where the numbers of components and interdependencies
remain high across the different project types.
Figure A.2 shows how complexity can vary across projects in our sample. We highlight
two examples from our sample: one project selected to exemplify what a low-complexity
project looks like, and another strongly contrasting example of what high complexity looks
like.
—– Insert Figure A.2 Example Products by Entrepreneur Over Time. —–
Process for Identifying Projects and Complexity To identify these two examples, we
systematically reviewed product images and descriptions on the campaign webpages. We
isolate that sample to smaller and smaller subsamples based on the following criteria. First,
the projects needed to provide enough images of the product to allow for a visual examination
of the product. Second, the projects needed to have most of their features observable from
the images. Projects which sophisticated internal components were only considered if they
provided images of the internal workings of the product. We also excluded projects where
most of their capabilities were enabled by embedded software or firmware, which would
not be observable to us. The ideal projects were the ones where most of their capabilities
were exposed on the exterior of the product. Third, we focused on products where most
of their value or innovation came from improvements in the fabrication of a custom circuit
board to avoid examples that were not transparent to laypersons. For the projects that
Appendix - iii

meet these criteria, we take discretionary liberties to focus on products that readers of the
manuscript could appreciate the value and novelty of. We selected the two projects among
that set that had among the least and most complexity based on the process described next.
The low-complexity project is the Griffin Pocket Tool XL, a metal multi-purpose tool. The
high-complexity project is the Obsidian 3D Printer.
We take a deep dive to document the complexity of these projects in as much detail as
possible, describing the exact process that was used and subsequently independently verified
by an expert hardware technology entrepreneur. First, as detailed as we can possibly observe
from public records, we list out all the possible components or modules that make up the
product. One can think of the set of components that generally reflect the feature set of the
product. Each of these components is associated with several organizational tasks, which can
happen within the focal entrepreneurial firm or by third-party suppliers to the entrepreneur.
We then list out the interdependencies that we know must exist relative to these
product components and modules. These are just the ones that we can infer from a best-
case scenario of how the product would be manufactured. To be clear, our effort in listing
out these interdependencies is subject to the same bounded rationality limitations as the
entrepreneur. To be even clearer, we are likely underestimating the total number of interde-
pendencies by a substantial degree relative to the actual entrepreneur who obviously knows
more about the product than we do. But the point we want to make is simple: the total
number of interdependencies starts getting out of hand very rapidly. We are certain that
our examination is incomplete and that we have left many “unforeseen interdependencies”
off our list.
Implications of Illustrative Projects From Figure A.2, there are two takeaways. First,
the number of components or tasks, even on one of the simplest projects, is legitimately
quite high already. Second, and more importantly, this results in an enormous number of
interdependencies that need to be addressed, even for the simplest project. This suggests
that we should infer that the general level of interdependencies, and even the lowest levels
of interdependencies, is indeed quite high, and high enough to allow for interdependencies
to increase rapidly as features are added.
Appendix - iv

A.3 Entrepreneurial Prediction Process
We provide contextual background and supporting evidence for (1) the challenges inherent
in making predictions and (2) the practical steps the entrepreneurs take to make these
predictions.
A.3.1 What Predictions Entail
Through our qualitative interviews, we sought to understand the details of the prediction
process undertaken by entrepreneurs, including the specific steps taken and items considered
when predicting the project timeline.
Making predictions in any system with many interdependencies is very difficult. The
entrepreneurs in our sample consistently recognize the complexity of the entrepreneurial
endeavors they undertake. One noted, “The hardware game is hard. Even if you’ve been
through... so many form factors and production issues, you think you would have perfected
it. There is no perfecting manufacturing” (TabletCo CEO). Another highlighted the specific
difficulties with launching hardware projects: “Software is very different if something goes
wrong. You just push an update on the back end and it’s there in the morning. When you’re
doing hardware and you miss a washer, that’s a huge freakin’ problem, and you’re for sure
going to miss a washer sometime” (WidgetsCo CEO).
Our interviews suggest that the main source of prediction difficulty revolves around
uncertainty relative to the interdependencies rather than the distinct components. The
WidgetsCo CEO knew that the washer was a component of the project, but it was inter-
dependencies with other parts of the project that could lead to the washer’s omission that
was the source of uncertainty. Entrepreneurs generally know all or most of the components
required to complete the project, whereas a large number of the interactions between all the
different components are unknown. In the language of the NK model (Kauffman, 1995), we
interpret entrepreneurs making predictions in our context as having some reasonable sense
for the value of N, but they also recognize that the bulk of the work in execution revolves
around K, for which they have a much less accurate sense prior to actually executing the
projects.
Appendix - v

This is evident in our review of the entrepreneurs’ own assessments of uncertainty,
as they publicly report as “Risks and Challenges” required for every Kickstarter funding
campaign. We review this content for a large set of projects and observe that the top risks
that concern entrepreneurs relate to the interdependencies they might face in execution.
They know the various components of the project (N) but don’t yet know how these com-
ponents fit together (K). One entrepreneur writes, “Every single component of this product
is well known,” but we “only have a 3D-printed prototype right now, and...don’t have any
experience with injection moulding at this point.” Others note interdependencies inherent in
“Coordination with multiple manufacturers, with various lead times”; “testing the pre-mass
production sample device”; and obtaining “CE, FCC, IC compliance...certificates.”
Part of this knowledge around components and uncertainty around interdependencies
is true by construction in our setting. Kickstarter requires all entrepreneurs to have a working
prototype. As a result, the entrepreneurs are already aware of the various components needed
to produce the product. The complexity lies in the interdependencies that may not have
surfaced when making the prototype: “The prototypes are all handmade. They’re more of
a unique product that has more time put into it. But when you’re doing production, you’re
not spending that much time on every single unit. You’re doing large volume. That’s where
we end up having problems” (GPSCo CEO).
A.3.2 How Predictions Are Made
Based on our qualitative interviews, we find that entrepreneurs generally make predictions
by breaking down the project into specific tasks, making predictions relative to each specific
task, and then aggregating the task-level predictions to the project level. CircuitsCo CEO
described how, “I just took basically all the things I knew would take time—like waiting for
Kickstarter to wire the money, manufacturing, shipping-—and I added all of them together.”
3DPrintCo CEO detailed a similar process for making the timeline prediction: “We’ve got
a lot of experience in manufacturing. So it was a matter of understanding what our supply
chain would look like and understanding how our product design could deviate from the
design that we launched with so that whatever unforeseen challenges we may have faced we
could have accomplished or overcome those challenges with deviations in our plan. So we
Appendix - vi

tried to create basically a risk mitigation program for the possible design variations that we
would have expected.”
Our interviews also support the notion that entrepreneurs are making these predic-
tions for execution that follows a local search (Sommer & Loch, 2004). AccessoryCo CEO
emphasized how his execution involved sequentially changing “one component after another”
and “one iteration” at a time. For example, he first changed “the quality of the plastic, then
the color of the plastic, . . . then the adhesive tape.” This local search execution process is
complementary to the process of aggregating the individual, step-by-step task-level predic-
tions to the project level.
Once entrepreneurs determine their best project-level prediction, they seem to sys-
tematically “pad” their timelines with extra time as a precaution. CircuitsCo CEO said he
usually “added like a month of buffer or something” and TabletCo CEO said he urges other
entrepreneurs, “Don’t be too aggressive...definitely build in like two or three months extra.”
This sentiment is echoed by WidgetsCo CEO who said, “Obviously, things go wrong. So
another thing I do is I take my timeline and I add 30% to it. I don’t care what it is because
you’re going to fuck it up so yeah. So that’s my rule for financial modeling and project
modeling. Always add 30% because something’s gonna go wrong.”
As detailed in Appendix Section A.9, we find no evidence that the prediction process
for delivery timelines involves social comparison or competitive benchmarking with or against
other entrepreneurs.
A.4 Data Collection
A.4.1 Features Rank
To collect the Features Rank variable, we hired five independent reviewers to rank each
entrepreneur’s projects by the number of features.a We made two separate efforts to make
sure this data generation process would be fruitful. First, to ensure a potential reviewer
could handle what was asked of them, we carefully selected among reviewers to make sure
they met a general qualification level. We sought out individuals with educational and
aThe reviewers also ranked the projects according to technical sophistication, which is closely correlated tonumber of features.
Appendix - vii

professional experience in fields relevant to understanding and evaluating hardware products.
Second, given that the projects span a relatively diverse set of product subtypes–—although
limited to only hardware products–—it was important that we bring in a diverse set of
reviewers such that, for any given project, the majority of reviewers would be qualified to
make an assessment. We sought out reviewers of different genders and generations to obtain
a balanced perspective. Table A.3 summarizes the backgrounds of the reviewers.
—– Insert Table A.3 Project Reviewer Backgrounds. —–
Each reviewer reviewed the photographs and product descriptions of each project by
the same entrepreneur. We provided the reviewers with an Excel document containing sets of
projects grouped by entrepreneur. The order of the projects within each entrepreneur group
was randomized. The reviewers opened the links for the Kickstarter project page for each of
the projects in the entrepreneur group. They then assigned a rank to each of the projects
by the same entrepreneur. Even when projects seemed almost identical or very similar, we
required the reviewers to force a ranking between all projects. Each reviewer repeated this
process for all the groups of projects by the same entrepreneur.
We aggregate the rankings across the reviewers. In the case of disagreement between
reviewers, we take the average rank between the two reviewers and then re-rank the projects
based on the averaged scores. We allow for ties (which only occur in the case of conflicting
rankings). Given that we force a ranking even when projects are nearly identical or very
similar, this means that rank assignment is close to random in those circumstances. As
a result, we expect some disagreement between reviewer rankings. This design gives more
weight to the rankings that are more clear-cut and less weight to the rankings that are more
ambiguous. If two projects tie for the most features, the binary indicator turns on for both
projects, which washes out with the inclusion of entrepreneur fixed effects.b
bFor example, if an entrepreneur has two total projects and the two reviewers disagree on which of the twoprojects has more features, then both projects would have an average rank of 1.5 (being rated as 1 by onereviewer and 2 by the other). After re-ranking based on these average scores, both of the entrepreneur’sprojects would have a 1 for Features Most. Because we include entrepreneur fixed effects in the regression,this entrepreneur would show no change across projects. As a result, in our model the variation in numberof features across an entrepreneur’s subsequent projects is driven by the projects where the ranking betweenprojects is clearer and more objective and is not driven by the projects where the ranking is ambiguous.
Appendix - viii

A.4.2 Delay Duration and Actual Time
To collect the actual shipment date for all the projects in our sample, we hired two contractors
on UpWork.c We provided them with an Excel file containing a link to each project and a
row for each of the rewards associated with that project. The contractor followed the link to
the project page and read through the updates and comments to record (at the individual
reward level) the date on which the reward first began to ship, the date on which all the
rewards were shipped, whether it was apparent that the reward had still not shipped, or
whether there was no mention of shipping. Across the 722 projects in our sample, there are
7,019 different rewards with an average of 9.7 rewards per project. We exclude the $1 cash
donation reward option included on most projects as well as rewards that were not backed.
We were able to identify the date the reward started shipping for 71% of rewards and the
date the reward finished shipping for 49% of rewards.
At the reward level, we take the later of the date the reward first shipped and the date
the reward finished shipping. We take the later date because the entrepreneur’s prediction
is for the date all rewards will be delivered, not when the entrepreneur would deliver the
first reward. This allows us to measure the actual shipment date for 80% of all rewards in
our sample (which includes all rewards that list either the date the reward first shipped or
the date the reward finished shipping). The actual delivery date has a day, month, and year
whereas the predicted delivery date is just a month and a year. To be conservative, the delay
for each reward is computed as the difference between the actual shipment date and the first
day of the month after the month of the predicted delivery date. We then aggregate this
reward-level data to the project level to compute the Delay Duration by taking the mean
delay of all the rewards in each project. This same method of aggregating from the reward
level to the project level is used for Predicted Time. The results are almost identical if we
use the median. Using this approach we are able to measure the Delay Indicator for 89% of
projects in the sample. This includes all projects with shipment information for at least one
cWe use the date shipped as opposed to the date the product arrived on the customer’s doorstep. Shipmentdate is more standardized and consistent across all projects regardless of customer location. There are alsogenerally only one or two shipment dates per project as opposed to many more unique dates when thebackers receive the reward. And, as a practical matter, the data on when customers receive rewards is muchsparser and more inconsistent than the data on when the rewards ship.
Appendix - ix

reward in the project.
A.4.3 External Funding
To define our External Funding control variable, we collect data on venture financing from
Crunchbase. We hired an RA to search both the entrepreneur name and the company
name (if available) for each project to look for any matches on Crunchbase. For those en-
trepreneurs with a Crunchbase page, we collected data on each fundraising round (excluding
those classified as crowdfunding, which would reflect the Kickstarter projects). This binary
indicator turns on if the date the project launched comes after the date the entrepreneur of
that project raised external capital from another source. The results do not change in any
substantive way if we use the cumulative number of external funding rounds instead of this
binary indicator.
A.5 Variable Distributions
A.5.1 Quantile Summary Statistics
For transparency and clarity, we supplement the summary statistics provided in Table 1.
Table A.4 includes the 0%, 25%, 50%, 75%, and 100% quantiles for each independent variable
used in analysis.
—– Insert Table A.4 Variable Quantiles. —–
A.5.2 Distribution Visualization
In addition, we include a visualization of the distribution of the variables. Figure A.3 contains
plots of the distribution of each independent variables used in analysis. Density plots are
used for continuous measures, and histograms are used for measures that fall into a small
number of finite values or categories.
—– Insert Figure A.3 Variable Distributions. —–
A.6 Increasing Features and Unforeseen Interdependencies
We test and present empirical evidence for the assumption that, as more features are added
to a project, the unforeseen interdependencies will increase, showing a positive relationship
between an increase in the number of features and an increase in unforeseen interdependen-
cies.
We define Features Increase as a binary indicator of whether the entrepreneurs add
Appendix - x

more features for their next projects, which is equal to 1 if the current project has more
features than the prior project and 0 otherwise. We use Features Increase as the main inde-
pendent variable for this analysis and look at the relationship between it and three different
measures of whether the unforeseen interdependencies will increase as dependent variables.
Unforeseen Interdependencies Increase Binary is a binary indicator equal to 1 if the current
project has more updates related to unforeseen interdependencies than the prior project.
Unforeseen Interdependencies Increase Count is equal to the number of additional updates
related to unforeseen interdependencies than the prior project. Unforeseen Interdependencies
Increase IHS takes the inverse hyperbolic spline of Unforeseen Interdependencies Increase
Count in order to account for any potential non-linearities in the relationship and to re-
duce the impact of any outliers. The results of these analyses are shown in Table A.5. We
find a significant and positive relationship between Features Increase and each of our three
measures of increasing unforeseen interdependencies.
—– Insert Table A.5 Features Increase and
Unforeseen Interdependencies. —–
A.7 Non-Linear Effect of Experience
We find empirical evidence for a faster-than-linear increase in unforeseen interdependencies
and delay duration. This empirical evidence suggests that we more than meet the minimum
set of assumptions required by our theory, e.g., the project complexity curve increases faster
than a concave learning curve. Figure 4 of the main manuscript is the visual representation
of the estimates from the regression models we describe next.
We considered several econometric models—–including those that specify a specific
functional form of the relationship–—but we decided that it would be best to remain agnostic
to functional form. Instead, we construct a series of indicator variables representing different
levels of Project Experience that allow us to flexibly and non-parametrically identify the
relationship. This type of specification allows the functional form to “reveal” itself to us
without us having to pre-specify its exact shape.
In place of Project Experience, we include a set of indicator variables. Project Expe-
rience: Second takes a value of 1 if the focal project is the entrepreneur’s second project,
Appendix - xi

and 0 otherwise. Project Experience: Third and Project Experience: Fourth or More follow
similarly. We group together experience for entrepreneurs on their fourth or later project
because the number of observations on these higher levels of experience is quite sparse and
thus noisy; the observed pattern of statistically significant results is robust to the exclusion
of projects that are the entrepreneur’s fifth or later project. Since we omit the indicator
for an entrepreneur’s first project (zero experience), all coefficients on these three indicators
should be interpreted as relative to the scenario of the entrepreneur’s first project. Table 3
and Table 4 are replicated in Table A.6 and Table A.7, respectively, swapping out Project
Experience for this set of indicator variables.
—– Insert Table A.6 Non-Linear Analysis of Complexity and
Unforeseen Interdependencies. —–
—– Insert Table A.7 Non-Linear Analysis of Delivery and Delay. —–
We outline the effects for a subset of the key variables here, with the full results shown
in the regression tables.
A.7.1 Features
All relative to the entrepreneur’s first project, the average entrepreneur’s second project has
0.417 higher feature rank, the third project has an average of 0.541 higher feature rank, and
the fourth or later project has 1.468 higher feature rank. To give an idea of the comparison
across projects, we can look at the difference between these coefficient values, with the second
project having a feature rank 0.417 higher than the first project, the third project having a
feature rank 0.124 higher than the second project, and the fourth or later project having a
feature rank 0.927 higher than the third project. We also look at the same interpretation
for unforeseen interdependencies.
A.7.2 Unforeseen Interdependencies
All relative to the entrepreneur’s first project, the average entrepreneur’s second project
encounters 1.457 more unforeseen interdependencies, the third project encounters an average
of 2.721 more unforeseen interdependencies, and the fourth or later project encounters 4.116
more unforeseen interdependencies. To give an idea of the comparison across projects, we can
look at the difference between these coefficient values, with the second project encountering
Appendix - xii

1.457 more unforeseen interdependencies than the first project, the third project encountering
1.264 more unforeseen interdependencies than the second project, and the fourth or later
project encountering 1.395 more unforeseen interdependencies than the third project.
A.7.3 Delay Duration
All relative to the entrepreneur’s first project, the average entrepreneur’s second project is
delayed by an additional 44.858 days, the third project is delayed by an additional 75.369
days, and the fourth or later project is delayed by an additional 145.106 days. To give an
idea of the comparison across projects, we can look at the difference between these coefficient
values, with the second project delayed by 44.858 more days than the first project, the third
project delayed by 30.511 more days than the second project, and the fourth or later project
delayed by 69.737 more days than the third project.
Furthermore, to provide readers with more intuition on the holistic pattern implied
by the above regression estimates, we generate a visualization of the estimates for the effect
of various levels of project experience on Actual Time and Predicted Time. In some sense,
these variables intuitively map to actual project complexity and predicted project complexity
curves, respectively. Figure 4 of the main manuscript plots the coefficients, with the project
number on the horizontal axis and the Actual Time and Predicted Time (both in days) on
the vertical axes.d This figure shows that the actual delivery time increases much more
sharply relative to the predicted delivery time, with the gap between actual delivery time
and predicted delivery time increasing as entrepreneurs gain experience.
A.8 Prior Campaign Funding and Behavior
A.8.1 Theoretical Background
We explore in depth whether prior campaign funding outcomes impact an entrepreneur’s
behavior on subsequent projects. We do not intend to make any groundbreaking theoretical
claims on this point: our primary goal is to make sure we properly account for and apply
classic behavioral theory on performance feedback and outcome–aspiration gaps (Cyert &
dTo set the level of the omitted coefficient of the entrepreneur’s first project–—and thus the level of all theestimates as they are relative to that baseline—–we calculate the mean value of each variable used in theregression and multiply that average value by the corresponding coefficient. We sum those values and thenadd the mean entrepreneur fixed effect.
Appendix - xiii

March, 1963; Greve, 1998). We apply this theory to product introductions (Joseph & Gaba,
2015). In short, we consider the theoretical argument that when an entrepreneur suffers from
an outcome–aspiration gap in their prior experience—specifically, they suffer from a failed
funding campaign on the previous project—the entrepreneur would have higher risk tolerance
and engage in problemistic search on the next project (Greve, 2003). Assuming that this
feedback is sufficiently unambiguous to trigger the entrepreneur to respond (Joseph & Gaba,
2015), the entrepreneur would take on a project that has a greater likelihood of unforeseen
complexity that could delay the project. As shown in Figure A.4, this relationship can be
visualized as a “V”, where the outcome–aspiration gap is on the x-axis and the accuracy of
strategic foresight is on the y-axis. This “V” shape would manifest if these were a linear
relationship; however, if the relationship is non-linear, we would see more of a “U” shape,
which is also included in the visualization.
—– Insert Figure A.4 Outcome–Aspiration Gap and Accuracy of
Strategic Foresight. —–
Recent research adds additional nuance to the theory that would strengthen the
argument. Keum & Eggers (2018) argue that mangers would set more aggressive aspirations,
like on project complexity and timeline, when facing increased pressure to acquire resources,
like if they feared missing funding targets on the next project because they missed them on
the prior project. Eggers & Kaul (2018) argue that firms over-invest in radical invention
when performance is moderately below aspiration, whereas in our setting a radical invention
would be a radical departure from their previous project (which would add a lot of new
complexity).
A.8.2 Empirical Context
Turning to our specific empirical context, it is quite rare for these serial-project entrepreneurs
to fail in their fundraising efforts. Of the 314 entrepreneurs who completed successful projects
in our sample, only 33 entrepreneurs had previously run a failed funding campaign (10.5%
of entrepreneurs), with 42 failed funding campaigns total out of 782 total funding campaigns
(5.4% of funding campaigns). At a project level, our level of analysis, only 36 (5.0%) out of
722 projects in our sample (i.e., the successful projects) had a failed funding campaign of the
Appendix - xiv
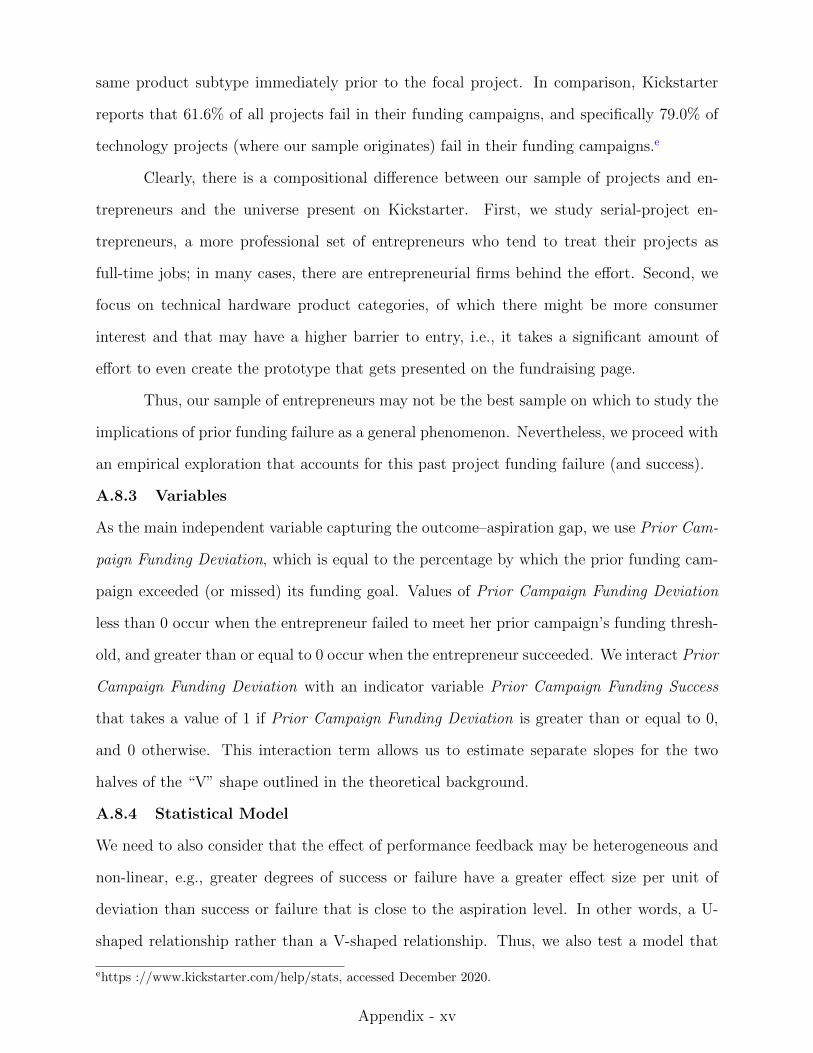
same product subtype immediately prior to the focal project. In comparison, Kickstarter
reports that 61.6% of all projects fail in their funding campaigns, and specifically 79.0% of
technology projects (where our sample originates) fail in their funding campaigns.e
Clearly, there is a compositional difference between our sample of projects and en-
trepreneurs and the universe present on Kickstarter. First, we study serial-project en-
trepreneurs, a more professional set of entrepreneurs who tend to treat their projects as
full-time jobs; in many cases, there are entrepreneurial firms behind the effort. Second, we
focus on technical hardware product categories, of which there might be more consumer
interest and that may have a higher barrier to entry, i.e., it takes a significant amount of
effort to even create the prototype that gets presented on the fundraising page.
Thus, our sample of entrepreneurs may not be the best sample on which to study the
implications of prior funding failure as a general phenomenon. Nevertheless, we proceed with
an empirical exploration that accounts for this past project funding failure (and success).
A.8.3 Variables
As the main independent variable capturing the outcome–aspiration gap, we use Prior Cam-
paign Funding Deviation, which is equal to the percentage by which the prior funding cam-
paign exceeded (or missed) its funding goal. Values of Prior Campaign Funding Deviation
less than 0 occur when the entrepreneur failed to meet her prior campaign’s funding thresh-
old, and greater than or equal to 0 occur when the entrepreneur succeeded. We interact Prior
Campaign Funding Deviation with an indicator variable Prior Campaign Funding Success
that takes a value of 1 if Prior Campaign Funding Deviation is greater than or equal to 0,
and 0 otherwise. This interaction term allows us to estimate separate slopes for the two
halves of the “V” shape outlined in the theoretical background.
A.8.4 Statistical Model
We need to also consider that the effect of performance feedback may be heterogeneous and
non-linear, e.g., greater degrees of success or failure have a greater effect size per unit of
deviation than success or failure that is close to the aspiration level. In other words, a U-
shaped relationship rather than a V-shaped relationship. Thus, we also test a model that
ehttps ://www.kickstarter.com/help/stats, accessed December 2020.
Appendix - xv

enters in a quadratic term for Prior Campaign Funding Deviation, and we interact both the
base term and the quadratic term with Prior Campaign Funding Success to allow estimates
of different “curves” above and below the aspiration level. In theory, this would allow us to
estimate the two halves of a theoretical “U.”
A.8.5 Descriptive Visualization
Before we turn to the regression analysis, we generate descriptive plots of the relationship
between Prior Campaign Funding Deviation and our two main measures of performance: (i)
Delay Percent (defined as Delay Duration divided by Predicted Time) and (ii) Unforeseen
Interdependencies. When generating the plots, we exclude outliers for clarity in visualization,
but all trends and interpretations hold when including outliers. Examining these plots in
Figure A.5 and Figure A.6, we see similar trends in both plots, with a positive slope where
Prior Campaign Funding Deviation is less than zero (though with a very wide confidence
interval given the very limited number of observations) and a flat or very slightly increasing
trend where Prior Campaign Funding Deviation is greater than zero (though again with an
increasingly wide confidence interval moving away from the bulk of the data).
—– Insert Figure A.5 Deviation and Delay. —–
—– Insert Figure A.6 Deviation and Unforeseen Interdependencies. —–
A.8.6 Results
Table A.8 shows this relationship when including controls and fixed effects. Given the
focus on the lagged funding deviation, we exclude first projects where there is no defined
lagged funding deviation. As a result, we also exclude entrepreneur fixed effects which
are not appropriate for entrepreneurs with only a single project after their first project,
leaving no variation within the entrepreneur’s set of projects. As suggested by the visual
evidence, we do not observe any significant relationship between Prior Campaign Funding
Deviation and Delay Percent or Unforeseen Interdependencies. The directionality of the
point estimates matches the visual evidence, with a positive coefficient on Prior Campaign
Funding Deviation, suggesting a positive slope when Prior Campaign Funding Success is
equal to zero (the area to the left of zero on the plots) and then a flat slope when Prior
Campaign Funding Success is equal to one and the coefficients are summed to give a slope
Appendix - xvi

around zero. We also find no significant relationships when including a quadratic term.
—– Insert Table A.8 Deviation and Unforeseen Interdependencies. —–
Given the small sample size of projects that missed their funding goal, we are lim-
ited in our ability to interpret the trend where Prior Campaign Funding Success is equal to
zero. We do have ample data where Prior Campaign Funding Success is greater than zero,
but again we find no significant relationship. One possible explanation is that the impact
of deviation from the funding target on the prior project is overshadowed by the impact of
deviation from the funding target on the current project (which is included as a control). An-
other possible explanation is that Delay Percent and Unforeseen Interdependencies are both
measures of execution and are therefore one step removed from the impacts of fundraising
outcomes.
A.9 Social Comparison
We seek to address potential ambiguity around what could be driving prediction failure in
this setting. If the entrepreneur believes that setting a delivery timeline comparable to her
peers is important to fundraising, the prediction failures could be interpreted as a matter
of entrepreneurs socially informed about their competitive context. To test, and ultimately
rule out, this alternative explanation, we define the entrepreneur’s peer group and then
empirically test the impact of the peer group on the entrepreneur’s predicted time as well as
the impact of deviation from the peer group on ability to fundraise.
A.9.1 Defining Entrepreneur Peer Group
We consider two dimensions when defining an entrepreneur’s peer group that may impact
their behavior through social comparison. First, we define a set of comparable projects the
entrepreneur could reasonably view as competition. At a reductive level, all Kickstarter
projects that are soliciting the same dollars are in competition. The most competitive set of
projects seem to be those within same product subtype, e.g., 3D printing, camera equipment,
wearables. The key assumption we make here is that the entrepreneur perceives that she is
competing with those projects, based on our assumption of the entrepreneur’s assumption
that her customers navigate and search through Kickstarter by product subtype. That said,
based on our interviews, entrepreneurs do not seem to view competition for crowdfunding
Appendix - xvii

as a zero-sum game, given that the vast majority of customer spending is not on Kickstarter
projects and that many backers find their way directly to a project without navigating
through the Kickstarter platform, e.g., by a direct link from an organic social media campaign
or direct-response online advertising.
Second, we define a time window during which the entrepreneur could reasonably have
taken into account comparable projects prior to specifying her prediction for her own product
specification and delivery date. As first order, we should only include projects prior to the
launch of the focal campaign. We decided to include only peer projects that successfully
completed their funding prior to the focal campaign; it seems unlikely the entrepreneur
would benchmark herself against failed funding campaigns. In addition, intuitively it seems
unlikely the entrepreneur would search deeply into the distant past to benchmark herself:
more recent projects likely matter more since they reflect the current state of the market the
entrepreneur would face. We set a threshold of one year, meaning that we only include peer
funding campaigns launched within one year of the focal campaign. In summary, we specify
the entrepreneur’s peer group as the projects within the last year by other entrepreneurs in
the sample that successfully met their funding threshold.
A.9.2 Setting Delivery Time
We consider whether the peer group timeline has an effect on the predicted timeline set by
the entrepreneur. The dependent variable Predicted Time is the time in days between the
end of the fundraising campaign and the predicted delivery date. Using the definition of the
peer group previously explained, the main independent variable Peer Group Predicted Time
is the average Predicted Time across all projects in the focal project’s peer group.f
Results As shown in Table A.9, we find no statistically significant relationship between
Peer Group Predicted Time and Predicted Time. The coefficient and statistical significance
of Project Experience remains consistent. These findings align with our understanding of
how entrepreneurs in our study actually set their project timelines, based on our qualitative
fFor example, one entrepreneur in the sample launched a hardware project on October 11, 2018. His peergroup contains all hardware projects launched prior to October 11, 2018 but after October 11, 2017 (oneyear prior). This defines a set of 11 projects with predicted times ranging from 10 days to 149 days. Takingthe average predicted time across all 11 projects gives a Peer Group Predicted Time of 89 days.
Appendix - xviii

interviews. To summarize our understanding of this process, which is outlined in more detail
in Appendix Section A.3, entrepreneurs seem to be giving their best estimate of how long
they believe the project will actually take—summing the estimated time for each project
component—and then adding some buffer time on top of their best guess at the predicted
time. No entrepreneur in any of our interviews mentioned benchmarking their predicted
time against the predicted time of other projects, or trying to game the predicted time in
any other way.
—– Insert Table A.9 Predicted Time and Peer Group Comparison. —–
A.9.3 Incentive Alignment
We also explore whether the difference between an entrepreneur’s predicted time from the
average predicted timeline of other comparable projects impacts the amount of money the
entrepreneur is able to raise. If estimating a shorter predicted time has pecuniary benefits
in the fundraising process, entrepreneurs would be incentivized to benchmark against their
peer projects. If this is not the case, that would imply that exceeding the funding threshold
would not rely on benchmarking against a social comparison.
In this analysis, and as alluded to above, the main independent variable Peer Group
Deviation is the difference between the Predicted Time of the focal project and the Peer
Group Predicted Time of the focal project. We examine the relationship between Peer
Group Deviation and two measures of exceeding the funding threshold. Funding Exceeded
is equal to dollars raised in the focal project in excess of the Funding Threshold. Funding
Positive Deviation is the percentage by which the funding threshold was exceeded, equal to
Funding Exceeded divided by Funding Threshold. Because Funding Threshold is used in the
derivation of both Funding Exceeded and Funding Positive Deviation, we include regressions
including and excluding it as a control.
Results As shown in Table A.10, we see a mixture of significant and insignificant relation-
ships between Peer Group Deviation and our measures of exceeding the funding threshold.
However, in the cases where the result is significant, the value is small and positive. This
would suggest that entrepreneurs would be incentivized to give themselves slightly more time
than the average among their peers, which is the exact opposite of the narrative that increas-
Appendix - xix

ing delays are due to pressure to predict shorter delivery times relative to the peer group.
Together, these regressions provide insignificant or contradictory evidence of the alternative
explanation.
—– Insert Table A.10 Funding and Peer Group Comparison. —–
While entrepreneurs are incentivized to maximize funds raised, they also recognize
and experience real pecuniary consequences for failing to meet their predicted time, as out-
lined in Appendix Section A.10. As a result, even if there were some benefits to predicting
shorter delivery times, entrepreneurs that we interviewed seemed unwilling to make the
tradeoff of estimating a shorter delivery time now with the expectation to need to delay
later. For example, one notes that, “Whatever goodwill you built up beforehand, it’s like so
discounted by the time you have to announce delays” (TabletCo CEO).
A.10 Learning That Delay Is “Acceptable”
To test whether entrepreneurs could learn that a delay is acceptable, we need to test whether
entrepreneurs face consequences for delay. Li & Martin (2019) study this exact question in
the Kickstarter context. Specifically, they look at the impact of failing to meet predictions on
the entrepreneur’s reputation and subsequent ability to raise money. Importantly, they find
that, all else equal, if an entrepreneur defaults on what they promised, the probability that
they reach their funding goal on their subsequent project drops by 50%. The key mechanism
for reputation formation is the project comments left by investors. As a result, they conclude
that “entrepreneurs likely have incentives to deliver the product or service they promised as
long as the backers have the ability to provide product/service feedback to the public.”
Given that public comments are a demonstrated mechanism for reputation formation
and, as a result, present real, pecuniary consequences to the entrepreneur, we empirically
measure the relationship between delay and public comments in our sample. Specifically,
we find a positive relationship between Delay Duration and both Total Comments (p ∼
0.002) and Negative Comments (p = 0.000). To calculate comment sentiment, we use a
standard R package (Rinker, 2019) to calculate the sentiment of each of the most recent 100
project comments (excluding comments by the entrepreneur). We then sum the number of
negative comments for each project. As summarized in Table A.11, for each additional day
Appendix - xx
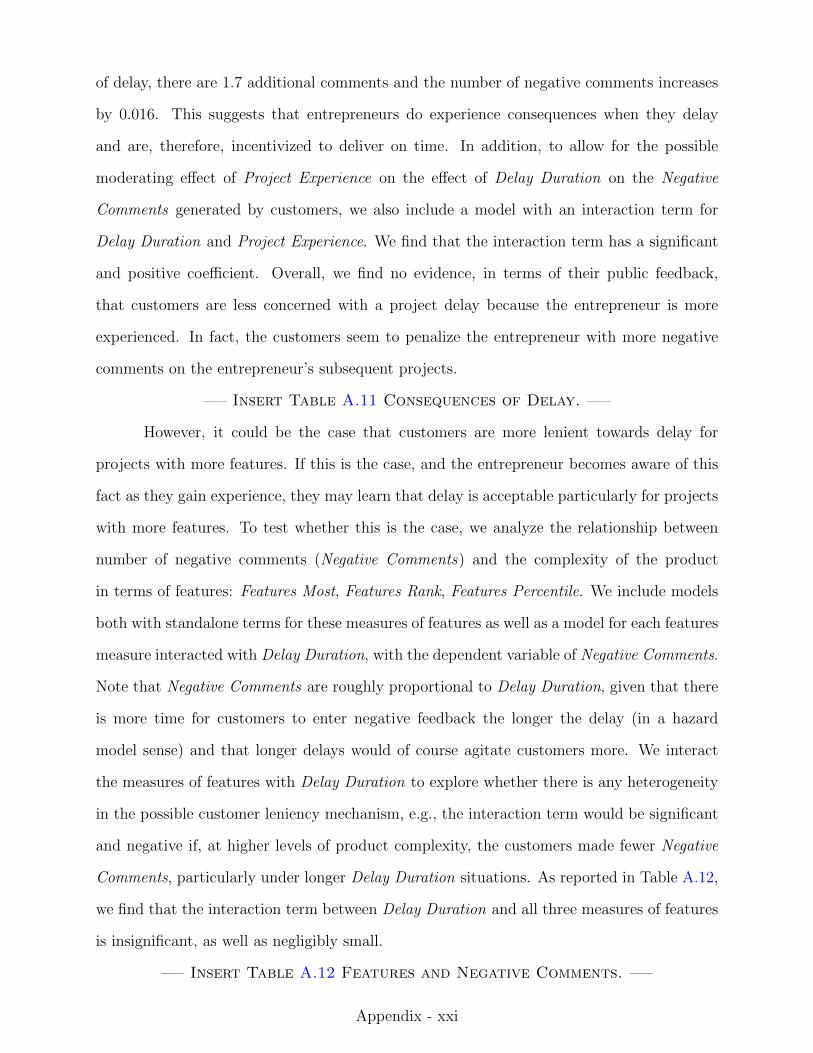
of delay, there are 1.7 additional comments and the number of negative comments increases
by 0.016. This suggests that entrepreneurs do experience consequences when they delay
and are, therefore, incentivized to deliver on time. In addition, to allow for the possible
moderating effect of Project Experience on the effect of Delay Duration on the Negative
Comments generated by customers, we also include a model with an interaction term for
Delay Duration and Project Experience. We find that the interaction term has a significant
and positive coefficient. Overall, we find no evidence, in terms of their public feedback,
that customers are less concerned with a project delay because the entrepreneur is more
experienced. In fact, the customers seem to penalize the entrepreneur with more negative
comments on the entrepreneur’s subsequent projects.
—– Insert Table A.11 Consequences of Delay. —–
However, it could be the case that customers are more lenient towards delay for
projects with more features. If this is the case, and the entrepreneur becomes aware of this
fact as they gain experience, they may learn that delay is acceptable particularly for projects
with more features. To test whether this is the case, we analyze the relationship between
number of negative comments (Negative Comments) and the complexity of the product
in terms of features: Features Most, Features Rank, Features Percentile. We include models
both with standalone terms for these measures of features as well as a model for each features
measure interacted with Delay Duration, with the dependent variable of Negative Comments.
Note that Negative Comments are roughly proportional to Delay Duration, given that there
is more time for customers to enter negative feedback the longer the delay (in a hazard
model sense) and that longer delays would of course agitate customers more. We interact
the measures of features with Delay Duration to explore whether there is any heterogeneity
in the possible customer leniency mechanism, e.g., the interaction term would be significant
and negative if, at higher levels of product complexity, the customers made fewer Negative
Comments, particularly under longer Delay Duration situations. As reported in Table A.12,
we find that the interaction term between Delay Duration and all three measures of features
is insignificant, as well as negligibly small.
—– Insert Table A.12 Features and Negative Comments. —–
Appendix - xxi

Our interviews with entrepreneurs confirm these findings. One entrepreneur notes,
“There is definitely some pressure to deliver things on time...There definitely is pressure
making sure things are right, making sure you don’t have to take additional steps” (Cir-
cuitsCo CEO). And entrepreneurs do believe that there are consequences to delay: “[When
a project gets delayed,] people really bash the product on review channels and pages and
the comments section” (TabletCo CEO). Or, in the words of another, ”[When a project gets
delayed,] you get angry people. For us, image and branding is the most important thing,
and you want to strive to deliver a really good product....and it does hurt your image when
people are saying you’re delayed” (GPSCo CEO).
As an additional test for whether entrepreneurs continue to care about their image
and the impact of negative comments (which are driven by delays), we look at whether
entrepreneurs reduce the effort and care they put into customers over time. Specifically, we
define a new variable, Creator Engagement, which is the total word count of the updates and
comments posted by the entrepreneur on a given project. As shown in Table A.13, we find
that there is a significant and positive relationship between Creator Engagement and Project
Experience, indicating that entrepreneurs are posting and engaging with their backers more
on each subsequent project. This suggests that there is no evidence in terms of their public
engagement that entrepreneurs are less concerned with pleasing their customer base and
defending their public reputation. In fact, the empirical evidence in our setting suggests
the opposite. Again, the qualitative evidence aligns. TabletCo CEO described how even on
his most recent project, he would “have people monitor the customer comments around the
clock...to feed into consumer confidence.”
—– Insert Table A.13 Creator Engagement. —–
A.11 Incentive to Overpromise
Despite facing consequences for delay, it could be the case that the ex post consequences
are offset by ex ante benefits. While making unrealistic predictions likely leads to negative
consequences down the road when entrepreneurs fail to meet those predictions, if making
aggressive predictions is helpful in the fundraising process entrepreneurs may still be incen-
tivized to overpromise. We construct dependent variables for the amount of money raised
Appendix - xxii

in total and the amount of money raised in excess of the fundraising goal. We regress these
dependent variables on an independent variable of the predicted delivery time. If there was
a benefit to overpromising, we would expect to see a negative relationship here, with an
increase in promised delivery time decreasing the amount of funds raised. As shown in Table
A.14, we do not find a statistically significant relationship, suggesting that there is no general
incentive to make unrealistic predictions for the sake of upfront financing.g This is of course
peculiar given the assumed desire of customers to get their products faster, but customers
may mentally discount aggressive delivery times because they know they are unrealistic and
thus not place any value on them. Overall, we contend that overpromising aggressive delivery
times is not the major driver of the main findings.
—– Insert Table A.14 Incentive to Overpromise. —–
A.12 Exiting After VC Financing
We then turn to whether certain types of entrepreneurs are exiting our sample, looking first
at whether entrepreneurs are more likely to exit the sample after raising external capital
from another source (generally an indicator of higher quality or ability). We test whether
high-quality entrepreneurs might exit the sample. In particular, we test the assumption that
these higher-quality entrepreneurs may desire and be able to raise venture capital financing
and leave crowdfunding. We define a binary indicator of whether the entrepreneur goes on to
do a subsequent project as the dependent variable. For projects completed towards the end
of our sample timeline, it is unclear whether the entrepreneur has truly exited the sample
or is in the process of preparing another campaign. As such, we drop the projects from the
last year of our sample when performing this analysis. We then regress the binary indicator
of going on to do a subsequent project on a binary indicator of whether the entrepreneur
has raised external capital at that time. As shown in Table A.15, we find that raising
venture funding does not impact whether entrepreneurs exit the sample or continue on and
do another Kickstarter project.
gWe recognize that the product specification is likely correlated with both the predicted time and the fundsraised (e.g., really fancy product specifications have longer predicted times, but also raise more money).We include Features Most in the regression to try to serve as a proxy for the product specification; however,given that this is an imprecise measure of product specification there is likely still some omitted variablebias. The results are similar if we include Features Ranks or Features Percentile as controls.
Appendix - xxiii
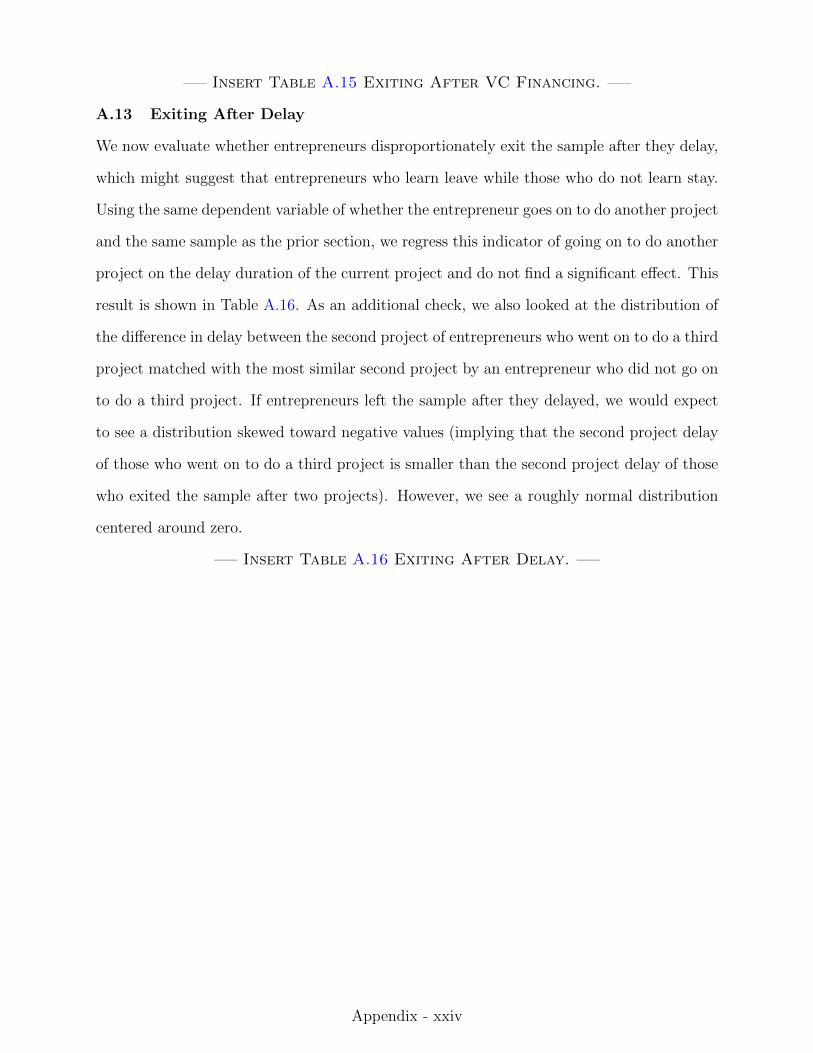
—– Insert Table A.15 Exiting After VC Financing. —–
A.13 Exiting After Delay
We now evaluate whether entrepreneurs disproportionately exit the sample after they delay,
which might suggest that entrepreneurs who learn leave while those who do not learn stay.
Using the same dependent variable of whether the entrepreneur goes on to do another project
and the same sample as the prior section, we regress this indicator of going on to do another
project on the delay duration of the current project and do not find a significant effect. This
result is shown in Table A.16. As an additional check, we also looked at the distribution of
the difference in delay between the second project of entrepreneurs who went on to do a third
project matched with the most similar second project by an entrepreneur who did not go on
to do a third project. If entrepreneurs left the sample after they delayed, we would expect
to see a distribution skewed toward negative values (implying that the second project delay
of those who went on to do a third project is smaller than the second project delay of those
who exited the sample after two projects). However, we see a roughly normal distribution
centered around zero.
—– Insert Table A.16 Exiting After Delay. —–
Appendix - xxiv

Appendix ReferencesCyert, R. M. & March, J. G. (1963). A behavioral theory of the firm. Englewood Cliffs, NJ:
Prentice-Hall.Eggers, J. P. & Kaul, A. (2018). Motivation and ability? A behavioral perspective on the
pursuit of radical invention in multi-technology incumbents. Academy of ManagementJournal, 61(1), 67–93.
Greve, H. R. (1998). Performance, aspirations, and risky organizational change. Adminis-trative Science Quarterly, 43(1), 58–86.
Greve, H. R. (2003). A behavioral theory of R&D expenditures and innovations: Evidencefrom shipbuilding. Academy of Management Journal, 46(6), 685–702.
Joseph, J. & Gaba, V. (2015). The fog of feedback: Ambiguity and firm responses to multipleaspiration levels. Strategic Management Journal, 36(13), 1960–1978.
Kauffman, S. A. (1995). At home in the universe. New York: Oxford University Press.Keum, D. D. & Eggers, J. P. (2018). Setting the bar: The evaluative and allocative roles of
organizational aspirations. Organization Science, 29(6), 1170–1186.Li, E. & Martin, J. S. (2019). Capital formation and financial intermediation: The role of
entrepreneur reputation formation. Journal of Corporate Finance, 59, 185–201.Rinker, T. W. (2019). {sentimentr}: Calculate text polarity sentiment. GitHub Repository.Sommer, S. C. & Loch, C. H. (2004). Selectionism and learning in projects with complexity
and unforeseeable uncertainty. Management Science, 50(10), 1334–1347.
Appendix - xxv

Ringo Robot Spirit Rover
Figure A.1: Plum Geek Robotics Product Features. Reproduction of breakdowns of product featuresprovided by Plum Geek Robotics on its company website. Ringo Robot was its first Kickstarter project,launched on February 25, 2015. The Spirit Rover was its third project, launched on September 28, 2016.
Appendix - xxvi

Low Complexity High Complexity
Components ComponentsMetal casing NozzleLeft bevel Printing bedWrench cutout Heating apparatusWritten measurements Camera
LED lightsColor touchscreenBearing spool holderCasingPower cordsCircuit boardSoftware operating system
Interdependencies to be Addressed Interdependencies to be AddressedMetal casing dimensions match specified mea-surements.
Only subset included for heating apparatus,bearing spool holder, and casing.
Metal casing will fit in the machine that addsthe measurements.
Power supply is sufficient for heating appara-tus, camera, LEDs, touch screen, etc.
Writing color will show up and adhere to themetal surface.
Bearing spool holder can hold weight of spooland remains balanced with added weight.
Separate machine can accommodate metalcasing to add left bevel.
Heating mechanism does not impair functionof screen or other electronics.
Separate machine can accommodate metalcasing to add wrench hole.
Heating apparatus creates correct tempera-ture for input material.
Intended functions of the metal casing are notimpaired by cutout wrench hole.
Casing accommodates LED lights, printingbed, nozzle, touch screen, etc.
Upper ruler cutout does not fall off or weakenthe tool’s structural integrity.
Casing provides appropriate spacing betweencamera and printing bed for optimal focus.Casing allows nozzle sufficient range of motionwhen printing.Bearing spool holder fits the input material.Bearing spool holder attaches to casing.
Figure A.2: Project Complexity Examples. Selected projects from sample to illustrate a typical“low” complexity and “high” complexity project. Components (or modules) and Interdependencies to beAddressed represent only those confirmed by the researchers and likely constitute only a subset of thoseactually faced by the entrepreneurs. In the context of the NK model, the separate components represent N,and Interdependencies to be Addressed represent (an observable subset of) K.
Appendix - xxvii

0
100
200
300
0 1 2 3 4 5Project Experience
Cou
nt
0.0
0.1
0.2
0.3
0 25 50 75Prior Campaign Funding Deviation
Den
sity
0
200
400
600
0 1 2 3 4Failed Campaign Experience
Cou
nt
0.0
0.5
1.0
1.5
2.0
0 3 6 9Prior Project Delay
Den
sity
0
200
400
600
0 1Execution Overlap
Cou
nt
0
200
400
600
0 1External Financing
Cou
nt
0
200
400
600
0 1New Category
Cou
nt
0.0000
0.0005
0.0010
0.0015
0 500 1000 1500 2000 2500Elapsed Time
Den
sity
0.000
0.025
0.050
0.075
0.100
0 20 40 60Funding Period
Den
sity
0.000
0.025
0.050
0.075
0 10 20 30Funding Reward Tiers
Den
sity
0.000
0.001
0.002
0.003
0.004
0 2000 4000 6000Funding Reward Size
Den
sity
0.00
0.01
0.02
0.03
0 100 200Funding Threshold
Den
sity
0.000
0.003
0.006
0.009
0.012
0 1000 2000 3000Funding Exceeded
Den
sity
0.00
0.25
0.50
0.75
1.00
0 10 20Funding Backers
Den
sity
0.000
0.025
0.050
0.075
0 10 20 30 40Baseline Updates
Den
sity
Figure A.3: Variable Distributions. Visualizations of the distributions of independent variables, withdensity plots for continuous measures and histograms for those with finite discrete values.
Acc
urac
y of
Str
ateg
ic F
ores
ight
Miss Past Funding Exceed Past FundingOn Target
Figure A.4: Outcome–Aspiration Gap and Accuracy of Strategic Foresight. In our context, weoperationalize the accuracy of strategic foresight as Unforeseen Interdependencies and Delay Duration.
Appendix - xxviii

0
2
4
6
−100%0% 500% 1 000% 1 500% 2 000% 2 500%Prior Campaign Funding Deviation
Del
ay P
erce
nt
Figure A.5: Deviation and Delay. The binned scatter and linear fit to the left of 0% Prior CampaignFunding Deviation show the relationship with Delay Percent on the current project and the extent to whichthe entrepreneur failed to meet her funding threshold on the prior project. To the right, they show the samerelationship but for the extent to which the entrepreneur met or exceeded her funding threshold on the priorproject.
0
5
10
−100%0% 500% 1 000% 1 500% 2 000% 2 500%Prior Campaign Funding Deviation
Unf
ores
een
Inte
rdep
ende
ncie
s
Figure A.6: Deviation and Unforeseen Interdependencies. The binned scatter and linear fit to theleft of 0% Prior Campaign Funding Deviation show the relationship with Unforeseen Interdependencies onthe current project and the extent to which the entrepreneur failed to meet her funding threshold on theprior project. To the right, they show the same relationship but for the extent to which the entrepreneurmet or exceeded her funding threshold on the prior project.
Appendix - xxix

Table A.1: Qualitative Interview Sample. Indexed set of interviewed entrepreneurs. All interviewslasted 30 to 45 minutes and were conducted between January 29, 2020 and June 24, 2020.
Entrepreneur Product Subtype Location Location Type
1 3DPrintCo CEO 3D Printing Spicer, MN Town2 AccessoryCo CEO Hardware Izhevsk, Russia Town3 CircuitsCo CEO DIY Electronics North Sydney, AU Suburb4 ElectronicsCo CEO DIY Electronics Preston, UK Suburb5 GPSCo CEO Gadgets Seattle, WA Town6 LEGOCo CEO Hardware London, UK Town7 MaskCo CEO Wearables Montreal, Canada Town8 MusicCo CEO Sound Austin, TX Town9 SecureCo CEO Hardware Dublin, Ireland Town10 TabletCo CEO Hardware Beijing, China Town11 WidgetsCo CEO DIY Electronics Boulder, CO Town
Table A.2: Qualitative Interview Sample Summary Statistics. Indexed set of interviewed en-trepreneurs. All values are averaged across all the projects in the sample by the individual entrepreneur.Funding Threshold, Funding Exceeded, and Funding Backers are all in thousands.
Funding Funding Funding Unforeseen Delay Predicted ActualThreshold Exceeded Backers Interdependencies Duration Time Time
1 12.5 22 0.1 5.0 33.6 96.8 130.42 230.0 504 3.9 14 381.9 148.3 530.23 1.1 12 0.5 3.5 27.8 89.5 117.34 3.1 14 0.5 1.0 3.7 51.8 55.55 10.0 145 2.3 3.0 37.0 59.0 96.06 76.4 128 1.1 4.5 154.5 79.6 234.17 8.6 165 3.3 1.0 53.5 91.7 145.28 42.5 108 0.9 3.5 128.7 107.4 236.19 86.7 121 0.5 4.0 359.5 165.6 525.110 75.0 929 11.6 2.0 14.0 51.9 65.911 8.2 25 0.3 0.5 4.9 112.3 117.2
Table A.3: Project Reviewer Backgrounds. Education and experience backgrounds of each of the fiveindividuals hired to rank each entrepreneur’s set of projects according to number of features.
Reviewer Education ExperienceReviewer 1 MBA graduate with additional technical masters 12 years experience in computer programmingReviewer 2 College degree in engineering Career working at robotics companyReviewer 3 College degree in business or engineering 2+ years work experience in consulting, banking, or engineeringReviewer 4 Mechanical engineering and computer science Freelance web designReviewer 5 Senior in high school Experience in VC diligence and health technology
Appendix - xxx
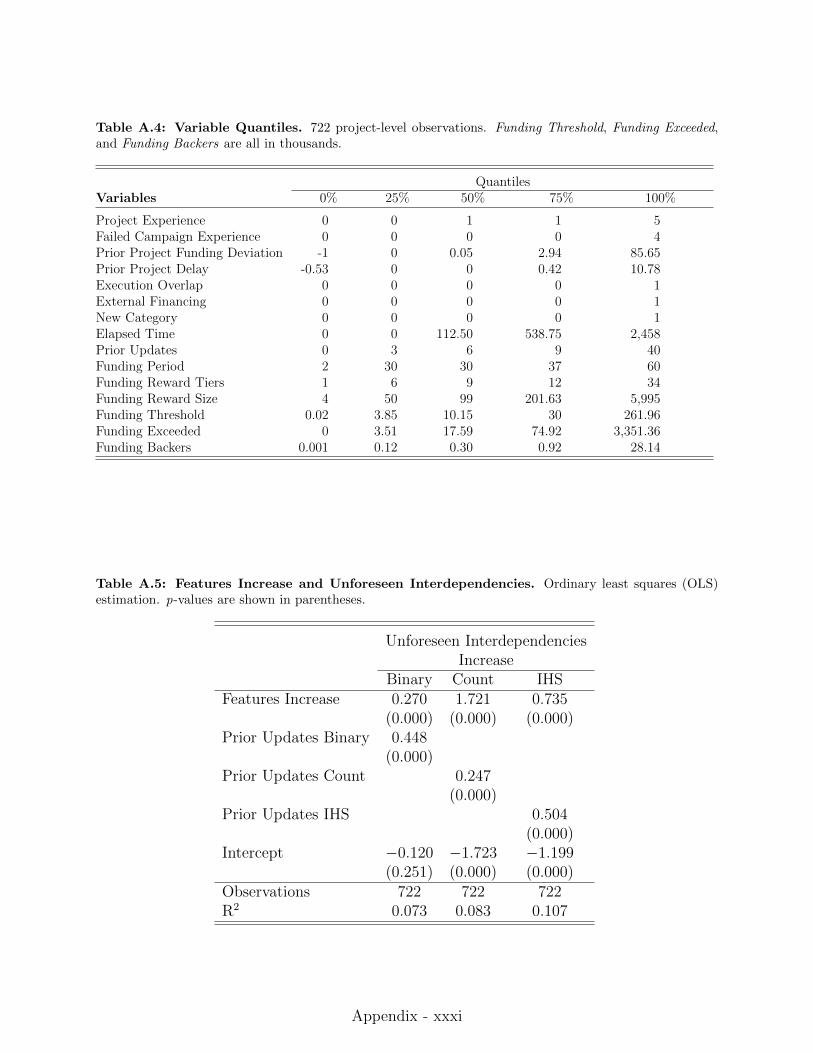
Table A.4: Variable Quantiles. 722 project-level observations. Funding Threshold, Funding Exceeded,and Funding Backers are all in thousands.
QuantilesVariables 0% 25% 50% 75% 100%
Project Experience 0 0 1 1 5Failed Campaign Experience 0 0 0 0 4Prior Project Funding Deviation -1 0 0.05 2.94 85.65Prior Project Delay -0.53 0 0 0.42 10.78Execution Overlap 0 0 0 0 1External Financing 0 0 0 0 1New Category 0 0 0 0 1Elapsed Time 0 0 112.50 538.75 2,458Prior Updates 0 3 6 9 40Funding Period 2 30 30 37 60Funding Reward Tiers 1 6 9 12 34Funding Reward Size 4 50 99 201.63 5,995Funding Threshold 0.02 3.85 10.15 30 261.96Funding Exceeded 0 3.51 17.59 74.92 3,351.36Funding Backers 0.001 0.12 0.30 0.92 28.14
Table A.5: Features Increase and Unforeseen Interdependencies. Ordinary least squares (OLS)estimation. p-values are shown in parentheses.
Unforeseen InterdependenciesIncrease
Binary Count IHSFeatures Increase 0.270 1.721 0.735
(0.000) (0.000) (0.000)Prior Updates Binary 0.448
(0.000)Prior Updates Count 0.247
(0.000)Prior Updates IHS 0.504
(0.000)Intercept −0.120 −1.723 −1.199
(0.251) (0.000) (0.000)Observations 722 722 722R2 0.073 0.083 0.107
Appendix - xxxi

Table A.6: Non-Linear Analysis of Complexity and Unforeseen Interdependencies. Ordinaryleast squares (OLS) estimation. Robust standard errors are clustered at the entrepreneur level. p-values areshown in parentheses.
Features Features Features Unforeseen Ln UnforeseenMost Rank Percentile Interdependencies Interdependencies
Project Experience: Second 0.266 0.417 0.302 1.457 0.270(0.001) (0.000) (0.000) (0.000) (0.001)
Project Experience: Third 0.188 0.541 0.234 2.721 0.420(0.133) (0.011) (0.048) (0.000) (0.002)
Project Experience: Fourth or More 0.508 1.468 0.457 4.116 0.738(0.024) (0.000) (0.026) (0.000) (0.003)
Failed Campaign Experience 0.091 0.184 0.103 0.632 0.184(0.432) (0.214) (0.291) (0.086) (0.056)
Prior Campaign Funding Deviation −0.001 0.000 −0.002 0.003 −0.001(0.831) (0.984) (0.653) (0.888) (0.740)
Prior Project Delay −0.004 −0.038 −0.015 −0.710 −0.133(0.917) (0.475) (0.665) (0.000) (0.000)
Execution Overlap −0.440 −0.488 −0.412 −0.295 0.063(0.005) (0.012) (0.006) (0.651) (0.591)
External Financing 0.332 0.244 0.321 1.087 0.135(0.010) (0.113) (0.011) (0.336) (0.559)
New Category −0.013 0.179 0.075 1.686 0.272(0.937) (0.450) (0.663) (0.074) (0.211)
Elapsed Time −0.000 0.000 −0.000 0.004 0.001(0.435) (0.900) (0.776) (0.009) (0.000)
Funding Period 0.005 0.008 0.005 0.028 0.006(0.228) (0.141) (0.158) (0.189) (0.196)
Funding Reward Tiers 0.007 0.008 0.008 −0.024 −0.004(0.345) (0.505) (0.254) (0.502) (0.634)
Funding Reward Size 0.000 0.000 0.000 −0.000 0.000(0.002) (0.000) (0.001) (0.796) (0.814)
Ln Funding Threshold 0.035 0.043 0.028 0.745 0.156(0.429) (0.424) (0.503) (0.004) (0.000)
Ln Funding Exceeded 0.679 0.080(0.008) (0.093)
Ln Funding Backers −0.032 0.069(0.929) (0.299)
Baseline Updates 0.175(0.001)
Ln Baseline Updates 0.283(0.000)
Entrepreneur FE Yes Yes Yes Yes YesProduct Subtype FE Yes Yes Yes Yes YesYear FE Yes Yes Yes Yes YesMonth FE Yes Yes Yes Yes YesR2 0.301 0.442 0.299 0.745 0.775Entrepreneurs 314 314 314 314 314Observations 722 722 722 722 722
Appendix - xxxii

Table A.7: Non-Linear Analysis of Delivery and Delay. Ordinary least squares (OLS) estimation.Robust standard errors are clustered at the entrepreneur level. p-values are shown in parentheses.
Delay Delay Delay Predicted ActualIndicator Duration Percent Time Time
Project Experience: Second 0.115 44.858 0.717 6.082 49.112(0.038) (0.003) (0.000) (0.151) (0.004)
Project Experience: Third 0.262 75.369 1.109 18.816 89.149(0.013) (0.006) (0.001) (0.010) (0.004)
Project Experience: Fourth or More 0.362 145.106 1.581 30.063 169.153(0.010) (0.002) (0.001) (0.028) (0.001)
Failed Campaign Experience 0.134 −5.134 −0.053 14.622 7.842(0.132) (0.766) (0.810) (0.047) (0.739)
Prior Campaign Funding Deviation −0.003 0.034 −0.004 0.127 0.361(0.074) (0.939) (0.620) (0.450) (0.464)
Prior Project Delay −0.041 −21.968 −0.129 4.629 −19.659(0.050) (0.023) (0.640) (0.021) (0.037)
Execution Overlap −0.050 8.015 1.124 −3.411 6.427(0.474) (0.839) (0.248) (0.687) (0.883)
External Financing 0.140 91.972 0.317 22.198 121.857(0.198) (0.254) (0.548) (0.358) (0.217)
New Category 0.086 41.691 0.477 5.572 48.525(0.596) (0.109) (0.091) (0.576) (0.149)
Elapsed Time −0.000 −0.096 −0.001 −0.022 −0.112(0.448) (0.100) (0.285) (0.271) (0.078)
Funding Period 0.009 1.272 0.003 0.190 1.739(0.000) (0.072) (0.899) (0.448) (0.023)
Funding Reward Tiers 0.003 0.765 0.000 −0.165 0.968(0.479) (0.489) (0.989) (0.692) (0.459)
Funding Reward Size 0.000 −0.011 0.000 0.005 −0.009(0.792) (0.707) (0.680) (0.525) (0.814)
Ln Funding Threshold 0.006 22.322 −0.081 19.326 40.085(0.842) (0.107) (0.582) (0.000) (0.011)
Ln Funding Exceeded 0.035 29.877 0.205 29.323(0.194) (0.003) (0.081) (0.010)
Ln Funding Backers 0.007 −35.697 −0.183 −33.133(0.852) (0.006) (0.265) (0.031)
Entrepreneur FE Yes Yes Yes Yes YesProduct Subtype FE Yes Yes Yes Yes YesYear FE Yes Yes Yes Yes YesMonth FE Yes Yes Yes Yes YesR2 0.663 0.719 0.657 0.753 0.738Entrepreneurs 306 303 303 314 303Observations 686 644 644 722 644
Appendix - xxxiii

Table A.8: Funding Deviation and Performance. Ordinary least squares (OLS) estimation. Robuststandard errors are clustered at the entrepreneur level. p-values are shown in parentheses.
Delay UnforeseenPercent Interdependencies
Prior Campaign Funding Deviation 0.519 −7.227 1.249 5.071(0.569) (0.356) (0.468) (0.498)
Prior Project Funding Success −0.110 1.665 0.991 0.108(0.898) (0.247) (0.420) (0.954)
Prior Campaign Funding Deviation × Prior Project Funding Success −0.524 7.238 −1.260 −5.010(0.565) (0.356) (0.465) (0.503)
Prior Campaign Funding Deviation2 −6.814 3.835(0.351) (0.572)
Prior Campaign Funding Deviation2 × Prior Project Funding Success 6.814 −3.836(0.351) (0.572)
Project Experience −0.045 −0.037 −0.106 −0.136(0.806) (0.841) (0.769) (0.713)
Failed Campaign Experience 0.081 0.135 0.647 0.651(0.736) (0.580) (0.230) (0.228)
Prior Project Delay 0.662 0.663 0.193 0.203(0.023) (0.022) (0.238) (0.222)
Execution Overlap 1.431 1.427 0.734 0.765(0.210) (0.213) (0.168) (0.155)
External Financing −0.238 −0.264 0.917 0.799(0.550) (0.500) (0.167) (0.228)
New Category −0.765 −0.640 2.876 3.213(0.196) (0.263) (0.100) (0.072)
Elapsed Time −0.000 −0.000 0.000 0.000(0.277) (0.285) (0.987) (0.955)
Funding Period 0.012 0.012 0.003 0.005(0.343) (0.328) (0.875) (0.790)
Funding Reward Tiers 0.008 0.009 0.077 0.083(0.565) (0.515) (0.053) (0.042)
Funding Reward Size 0.000 0.000 0.000 0.000(0.303) (0.309) (0.618) (0.630)
Ln Funding Threshold −0.069 −0.065 0.762 0.761(0.440) (0.473) (0.000) (0.000)
Product Subtype FE Yes Yes Yes YesYear FE Yes Yes Yes YesMonth FE Yes Yes Yes YesR2 0.205 0.206 0.262 0.271Sample 2+ Proj 2+ Proj 2+ Proj 2+ ProjObservations 342 342 402 402
Appendix - xxxiv

Table A.9: Predicted Time and Peer Group Comparison. Ordinary least squares (OLS) estimation.Robust standard errors are clustered at the entrepreneur level. p-values are shown in parentheses.
Predicted TimeProject Experience 7.671
(0.031)Peer Group Predicted Time 0.042
(0.736)Failed Campaign Experience 18.161
(0.030)Prior Campaign Funding Deviation 0.169
(0.304)Prior Project Delay 4.035
(0.028)Execution Overlap −4.249
(0.608)External Financing 14.281
(0.589)New Category 9.998
(0.310)Elapsed Time −0.017
(0.435)Funding Period 0.229
(0.356)Funding Reward Tiers −0.089
(0.834)Funding Reward Size 0.004
(0.583)Ln Funding Threshold 19.965
(0.000)Entrepreneur FE YesProduct Subtype FE YesYear FE YesMonth FE YesR2 0.757Entrepreneurs 314Observations 712
Appendix - xxxv

Table A.10: Funding and Peer Group Comparison. Ordinary least squares (OLS) estimation. Robuststandard errors are clustered at the entrepreneur level. p-values are shown in parentheses.
Ln Funding Funding PositiveExceeded Deviation
Peer Group Deviation 0.002 0.002 0.019 −0.002(0.131) (0.085) (0.013) (0.822)
Project Experience 0.045 0.049 1.792 1.394(0.668) (0.644) (0.009) (0.053)
Prior Campaign Funding Deviation −0.155 −0.167 −2.693 −1.204(0.306) (0.262) (0.002) (0.100)
Failed Campaign Experience −0.024 −0.024 −0.422 −0.449(0.000) (0.000) (0.000) (0.000)
Prior Project Delay 0.039 0.037 0.132 0.367(0.498) (0.525) (0.622) (0.189)
Execution Overlap −0.363 −0.376 0.645 2.313(0.113) (0.094) (0.638) (0.190)
External Financing 0.835 0.838 2.277 1.914(0.286) (0.282) (0.264) (0.327)
New Category −0.098 −0.110 0.783 2.279(0.739) (0.709) (0.606) (0.258)
Elapsed Time 0.001 0.001 0.001 0.003(0.417) (0.417) (0.834) (0.677)
Funding Period 0.016 0.016 0.094 0.067(0.002) (0.002) (0.004) (0.047)
Funding Reward Tiers 0.030 0.031 0.126 0.019(0.036) (0.030) (0.103) (0.818)
Funding Reward Size 0.000 0.000 0.002 0.000(0.219) (0.195) (0.040) (0.897)
Ln Funding Threshold 0.032 −4.043(0.671) (0.000)
Entrepreneur FE Yes Yes Yes YesProduct Subtype FE Yes Yes Yes YesYear FE Yes Yes Yes YesMonth FE Yes Yes Yes YesR2 0.850 0.850 0.813 0.783Entrepreneurs 314 314 314 314Observations 712 712 712 712
Appendix - xxxvi

Table A.11: Consequences of Delay. Ordinary least squares (OLS) estimation. Robust standard errorsare clustered at the entrepreneur level and are shown in parentheses. p-values are shown in parentheses.
Total NegativeComments Comments
Delay Duration 1.710 0.016 0.007(0.002) (0.000) (0.197)
Project Experience 0.145(0.846)
Delay Duration × Project Experience 0.011(0.022)
Failed Campaign Experience 55.540 1.479 1.896(0.572) (0.144) (0.065)
Prior Campaign Funding Deviation −4.176 −0.005 −0.004(0.491) (0.933) (0.955)
Prior Project Delay 23.430 0.951 0.621(0.319) (0.008) (0.067)
Execution Overlap −377.799 −1.741 −3.133(0.143) (0.201) (0.024)
External Financing −518.389 4.748 4.202(0.041) (0.202) (0.251)
New Category −150.405 −1.322 −1.031(0.191) (0.510) (0.614)
Elapsed Time −0.632 0.006 0.003(0.086) (0.052) (0.356)
Funding Period −1.006 0.047 0.058(0.834) (0.382) (0.279)
Funding Reward Tiers −6.520 −0.190 −0.205(0.365) (0.042) (0.022)
Funding Reward Size −0.174 −0.004 −0.004(0.048) (0.025) (0.026)
Ln Funding Threshold −43.482 0.735 0.713(0.415) (0.184) (0.191)
Ln Funding Exceeded 151.209 −0.039 −0.023(0.046) (0.952) (0.971)
Ln Funding Backers 283.235 5.226 5.258(0.015) (0.000) (0.000)
Baseline Updates −12.661 0.087 0.080(0.153) (0.402) (0.448)
Entrepreneur FE Yes Yes YesProduct Subtype FE Yes Yes YesYear FE Yes Yes YesMonth FE Yes Yes YesR2 0.779 0.857 0.860Entrepreneurs 303 303 303Observations 644 644 644
Appendix - xxxvii

Table A.12: Features and Negative Comments. Ordinary least squares (OLS) estimation. Robuststandard errors are clustered at the entrepreneur level. p-values are shown in parentheses.
Negative CommentsFeatures Most 0.537 1.436
(0.441) (0.071)Features Rank 0.597 1.236
(0.181) (0.028)Features Percentile 0.722 1.729
(0.309) (0.029)Delay Duration 0.016 0.018 0.017
(0.019) (0.062) (0.015)Features Most × Delay Duration −0.002
(0.849)Features Rank × Delay Duration −0.001
(0.743)Features Percentile × Delay Duration −0.003
(0.706)Project Experience 2.221 2.063 2.184 0.501 0.213 0.428
(0.059) (0.078) (0.063) (0.585) (0.812) (0.640)Failed Campaign Experience 1.522 1.461 1.504 −0.042 −0.285 −0.182
(0.532) (0.549) (0.539) (0.970) (0.803) (0.873)Prior Campaign Funding Deviation −0.126 −0.126 −0.126 −0.106 −0.107 −0.106
(0.115) (0.115) (0.116) (0.170) (0.164) (0.172)Prior Project Delay 0.994 1.020 0.998 1.019 1.071 1.034
(0.103) (0.095) (0.103) (0.036) (0.027) (0.033)Execution Overlap −5.064 −4.993 −5.016 −2.685 −2.623 −2.622
(0.006) (0.006) (0.006) (0.101) (0.123) (0.104)External Financing 7.285 7.313 7.219 5.528 5.645 5.596
(0.039) (0.037) (0.040) (0.198) (0.177) (0.190)New Category −0.745 −0.873 −0.793 −1.232 −1.551 −1.346
(0.730) (0.684) (0.712) (0.586) (0.485) (0.546)Elapsed Time 0.005 0.005 0.005 0.008 0.008 0.008
(0.392) (0.375) (0.400) (0.231) (0.189) (0.246)Funding Period 0.098 0.096 0.096 0.089 0.086 0.087
(0.083) (0.087) (0.089) (0.139) (0.154) (0.148)Funding Reward Tiers 0.011 0.010 0.009 −0.052 −0.051 −0.054
(0.913) (0.919) (0.931) (0.664) (0.671) (0.654)Funding Reward Size −0.006 −0.006 −0.006 −0.008 −0.008 −0.008
(0.003) (0.003) (0.003) (0.001) (0.001) (0.001)Ln Funding Threshold 2.067 2.052 2.069 1.878 1.875 1.892
(0.001) (0.001) (0.001) (0.003) (0.003) (0.002)Entrepreneur FE Yes Yes Yes Yes Yes YesProduct Subtype FE Yes Yes Yes Yes Yes YesYear FE Yes Yes Yes Yes Yes YesMonth FE Yes Yes Yes Yes Yes YesR2 0.776 0.776 0.776 0.814 0.815 0.815Entrepreneurs 314 314 314 303 303 303Observations 722 722 722 644 644 644
Appendix - xxxviii
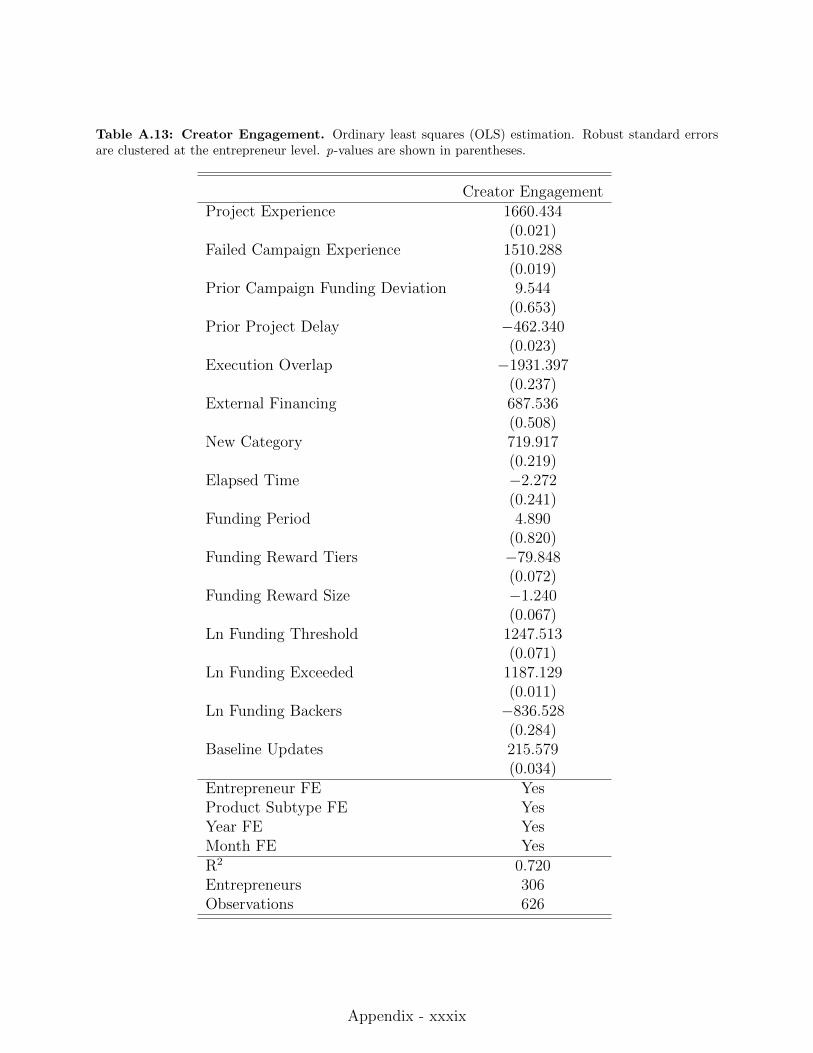
Table A.13: Creator Engagement. Ordinary least squares (OLS) estimation. Robust standard errorsare clustered at the entrepreneur level. p-values are shown in parentheses.
Creator EngagementProject Experience 1660.434
(0.021)Failed Campaign Experience 1510.288
(0.019)Prior Campaign Funding Deviation 9.544
(0.653)Prior Project Delay −462.340
(0.023)Execution Overlap −1931.397
(0.237)External Financing 687.536
(0.508)New Category 719.917
(0.219)Elapsed Time −2.272
(0.241)Funding Period 4.890
(0.820)Funding Reward Tiers −79.848
(0.072)Funding Reward Size −1.240
(0.067)Ln Funding Threshold 1247.513
(0.071)Ln Funding Exceeded 1187.129
(0.011)Ln Funding Backers −836.528
(0.284)Baseline Updates 215.579
(0.034)Entrepreneur FE YesProduct Subtype FE YesYear FE YesMonth FE YesR2 0.720Entrepreneurs 306Observations 626
Appendix - xxxix

Table A.14: Incentive to Overpromise. Ordinary least squares (OLS) estimation. Robust standarderrors are clustered at the entrepreneur level. p-values are shown in parentheses.
Ln Funds Raised Ln Funding ExceededPredicted Time 0.001 0.002
(0.102) (0.247)Features Rank 0.111 0.169
(0.026) (0.053)Failed Campaign Experience −0.097 −0.196
(0.319) (0.149)Prior Campaign Funding Deviation −0.022 −0.026
(0.001) (0.000)Prior Project Delay 0.024 0.044
(0.454) (0.435)Execution Overlap −0.163 −0.349
(0.212) (0.125)External Financing 0.137 0.302
(0.680) (0.660)New Category 0.023 −0.172
(0.906) (0.559)Project Experience 0.082 0.044
(0.182) (0.665)Elapsed Time 0.001 0.001
(0.509) (0.477)Funding Period 0.012 0.014
(0.002) (0.005)Funding Reward Tiers 0.023 0.031
(0.004) (0.025)Funding Reward Size 0.000 0.000
(0.198) (0.328)Ln Funding Threshold 0.405 0.015
(0.000) (0.843)Entrepreneur FE Yes YesProduct Subtype FE Yes YesYear FE Yes YesMonth FE Yes YesR2 0.923 0.840Entrepreneurs 314 314Observations 722 722
Appendix - xl

Table A.15: Exiting After VC Financing. Ordinary least squares (OLS) estimation. Robust standarderrors are clustered at the entrepreneur level. p-values are shown in parentheses.
Does Another ProjectExternal Financing 0.033
(0.819)Failed Campaign Experience 0.052
(0.617)Prior Campaign Funding Deviation −0.004
(0.124)Prior Project Delay −0.028
(0.132)Execution Overlap −0.081
(0.408)New Category −0.199
(0.042)Project Experience −0.394
(0.000)Elapsed Time −0.001
(0.001)Funding Period −0.003
(0.237)Funding Reward Tiers 0.008
(0.195)Funding Reward Size 0.000
(0.217)Ln Funding Threshold −0.035
(0.254)Ln Funding Exceeded 0.030
(0.354)Ln Funding Backers −0.005
(0.921)Entrepreneur FE YesProduct Subtype FE YesYear FE YesMonth FE YesR2 0.770Entrepreneurs 304Observations 641
Appendix - xli

Table A.16: Exiting After Delay. Ordinary least squares (OLS) estimation. Robust standard errors areclustered at the entrepreneur level. p-values are shown in parentheses.
Does Another ProjectDelay Duration −0.0003
(0.194)Failed Campaign Experience 0.235
(0.116)Prior Campaign Funding Deviation −0.004
(0.159)Prior Project Delay −0.024
(0.337)Execution Overlap −0.034
(0.785)New Category −0.266
(0.049)Project Experience −0.344
(0.000)Elapsed Time −0.001
(0.016)Funding Period −0.003
(0.352)Funding Reward Tiers 0.008
(0.238)Funding Reward Size 0.000
(0.527)Ln Funding Threshold −0.042
(0.259)Ln Funding Exceeded 0.045
(0.280)Ln Funding Backers −0.014
(0.821)Entrepreneur FE YesProduct Subtype FE YesYear FE YesMonth FE YesR2 0.780Entrepreneurs 294Observations 581
Appendix - xlii