entrepreneurship data for technical note latin … · 2017-06-06 · data representing various...
TRANSCRIPT

Entrepreneurship Data for Latin America and the Caribbean
What Is There and What Is Missing?
Alison Cathles
Inter-American Development Bank
Institutions for Development Sector Competitiveness and Innovation Division
TECHNICAL NOTE
No. IDB-TN-729
December 2014

Entrepreneurship Data for Latin America and the Caribbean
What Is There and What Is Missing?
Alison Cathles
Inter-American Development Bank
2014

http://www.iadb.org The opinions expressed in this publication are those of the authors and do not necessarily reflect the views of the Inter-American Development Bank, its Board of Directors, or the countries they represent. The unauthorized commercial use of Bank documents is prohibited and may be punishable under the Bank's policies and/or applicable laws. Copyright © Inter-American Development Bank. All rights reserved; may be freely reproduced for any non-commercial purpose.
2014
Cataloging-in-Publication data provided by the Inter-American Development Bank Felipe Herrera Library Cathles, Alison. Entrepreneurship data for Latin America and the Caribbean: what is there and what is missing? / Alison Cathles. p. cm. — (IDB Technical Note ; 729) Includes bibliographic references. 1. Entrepreneurship—Statistics—Latin America. 2. Entrepreneurship—Statistics—Caribbean Area. 3. Entrepreneurship—Databases—Latin America. 4. Entrepreneurship—Databases—Caribbean Area. I. Inter-American Development Bank. Competitiveness and Innovation Division. II. Title. III. Series. IDB-TN-729

Abstract
Data representing various aspects of entrepreneurship in the Latin American and Caribbean (LAC) region are more abundant today than 10 years ago. The information about entrepreneurship in the LAC region, however, remains fragmented, as it has proliferated from different sources that vary in terms of degrees of coverage, units of analysis, and intended purposes. For the majority of LAC countries, there are dimensions of entrepreneurship for which data have either not been collected or are difficult to access. This technical note discusses what data are available and what data are missing, and opens a dialogue about the strategic decisions required to identify and prioritize the entrepreneurship data needs in the region. One thing is evident from past experience outside of the region: collecting intra- and extra-regionally comparable entrepreneurship data is a considerable undertaking that would benefit from strong public support, consensus among countries, and a solid statistical framework for data collection. JEL Codes: C8, L26 Keywords: data collection, entrepreneurship, Latin America and the Caribbean, LAC

2
1. The Need for Timely, Comparable, and Reliable Entrepreneurship Indicators
When it comes to studying entrepreneurship in the Latin American and Caribbean (LAC) region,
the sources of data and information are steadily increasing. Unfortunately, compared with other
regions, such as those in the Organization for Economic Cooperation and Development (OECD),
policymakers in the LAC region are limited in terms of timely data and indicators regarding
particular aspects of entrepreneurship, and this shortage may effectively cause blind spots.
Policymaking for entrepreneurship is challenging enough, given that well-intended pro-
entrepreneurship policies can be misguided leading to unintended negative consequences for
economic growth.1
There has been a transition from interest in “small business policy” that was oriented
toward trying to preserve small businesses (believed to be at an inherent scale disadvantage, but
good for job creation) toward “entrepreneurship policy” aimed at promoting new business
ventures or start-ups (seen as crucial for the commercialization of knowledge and therefore a
source of innovation). The different types of agencies and ministries tasked with designing and
implementing these two different sets of policies may be partially responsible for challenges with
regard to insufficient information, insofar as data collection priorities are set by the agendas of
agencies that plan to use that information to make policies (Audretsch and Beckmann, 2007).
Underpinning the trends toward evidence-based policymaking by governing agencies
(e.g., the European Commission) is the assumption that decisions made with the use of
systematic evidence produce better outcomes (RAND, 2010). Making use of data and statistical
information often involves a series of strategic choices. A recent study of international good
practice proposes a simple data-strategy framework as follows: (i) identification of data needs
and priorities, (ii) collecting the data, (iii) managing the data, (iv) analyzing the data and
communication, and finally (v) data use. Each part of the framework feeds back into the other
parts, which allows for continual improvements and evolution of the individual parts as well as
their links with each other (RAND, 2010). Since entrepreneurship is an expansive topic, the
stage of “identification of data needs and priorities” involves first defining and then pinning
down which elements of entrepreneurship are of interest for which governing body. The different
1 One pertinent example of such a policy, described by Parker (2007), was a tax break in the UK for small firms that was meant to encourage entry into the market, but instead served as a perverse tax on growth. The tax was about 60 percent less for small firms (measured by taxable profit above a certain threshold) and the subsidy was withdrawn

3
definitions and dimensions of entrepreneurship are related and often intertwined, but may require
different types of data to inform policymaking. A clear understanding of desired and expected
data uses should influence first stage strategic choices.
Operationalizing the concept of entrepreneurship is challenging due to the various
identities and roles associated with the term throughout time in economic literature (and
literature from other fields) as well as in colloquial thought.2 This challenge has to be resolved
before individual countable indicators can be constructed (Wennekers and Thurik, 1999). Others
have encountered this issue and have concluded that because of the multi-dimensionality of
entrepreneurship, there is not any single indicator that would be sufficient. Rather, a basket of
indicators is needed. This was one of the main conclusions of the feasibility study that preceded
the creation of the OECD’s Entrepreneurship Indicators Programme (EIP). Through a process of
consensus building among heterogeneous member countries and national statistics offices, they
established a statistical framework, set definitions, and agreed upon methodological standards
with which to approach and collect comparable data on entrepreneurship. As a result, today’s
policymakers in the OECD have at their disposal a set of appropriate indicators on
entrepreneurship. The timely availability of these data allow policymakers to consider the current
state of affairs of the dimensions of entrepreneurship in the economy and how that current state
of affairs compares with other economies in the region relatively quickly.
Business demographic data is highly informative regarding the creation, survival, and
death of firms; employment gains and losses; and allocation of labor resources within and
between different sectors in an economy. The “innovation” dimension of entrepreneurship aims
to capture the novelty of new firms entering the market. This becomes a crucial point of interest
because many new firms that are replicative may contribute to employment, but may not spur
economic growth. To be a new or small firm may or may not imply competition and
2 The characterization of the entrepreneur’s role and whether cues are taken from society or whether individual traits drive the entrepreneurial behavior, depends on the scholarly origin (Neo-classical, Austrian, Schumpeterian, Competition – Porter) and field of study (psychology, sociology, economics, management and business). Naudé (2008) surmises that the entrepreneur has been studied by almost all disciplines and that in economics the definitional approach has been occupational, behavioral or outcomes based. According to Szirmai, Naudé and Goedhuys (2011), the concept of entrepreneurship has been approached in three ways in economic literature, which tend to treat the entrepreneur (a) from the functional perspective, (b) as an economic actor, or (c) as a subset of owner-operated enterprises. The functional perspective has to do with the individual psychological traits that inspire newness or originality. The economic actor perspective views entrepreneurship as the decision making force behind investment decisions in a firm. The concept of the entrepreneur who owns and operates his/her own business tends to be focused on SMEs and self-employment (Szirmai, Naudé, Goedhuys, 2011).

4
Schumpeterian creative destruction, therefore identifying commonalities among new firms more
likely to introduce novelty is important. Equally, if not more challenging, is identifying which
entrepreneurs or types of people are statistically more likely to create new businesses that either
grow and provide jobs for more people or introduce novelty. The efficiency and innovative
tendency with which a particular firm operates depends not only on the person or people who
started the firm (the entrepreneur from the founder perspective), but on all of the people who
manage and work in the firm. Intrapreneurial managers may be as crucial to firm innovation,
survival, and growth as the initial founders, and may possess a different set of talents from those
who are responsible for breakthrough innovations (Baumol, 2004).
For some countries in the LAC region, there are data and information available about
some of the dimensions of entrepreneurship included in the EIP basket of indicators. There are
glaring gaps however, and those gaps limit evidence-based and agile policymaking. The most
obvious gap vis-à-vis the EIP is the availability of business demographic statistics. Only a couple
of countries in LAC are publishing the results of this type of statistical information. It was a
critical aspect of the endeavor for the OECD to leverage substantial public funds and coordinate
the harmonized collection and publication of these data with the active participation of their
member countries (who were at different stages with respect to entrepreneurship and had a
variety of angles of policy interests in the topic). The other shortage identified in this paper,
which falls outside the scope of the EIP, is the impact evaluation of entrepreneurship programs.
Several programs exist in the region for stimulating entrepreneurship, but impact evaluations are
rare (Navarro, 2014).
The first objective of the present study is to conduct an assessment of the
entrepreneurship data sources currently at the disposal of policymakers in the LAC region. This
assessment will delineate what data exist and do not exist among the basket of indicators used by
the EIP, which is taken as a measure of current international good practice. The second objective
is to start a discussion about what information is still missing for entrepreneurship policymakers
in LAC. In an ideal world in which policymakers had all the possible information they could
want about entrepreneurs in their regions or countries, what data or other information would be
entailed? If the policymakers had more data and information, what would the results be? The
second objective of this study is not meant to didactically conclude what the ideal full
5
information set would be, but rather to posit some ideas and encourage further discussion and
contributions from experienced practitioners, policymakers, and entrepreneurs.
2. Assessment of Available Entrepreneurship Data in the LAC Region
2.1 Identity Crisis: Who is the Entrepreneur and Why Does It Matter for Measurement?
In a review of economic literature on entrepreneurship, Wennekers and Thurik (1999) found at
least thirteen different ways in which the entrepreneur was characterized. 3 The authors
ascertained that nine of those roles could be associated with positioning the entrepreneur as an
agent of change who is capable of influencing economic growth (ibid).4 The definition of
entrepreneurship has implications for the measurement and analysis of entrepreneurship and
resulting policies (Vivarelli, 2013; Wagner, 2014).5 Figure 1 illustrates different dimensions of
entrepreneurship across operationalized terms that can be measured: individual characteristics,
business demography, innovation, and scaling/growth, which illustrates that the identification
and prioritization of data needs may vary depending on whether the primary concern of the
governing entity is job creation, innovation, or economic growth. Maintaining clarity about
which dimensions of entrepreneurship have available data and which dimensions require more
data collection is an important step in identifying the priorities in the data needs for the region.
3 The 13 characterizations of entrepreneurship identified in economic literature by Wennekers and Thurik (1999) are: the person who assumes the risk associated with uncertainty; the supplier of financial capital; an innovator; a decision maker; an industrial leader; a manager or a superintendent; an organizer and coordinator of economic resources; the owner of an enterprise; an employer of factors of production; a contractor; an arbitrageur; an allocator of resources among alternative uses; and the person who realizes a start-up of a new business. The 9 that are in bold are the characterizations associated with change agents and growth. 4 Baumol (1990: 899) contended that not all entrepreneurial activity is productive and that the presence of rent-seeking entrepreneurial activity rests in the incentive structure of a given economy, or as he calls it, “the rules of the game.” This has led to a distinction between types of entrepreneurship: opportunity-driven and necessity-driven (also referred to in the literature as: survival, evasive, unemployment escape) entrepreneurship (Desai, 2009). 5 Simulating or subsidizing business entry simply to increase entrepreneurship or the number of new firms may not be wise, since not all new businesses contribute equally to economic growth. Blanket subsidies could lead to deadweight loss (since some new firms might not really need the subsidy to succeed) and substitution effects (whereby inefficient new entrants may be given a “leg up” delaying inevitable exit and falsely displacing either other unsubsidized more efficient new entrants or incumbents) (Quatraro and Vivarelli, 2013).

6
Figure 1: Dimensions of Entrepreneurship Source: Author’s elaboration; individual characteristics are drawn from Wennekers and Thurik (1999). Similarly, if there are specific aspects of entrepreneurship that are of particular concern
for policymakers, this information could be useful in identifying the priorities among the data
needs. Recent publications about entrepreneurship in LAC generally conclude that
entrepreneurship in the form of starting a business is not the problem per se, the problem is in
scaling the business and introducing novelty in the local or global markets (CAF, 2013;
Lederman, et al., 2014; Ruprah, Melgarejo and Sierra, 2014; Wagner, 2014;). If only the novelty
producing or innovative or high-potential entrepreneurs are considered (either in terms of data
measurement or policy), how does that differ from innovation statistics or innovation policy? On
the other hand, if the measurement of entrepreneurship focuses solely on business creation and
business demographics, these could reflect either natural life cycles or redistribution. Recently,
the notion that high growth businesses definitively have broader implications for economic
growth has been challenged (Coad, et al. 2014). It is exactly the intersection between business
demographics and high-performing firms that is of particular interest and difficult to find. The
number of new businesses being started, surviving, and dying in an economy is a critical aspect
of recording entrepreneurial activity. Most small firms grow very slowly (or not at all) and there
are a small number of high-performance, high growth firms that have been shown to be crucial
Business demography Innovation
Scaling / growth
Individual characteristics
Firm Creation
Firm Survival
Firm Death
Interest: Jobs and allocation of labor
resources.
Innovative
Introduction of novelty.
Interest: Newness, expansion,
diversification.
Incumbent firms
Firms that grow faster than others.
Position within the
industry.
Interest: Patterns within and across
industries.
The person
One who assumes risk associated with
uncertainty.
A coordinator of economicresources.
A decision-‐maker.
Innovative ideas.
Interest: Patterns, influences of cultural norms.
Founder: Firm creation + Innovative = Schumpeterian Entrepreneurs or
Enterprises. May or may not become an industrial leader.
7
for creating new jobs (Acs et al., 2008; Acs and Mueller, 2008; Birch and Medoff, 1994; Delmar,
et al. 2003). Findings in industrial dynamics consistently reveal skewed growth rates among
firms, as interest in small- and medium-sized enterprises (SMEs) has waned, interest has
increased in learning more about the factors that can explain high-growth firms (Coad, et al.,
2014). It is not necessarily true that high-growth firms are young (recently created), but
youngness has been found to be an attribute (Wagner, 2014). Quatraro and Vivarelli (2013)
suggest targeted support of promising potential entrepreneurs meaning those with innovative
ideas or high levels of human capital (characteristics of individuals). The authors note that this
policy implication may be subject to contextual factors, especially in less developed countries
where institutional constraints are severe. Ultimately, countries may want to use data and
information about entrepreneurship for different types of policies. Some countries may be more
focused on job creation or labor resource allocation, and others may be more focused on
innovation or other productivity-enhancing performance measures. It is therefore important when
identifying priorities to continue collection of data and information across all dimensions of
entrepreneurship. Based on this, the regular collection and dissemination of a basket of
entrepreneurship indicators would seem advisable.
2.2 Data Review and Background: Emergence of New Entrepreneurship Datasets
The following sections will be structured as follows: first, a short summary of the process that
created the OECD’s Program for Collecting Timely Indicators on Entrepreneurship will be
described by providing background as well as justification for why this program can be taken as
a benchmark. It was a noteworthy effort, several years in the making, that involved institutional
change and significant commitment. Next the section presents the basket of entrepreneurship
indicators set forth by the OECD and which countries in LAC that have similar data. The section
concludes by describing existing data sources and which facets of the entrepreneurship
phenomenon can be captured or proxied by those data.

8
2.3 A Brief Summary of the Creation of the Entrepreneurship Indicators Programme6
The creation of the Entrepreneurship Indicators Programme (EIP) was a process that was an
extensive undertaking on the part of the OECD. Before the program officially launched in 2006,
several preliminary steps were taken.
In 2004, there was an annual meeting with ministries in Istanbul. During that meeting it
was established that countries needed more robust statistics about SMEs and entrepreneurship.
Shortly after, Denmark hosted a consortium on dynamic entrepreneurship benchmarking and this
consortium saw a role for the OECD in supporting the development of better entrepreneurship
data. A Centre for Entrepreneurship, SMEs, and Local Development was established within the
OECD and funding from the Kaufman foundation was secured.
In 2005, the statistics directorate conducted a feasibility study from which scoping
documents, including a comparability assessment and framework for improving comparability
report, were produced. The feasibility and scoping reports written during these initial stages
paved the way for eventual collaborative action. These documents have now been declassified
and offer interesting insights into how they served as guiding material for a common
measurement framework. The feasibility study (OECD, 2006a) also resulted in an action plan
that was endorsed by a variety of pertinent stakeholders and additional funding was secured from
the Kaufmann foundation. A pilot survey was conducted with several interested countries, to test
the feasibility (mainly in terms of infrastructure and management for data collection) of the
periodic collection of international entrepreneurship data.
After the program was launched in 2006, an entrepreneurship steering group was
convened to bring together international experts and the national statistics offices that were
responsible for producing the data. The OECD acknowledges that this steering group was
fundamental in the selection of indicators and the execution of the program, especially in terms
of establishing comparability among different member countries’ statistics. Also after EIP’s
launch, an organizational change at the OECD took place merging the OECD’s business
statistics office and EIP into one unit. This illustrates that a program of this nature does require
significant effort and buy-in from stakeholders sustained over a lengthy time horizon.
6 A more extensive history of the development of the OECD’s EIP program and links to the relevant documents can be found at: http://www.oecd.org/industry/business-stats/theentrepreneurshipindicatorsprogrammeeipbackgroundinformation.htm

9
The OECD confronted many of the same issues that are relevant in current discussions in
LAC regarding the measurement of entrepreneurship. They were able to establish three
important points (briefly described below) in their feasibility study and scoping reports (OECD,
2006a, 2006b, and, 2006c):
1. The need for regionally comparable entrepreneurship indicators. The scoping reports
established the following: (a) there was sparse information regarding the analysis and comparability of entrepreneurship measures, (b) the myriad of definitions were not reflected in statistical measures and different countries pursue different objectives through entrepreneurship, so there was not one definition that could satisfy everyone, (c) countries had a strong desire to understand the factors that influenced entrepreneurship and they also wanted to be able to compare their data with other countries, so they could elect which policies made sense to replicate given their own national objectives, (d) since entrepreneurship data were at an early stage of development, it was an opportune moment to harmonize data internationally, (e) that it was important to take advantage of existing data in the field, and (f) it was important for the region’s policymakers to have this information available (as close to real time as possible) since the data represent the fabric of the economy and offer guiding indications of the vibrancy and health of the private sector (OECD 2006a; OECD, 2006c).
2. Public funds were needed to launch and execute this program. Limited budgets are
available for statistical work and yet sound evidence-based policymaking often relies on data. The better the data are, the more the policymakers have to work with, however, this means that prior to collecting the data and in the design of any further data collection instruments, prospective entrepreneurship measures, indicators, and data collection must pass the test of relevance and utility for policymakers. If the new data prove to be useful, future funding is more likely to be secured (OECD, 2006a).
3. It should be a regional undertaking and the OECD had a role to play in supporting the
effort. The OECD recognized that not all of the member countries were at the same stage with respect to entrepreneurship nor were all countries able to devote the same level of resources to measurement. Coming up with common definitions, models, and coordinated surveys allowed countries the flexibility of taking advantage of these communal resources and improving their entrepreneurship statistics with less front-end investment. The role of an organization such as the OECD in orchestrating such an endeavor had to do with its ability to convene country representatives and international experts, as well as their ability to help set priorities for statistical activities that would be policy-relevant, and to disseminate results facilitating sharing best practices among the countries (2006a).

10
Table 1 presents the indicators that have been identified by the OECD’s EIP. The core
indicators of entrepreneurial performance are highlighted. Those are the indicators that the EIP
draws from National Registries and that the EIP has worked to harmonize over the past 10 years.
In the LAC region, some of the indicators in the basket of entrepreneurship indicators are
available for some of the countries, but there is significant heterogeneity within the region in
terms of data availability, especially once one moves to indicators that fall outside the scope of
databases that attempt to achieve global data coverage. This means that while policymakers in
LAC may have access to some global indicators, they are at a loss when it comes to having some
more sophisticated data that could be informative for policymaking proposes. Table 2 presents
the data that are available for the countries in the region. Appendix 1 reports data along several
of the indicators that are currently available.
Table 1: Overview of Entrepreneurship Indicators with Emphasis on the Core Indicators
of Entrepreneurial Performance
Source: Author’s elaboration based on the OECD (2014).
It is clear that in the LAC region there is a lack of information on the business
demographics indicators, which the OECD identifies in its basket of indicators as the core
entrepreneurship indicators. A recent undertaking by three countries in the LAC region (Chile,
Costa Rica, and Ecuador) to create for the first time or update (in the case of Chile) these core
Entrepreneurship+indicators++++++++++++++++++++++++++++++++++++++++++++++++++++++++++++++++++++++++++++++++++++++++++++++++(excerpted+from+the+OECD's+Entrepreneurship+Indicators+Programme+EIP) Data+source LAC+region
A)#New#enterprise#creations WBGES#/GEMB)#BankruptciesC)#Self<employment #Labor#force#surveys CEDLAS#/#Gallup#PollD)#Venture#capital OECD#Entrepreneurship#Financing#Database INSEADE)#Enterprises#by#sizeF)#Employment#by#enterprise#sizeG)#Value#added#by#enterprise#sizeH)#Labor#productivity#by#enterprise#size OECD#Productivity#DatabaseI)#Exports#by#enterprise#size Trade#by#Enterprise#Characteristics#(TEC)#DatabaseJ)#Birth#rate#of#employer#enterprisesK)#Death#rate#of#employer#enterprisesL)#Churn#rate#of#employer#enterprisesM)#Survival#of#employer#enterprisesN)#Regional#business#demographyO)#Employment#creation#and#destruction#by#employer#enterprise#births#and#deathsP)#Employment#creation#and#destruction#in#surviving#enterprisesQ)#High<growth#enterprises#rateR)#Innovation#by#enterprise#sizeS)#Collaboration#in#innovation#by#enterprise#sizeT)#Factors#hampering#innovation#by#enterprise#sizeU)#Public#support#for#innovation#by#enterprise#sizeV)#Regulatory#framework:#starting#a#business OECD#Database#of#Indicators#of#Product#Market#Regulation Doing#Business
W)#Culture:#reasons#for#starting#a#businessEuropean#Commission#Eurobarometer#Survey#on#Entrepreneurship#database
Global#Entrepreneurship#Monitor#(GEM)#
X)#Access#to#finance:#equity#capital OECD#Entrepreneurship#Financing#Database World#Bank#Enterprise#Survey#data
OECD#Structural#and#Demographic#Business#Statistics#(SDBS)#Database##<#Business+demography+statistics+computed+from+business+registers:+core+indicators+of+entrepreneurial+performance.
OECD#Timely#Indicators#of#Entrepreneurship#(TIE)#Database
OECD#Structural#and#Demographic#Business#Statistics#(SDBS)#Database
Eurostat#Community#Innovation#Survey#and#National#Sources
Innoation#Survey#data#are#available#for#some#LAC#countries.
To#some#extent,#aspects#of#these#indicators#can#be#found#in#the#World#Bank#Enterprise#Survey#data
Data#from#business#registers#have#been#analyzed#in#a#harmonized#manner#for#Chile,#Costa#Rica,#and#Ecuador.###

11
entrepreneurship performance statistics and can serve as a model for other countries in the region
(Carrillo and Lopez, 2014; Crespi, 2003; Monge-Gonzalez and Torres, 2014; Urzua and
Espinoza, 2014). Ideally, the LAC region could work toward having a timely database for these
core entrepreneurship statistics with harmonized and internationally comparable data. This is not
to imply that LAC should replicate exactly what the OECD has done. In fact, current thinking
regarding best development practices suggests matching strategies rather copying international
benchmark practices in distinct settings. Simply replicating policies that have been successful
elsewhere fails to account for differences in the overall context in which these borrowed
practices are replicated (IDB, 2012). The EIP could serve, however, as a useful starting point in
the following three areas: (i) the concept that there is a basket of indicators that can help
policymakers have their fingers on the pulse of entrepreneurship in their regions or countries; (ii)
the regional collaboration that is needed to undertake such an endeavor and; (iii) the notion that
at least some of these indicators, in order to maximize their relevance, need to be collected and
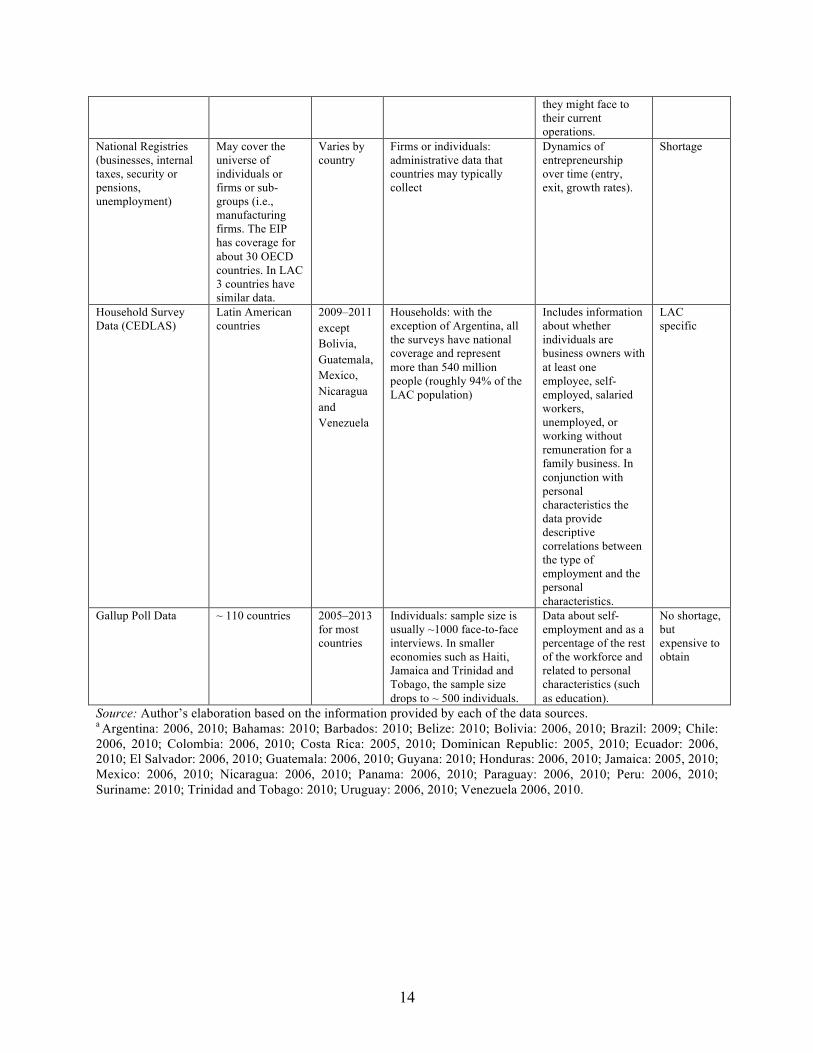
reported in a very timely manner. Table 2 below illustrates the types of entrepreneurship data
that are publically available in select LAC countries. It is important to note the white space in the
middle of the table with regard to Business Demographic Data and at the bottom with respect to
Impact Evaluations.

Table 2: Entrepreneurship Data Availability by LAC Country
Source: The sources are the databases themselves or publications/reports that document such data for the public. Notes: For the Gallup Poll Data, countries have a diagonal slash in the box if the survey was only conducted for one year in that country. For example, Belize and Guyana only had surveys conducted in 2007 and the first and only one in Suriname was in 2012. There is a recent publication about best practices in Venture Capital in the LAC region that emphasizes continual evaluation and assessment of investment, but it does not delve into program impact evaluation in the strict sense (Lerner et al., 2013).
ARG BHS BLZ BOL BRA BRB CHL COL CRI DOM ECU GTM GUY HND HTI JAM MEX NIC PAN PER PRY SLV SUR TTO URY VEN
Individual)entrepreneurial)characteristics
Gallup;Poll
Business)demographics))[formal)firm)creation)only]
Business)demographics)[creation,)survival,)death,)and)growth]
Analyzed;for;demographic;business;
statistics:;b irth/death/churn/;
survival
Regional;business;demography
Employment;creation;and;
destruction;by;employer;enterprise;
births;and;deaths
Employment;creation;and;
destruction;in;surviving;firms
HighOgrowth;enterprises;rates
Innovation
Incubators
Support;for;startOups
Seed;capital
NonOfinancial;support;for;high;
potential;ventures
Entrepreneurship)program)impact)evaluations
Global;Entrepreneurship;Monitor;(GEM)
Household;Survey;Data;(CEDLAS,;2012)
World;Bank;Group's;Doing;Business;Entrepreneurship;Survey
National;registries;(businesses,;internal;taxes,;security,;pensions,;or;unemployment)
Innovation;surveys;(innovation;activities)
Enterprise;surveys;[growth;can;also;be;calculated;with;3Oyear;recall;questions]

13
2.4 Description of Commonly Available and Internationally Comparable Data Sources for LAC
In the last decade or so, significant progress has been made in developing new sources of data
that can be used to study and understand entrepreneurship in its various forms. Table 3 below
highlights some of the most commonly used sources of data. Following the table is a brief
description of some of the pros and cons of the different sources of data.
Table 3: Summarized Description of Entrepreneurship Data Sources
Data Source Coverage Years Unit of analysis Usage Shortage World Bank Group’s Doing Business Entrepreneurship Survey
133 Countries
2004–2012 Newly Formed Firms: Total number of newly registered corporations (private, formal sector companies with limited liability) per 1,000 working-age people (aged 15–64)
The main variable of interest is new business entry density.
Not a shortage
Global Entrepreneurship Monitor (GEM)
87 countries 1999–2012/13
Individuals: Adult Population Survey collects samples of at least 2000 individuals (aged 18-64). Total Entrepreneurial Activity (TEA) includes: freelance, part time, and informal
Percent of nascent entrepreneurs or owner-managers of a new business (less than 3.5 years old). The survey asks about entrepreneurial cultural norms, individual motivations (opportunity/ necessity), business activities, growth expectation, newness of products for customer base, international orientation.
Not a shortage
Enterprise Surveys, The World Bank Group
135 Countries *Does not cover high-income countries (sample sizes vary by country)
Varies by country a
Existing Firms: Survey data collected about how firms perceive the country’s business environment
Firms are asked about whether they are formal or informal, if the founder answers the survey then there are questions regarding previous experience and if the firm was started because of no other employment opportunities, and about the novelty of the idea that motivated the establishment of the firm. Firms are also asked about a wide range of obstacles
Not a shortage
14
they might face to their current operations.
National Registries (businesses, internal taxes, security or pensions, unemployment)
May cover the universe of individuals or firms or sub-groups (i.e., manufacturing firms. The EIP has coverage for about 30 OECD countries. In LAC 3 countries have similar data.
Varies by country
Firms or individuals: administrative data that countries may typically collect
Dynamics of entrepreneurship over time (entry, exit, growth rates).
Shortage
Household Survey Data (CEDLAS)
Latin American countries
2009–2011 except Bolivia, Guatemala, Mexico, Nicaragua and Venezuela
Households: with the exception of Argentina, all the surveys have national coverage and represent more than 540 million people (roughly 94% of the LAC population)
Includes information about whether individuals are business owners with at least one employee, self-employed, salaried workers, unemployed, or working without remuneration for a family business. In conjunction with personal characteristics the data provide descriptive correlations between the type of employment and the personal characteristics.
LAC specific
Gallup Poll Data ~ 110 countries 2005–2013 for most countries
Individuals: sample size is usually ~1000 face-to-face interviews. In smaller economies such as Haiti, Jamaica and Trinidad and Tobago, the sample size drops to ~ 500 individuals.
Data about self-employment and as a percentage of the rest of the workforce and related to personal characteristics (such as education).
No shortage, but expensive to obtain
Source: Author’s elaboration based on the information provided by each of the data sources. a Argentina: 2006, 2010; Bahamas: 2010; Barbados: 2010; Belize: 2010; Bolivia: 2006, 2010; Brazil: 2009; Chile: 2006, 2010; Colombia: 2006, 2010; Costa Rica: 2005, 2010; Dominican Republic: 2005, 2010; Ecuador: 2006, 2010; El Salvador: 2006, 2010; Guatemala: 2006, 2010; Guyana: 2010; Honduras: 2006, 2010; Jamaica: 2005, 2010; Mexico: 2006, 2010; Nicaragua: 2006, 2010; Panama: 2006, 2010; Paraguay: 2006, 2010; Peru: 2006, 2010; Suriname: 2010; Trinidad and Tobago: 2010; Uruguay: 2006, 2010; Venezuela 2006, 2010.

15
World Bank Group’s Doing Business Entrepreneurship Survey: The advantage of this
dataset is that it provides information about the entry of new formal businesses for economies
around the world. These data are useful for calculating entry rates. The dataset does not reveal
the motivations for starting a business; information about attempts to start businesses (reasons
for failed attempts); nor any information about what might happen to the business once it has
been established (growth rates, sales, novelty/innovativeness, survival, or exit rates).
Global Entrepreneurship Monitor (GEM): The advantage of this dataset is that it provides a
window into individuals’ perceptions of entrepreneurial norms in the country in which they live.
It also provides information about entrepreneurial activity (regardless of whether it is formal or
informal) and how the individual regards his or her own enterprise: its growth potential; its
novelty; and whether it was started for lack of a better employment option or because the person
was pursuing a perceived business opportunity. Although it is useful to gauge all entrepreneurial
activity in a country, it is then difficult to probe the data further, because it is not possible to
distinguish between individuals who are operating in the formal or informal sector. Furthermore,
although the questionnaire (2011) asks respondents about the nature of the business activity (i.e.,
What kind of organization are you working for? What is it selling?), this has not been translated
in the databases7 in a way that would be consistent with typical classifications of industrial or
service sectors International Standard Industrial Classification (ISIC) or Nomenclature statistique
des activités économiques dans la Communauté européenne (NACE). There is also an
inconsistency with the GEM model and the questions that the survey actually asks.8 In many
ways, opportunity- or improvement-driven entrepreneurship has been linked in the literature with
innovation and economic growth. The GEM model represents an implicit link—yet the specific
questions ask only about pursuing business opportunities, greater independence, and desire for
more income. Individuals whose answers reflect they are motivated by these three things are then
categorized as improvement opportunity-driven entrepreneurs It would be possible to check yes
to all three of those boxes and be a “replicative” entrepreneur and not an “innovative”
entrepreneur. For example, someone who has been working in a bar or restaurant may identify a
niche clientele and start a new establishment to make more money and gain independence from
7 From the assessment of the current researcher in attempts to locate such information. 8 See page 12 of the GEM manual available at http://www.gemconsortium.org/docs/2375/gem-manual-design-data-and-quality-control.

16
his or her employer, but this could just become one more restaurant among many and is unlikely
to move the needle in the country’s gross domestic product (GDP). If several people repeated the
same behavior, it is likely they would drive other restaurateurs out of business and be
redistributing resources rather than spurring growth. Also, the motivations and growth
expectations of the entrepreneurs cannot be matched with the actual results achieved. These
limitations are part of the reason why new and improved data are still needed. In comparison,
Europe uses the Eurobarometer as a survey-based data source that asks individuals about their
motivations, entrepreneurial attitudes, and obstacles.
Enterprise Surveys, The World Bank Group: The advantage of this dataset is that the firms
have been asked many questions regarding productivity, innovation, finance, human capital and
obstacles to running their current operations. The sectoral distribution of firms seems to be
sufficient to be able to separate the responses by industry. The disadvantage is that the data only
cover incumbent firms with more than five employees in a stratified (rather than representative)
sample, and at this point most LAC countries have implemented surveys just once (in 2010) or
twice (in 2006 and 2010). It would be a strong assumption to suppose that the obstacles of
operating or growing a business might be the same as those that might inhibit a potential
entrepreneur from starting a business. Therefore, with this data alone the current state of affairs
for the firms that were surveyed can be assessed, but not the dynamics of entrepreneurship.
These dynamics include: firm life cycles and growth rates over a sufficient time horizon,9 a priori
entry decision-making rationale, or exit rates and rationale—though the obstacles to current
operations could shed some light on exit rationale.
National Registries (businesses, internal taxes, security, pensions, unemployment): National
registries can be rich sources of information for analyzing the dynamics of firm entry, survival,
growth and exit rates. Depending on the dataset, it can be possible to analyze industry dynamics
and the lifecycles of firms in an economy. Recently, some countries in LAC including Chile,
Costa Rica, and Ecuador have employed various registries to formulate a more comprehensive
understanding of entrepreneurial dynamics in their economies. The usage of such data, however,
9 Recall data are available for individual firms for a three year period, but since failing firms often do not reach three years of age, there are firms that started at the same time as the surveyed firms that did not live until the date the survey was implemented.

17
is not always encouraged by the governmental agencies that collect the data. This can be due to
the sensitive or confidential nature of data that may have been collected for other purposes.
Furthermore, the data may have been collected under the auspices of different institutes or
agencies, making it difficult to match the data to observed trends in business demography.
Countries that have made an effort to make the data anonymous (or allow its usage for research)
have expanded the information set available to national policymakers with respect to the
entrepreneurship dynamics in their countries. Since national registries may have originally been
constructed for other purposes, comparability across countries can be challenging. As previously
discussed, this was a major undertaking of the EIP, which makes use of national business
registries, and for the sake of comparability, adjustments are made to get as close as possible to
the Eurostat-OECD Manual on Business Demography Statistics standard definitions.10
Household Survey Data (Center for Distributive, Labor and Social Studies [CEDLAS])
(Gluzmann, Jaume, and Gasparini, 2012): Household survey data have obvious advantages in
terms of their coverage. The ability to have information about the entire population, location
(regionally within the country), and economic characteristics such as type of employment and
educational attainment is a strong advantage. These particular data are new (2009–2011) and
future waves of the survey could enrich analysis to the extent that comparisons over time are also
of policy interest. The limitations of these data are that the definition of entrepreneur is defined
by the category of “employer”, so linked with definitions of those who are responsible for
allocating resources and decision-making. Since the Household Survey data are not designed for
entrepreneurship, they cannot examine personality traits or other elements that might be relevant
for entrepreneurship research, such as whether the business owner would be considered new or
has been in business for a long time.
Gallup Poll Data: The advantage of this dataset is to have some information about the self-
employed population in a particular country and how it might differ from the population that is
not self-employed. The disadvantages are similar to those of the GEM survey data, because
while they provide information about individuals, the coverage or sample size is around 1000
people. Since this is not panel data, the same individuals are not followed over time. The main
10 See http://www.oecd.org/industry/entrepreneurshipataglance.htm.

18
drawback in terms of this source is that limited data are available online for the public, and the
underlying databases have to be purchased for rather exorbitant fees.11
3. What Are the Entrepreneurship Data Blind Spots in LAC?
The purpose of this section is to discuss what the available data cannot tell us about
entrepreneurship in LAC. It is not meant to be critical of the databases that do exist. The existing
databases are necessary, and in many cases form a solid foundation of information that can be
used as a starting point. New sources of information can add details that will help policymakers
by filling in the existing gaps in information.
As a starting point for discussion, the following four items may represent the most
immediate needs as assessed by gaps in the information currently available about
entrepreneurship in the region:
(1) To be able to identify the young, high potential (or high performance) firms.
(2) To have comparable data (intra and extra-regionally) about the birth, death and lifespan
of firms.
a. How trends in business demographics differ by industry and how to relate this to
trends in the macro economy.
b. When businesses fail, why do they fail?
(3) To identify certain characteristics that are common among young, high-performing firms
or their founders / owner-operators and/or, to identify common characteristics among
older firms that exhibit a sudden spiked improvement in performance (i.e., to determine if
it is correlated with a recent change in management people or practices).
(4) To have more information about what policies or programs are effective in increasing the number of young, high potential (or performance) firms and in what contexts.
11 In a conversation with a Gallup Poll representative, the cost was estimated at 85,000 USD.

19
Box 1: The World Without Gross Domestic Product What would the world be like without common indicators (such as GDP or unemployment statistics) that monitor overall economic heartiness that are just one click away? It would be more difficult to compare an economy with its own growth or decline, and it would be more difficult to compare one economy with another. Once relative contributions of different industries to the GDP are considered, then loss of GDP as an indicator would imply the loss of a measure by which relative contributions to economic output can be measured. Micro data are increasingly being used to understand questions about why macro trends fluctuate (Syverson, 2011). The usefulness of documenting the micro trends in business demographics offers many opportunities for deeper understanding of the determinants of macro level productivity.
The more information the better, so which aspects of the missing information are needed
most? This is something that should ultimately be left up to the policymakers themselves, but
some insights can be drawn from how others have progressed.
3.1 Partial Step toward Identification and Prioritization of Data Needs
These three areas of need are in many ways similar to the needs that were expressed by OECD
member countries less than 10 years ago and led to the EIP. The background work (feasibility
and scoping reports) identified a few “quick wins” (OECD, 2006c), which were similar in nature
to number (1) in the previous numbered list. This led to collaboration among countries to
standardize data collection across business demographic statistics. The LAC region seems to be
similarly poised to benefit from the “quick win” of collaborating regionally to gather business
demographics statistics. As mentioned earlier, achieving this may not be relatively quick, since
there are many obstacles. One obstacle is that national statistics offices would have to undertake
a process of endorsing common definitions and measurement of indicators as well as conversion
of data that are collected (or were designed to be collected) for other purposes. Another obstacle
is that agencies currently collecting this information may feel guarded about publicly sharing the
data. For this reason, the OECD created an instruction manual with techniques to anonymize the
data. This might help to alleviate some concerns, however it is possible that certain
characteristics of the data themselves (i.e., the smaller number of large firms and the dominance
of family-owned large firms in LAC) may make LAC agencies more protective than their
counterpart agencies in the OECD. So far in the LAC region, there are only a few countries for

20
which this type of business demography data analysis is available (Carrillo and Lopez, 2014;
Crespi, 2003; Monge-Gonzalez and Torres, 2014; Urzua and Espinoza, 2014).
As was mentioned in the OECD’s feasibility study (2006a) in their pre-EIP discussions,
many voiced the need to know about the contributions of existing firms and entrepreneurs. There
is an assumption that once an entrepreneur is running a successful business, that entrepreneur
may try again (either with another business idea or the expansion of the already successful
enterprise into new business territory). When businesses fail, why do they fail? In some cases,
where the incumbents are large they may become risk adverse in terms of investing in expensive
new projects with uncertain outcomes, when their pressures are to meet the shareholder
expectations of steady quarterly growth (Christensen, 2011). So, they may prefer to see what
happens with smaller start-ups and if they are successful, acquire them (after initial kinks have
been worked out, which is less risky). Unfortunately, since business demographic statistics are
not regularly monitored in most LAC countries, it is even less common that they track spin-offs.
This makes it difficult to compare how well incumbent firms provide a quasi-incubation period
for new innovative start-ups. This is a measurement gap that if addressed could help
entrepreneurship policymakers (Wagner, 2014). It has been found in some specific industries that
innovative companies have a dilemma since the successful companies (in terms of the uptake of
innovative technologies) follow the same strategies as the ones that fail. They both try to respond
to what their consumers want (Christensen, 2011). Strategies need to be devised to gather
information about–individual firm and industry life cycles as well as how each might relate to a
country’s national economic trends.12 Incumbent firms may have different roles in different
industries and may interact differently with new entrants. Speaking directly with industry leaders
may shed light on what different types of entrepreneurial patterns might be expected as well as
what bottlenecks could be removed to stimulate increased performance or collaboration efforts
among new and incumbent firms.
Number (3) above requires more in-depth knowledge of all the businesses in the
economy. The main question is this: are there common characteristics that could help us to guess
beforehand which firms are more likely to be successful, rather than assess which ones actually 12 Most of the available data give us aggregate or individual level data, but cannot tell us whether an entrepreneur who wants to grow and is competing in the restaurant industry faces different obstacles or challenges from an entrepreneur who wants to grow and is competing in the software industry; although the literature suggests that this is definitively the case (Audretesch et al., 2007; Yago et al., 2008), the available data are limited in their ability to provide insights in this direction.

21
were? Occupational choice models based on expected payoff suggest that entrepreneurship
becomes automatically more productive when the options available to the salaried employee set a
relatively high baseline that must be surpassed to justify the personal decision to become an
entrepreneur (Naudé, 2008). This would entail a solid understanding of the current state of affairs
of an economy’s business demographics to be able to assess whether existing opportunities in the
form of salaried work provide an alternative that is valuable enough to instill entrepreneurial
behavior. This behavior would be competitive, rather than a sort of subsistence means of
preferring to earn an income instead of being unemployed. Therefore, in order to understand the
occupational choice to elect to become an entrepreneur, some information is needed about the
other options that person has for salaried work. An assumption would be that as the quality of the
salaried work would factor in as part of the opportunity cost of deciding to become an
entrepreneur (this could be similar to the push vs. pull or necessity versus opportunity
classifications mentioned earlier). Thus, theoretically the higher quality the other salaried work
options are, the higher quality your first time entrepreneurs will be. What it implies for data and
measurement is that in order for policymakers to understand entrepreneurship with regard to the
quality of new businesses created, they also need to know about the economic characteristics of
existing opportunities for the incumbent firms.
According to Goedhuys and Sleuwaegen (2000), the desirability of entrepreneurial
activity is related not only to expected payoff13, but also to the individual’s personal profile.
Recent studies have explored psychological characteristics of the successful entrepreneurs and
the potential entrepreneurs in the region. Evidence was found to support the claim that
entrepreneurs in the region are risk tolerant; have a need for autonomy; have a high need for
achievement; and an internal locus of control (Aboal, 2014; CAF, 2013). Other personal
attributes, such as the education levels of the founder/manager may play a role in the likelihood
of success. A recent study in Chile found that managers of high potential young firms were more
likely to have completed tertiary education or higher (Olivari, 2014). Van der Sluis, van Praag,
and Vijverberg (2005) point out that according to the entrepreneurship literature virtually no
attempts have been made to incorporate a measure of ability in ascertaining the returns of
13 The entrepreneur may assume he or she has what it takes to manage and run a business, but might be overly optimistic (Vivarelli [2013] and Naudé [2008] refer to studies regarding the over-optimism of entrepreneurs).

22
educational attainment on entrepreneurial activity (2005).14 This, in addition to further research
dividing up the credit based on the type of education (general/ managerial, specific/technical or
scientific skills), could be welcome contributions to the existing literature.
Programs have been developed to stimulate various aspects of entrepreneurial activity.
Impact evaluations and program evaluations (in the spirit of sharing lessons learned) can be
informative for policymakers with respect to the allocation of resources, and can also be useful to
inform program modifications that can help future program design to be more effective.
4. Recommendations for Further Research and Data Collection
Create a balance scorecard or a basket of indicators for LAC and leverage regional resources to
collect timely and informative indicators about entrepreneurship. A sample scorecard for a
basket of indicators is included in Appendix 1. This could reflect a basket of indicators that could
be collected for countries in the LAC region drawing from a variety of existing international data
sources in some cases, and generating new data nationally and sub-nationally in other cases.
Some data already exist and those who collected that data have already gone through an iterative
process of improving the data collection methods, cleaning the data, and data standardization
processes. When possible, draw on the existing and available data as a start and liaise with
researchers working with those data to encourage regionally relevant improvements. Since the
GEM exists as a forum for surveying individuals in the population, it could be possible to add
specific questions about innovation. In addition, strengthening the quality of the survey design as
well as sampling coverage and sectoral identification can be implemented in order to gain more
insight into a larger sample of entrepreneurial activity.
Move toward more widespread use of public records. The LAC region could begin
working together to build a program similar to the EIP, regarding timely entrepreneurship
indicators on business demographics for interested countries in the region.
Add questions to existing household surveys. To assess who in the LAC population
wanted to start a business but could not for some reason, the most comprehensive approach 14 It would also be interesting to expand the occupational choice decision rule in Goedhuys and Sleuwaegen (2000) to include additional burdens of responsibility that entrepreneurs might incur. As suggested by van der Sluis, van Praag, and Vijverberg (2005), being a wage worker may be easier. If the entrepreneur expects to hire other people as part of a business, there may be considerations that could be included in the psychological profile as to the willingness to take on responsibility for others’ livelihoods. Some types of people may feel the weight of this responsibility more intensively than others.

23
would be to add some specific questions about entrepreneurship to a census or broad household
survey.
Learn more about patterns of entrepreneurship, young and incumbent high performance
(growth) within different industries. A variety of methods could be used to gather more
information about specific industries. Tailoring in depth interviews to sectors that are important
for a particular economy (or economies in the region) and looking for information about their
current challenges and opportunities, could certainly help construct additional survey instruments
that may ask the right questions and ultimately yield more nuanced and precise information.
Conduct a survey—explicitly within industries that are important for that economy—and
ask them not only about their obstacles to operation, but their obstacles and goals for growth.15
Using the data that are easily available online in the Economic Complexity Observatory (ECI)16
it is possible to see a snapshot of a country’s exports, the growth rate over the past five years,
and the country’s imports. This data source permits a quick visual assessment of the most
important exporting sector(s) in an economy, or the ones that have been growing recently. This
information could be combined with the World Bank’s Enterprise Survey data and the obstacles
that have been identified by firms in those previously identified growth or economically
important sectors. This combined information could be a valid starting point for further
qualitative research.
Add survey questions to entry and exit procedures. A highly understudied and important
piece of the entrepreneurship puzzle is what happens to entrepreneurs that exit the market (or
fail)? Perhaps, for the formal sector, when a business wishes to close, a small survey could be
administered to gain insight into this particular area. This would add a procedure to closing a
business and could be hindered by the fact that many businesses stay “on the books” but are
effectively closed, with no sales transactions for years. If implemented, this could be worthwhile
in terms of collecting some information about why enterprises go out of business, especially
15 It is not valid to assume that the obstacles faced by incumbent firms are the same as obstacles that might be faced by potential entrepreneurs, or that those obstacles to current operations are the same as obstacles to growth or scaling up. This could serve as a good starting point under the opportunity cost assumption. 16 Website: http://atlas.media.mit.edu

24
when others in the same industry survive or succeed in growing. Similarly, when a business is
registering, a short survey regarding the reasons for starting the business could be administered.17
Continue developing mechanisms to gather information about traits or characteristics of
successful entrepreneurial endeavors. Once high performance, high growth, or high potential
firms in an economy have been identified and such indicators are tracked on a regular basis, it
will be important to understand if there are commonalities among them. If commonalities exist,
policymakers could work toward promoting traits that are characteristic of high-performance
firms.
Evaluate entrepreneurship programs and share the knowledge gained and lessons learned.
Evaluation of entrepreneurship programs is useful. No one knows how to create the perfect
program on the first try. Just as many entrepreneurial endeavors have failed in the markets, tried
again and then succeeded, programming to support entrepreneurs must allow them to learn along
the way. If programming can be corrected or altered to improve results (i.e., to support growth of
firms in incubator programs rather than the number of firms in incubator programs), that is
progress. Methodological lessons learned can and should be shared among countries in the
region.
5. Conclusions
There are a number of sources from which partial information about entrepreneurship in LAC
can be obtained. For example, to calculate the number of new businesses formally registered in a
given year (or in the last ten years since 2004); it is easy to access that information in the World
Bank’s database. To learn about the motivations for starting a business (formal or informal) one
can consult the GEM. It may be possible to draw inferences about the degree of informal new
business activity by comparing these two databases. To gain knowledge about innovation,
productivity, human capital, or obstacles for a stratified sample of incumbent firms in 2010 or
2006, one can go to the Enterprise Survey data. If the policy interest is about business
demographics, some countries may be able to consult administrative records, however finding
this information in a comparable way is currently a gap in data information in most LAC
17 The results of the survey could possibly be distorted if potential entrepreneurs felt that their answers to the survey would somehow affect whether or not they could be successfully registered. This seems less likely to be a concern on the exit side.

25
countries. Published results about impact evaluations of entrepreneurship programs in the region
are also largely missing. Identifying and prioritizing data needs can frame which indicators can
be drawn from which sources and which ones would require public support and collaboration for
the collection process. This is an effort that requires substantial commitment on the part of
governing and statistical agencies. The benefit would be a deeper understanding of
entrepreneurial dynamics that contribute to aggregate growth.

26
References
Aboal, D. and F. Veneri. 2014. “Entrepreneurs in Latin America.” Washington, DC: Inter-
American Development Bank.
Acs, Z. and P. Mueller. 2008. “Employment Effects of Business Dynamics: Mice, Gazelles and
Elephants.” Small Business Economics 30: 85–100.
Acs, Z., W. Parsons, and S. Tracy. 2008. “High Impact Firms: Gazelles Revisited.” Office of
Advocacy Working Paper. U.S. Small Business Administration.
Audretsch, D. and I. Beckman. 2007. “From Small Business to Entrepreneurship Policy.” In D.
Audretsch, I. Grilo, and R. Thurik (eds.), Handbook of Entrepreneurship Policy.
Cheltenham, UK: Edward Elgar Publishing Limited.
Baumol, W. J. 1990. "Entrepreneurship: Productive, Unproductive, and Destructive." Journal of
Political Economy 98(5): 893–921.
———. 2004. "Education for Innovation: Entrepreneurial Breakthroughs vs. Corporate
Incremental Improvements." NBER Working Paper Series No. 10578. Cambridge, MA:
National Bureau of Economic Research.
Birch, D. and J. Medoff. 1994. “Gazelles.” In L.C. Solmon and A.R. Levenson,, eds., Labor
Markets, Employment Policy and Job Creation. Boulder, CO and London, UK: Westview
Press.
CAF (Corporación Andina de Fomento). 2013. Emprendimientos en América Latina: desde la
subsistencia hacia la transformación productiva. Bogota, Colombia: CAF.
Christensen, C. 2011. The Innovator’s Dilemma. New York, NY: Harper Business.
Carrillo, P. and A. Lopez. 2014. “Regional Heterogeneity in Firm Performance: Evidence from
Ecuador.” Unpublished manuscript.
Coad, A., S-O. Daunfeldt, W. Hölzl, D. Johansson, and P. Nightingale. 2014. “High-Growth
Firms: Introduction to the Special Section.” Industrial Corporate Change 23(1): 91–112.
Crespi, G. 2003. “PyME en Chile: nace, crece y muere: análisis de su desarrollo en los últimos
siete años.” FUNDES.
Delmar F., P. Davidsson, and W. Gartner. 2003. “Arriving at the High-Growth Firm.” Journal of
Business Venturing 18(2): 189–216.

27
Desai, S. 2009. “Measuring Entrepreneurship in Developing Countries.” Research Paper.
Helsinki, Finland: UNU-WIDER.
Gallup Poll. Available at http://www.gallup.com/strategicconsulting/128171/Country-Data-Set-
Details.aspx.
GEM (Global Entrepreneurship Monitor) dataset. Available at
http://www.gemconsortium.org/docs/cat/37/data
GEM (Global Entrepreneurship Monitor) manual. Available at
http://www.gemconsortium.org/docs/2375/gem-manual-design-data-and-quality-control
Gluzmann, P., D. Jaume, and L. Gasparini. 2012. “Decisiones laborales en América Latina: el
caso de los emprendedores. Un estudio sobre la base de encuestas de hogares.” Working
Paper No.137. La Plata, Argentina: Centro de Estudios Distibutivos, Laborales y Sociales
(CEDLAS).
Goedhuys, M. and L. Sleuwaegen. 2000. “Entrepreneurship and Growth of Entrepreneurial
Firms in Cote d'Ivoire.” Journal of Development Studies 36(3): 123–45.
IDB (Inter-American Development Bank). 2012. The Fiscal Institutions of Tomorrow.
Washington, DC: Inter-American Development Bank.
Lederman, D., J. Messina, S. Pienknagura, and J. Rigolini. 2014. Latin American Entrepreneurs:
Many Firms but Little Innovation. Washington, DC: World Bank.
Lerner, J., A. Leamon, and S. García-Robles. 2013. “Best Practices in Creating a Venture Capital
Ecosystem.” Washington, D.C.: Multilateral Investment Fund (MIF/FOMIN).
Monge-Gonzalez, R. and F. Torres. 2014. “The Dynamics of Entrepreneurship in Costa Rica:
An analysis of Firm Entry, Exit and Growth Rates.” Washington, DC: Inter-American
Development Bank.
Naudé, W. 2011. “Entrepreneurship is Not a Binding Constraint on Growth and Development in
the Poorest Countries.” World Development 39(1): 33–44.
———. 2008. "Entrepreneurship in Economic Development." Research paper. UNUWIDER.
Navarro, L. 2014. “Entrepreneurship Policy and Firm Performance: Chile’s CORFO Seed
Capital Program.” IDB Policy Brief No. 230. Washington, DC: Inter-American
Development Bank.

28
OECD (Organisation for Economic Co-operation and Development). 2006a. “Understanding
Entrepreneurship: Developing Indicators for International Comparisons and Assessments.”
Statistics Directorate Working Paper. Paris, France: OECD.
———. 2006b. “A Proposed Framework for Business Demography Statistics.” Statistics
Directorate Working Paper. Paris, France: OECD.
——— .2006c. “The International Comparability of Business Start-up Rates.” Statistics
Directorate Working Paper. Paris, France: OECD.
———.2011. “Gazelles Rate.” In Entrepreneurship at a Glance 2011. Paris, France: OECD
Publishing.
———.2013. “List of Indicators of Entrepreneurial Determinants.” In Entrepreneurship at a
Glance. Paris, France: OECD Publishing.
———. 2014. Entrepreneurship at a Glance 2014. Paris, France: OECD Publishing.
Olivari, J. 2014. “Finding Wally amongst Chilean Entrepreneurs: Characterizing High Potential
Entrepreneurs in Chile.” Washington, DC: Inter-American Development Bank.
Parker, S. 2007. “Policymakers Beware!” In D. Audretsch, I. Gril, I., and R. Thurik (eds.), The
Handbook of Research on Entrepreneurship Policy. Cheltenham, UK: Edward Elgar
Publishing Limited.
Quatraro, F. and M. Vivarelli. 2013. "Drivers of Entrepreneurship and Post-Entry Performance
of Newborn Firms in Developing Countries." IZA Discussion Paper No. 7436. Bonn,
Germany: Institute for the Study of Labor.
RAND Europe. 2010. Data Strategies for Policymaking: Identifying International Good Practice.
Final Report for the European Commission. Santa Monica, CA: RAND.
Ruprah, I., K. Melgarejo, and R. Sierra. 2014. Is there a Caribbean Sclerosis?: Stagnating
Economic Growth in the Caribbean. Washington, DC: Inter-American Development
Bank.
Szirmai, A., W. Naudé, and M. Goedhuys. 2011. “Entrepreneurship, Innovation, and Dconomic
Development.” Oxford and New York: Oxford University Press.
Syverson, C. 2011. “What Determines Productivity?” Journal of Economic Literature 49(2):
326–65.
Urzua, S. and R. Espinoza. 2014. “Firm Dynamics in Chile: Evidence from Matched Employer-
Employee Data: Final report.” Washington, DC: Inter-American Development Bank.
29
van der Sluis, J., M. van Praag, and W. Vijverberg. 2005. “Entrepreneurship Selection and
Performance: A Meta-Analysis of the Impact of Education in Developing Economies.”
The World Bank Economic Review 19(2): 225–61.
Vivarelli, M. 2013. “Is Entrepreneurship Necessarily Good? Microeconomic Evidence from
Developed and Developing Countries.” Industrial and Corporate Change 22(6): 1453–95.
Wagner, R. 2014. “Promoting Entrepreneurship: The Start-Up and Scale-Up of High-
Productivity Firms.” In Crespi, G., Fernández-Arias, E. and E. Stein (eds.), Rethinking
Productive Development: Sound Policies and Institutions for Economic Transformation.
Development in the Americas Series. Washington, DC: Inter-American Development
Bank-Palgrave-Macmillan.
Wennekers, S. and R. Thurik. 1999. “Linking Entrepreneurship and Economic Growth.” Small
Business Economics 13(1): 27–56.
World Bank. “Doing Business.” Washington, DC: World Bank. Available at
http://www.doingbusiness.org
———. Enterprise Surveys. Washington, DC: World Bank. Available at
http://www.enterprisesurveys.org.
Yago, G., J. Barth, and B. Zaidman. 2008. Entrepreneurship in Emerging Domestic Markets:
Barriers and Innovation. Santa Monica, CA: Milken Institute.

30
Appendix 1: Balance Scorecard
Demography of the firms Exports Imports
Manufacture Services
New firms
N Non-traditional Non-traditional
P*Q New products New products L High tech High tech ∆L Services Services
High growth
N Licenses P*Q L TLC (cost of use) ∆L
Lags Manufacture Services
Bankruptcy Patents USTPO Delays National Trademarks USTPO Franchises National Female entrepreneurship Access and cost of credit Minority groups entrepreneurship
Energy (generation and cost)
FDI Innovation in tourism
Scientific production (citations)
Source: Developed by Rodrigo Wagner with support from CTI. Notes: New firms: firms with less than two years. Lag refers to the time between the registration of the new company and the first sale (J curve). Delays refer to the elapsed time since the last sale and the legal closing of the firm.