environmental determinants of enteric infectious disease
TRANSCRIPT

Environmental Determinants of Enteric Infectious Disease
PI: BENJAMIN ZAITCHIK, JOHNS HOPKINS UNIVERSITYCO-I: MARGARET KOSEK, UNIVERSITY OF VIRGINIACO-I: HAMADA BADR, JOHNS HOPKINS UNIVERSITYCO-I: J IM NELSON, BRIGHAM YOUNG UNIVERSITYPOSTDOC: JOSH COLSTON, UNIVERSITY OF VIRGINIA
MortalityGlobally, diarrhea kills 2,195 children every dayThis is 1 out of 9 child deaths, worldwide
It is more than AIDS, malaria, and measles combined
It is the second leading cause of death in children less than five years old
Liu et al. (2012)
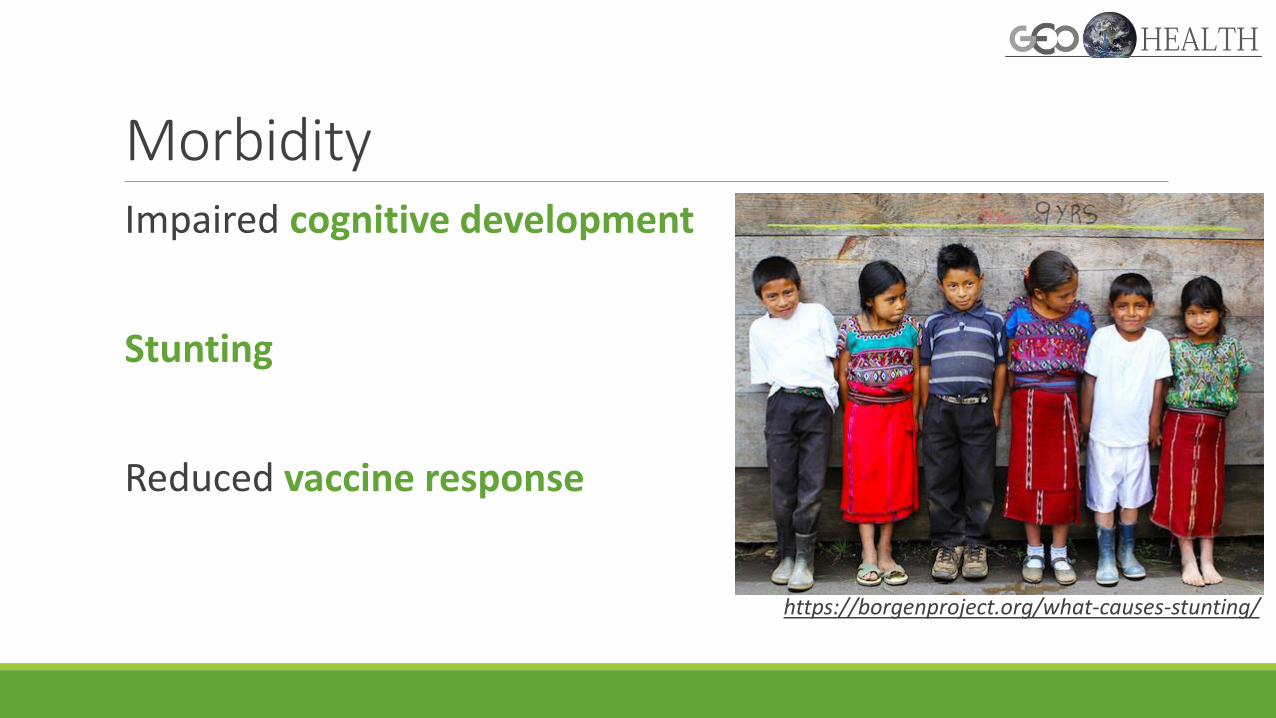
MorbidityImpaired cognitive development
Stunting
Reduced vaccine response
https://borgenproject.org/what-causes-stunting/

EID are preventable and treatableIn some cases, vaccines are available
Improved Water, Sanitation and Hygiene (WASH) infrastructure and behavior is critical
Those suffering from diarrhea can be treated with oral rehydration therapy
Hector Retamal/AFP/Getty Images

Project goal
Establish the feasibility of Earth Observation-informed EID risk mapping, monitoring, and prediction systems
We are doing this through collaboration with multiple EID studies performed at sites around the world
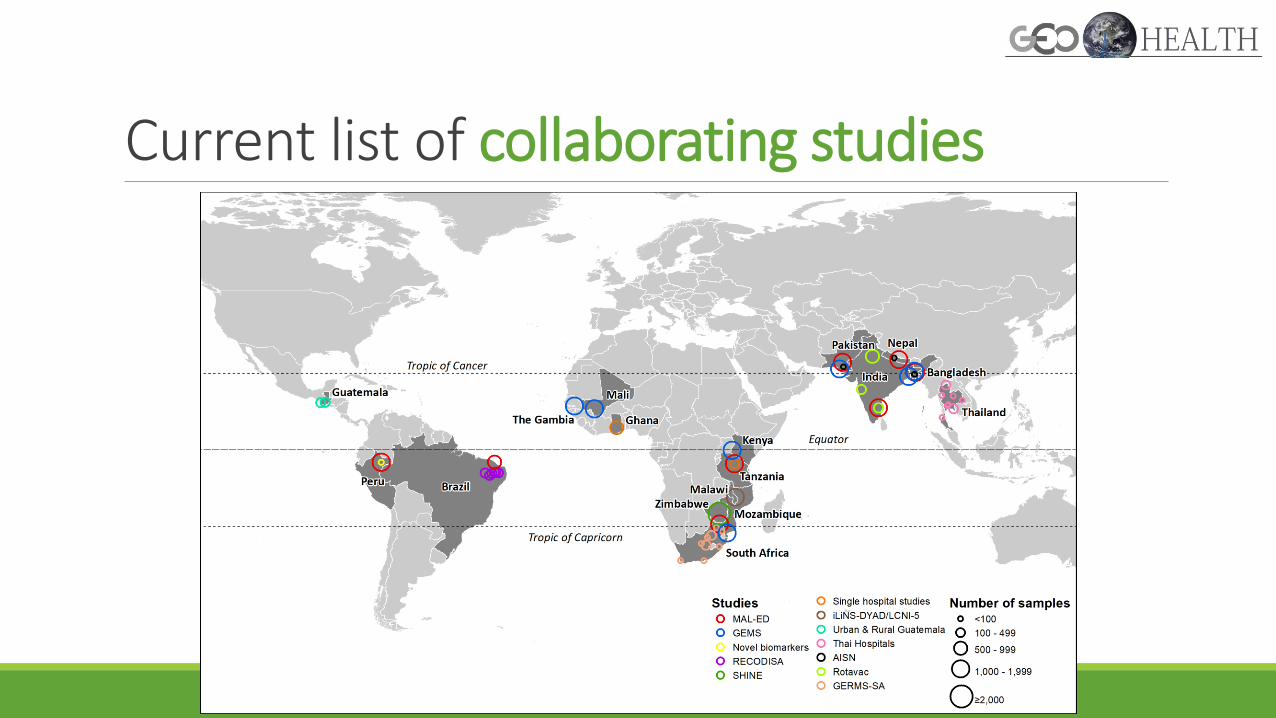
Current list of collaborating studies

Earth Observation data
None of these infection studies included collection of data on climate or environment.
Earth Observations offer an opportunity to fill this gap.
Colston et al. (2018)

AccomplishmentsPY1:
1. Evaluated EO performance at MAL-ED sites, and published results collaboratively with MAL-ED site PIs (Colston et al., 2018)
2. Generated a preliminary rotavirus prediction model based on MAL-ED site data and Earth Observations
PY2:
1. Published the results of the rotavirus model collaboratively with site PIs (Colston et al., 2019)
2. Performed preliminary regionalization based on rotavirus predictors
3. Built template visualization app in Tethys
4. Participated in NASA’s pilot commercial data buy program
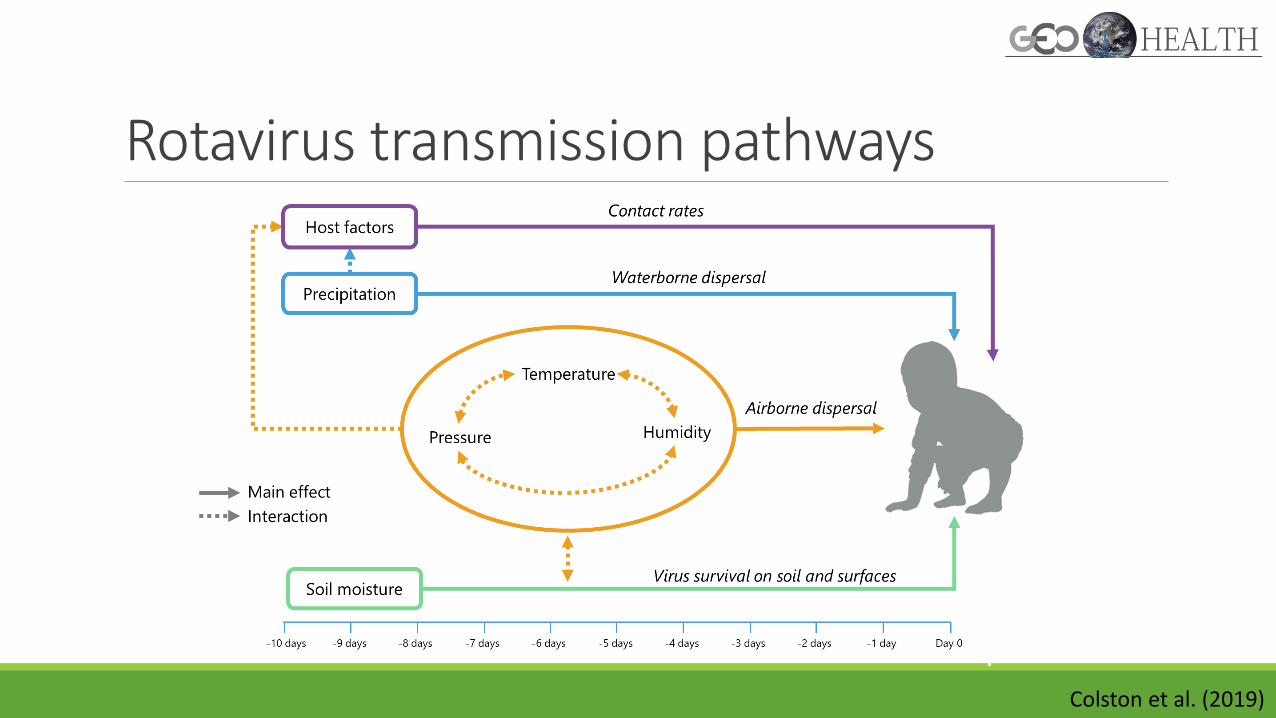
Rotavirus transmission pathways
Colston et al. (2019)
AccomplishmentsPY3:
1. Performed a targeted study of ENSO influence on EID at our Peru MAL-ED site (Colston et al., 2019)
2. Substantially enhanced our database of predictor variables
3. Nearly completed models of Shigella
4. Produced maps of Shigella risk for dissemination to partners

Impacts of the 2011-2012 La Nina floods on enteric infections in Santa Clara, Peru
Colston et al. (2020)

Shigella modeling results

Shigella modeling results

Variable Importance Plot
Impurity-corrected Random Forest;Unconditional permutation scheme;cross-validated results
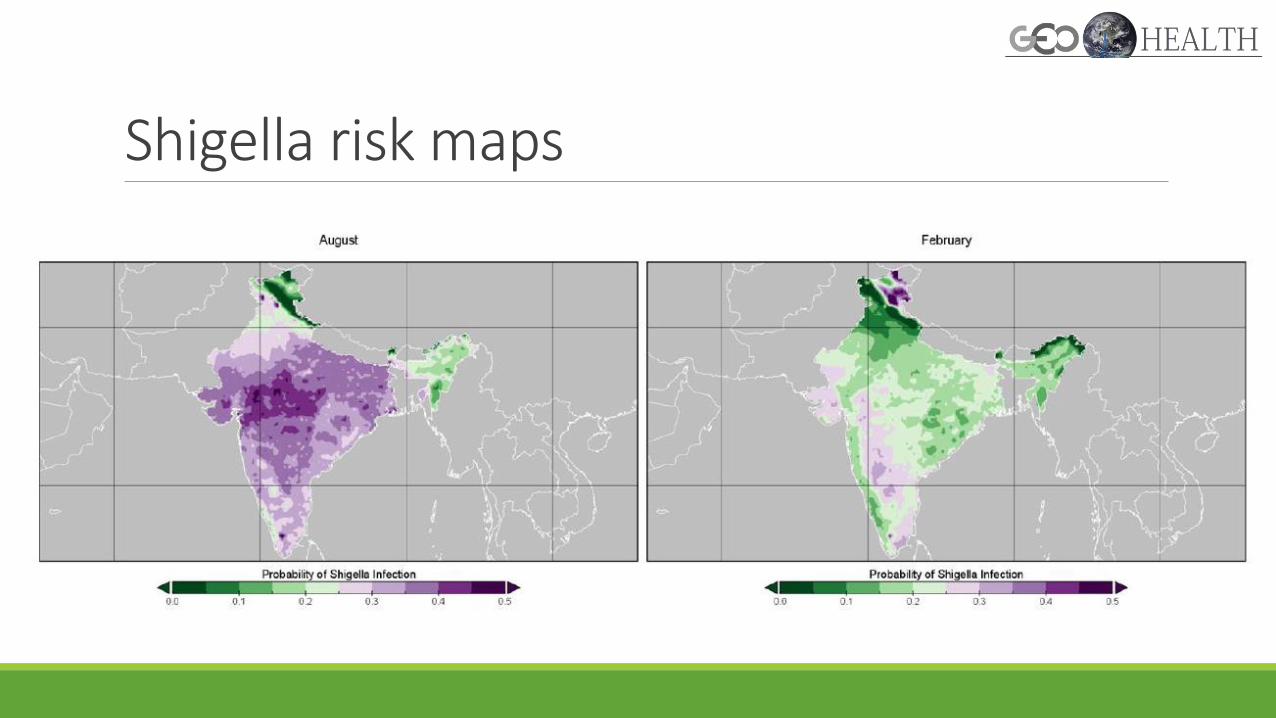
Shigella risk maps

Understanding mechanism

Understanding mechanism
Precipitation RH Soil Moisture Solar Rad Surface Pres Temperature Wind Speed Runoff

Timeline and RisksRisks
COVID has slowed our research and communication with health system partners
Slower feedback might limit the number of pathogens we can address by the end of the project
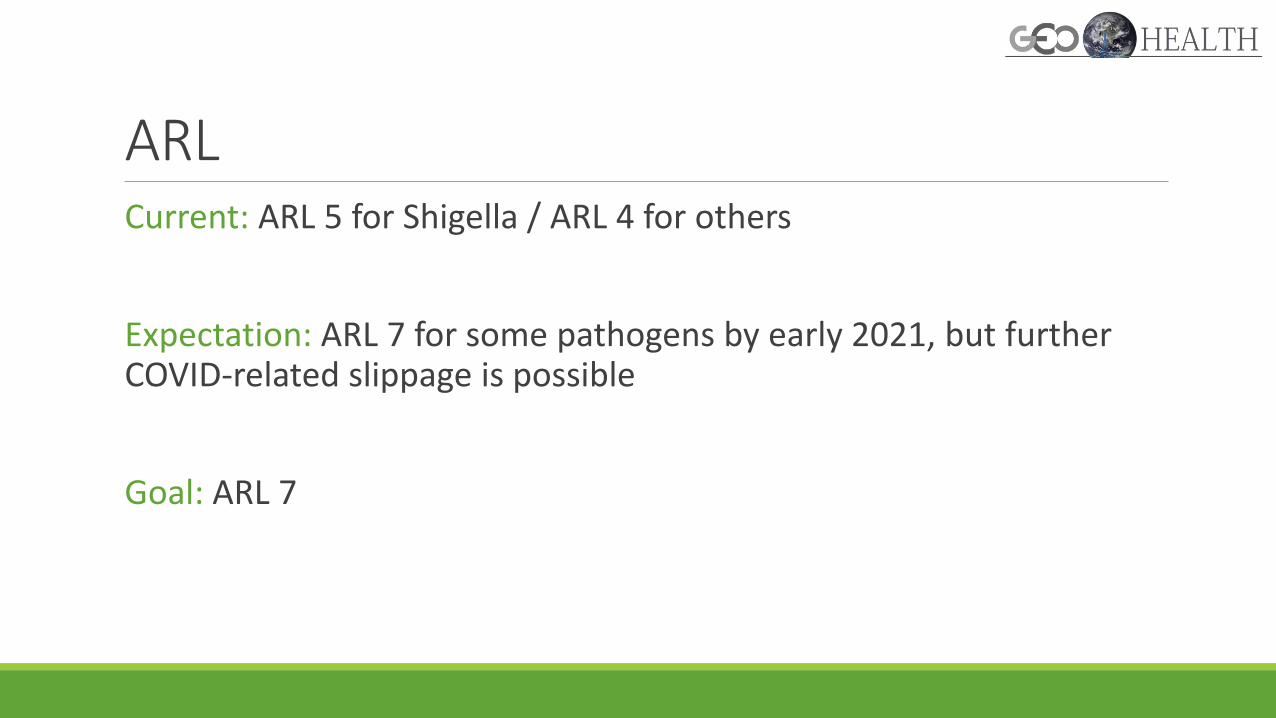
ARLCurrent: ARL 5 for Shigella / ARL 4 for others
Expectation: ARL 7 for some pathogens by early 2021, but further COVID-related slippage is possible
Goal: ARL 7

COVID-19BEN ZAITCHIK, HAMADA BADR, LAUREN GARDNER, JUSTIN LESSLER – JHU
MARGARET KOSEK, JOSH COLSTON - UVA

Redon & Serrano-Aroca (2020)

Why?A short and unreliable COVID-19 data record
Inconsistent and sometimes inappropriate definition of response variable
Inconsistent and sometimes inappropriate scales of analysis
Difficulty of accounting for non-meteorological predictors: behavior, policy, demographics, cultural practices, etc.
Differences between climate zones
Diverse and sometimes questionable methodologies
Challenge of isolating climate influence early in the pandemic
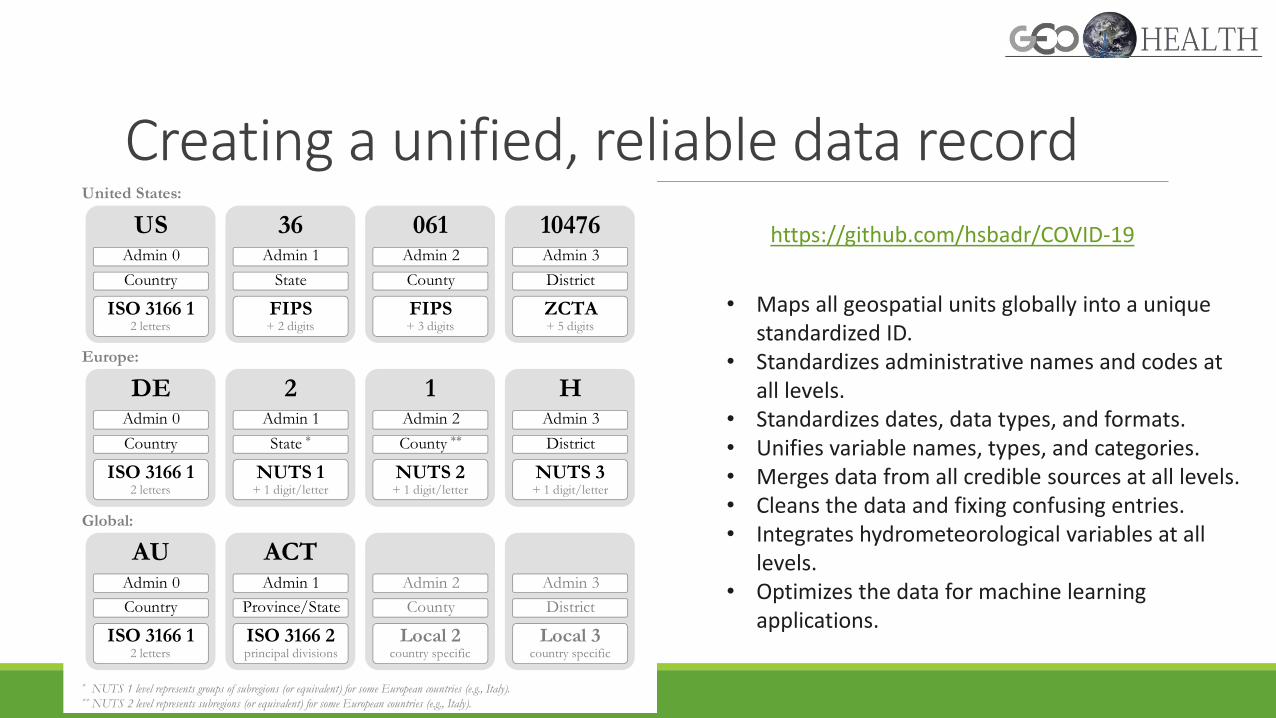
Creating a unified, reliable data record
https://github.com/hsbadr/COVID-19
• Maps all geospatial units globally into a unique standardized ID.
• Standardizes administrative names and codes at all levels.
• Standardizes dates, data types, and formats.• Unifies variable names, types, and categories.• Merges data from all credible sources at all levels.• Cleans the data and fixing confusing entries.• Integrates hydrometeorological variables at all
levels.• Optimizes the data for machine learning
applications.
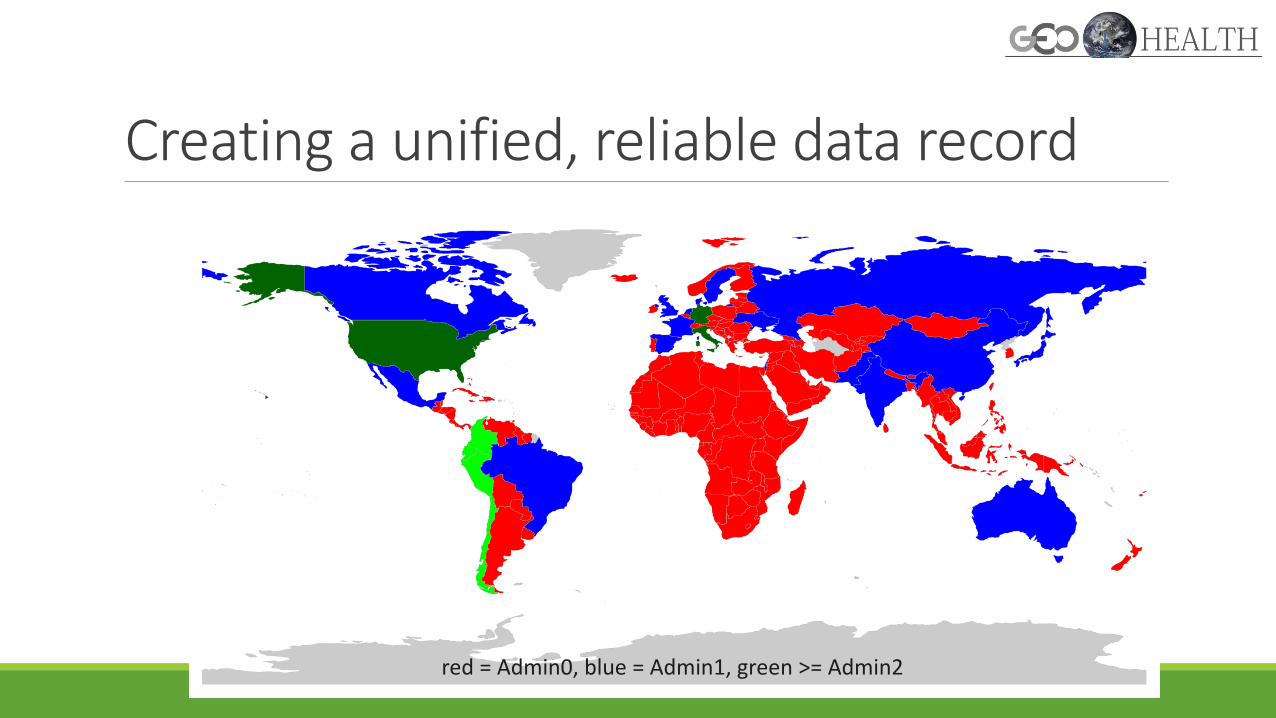
Creating a unified, reliable data record
red = Admin0, blue = Admin1, green >= Admin2
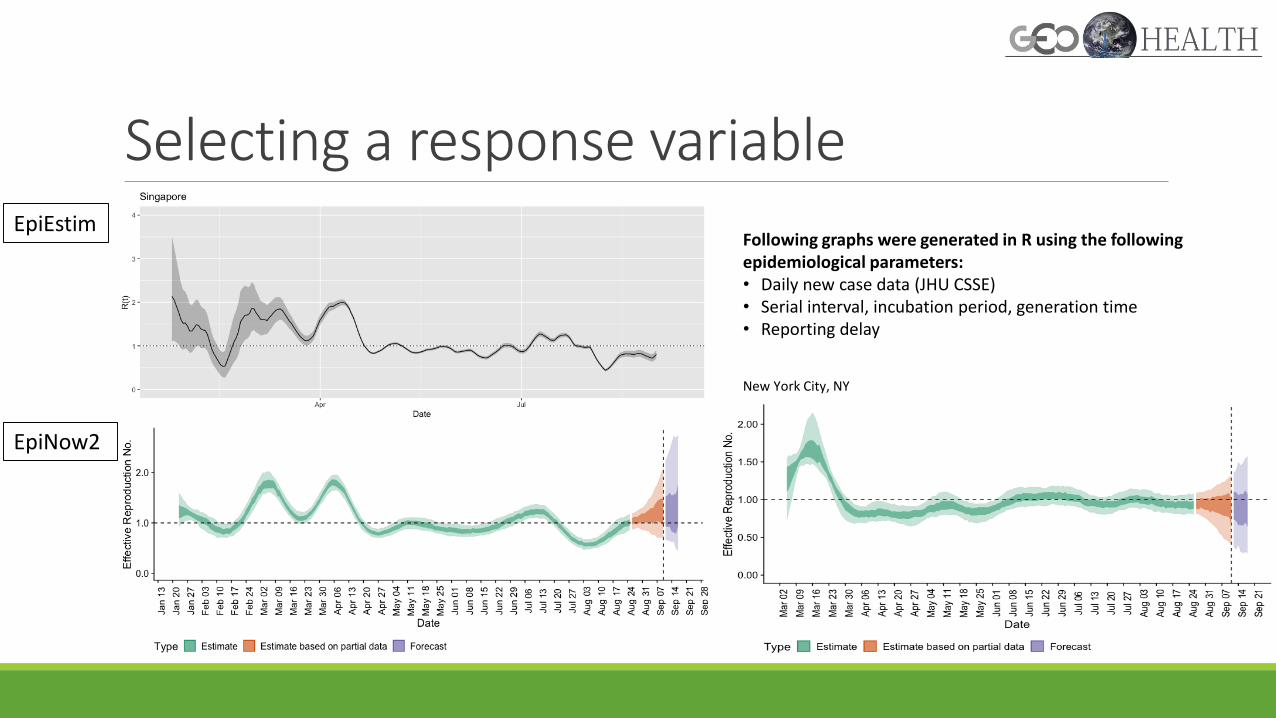
Selecting a response variable
New York City, NY
EpiEstim
EpiNow2
Following graphs were generated in R using the following epidemiological parameters:• Daily new case data (JHU CSSE)• Serial interval, incubation period, generation time• Reporting delay

Hydrometeorological dataWe have a “long list” of EO to incorporate, but for now we are focused on hydrometeorology drawn from reanalysis (NLDAS, MERRA2/FIPS and ERA5) and satellite-derived data (GPM)
Daily, spatially averaged to unit of COVID-19 case data in the harmonized database

Non-environmental covariatesDemographics
cases deaths
excess
deaths population
pop.
Density
incidence
score Accessibility
intervention
data
Mobility
mobility
Colombia 2 2 2 2 2 *1 2 1
Peru 3 3 0* 3 3 3 3 *0 2 1
Chile 2 1* 2 2 2 2 *~1 1 1
Ecuador 1 1 1 1 1 1 1 *1 1 1
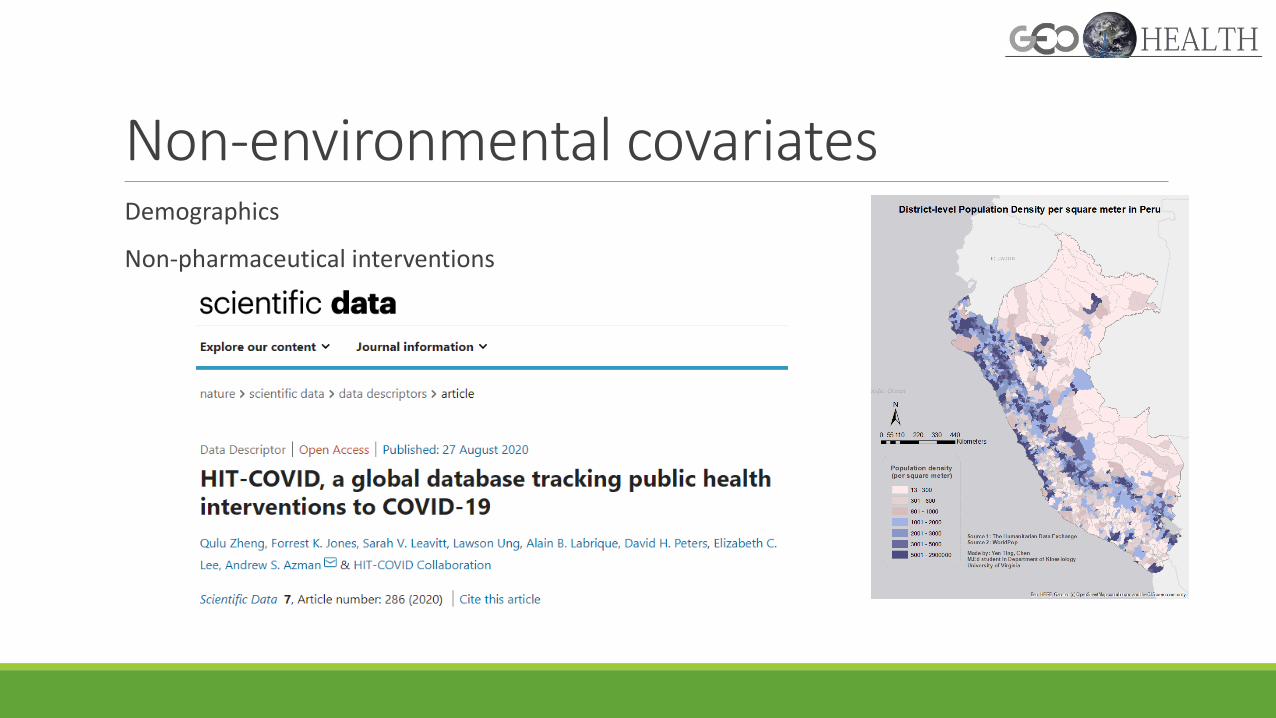
Non-environmental covariatesDemographics
Non-pharmaceutical interventions
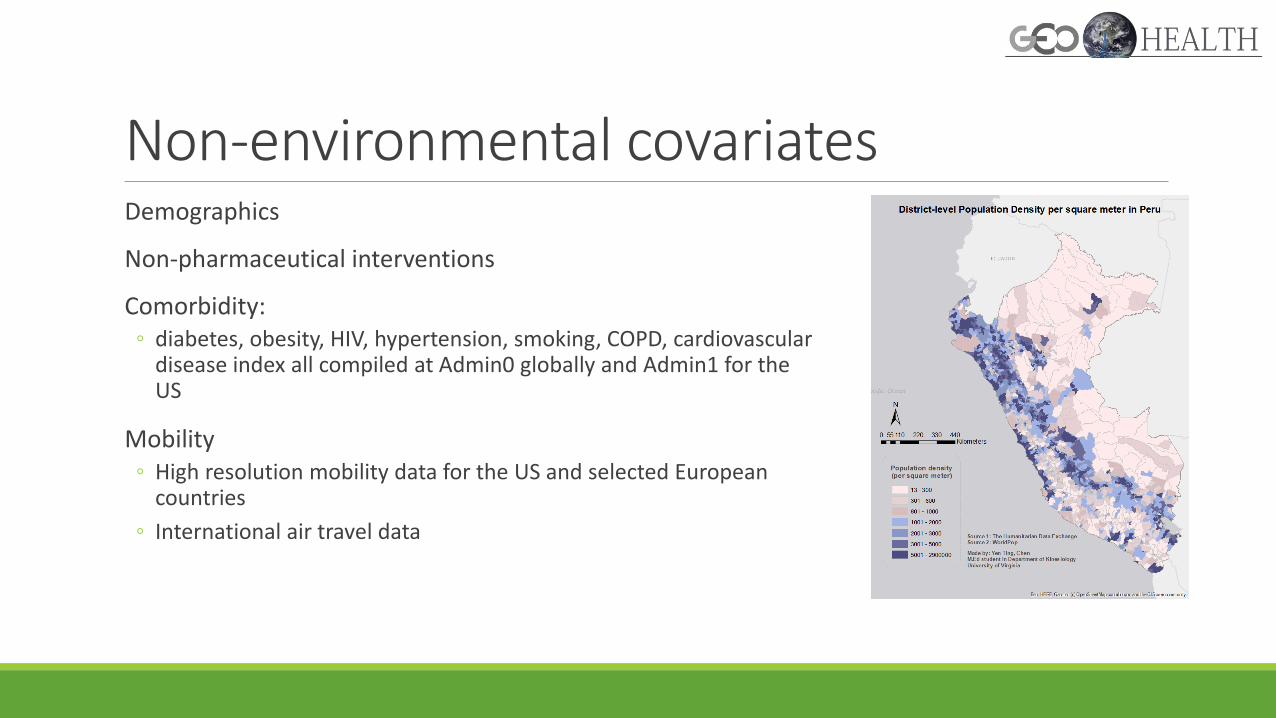
Non-environmental covariatesDemographics
Non-pharmaceutical interventions
Comorbidity: ◦ diabetes, obesity, HIV, hypertension, smoking, COPD, cardiovascular
disease index all compiled at Admin0 globally and Admin1 for the US
Mobility◦ High resolution mobility data for the US and selected European
countries
◦ International air travel data

Current analyses:1. Global analysis at national level, covering ~187 countries
2. Higher-resolution global analysis at Admin 1
3. Detailed analysis for selected countries: US, Germany, Italy, Colombia, Peru, Ecuador, Chile

Collaboration across the AST!Our EO database has been leveraged for:
◦ COVID-19 stay at home orders and heat-related illness by Suwei Wang (Julia Gohlke’s group)
◦ County-level analysis of COVID-19 risk for the US by Bill Pan’s group

Budget: end of July
TITLE Funded To Date
Total Expenses through
7/31/2020Balace through
7/2020Projected Expenses
through Project
Projected End Balance (direct &
Indirect)
Projected End Balance (direct
only)
JHU-EPS $409,319 $282,087 $127,232 $100,379.65 $26,852 $16,398
JHU-SPH $143,484 $137,000 $6,484 $0 $6,484 $3,960
Subaward BYU $65,875 $62,703 $3,172 $3,172 $0
Subaward UVA $286,847 $119,980 $166,867 $166,867
$200,203

Thank You