environmental energy technologies division energy analysis department the costs and benefits of...
TRANSCRIPT
Environmental Energy Technologies Division • Energy Analysis Department
The Costs and Benefits of State RPS Policies: Cost-Impact Studies, Actual
Costs, and Cost Containment
Ryan H. Wiser
Lawrence Berkeley National [email protected] (510.486.5474)
Oregon Renewable Energy Working Group May 31, 2006
Environmental Energy Technologies Division • Energy Analysis Department2
Presentation Overview
1. Review of State/Utility RPS Cost-Impact StudiesA. Project Motivation and Scope
B. Projected Renewable Resource and Direct Cost Results
C. Projected Benefits
D. Cost Study Methodologies and Assumptions
E. Conclusions and Areas for Improvement
2. Actual Costs of State RPS Policies to Date
3. Approaches to Limit RPS Costs
4. Impact of RPS Design on Expected Cost
Environmental Energy Technologies Division • Energy Analysis Department3
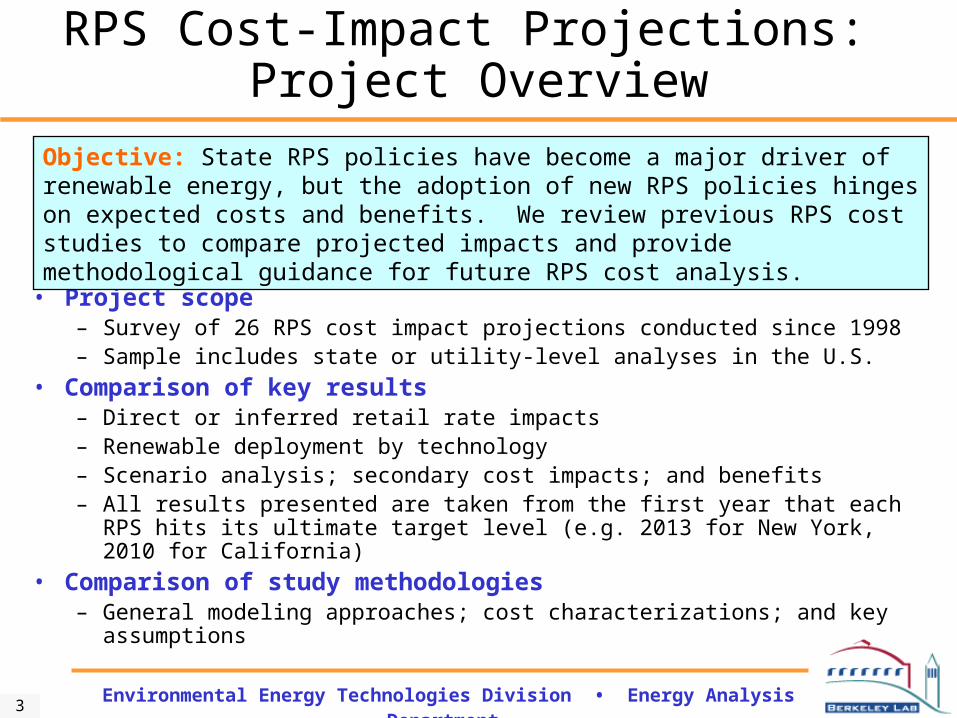
RPS Cost-Impact Projections: Project Overview
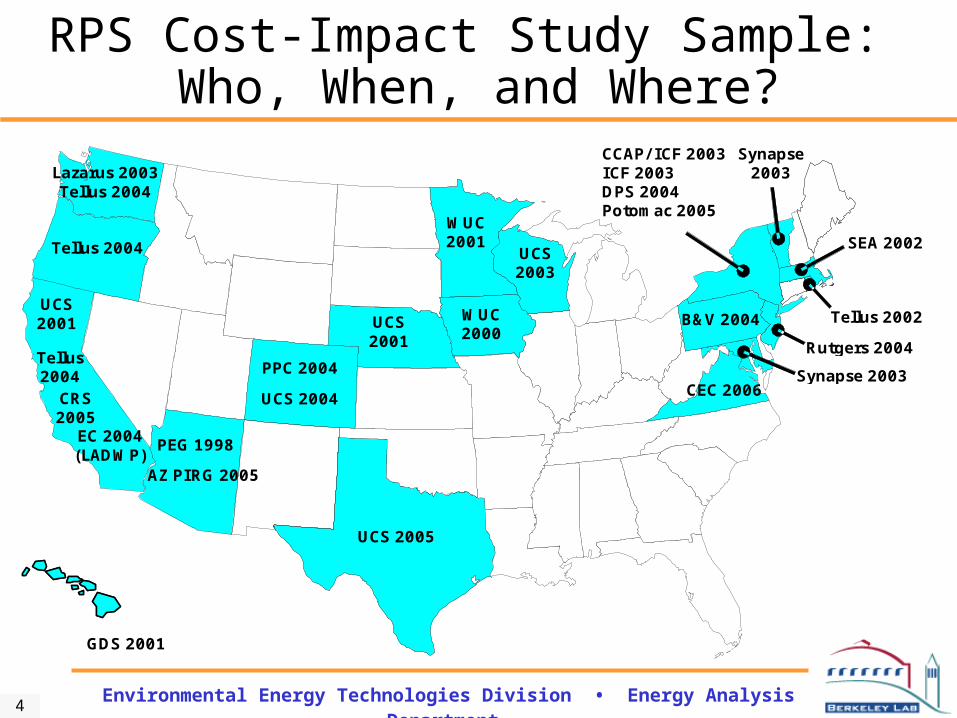
• Project scope– Survey of 26 RPS cost impact projections conducted since 1998– Sample includes state or utility-level analyses in the U.S.
• Comparison of key results– Direct or inferred retail rate impacts– Renewable deployment by technology– Scenario analysis; secondary cost impacts; and benefits– All results presented are taken from the first year that each RPS hits its
ultimate target level (e.g. 2013 for New York, 2010 for California)
• Comparison of study methodologies– General modeling approaches; cost characterizations; and key assumptions
Objective: State RPS policies have become a major driver of renewable energy, but the adoption of new RPS policies hinges on expected costs and benefits. We review previous RPS cost studies to compare projected impacts and provide methodological guidance for future RPS cost analysis.
Environmental Energy Technologies Division • Energy Analysis Department4
RPS Cost-Impact Study Sample: Who, When, and Where?
Synapse 2003
Synapse 2003
Rutgers 2004
Tellus 2002
SEA 2002
GDS 2001
EC 2004 (LADWP)
Lazarus 2003 Tellus 2004
PPC 2004
UCS 2004
PEG 1998
AZ PIRG 2005
UCS 2005
UCS 2003
WUC 2000
WUC 2001
B&V 2004 UCS 2001 UCS
2001
CCAP/ ICF 2003 ICF 2003 DPS 2004 Potomac 2005
Tellus 2004
Tellus 2004
CRS 2005
CEC 2006
Environmental Energy Technologies Division • Energy Analysis Department5
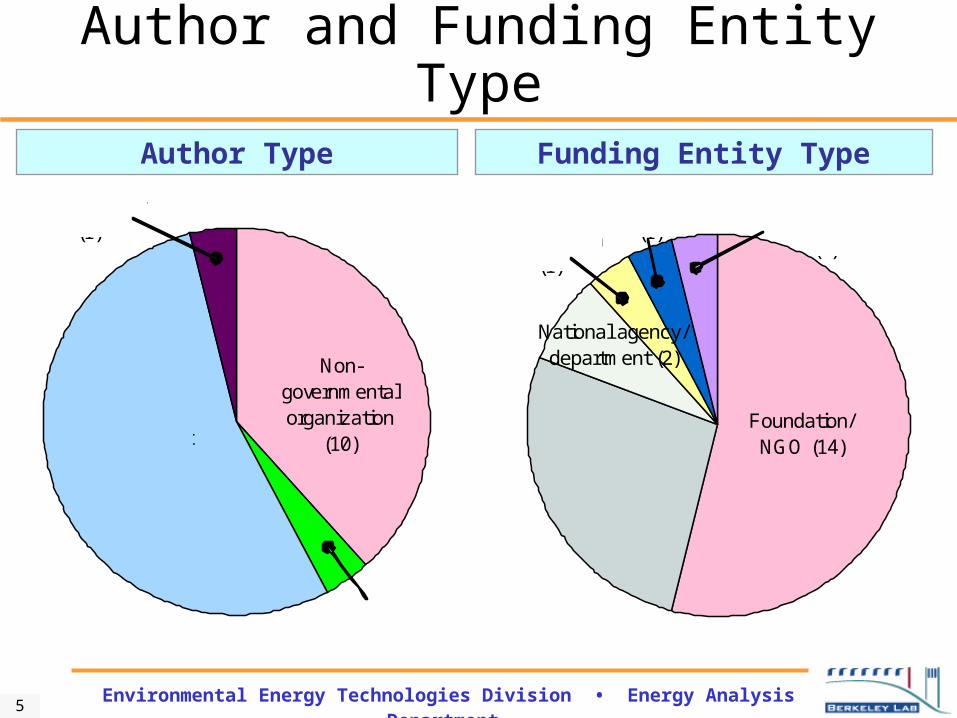
Author and Funding Entity Type
Consultant(14)
Academic(1)
State agency(1)
Non-governmental organization
(10)State
commission/ agency (7)
Trade organization
(1)
Utility group(1)
National agency/department (2)
ISO(1)
Foundation/NGO (14)
Author Type Funding Entity Type
Environmental Energy Technologies Division • Energy Analysis Department6
-
10,000
20,000
30,000
40,000V
T (
Syn
apse
)
RI
(Tel
lus)
MA
(S
EA
)
NY
(C
CA
P)
NY
(D
PS
)
PA
(B
&V
)
VA
(C
EC
)
NE
(U
CS
)
IA (
WU
C)
MN
(W
UC
)
WI
(UC
S)
TX
(U
CS
)
HI
(GD
S)
AZ
(P
EG
)
CO
(U
CS
)
CO
(P
PC
)
OR
(T
ellu
s)
WA
(T
ellu
s)
WA
(La
zaru
s)
AZ
(P
IRG
)
CA
(T
ellu
s)
CA
(U
CS
)
CA
(C
RS
)
Gen
erat
ion
in 1
st P
eak
Tar
get Y
r. (
GW
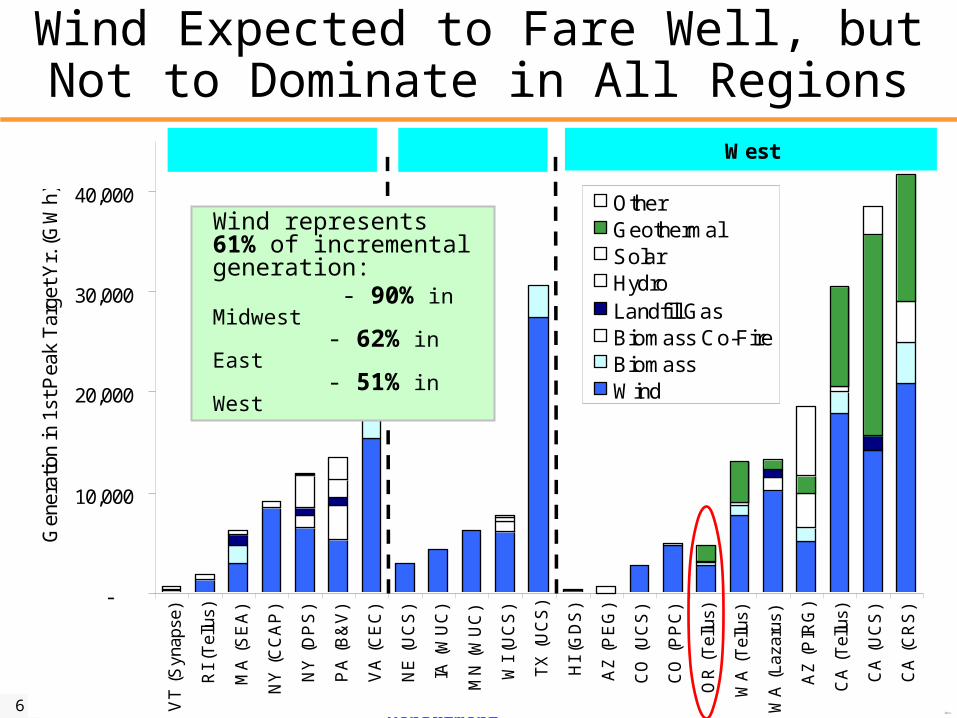
h) OtherGeothermalSolarHydroLandfill GasBiomass Co-FireBiomassWind
MidwestEast West
Wind Expected to Fare Well, but Not to Dominate in All Regions
Wind represents 61% of incremental generation: - 90% in Midwest - 62% in East - 51% in West
Environmental Energy Technologies Division • Energy Analysis Department7
20 of 28* Analyses Predict Rate Increases of Less Than or Equal to 1%
* Number of analyses is more than 26 because results for each state in CA/OR/WA (Tellus) are shown separately
-6%
-3%
0%
3%
6%
9%
12%
TX
(U
CS
) -
3%
CA
(T
ellu
s) -
11%
HI (
GD
S)
- 4%
CA
(U
CS
) -
13%
OR
(T
ellu
s) -
11%
PA
(B
&V
) -
7%
CO
(P
PC
) -
9%
CA
(C
RS
) -
17%
WA
(La
zaru
s) -
15%
NY
(D
PS
) -
8%
CO
(U
CS
) -
6%
NE
(U
CS
) -
10%
IA (
WU
C)
- 9%
WI (
UC
S)
- 9%
NY
(P
otom
ac)
- 7%
MD
(S
ynap
se)
- 8%
VT
(S
ynap
se)
- 10
%
VA
(C
EC
) -
17%
AZ
(P
EG
) -
1%
MN
(W
UC
) -
9%
CA
(LA
DW
P)
- 20
%
MA
(S
EA
) -
7%
WA
(T
ellu
s) -
17%
NY
(C
CA
P)
- 5%
NJ
(Rut
gers
) -
14%
RI (
Tel
lus)
- 1
8%
AZ
(P
IRG
) -
20%
NY
(IC
F)
- 8%
Study - Incremental RPS Target %
-0.50
-0.25
0.00
0.25
0.50
0.75
1.00
Average retail (% - left axis)
Average retail (¢/kWh - right axis)
Median retail rate increase = +0.7%Median change in retail rates = +0.04¢5 analyses predict rate savings
Cha
nge
in
Rat
es in
1st
Pea
k T
arge
t Y
r.
Cha
nge
in R
ates
in 1
st P
eak
Tar
get
Yr.
(20
03 ¢
/kW
h)
Environmental Energy Technologies Division • Energy Analysis Department8
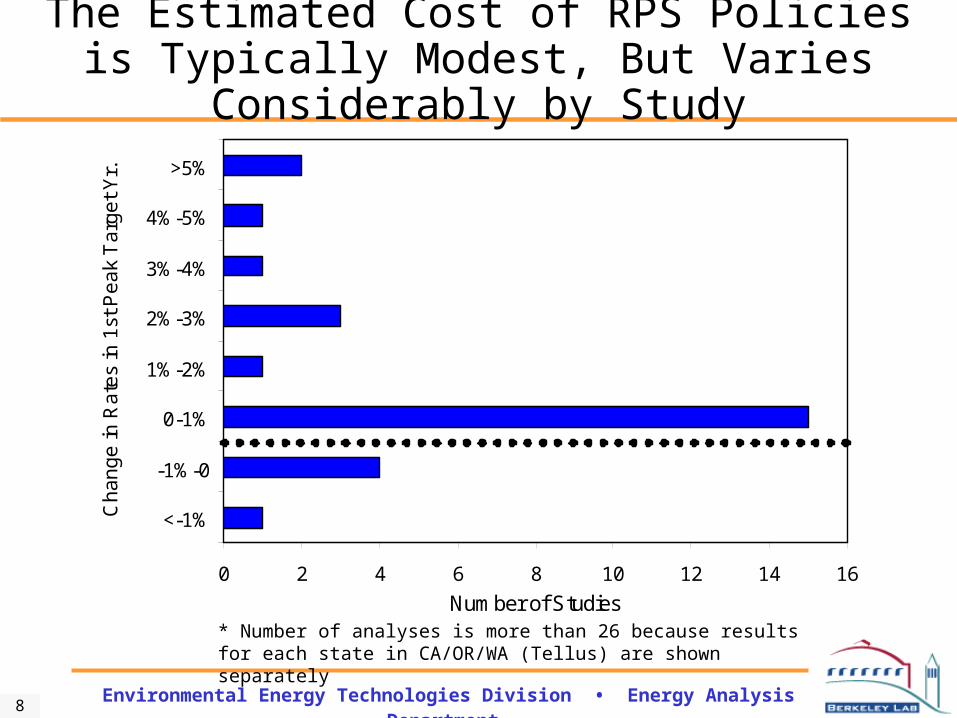
0 2 4 6 8 10 12 14 16
<-1%
-1%-0
0-1%
1%-2%
2%-3%
3%-4%
4%-5%
>5%
Ch
an
ge
in R
ate
s in
1st
Pe
ak
Ta
rge
t Y
r.
Number of Studies
The Estimated Cost of RPS Policies is Typically Modest, But Varies Considerably by Study
* Number of analyses is more than 26 because results for each state in CA/OR/WA (Tellus) are shown separately
Environmental Energy Technologies Division • Energy Analysis Department9
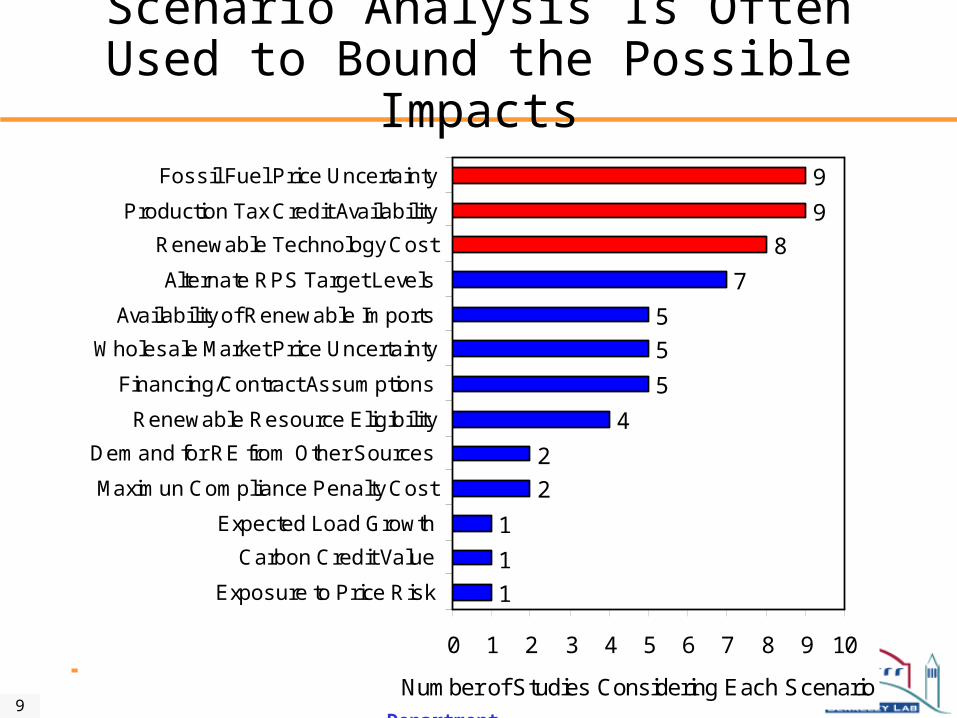
Scenario Analysis Is Often Used to Bound the Possible Impacts
1
1
1
2
2
4
5
5
5
7
8
9
9
0 1 2 3 4 5 6 7 8 9 10
Exposure to Price Risk
Carbon Credit Value
Expected Load Growth
Maximun Compliance Penalty Cost
Demand for RE from Other Sources
Renewable Resource Eligibility
Financing/Contract Assumptions
Wholesale Market Price Uncertainty
Availability of Renewable Imports
Alternate RPS Target Levels
Renewable Technology Cost
Production Tax Credit Availability
Fossil Fuel Price Uncertainty
Number of Studies Considering Each Scenario
Environmental Energy Technologies Division • Energy Analysis Department10
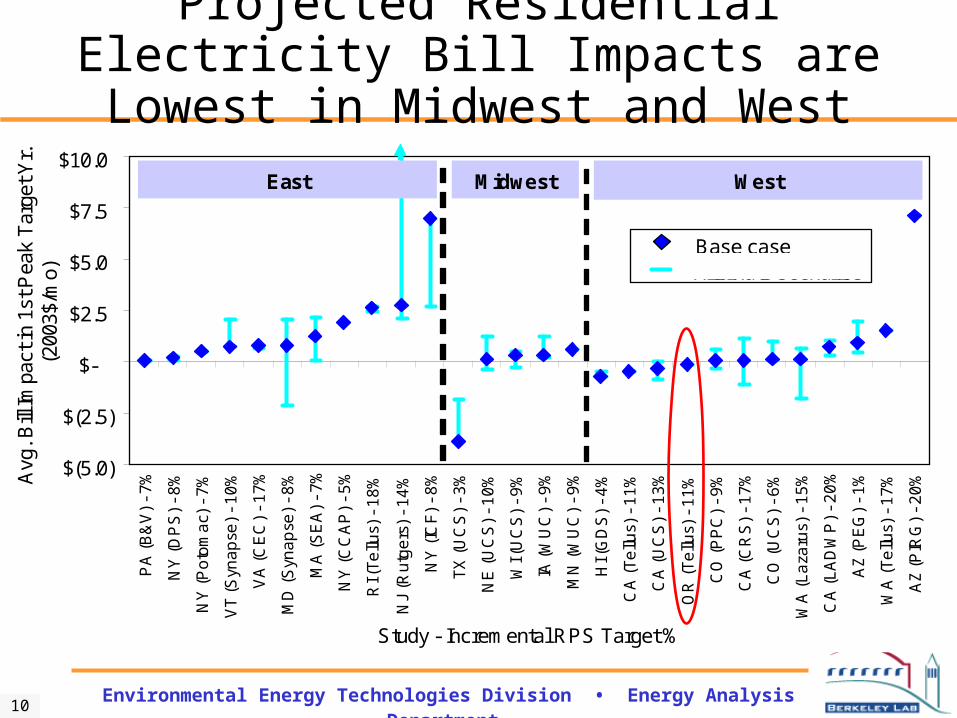
Projected Residential Electricity Bill Impacts are Lowest in Midwest and West
$(5.0)
$(2.5)
$-
$2.5
$5.0
$7.5
$10.0P
A (
B&
V)
- 7
%
NY
(D
PS
) -
8%
NY
(P
oto
ma
c) -
7%
VT
(S
yna
pse
) -
10
%
VA
(C
EC
) -
17
%
MD
(S
yna
pse
) -
8%
MA
(S
EA
) -
7%
NY
(C
CA
P)
- 5
%
RI (
Te
llus)
- 1
8%
NJ
(Ru
tge
rs)
- 1
4%
NY
(IC
F)
- 8
%
TX
(U
CS
) -
3%
NE
(U
CS
) -
10
%
WI (
UC
S)
- 9
%
IA (
WU
C)
- 9
%
MN
(W
UC
) -
9%
HI (
GD
S)
- 4
%
CA
(T
ellu
s) -
11
%
CA
(U
CS
) -
13
%
OR
(T
ellu
s) -
11
%
CO
(P
PC
) -
9%
CA
(C
RS
) -
17
%
CO
(U
CS
) -
6%
WA
(L
aza
rus)
- 1
5%
CA
(L
AD
WP
) -
20
%
AZ
(P
EG
) -
1%
WA
(T
ellu
s) -
17
%
AZ
(P
IRG
) -
20
%
Study - Incremental RPS Target %
Avg
. Bill
Impa
ct in
1st
Pea
k T
arge
t Yr.
(2
003$
/mo)
$16.8
East WestMidwest
Base caseAlternate scenarios
Environmental Energy Technologies Division • Energy Analysis Department11
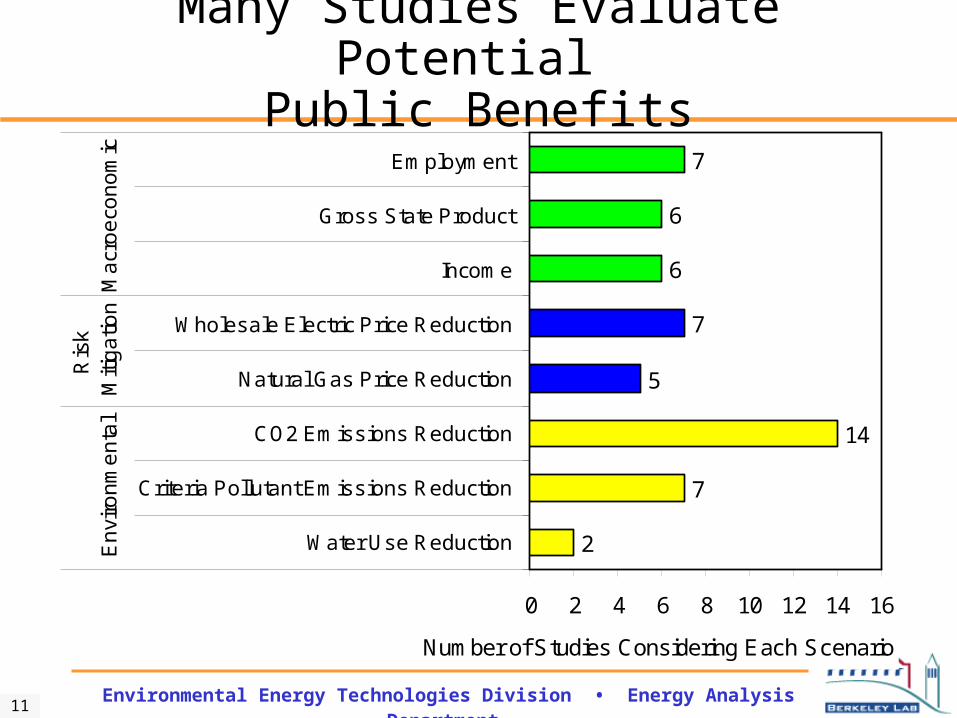
Many Studies Evaluate Potential Public Benefits
2
7
14
5
7
6
6
7
0 2 4 6 8 10 12 14 16
Water Use Reduction
Criteria Pollutant Emissions Reduction
CO2 Emissions Reduction
Natural Gas Price Reduction
Wholesale Electric Price Reduction
Income
Gross State Product
Employment
En
viro
nm
en
tal
Ris
k M
itig
atio
nM
acr
oe
con
om
ic
Number of Studies Considering Each Scenario
Environmental Energy Technologies Division • Energy Analysis Department12
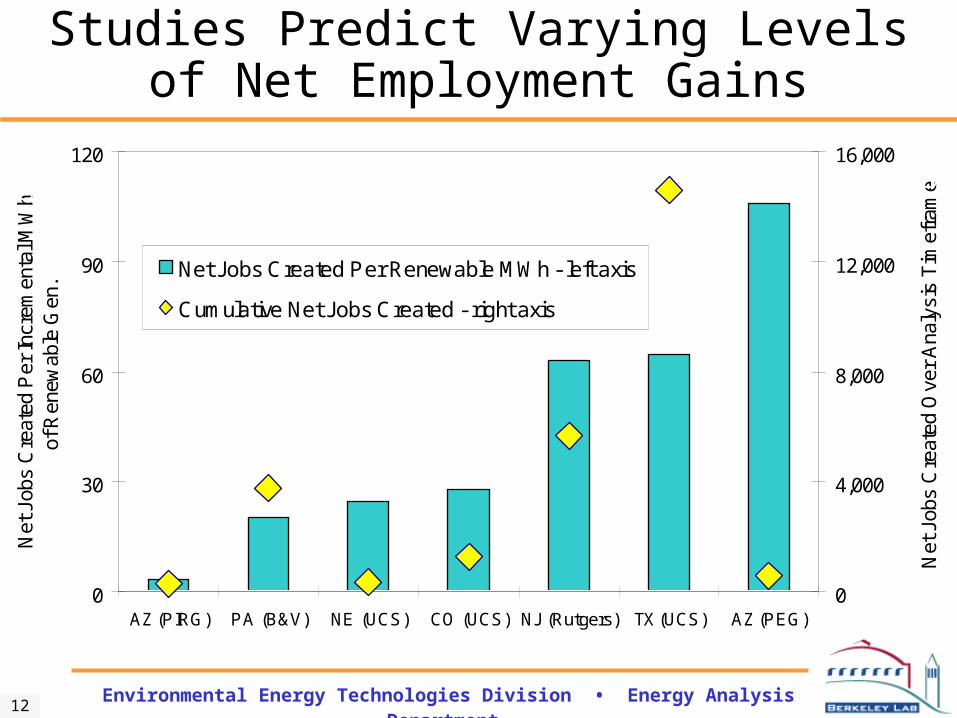
Studies Predict Varying Levels of Net Employment Gains
0
30
60
90
120
AZ (PIRG) PA (B&V) NE (UCS) CO (UCS) NJ (Rutgers) TX (UCS) AZ (PEG)
Net
Job
s C
reat
ed P
er In
crem
enta
l MW
hO
of R
enew
able
Gen
.
0
4,000
8,000
12,000
16,000
Net
Job
s C
reat
ed O
ver
Ana
lysi
s T
imef
ram
eO
Net Jobs Created Per Renewable MWh - left axis
Cumulative Net Jobs Created - right axis
Environmental Energy Technologies Division • Energy Analysis Department13
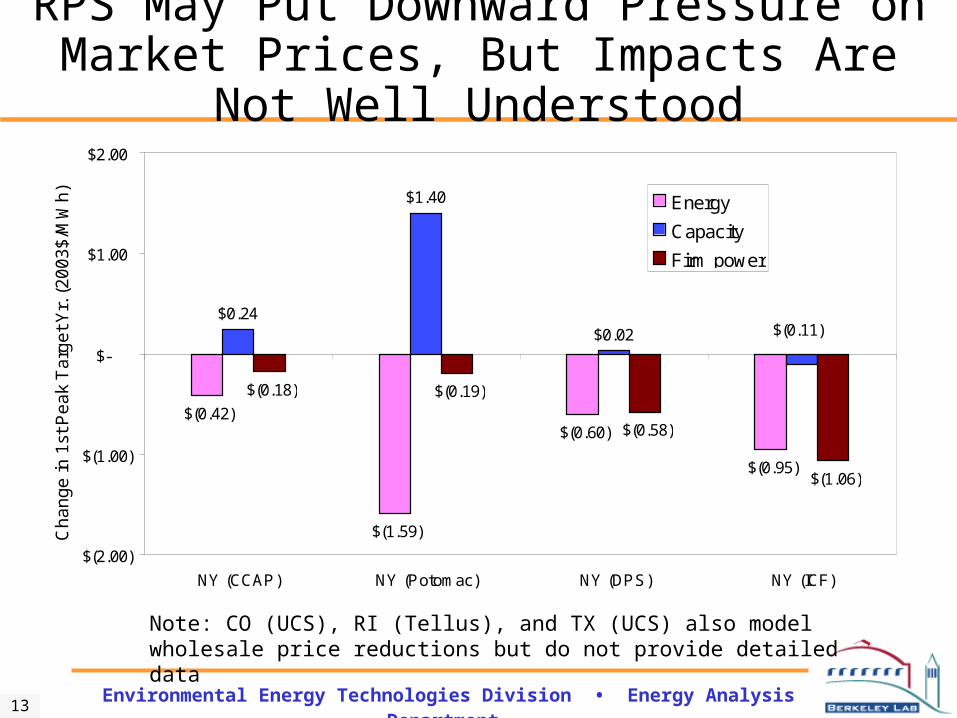
RPS May Put Downward Pressure on Market Prices, But Impacts Are Not Well Understood
Note: CO (UCS), RI (Tellus), and TX (UCS) also model wholesale price reductions but do not provide detailed data
$(0.42)
$(1.59)
$(0.60)
$(0.95)
$0.24
$1.40
$0.02
$(0.18) $(0.19)
$(0.58)
$(1.06)
$(0.11)
$(2.00)
$(1.00)
$-
$1.00
$2.00
NY (CCAP) NY (Potomac) NY (DPS) NY (ICF)
Ch
an
ge
in 1
st P
ea
k T
arg
et
Yr.
(2
00
3$
/MW
h)
Energy
Capacity
Firm power
Environmental Energy Technologies Division • Energy Analysis Department14
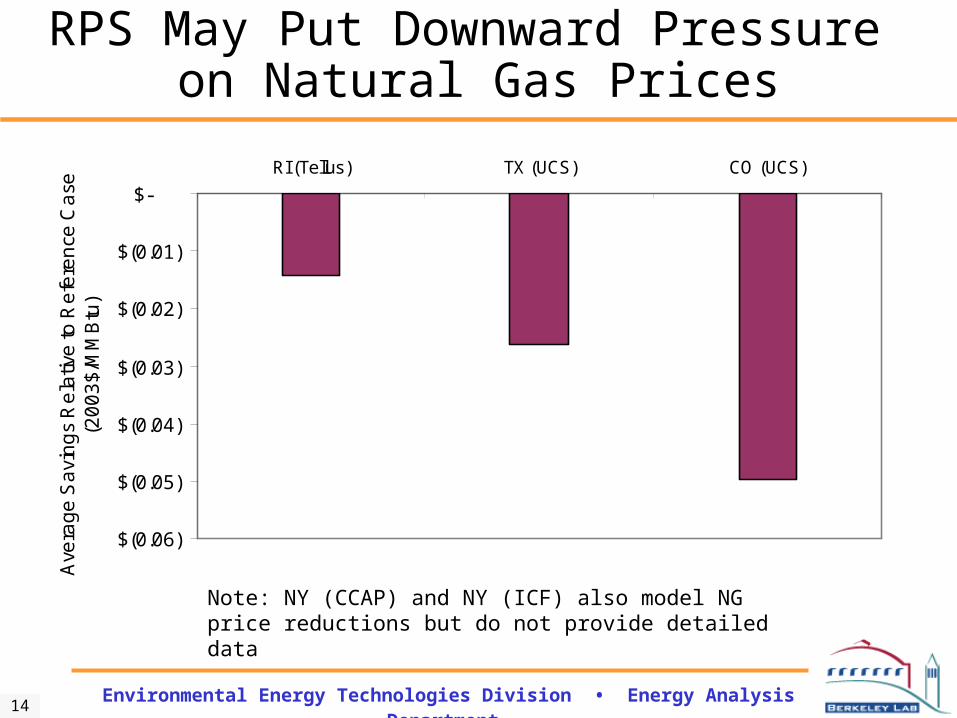
RPS May Put Downward Pressure on Natural Gas Prices
Note: NY (CCAP) and NY (ICF) also model NG price reductions but do not provide detailed data
$(0.06)
$(0.05)
$(0.04)
$(0.03)
$(0.02)
$(0.01)
$-
RI (Tellus) TX (UCS) CO (UCS)
Ave
rag
e S
avi
ng
s R
ela
tive
to R
efe
ren
ce C
ase
(2
00
3$
/MM
Btu
)
Environmental Energy Technologies Division • Energy Analysis Department15
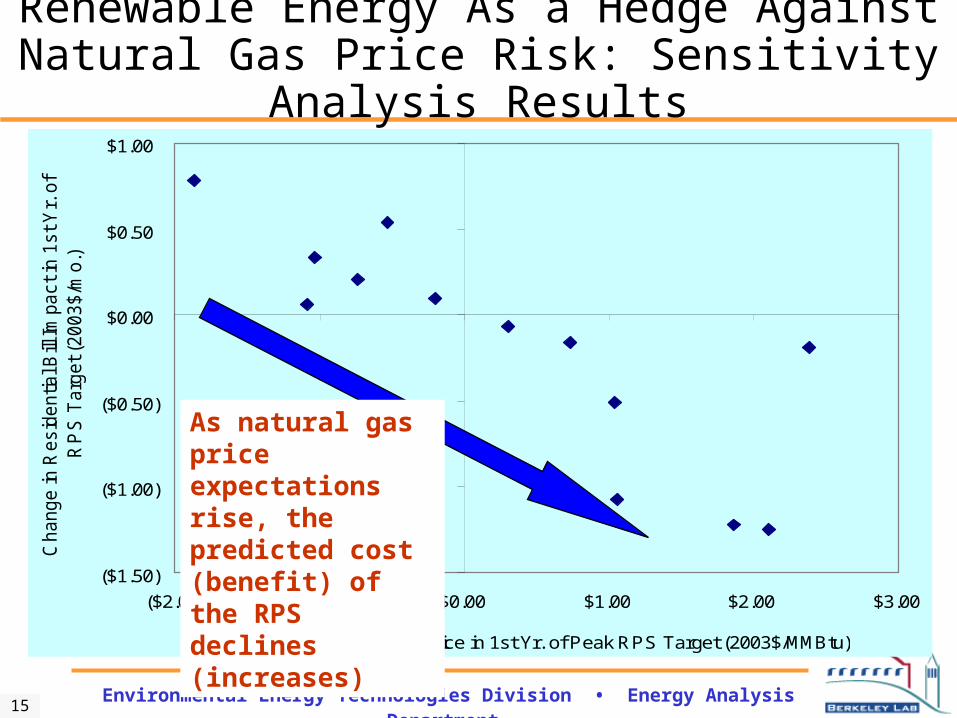
Renewable Energy As a Hedge Against Natural Gas Price Risk: Sensitivity Analysis Results
($1.50)
($1.00)
($0.50)
$0.00
$0.50
$1.00
($2.00) ($1.00) $0.00 $1.00 $2.00 $3.00
Change in Natural Gas Price in 1st Yr. of Peak RPS Target (2003$/MMBtu)
Change in
Resid
entia
l Bill
Im
pact in
1st Y
r. o
f P
eak
RP
S T
arg
et (2
003$/m
o.)
As natural gas price expectations rise, the predicted cost (benefit) of the RPS declines (increases)
Environmental Energy Technologies Division • Energy Analysis Department16
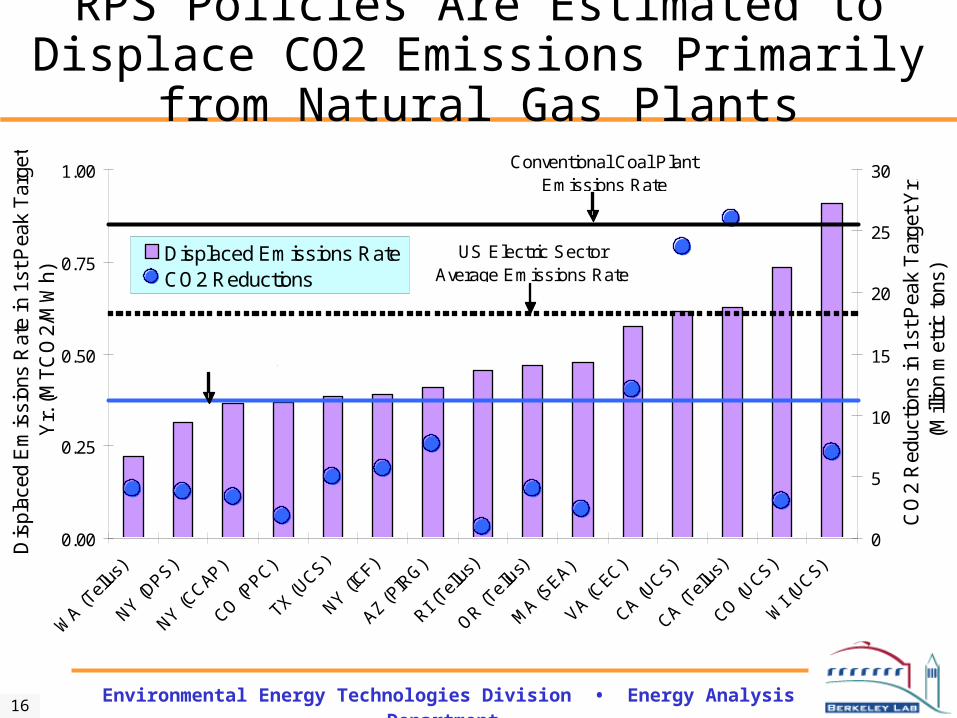
RPS Policies Are Estimated to Displace CO2 Emissions Primarily from Natural Gas Plants
0.00
0.25
0.50
0.75
1.00
WA (T
ellus
)
NY (DPS)
NY (CCAP)
CO (P
PC)
TX (UCS)
NY (ICF)
AZ (PIR
G)
RI (Tell
us)
OR (Tellu
s)
MA (S
EA)
VA (CEC)
CA (UCS)
CA (Tell
us)
CO (U
CS)
WI (
UCS)
Dis
plac
ed E
mis
sion
s R
ate
in 1
st P
eak
Tar
get
Yr.
(M
TC
O2/
MW
h)
0
5
10
15
20
25
30
CO
2 R
educ
tions
in 1
st P
eak
Tar
get Y
r.
(Mill
ion
met
ric to
ns)
Displaced Emissions RateCO2 Reductions
Conventional Coal Plant Emissions Rate
NGCC Plant Emissions Rate
US Electric Sector Average Emissions Rate
Environmental Energy Technologies Division • Energy Analysis Department17
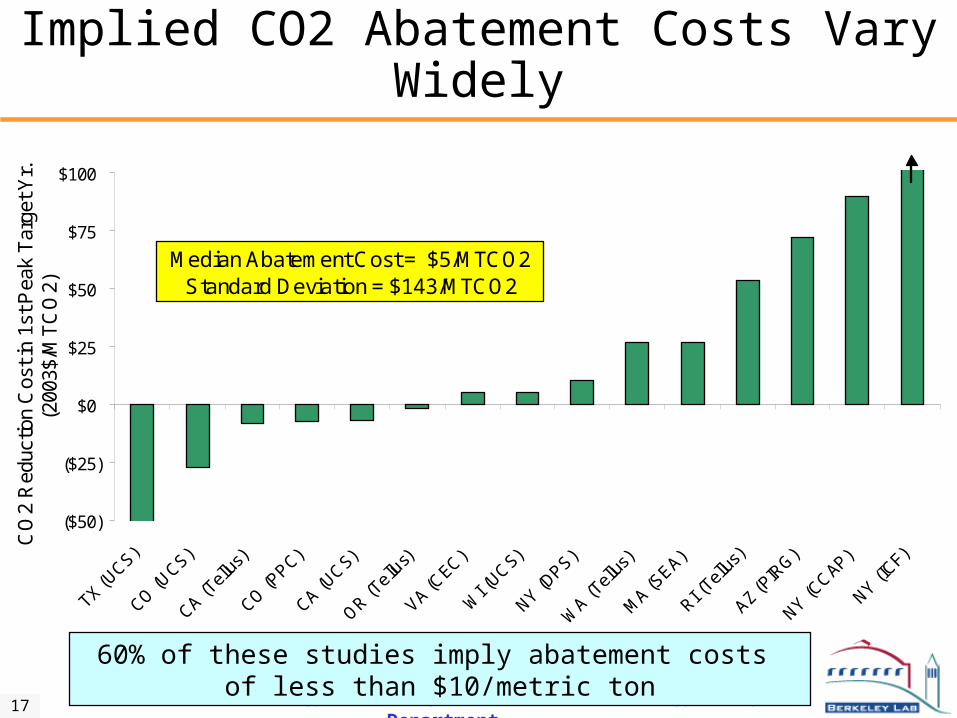
Implied CO2 Abatement Costs Vary Widely
($50)
($25)
$0
$25
$50
$75
$100
TX (UCS)
CO (U
CS)
CA (Tell
us)
CO (P
PC)
CA (UCS)
OR (Tellu
s)
VA (CEC)
WI (
UCS)
NY (DPS)
WA (T
ellus
)
MA (S
EA)
RI (Tell
us)
AZ (PIR
G)
NY (CCAP)
NY (ICF)
CO
2 R
educ
tion
Cos
t in
1st P
eak
Tar
get Y
r.
(200
3$/M
TC
O2)
$295
$(426)
Median Abatement Cost = $5/MTCO2 Standard Deviation = $143/MTCO2
60% of these studies imply abatement costs of less than $10/metric ton
Environmental Energy Technologies Division • Energy Analysis Department18
Category A(17 studies) Category D
(6 studies)
AZ (PIRG), AZ (PEG), CA (CRS), CA (UCS),
CA LADWP, CO (PPC), HI (GDS), IA (WUC), MD (Synapse), MN
(WUC), NE (UCS), PA (B&V), VA (CEC), VT
(Synapse), WA (Lazarus), WI (UCS)
CA/OR/WA, CO (UCS), NY
(CCAP), NY (ICF), RI (Tellus),
TX (UCS)
Category C (2 studies)
Category B(2 studies)
MA (SEA), NJ (Rutgers)
NY (DPS), NY (Potomac)
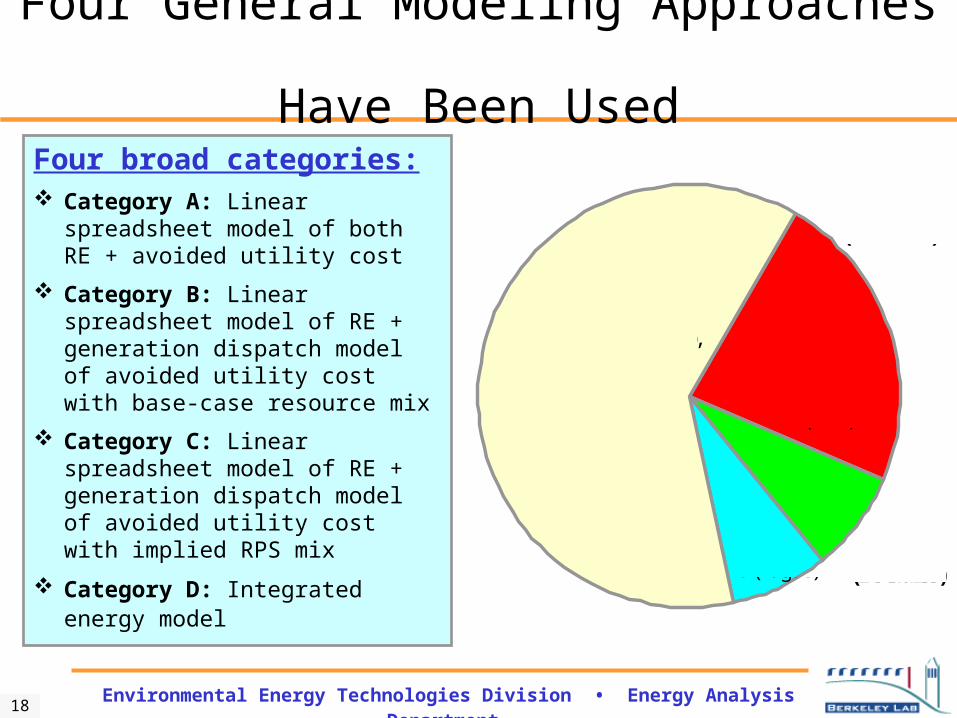
Four General Modeling Approaches Have Been Used
Four broad categories: Category A: Linear spreadsheet
model of both RE + avoided utility cost
Category B: Linear spreadsheet model of RE + generation dispatch model of avoided utility cost with base-case resource mix
Category C: Linear spreadsheet model of RE + generation dispatch model of avoided utility cost with implied RPS mix
Category D: Integrated energy model
Environmental Energy Technologies Division • Energy Analysis Department19
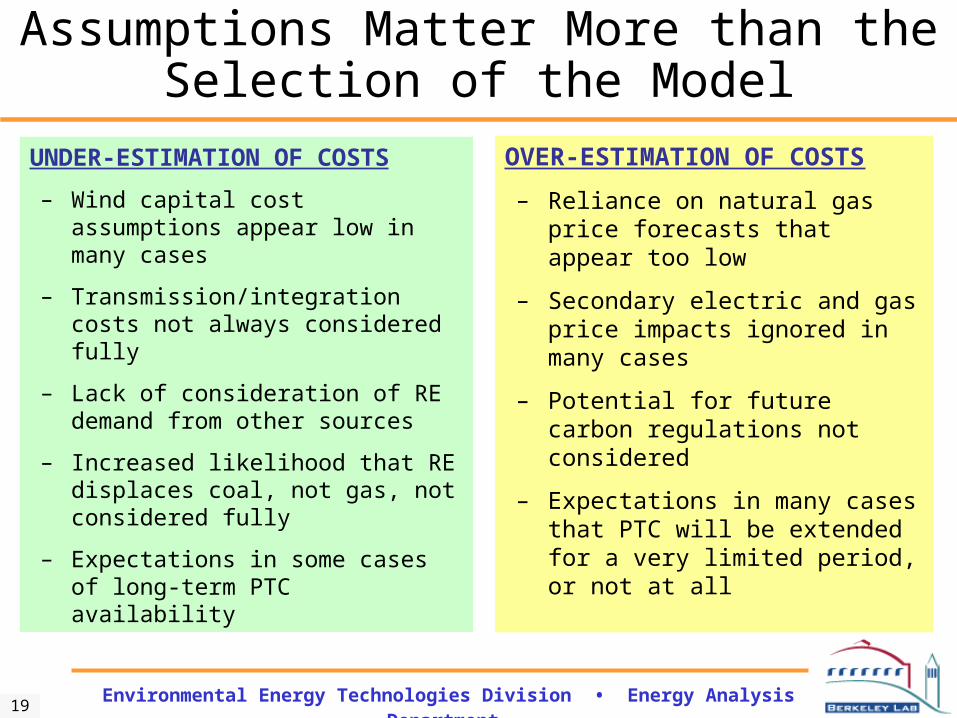
Assumptions Matter More than the Selection of the Model
UNDER-ESTIMATION OF COSTS
– Wind capital cost assumptions appear low in many cases
– Transmission/integration costs not always considered fully
– Lack of consideration of RE demand from other sources
– Increased likelihood that RE displaces coal, not gas, not considered fully
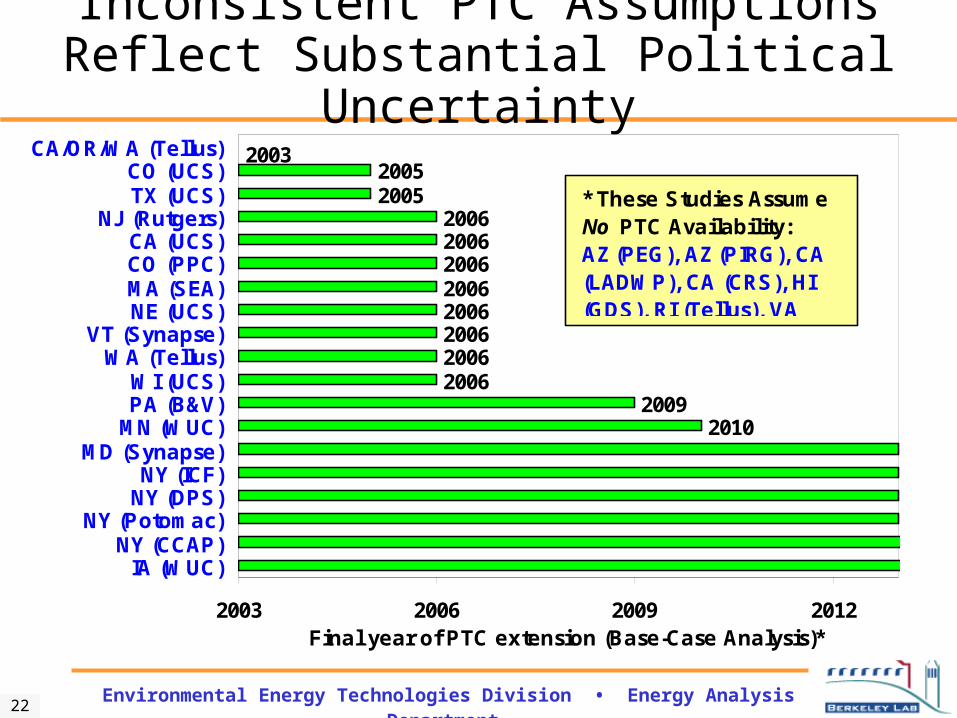
– Expectations in some cases of long-term PTC availability
OVER-ESTIMATION OF COSTS
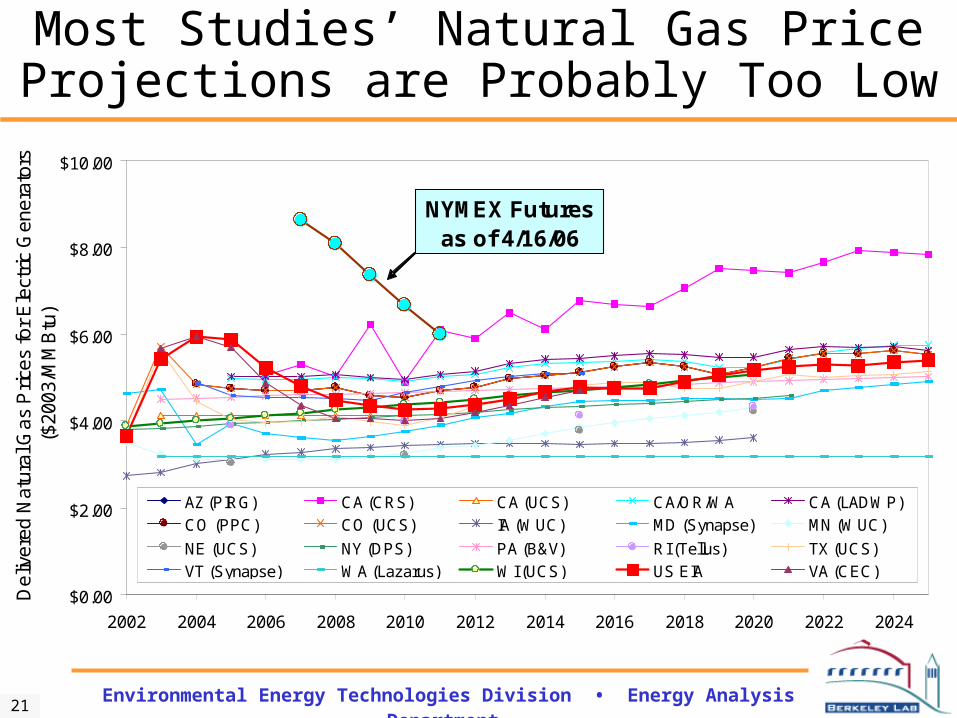
– Reliance on natural gas price forecasts that appear too low
– Secondary electric and gas price impacts ignored in many cases
– Potential for future carbon regulations not considered
– Expectations in many cases that PTC will be extended for a very limited period, or not at all
Environmental Energy Technologies Division • Energy Analysis Department20
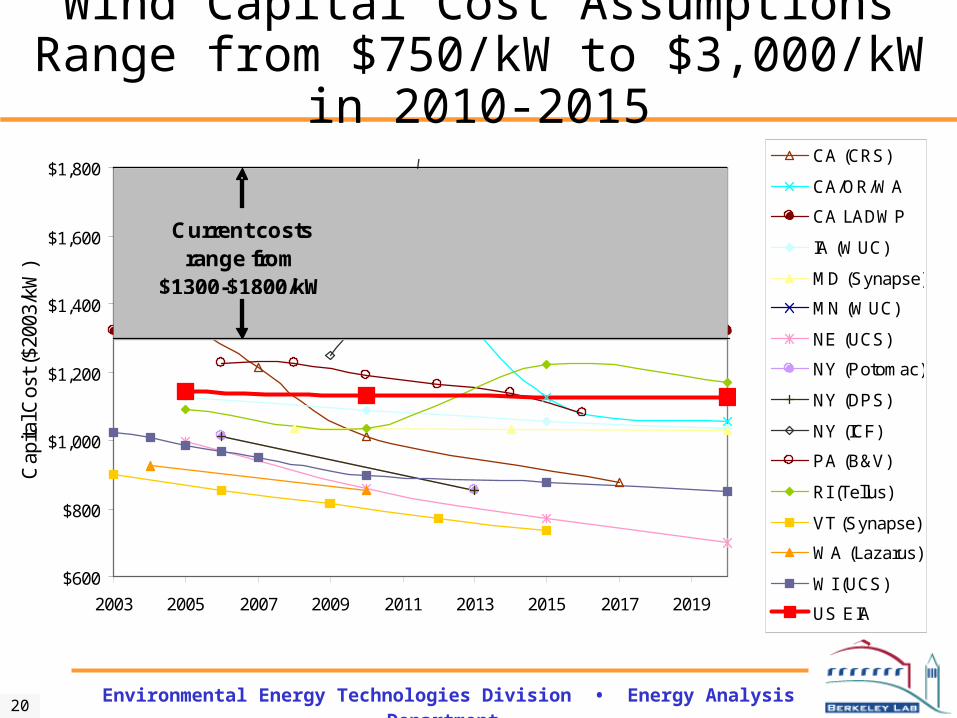
Wind Capital Cost Assumptions Range from $750/kW to $3,000/kW in 2010-2015
$600
$800
$1,000
$1,200
$1,400
$1,600
$1,800
2003 2005 2007 2009 2011 2013 2015 2017 2019
Cap
ital C
ost (
$200
3/kW
)
CA (CRS)
CA/OR/WA
CA LADWP
IA (WUC)
MD (Synapse)
MN (WUC)
NE (UCS)
NY (Potomac)
NY (DPS)
NY (ICF)
PA (B&V)
RI (Tellus)
VT (Synapse)
WA (Lazarus)
WI (UCS)
US EIA
$3,115
Current costsrange from
$1300-$1800/kW
Environmental Energy Technologies Division • Energy Analysis Department21
Most Studies’ Natural Gas Price Projections are Probably Too Low
$0.00
$2.00
$4.00
$6.00
$8.00
$10.00
2002 2004 2006 2008 2010 2012 2014 2016 2018 2020 2022 2024
Del
iver
ed N
atu
ral G
as
Pric
es fo
r E
lect
ric
Gen
erat
ors
($2
003/
MM
Btu
)
AZ (PIRG) CA (CRS) CA (UCS) CA/OR/WA CA (LADWP)CO (PPC) CO (UCS) IA (WUC) MD (Synapse) MN (WUC)
NE (UCS) NY (DPS) PA (B&V) RI (Tellus) TX (UCS)
VT (Synapse) WA (Lazarus) WI (UCS) US EIA VA (CEC)
NYMEX Futures as of 4/16/06
Environmental Energy Technologies Division • Energy Analysis Department22
Inconsistent PTC Assumptions Reflect Substantial Political Uncertainty
2010
20062006200620062006200620062006
20052005
2003
2009
2003 2006 2009 2012
IA (WUC)NY (CCAP)
NY (Potomac)NY (DPS)NY (ICF)
MD (Synapse)MN (WUC)PA (B&V)WI (UCS)
WA (Tellus)VT (Synapse)
NE (UCS)MA (SEA)CO (PPC)CA (UCS)
NJ (Rutgers)TX (UCS)CO (UCS)
CA/OR/WA (Tellus)
Final year of PTC extension (Base-Case Analysis)*
* These Studies Assume No PTC Availability: AZ (PEG), AZ (PIRG), CA (LADWP), CA (CRS), HI (GDS), RI (Tellus), VA
Environmental Energy Technologies Division • Energy Analysis Department23
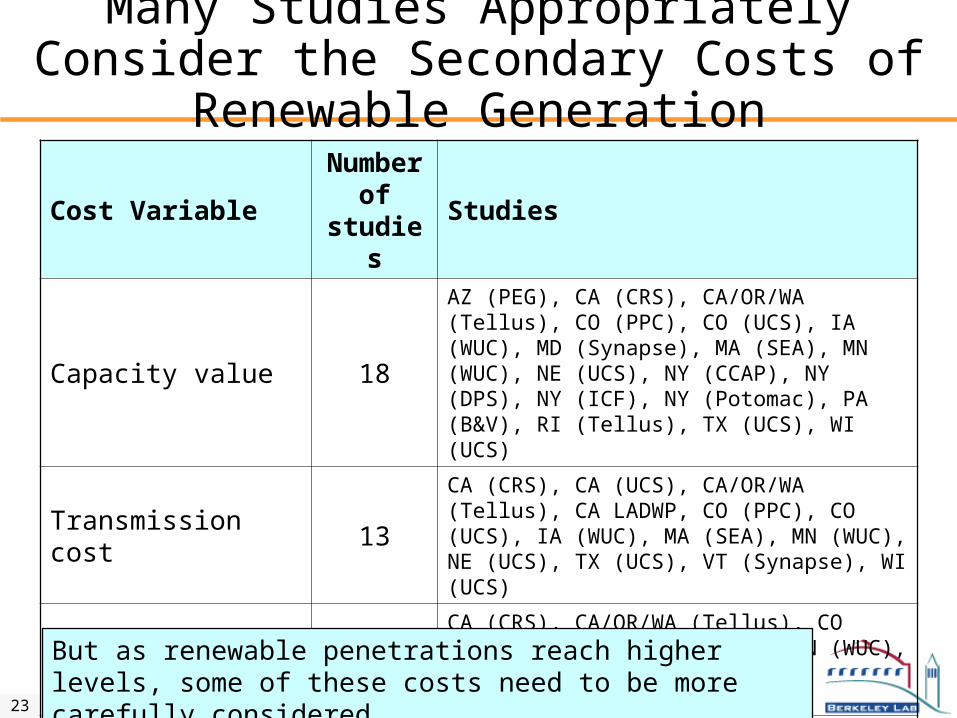
Many Studies Appropriately Consider the Secondary Costs of Renewable Generation
Cost VariableNumber
of studiesStudies
Capacity value 18AZ (PEG), CA (CRS), CA/OR/WA (Tellus), CO (PPC), CO (UCS), IA (WUC), MD (Synapse), MA (SEA), MN (WUC), NE (UCS), NY (CCAP), NY (DPS), NY (ICF), NY (Potomac), PA (B&V), RI (Tellus), TX (UCS), WI (UCS)
Transmission cost 13CA (CRS), CA (UCS), CA/OR/WA (Tellus), CA LADWP, CO (PPC), CO (UCS), IA (WUC), MA (SEA), MN (WUC), NE (UCS), TX (UCS), VT (Synapse), WI (UCS)
Integration cost 10CA (CRS), CA/OR/WA (Tellus), CO (PPC), CO (UCS), IA (WUC), MN (WUC), NJ (Rutgers), TX (UCS), WA (Lazarus), WI (UCS)
Admin. & transaction cost 4 CA (UCS), MA (SEA), WA (Lazarus), WI (UCS)
But as renewable penetrations reach higher levels, some of these costs need to be more carefully considered
Environmental Energy Technologies Division • Energy Analysis Department24
Conclusions from the Cost Studies
• Projecting RPS costs is inherently uncertain, but… despite uncertainties, majority of studies project modest cost impacts
• Recent trend toward studies that forecast not just direct costs and environmental benefits, but also macroeconomic and hedge benefits
• Studies use variety of methods/data sources to calculate costs and benefits: a standard study “template” has not yet emerged
• Assumptions for primary and secondary costs and benefits likely to be more important than what model is used
• Sophistication of models used, and range of secondary impacts and public benefits considered, affect the cost of undertaking a study: $100k will buy a very thorough study
Environmental Energy Technologies Division • Energy Analysis Department25
Some Possible Areas of Improvement…
• Improved Treatment of Transmission/Integration Costs: need better estimates of these costs w/high RE penetrations
• Competing RPS Requirements: consider how potential RPS policies in nearby states would affect RE resource supply and cost
• Natural Gas Price Forecasts: benchmark to NYMEX in early years
• Coal as the Marginal Price Setter: at high natural gas prices, need to consider possibility that RE will increasingly offset coal
• Greater Use of Scenario/Risk Analysis: natural gas and wholesale price uncertainty, PTC availability, wind capital costs
• Consideration of Future Carbon Regulation: consider impacts in the event that future carbon regulations are established
• More Robust Treatment of Public benefits: greater efforts to quantify the magnitude of hedge and macroeconomic benefits
Environmental Energy Technologies Division • Energy Analysis Department26
Presentation Overview
1. Review of State/Utility RPS Cost-Impact StudiesA. Project Motivation and Scope
B. Projected Renewable Resource and Direct Cost Results
C. Projected Benefits
D. Cost Study Methodologies and Assumptions
E. Conclusions and Areas for Improvement
2. Actual Costs of State RPS Policies to Date
3. Approaches to Limit RPS Costs
4. Impact of RPS Design on Expected Cost
Environmental Energy Technologies Division • Energy Analysis Department27
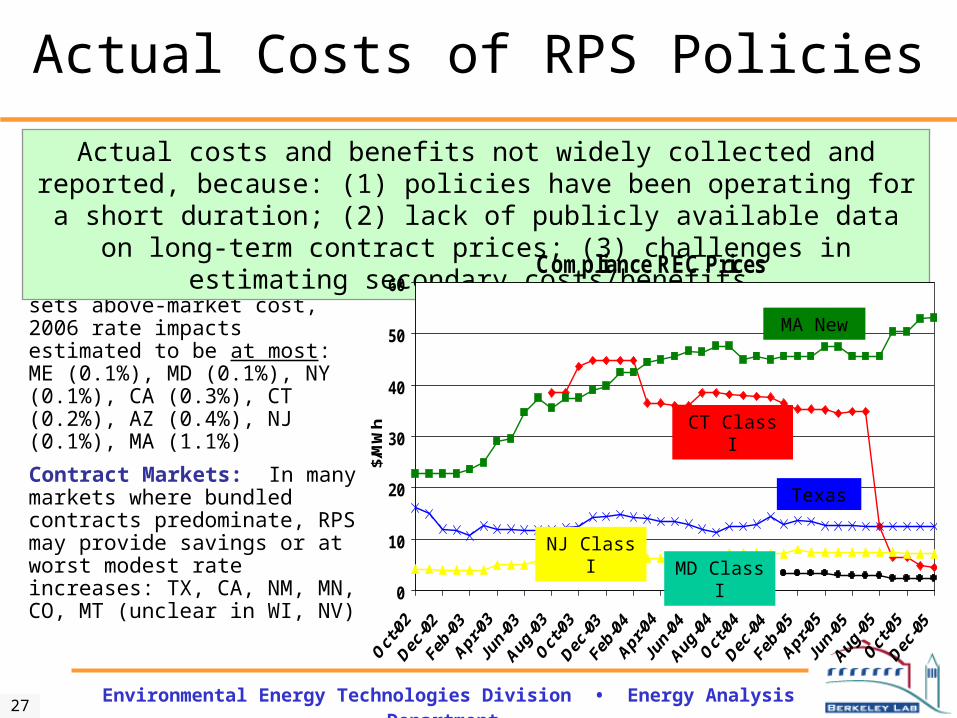
Actual Costs of RPS Policies
RECs Markets: In markets where RECs or surcharge sets above-market cost, 2006 rate impacts estimated to be at most: ME (0.1%), MD (0.1%), NY (0.1%), CA (0.3%), CT (0.2%), AZ (0.4%), NJ (0.1%), MA (1.1%)
Contract Markets: In many markets where bundled contracts predominate, RPS may provide savings or at worst modest rate increases: TX, CA, NM, MN, CO, MT (unclear in WI, NV)
Actual costs and benefits not widely collected and reported, because: (1) policies have been operating for a short duration; (2) lack of publicly available data on
long-term contract prices; (3) challenges in estimating secondary costs/benefits
Compliance REC Prices
0
10
20
30
40
50
60
$/M
Wh
MA New
CT Class I
Texas
NJ Class IMD Class I
Environmental Energy Technologies Division • Energy Analysis Department28
Presentation Overview
1. Review of State/Utility RPS Cost-Impact StudiesA. Project Motivation and Scope
B. Projected Renewable Resource and Direct Cost Results
C. Projected Benefits
D. Cost Study Methodologies and Assumptions
E. Conclusions and Areas for Improvement
2. Actual Costs of State RPS Policies to Date
3. Approaches to Limit RPS Costs
4. Impact of RPS Design on Expected Cost
Environmental Energy Technologies Division • Energy Analysis Department29
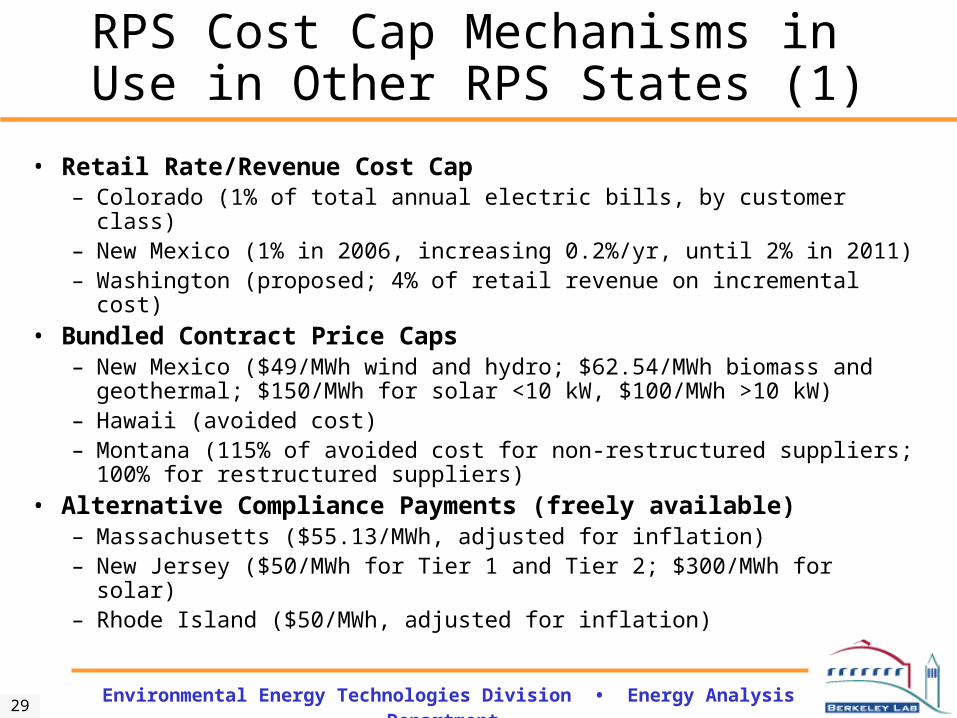
RPS Cost Cap Mechanisms in Use in Other RPS States (1)
• Retail Rate/Revenue Cost Cap– Colorado (1% of total annual electric bills, by customer class)– New Mexico (1% in 2006, increasing 0.2%/yr, until 2% in 2011)– Washington (proposed; 4% of retail revenue on incremental cost)
• Bundled Contract Price Caps– New Mexico ($49/MWh wind and hydro; $62.54/MWh biomass and
geothermal; $150/MWh for solar <10 kW, $100/MWh >10 kW)– Hawaii (avoided cost)– Montana (115% of avoided cost for non-restructured suppliers;
100% for restructured suppliers)
• Alternative Compliance Payments (freely available)– Massachusetts ($55.13/MWh, adjusted for inflation)– New Jersey ($50/MWh for Tier 1 and Tier 2; $300/MWh for solar)– Rhode Island ($50/MWh, adjusted for inflation)
Environmental Energy Technologies Division • Energy Analysis Department30
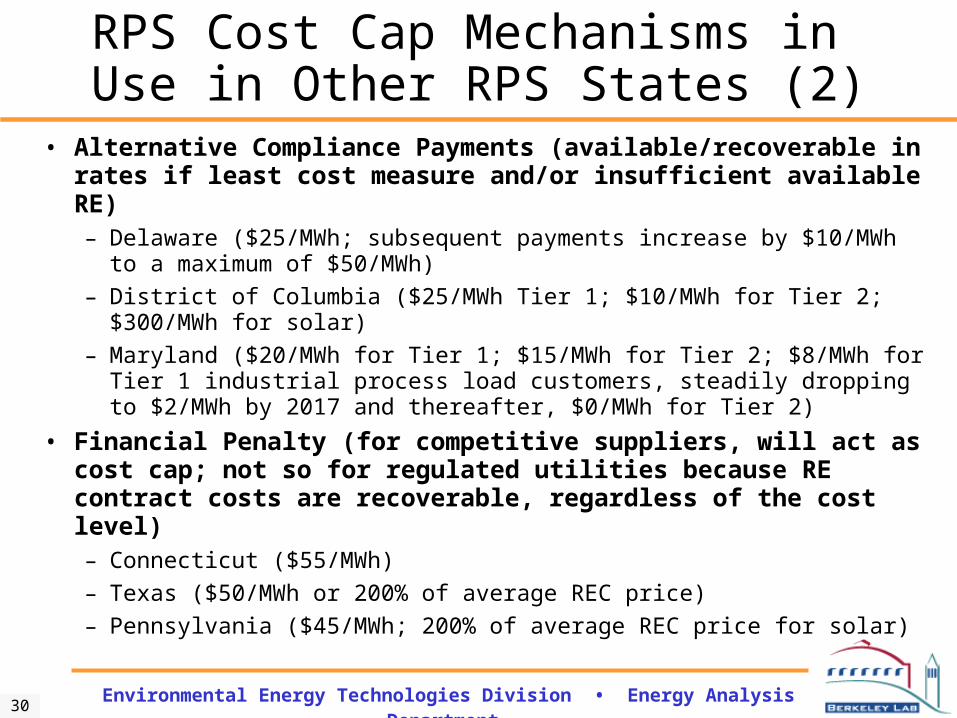
RPS Cost Cap Mechanisms in Use in Other RPS States (2)
• Alternative Compliance Payments (available/recoverable in rates if least cost measure and/or insufficient available RE)– Delaware ($25/MWh; subsequent payments increase by $10/MWh
to a maximum of $50/MWh)
– District of Columbia ($25/MWh Tier 1; $10/MWh for Tier 2; $300/MWh for solar)
– Maryland ($20/MWh for Tier 1; $15/MWh for Tier 2; $8/MWh for Tier 1 industrial process load customers, steadily dropping to $2/MWh by 2017 and thereafter, $0/MWh for Tier 2)
• Financial Penalty (for competitive suppliers, will act as cost cap; not so for regulated utilities because RE contract costs are recoverable, regardless of the cost level)– Connecticut ($55/MWh)
– Texas ($50/MWh or 200% of average REC price)
– Pennsylvania ($45/MWh; 200% of average REC price for solar)
Environmental Energy Technologies Division • Energy Analysis Department31
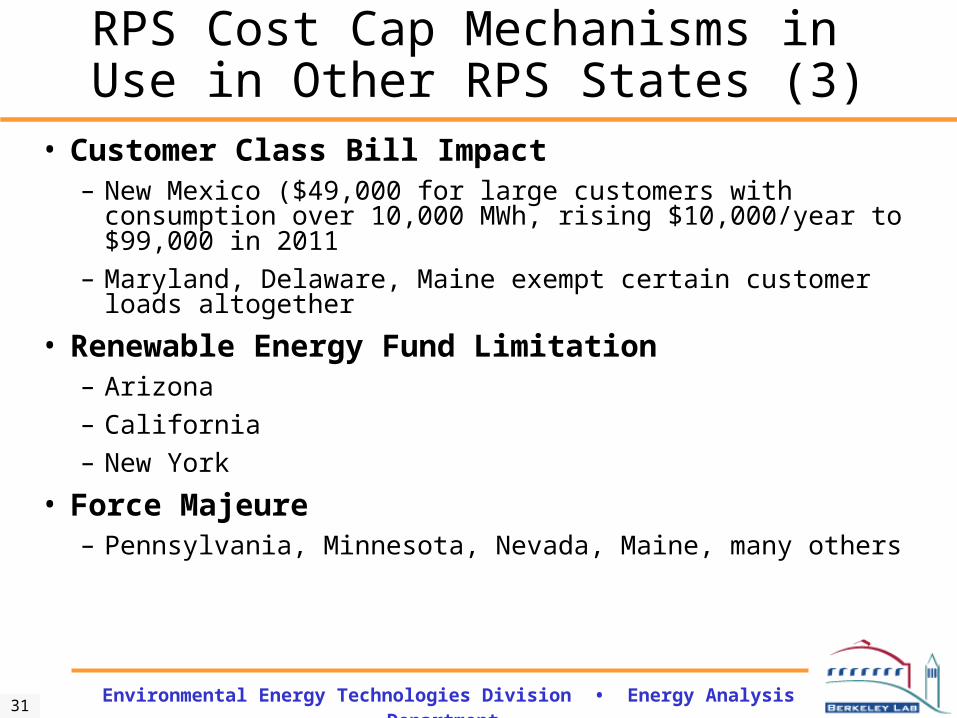
RPS Cost Cap Mechanisms in Use in Other RPS States (3)
• Customer Class Bill Impact– New Mexico ($49,000 for large customers with consumption
over 10,000 MWh, rising $10,000/year to $99,000 in 2011– Maryland, Delaware, Maine exempt certain customer loads
altogether
• Renewable Energy Fund Limitation– Arizona– California– New York
• Force Majeure– Pennsylvania, Minnesota, Nevada, Maine, many others
Environmental Energy Technologies Division • Energy Analysis Department32
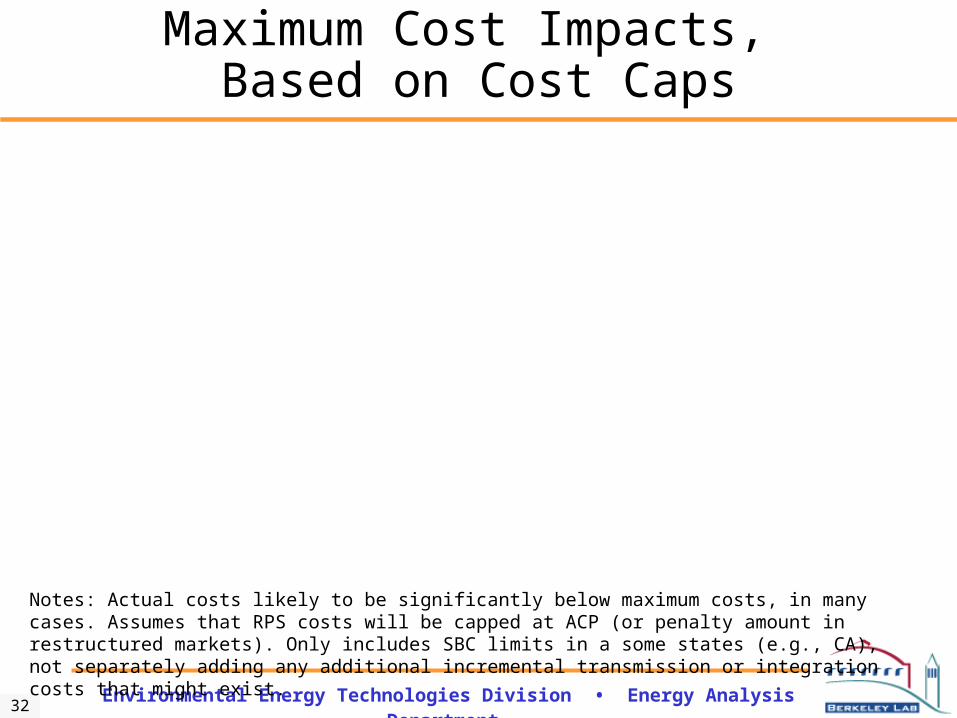
Maximum Cost Impacts, Based on Cost Caps
Notes: Actual costs likely to be significantly below maximum costs, in many cases. Assumes that RPS costs will be capped at ACP (or penalty amount in restructured markets). Only includes SBC limits in a some states (e.g., CA), not separately adding any additional incremental transmission or integration costs that might exist.
0%
2%
4%
6%
8%
10%
12%
Hawaii
Mon
tana
Califo
rnia
New Y
ork
Colora
do
Mar
yland
Arizon
a (p
ropo
sal)
New M
exico
Mas
sach
uset
ts
Texas
Was
hingt
on, D
.C.
Penns
ylvan
ia
Delawar
e
Conne
cticu
t
Rhode
Islan
d
New Je
rsey
Iowa
Main
e
Minn
esot
a
Nevad
a
Wisc
onsin
Ma
x. %
Inc
rea
se
in A
vg
. Re
tail
Ra
tes
No Explicit Caps
Environmental Energy Technologies Division • Energy Analysis Department33
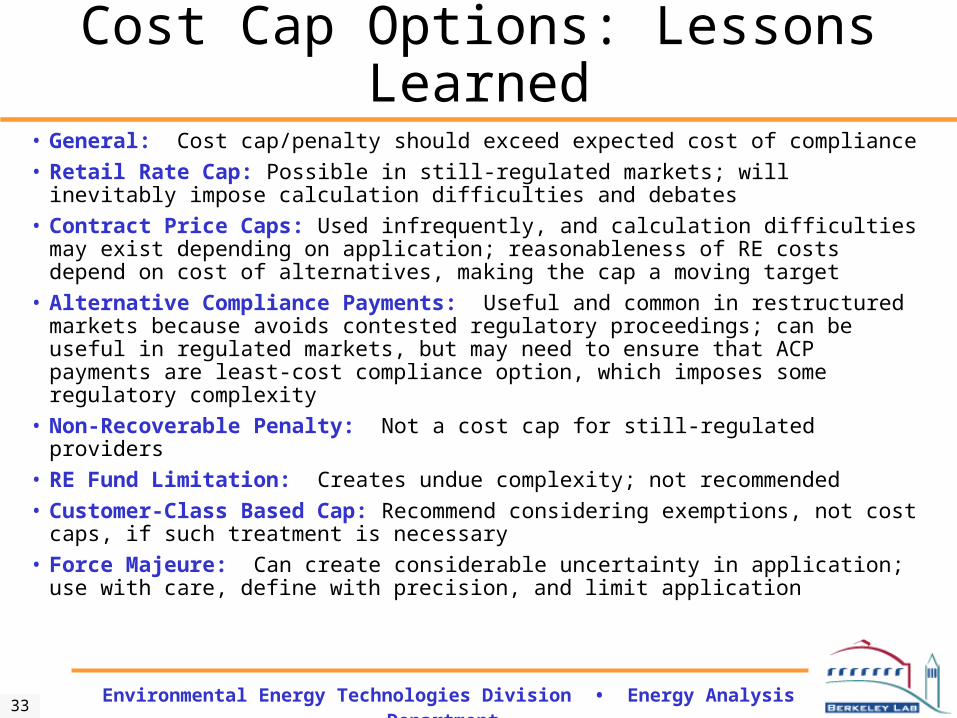
Cost Cap Options: Lessons Learned
• General: Cost cap/penalty should exceed expected cost of compliance
• Retail Rate Cap: Possible in still-regulated markets; will inevitably impose calculation difficulties and debates
• Contract Price Caps: Used infrequently, and calculation difficulties may exist depending on application; reasonableness of RE costs depend on cost of alternatives, making the cap a moving target
• Alternative Compliance Payments: Useful and common in restructured markets because avoids contested regulatory proceedings; can be useful in regulated markets, but may need to ensure that ACP payments are least-cost compliance option, which imposes some regulatory complexity
• Non-Recoverable Penalty: Not a cost cap for still-regulated providers
• RE Fund Limitation: Creates undue complexity; not recommended
• Customer-Class Based Cap: Recommend considering exemptions, not cost caps, if such treatment is necessary
• Force Majeure: Can create considerable uncertainty in application; use with care, define with precision, and limit application
Environmental Energy Technologies Division • Energy Analysis Department34
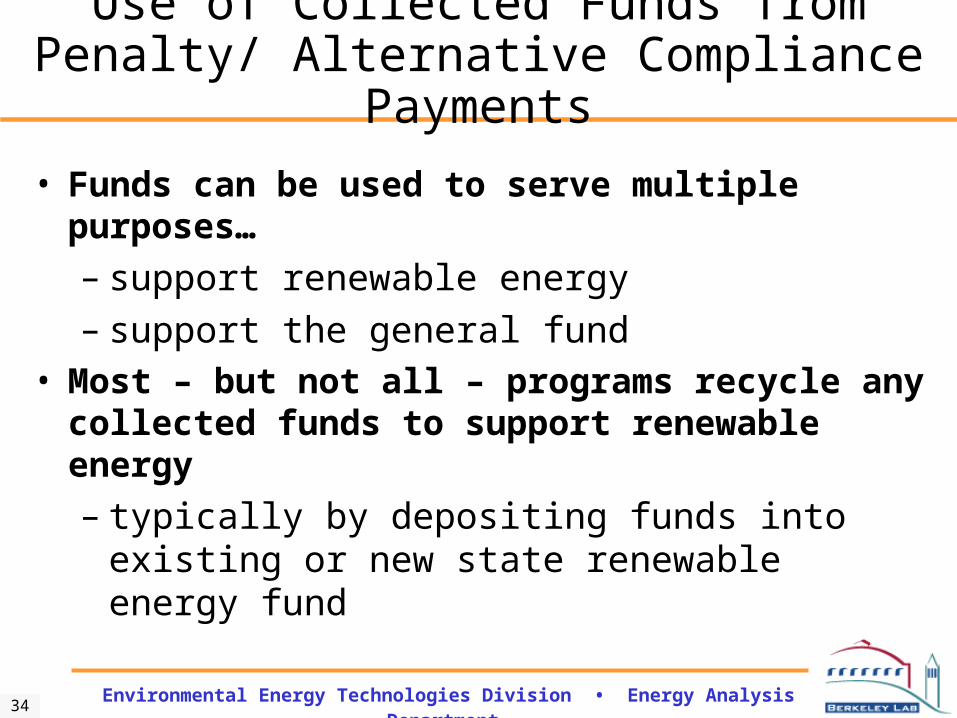
Use of Collected Funds from Penalty/ Alternative Compliance Payments
• Funds can be used to serve multiple purposes…
– support renewable energy– support the general fund
• Most – but not all – programs recycle any collected funds to support renewable energy
– typically by depositing funds into existing or new state renewable energy fund
Environmental Energy Technologies Division • Energy Analysis Department35
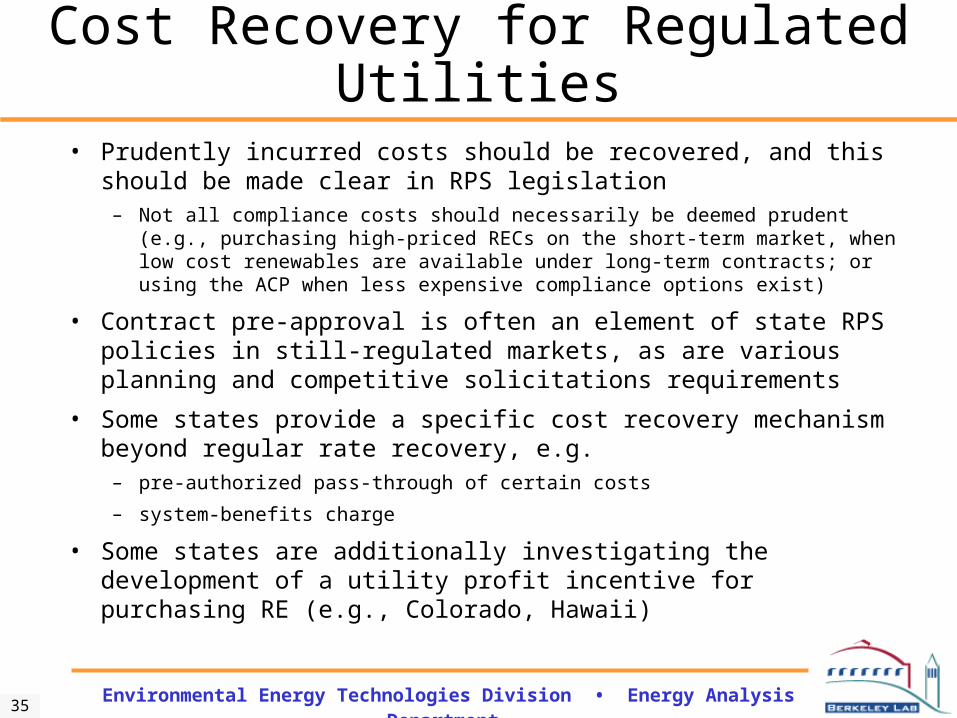
Cost Recovery for Regulated Utilities
• Prudently incurred costs should be recovered, and this should be made clear in RPS legislation
– Not all compliance costs should necessarily be deemed prudent (e.g., purchasing high-priced RECs on the short-term market, when low cost renewables are available under long-term contracts; or using the ACP when less expensive compliance options exist)
• Contract pre-approval is often an element of state RPS policies in still-regulated markets, as are various planning and competitive solicitations requirements
• Some states provide a specific cost recovery mechanism beyond regular rate recovery, e.g.
– pre-authorized pass-through of certain costs
– system-benefits charge
• Some states are additionally investigating the development of a utility profit incentive for purchasing RE (e.g., Colorado, Hawaii)
Environmental Energy Technologies Division • Energy Analysis Department36
Presentation Overview
1. Review of State/Utility RPS Cost-Impact StudiesA. Project Motivation and Scope
B. Projected Renewable Resource and Direct Cost Results
C. Projected Benefits
D. Cost Study Methodologies and Assumptions
E. Conclusions and Areas for Improvement
2. Actual Costs of State RPS Policies to Date
3. Approaches to Limit RPS Costs
4. Impact of RPS Design on Expected Cost
Environmental Energy Technologies Division • Energy Analysis Department37
Design Elements that Will Affect Compliance Costs
• Percentage targets and timeframes
• Resource eligibility
• Geographic eligibility and delivery requirements
• Set-asides for solar or other resource types
• Flexible compliance mechanisms (RECs, banking, borrowing, settlement periods)
• Encouragement for long-term contracting
Environmental Energy Technologies Division • Energy Analysis Department38
Conclusions
• Expected cost of other state RPS policies is modest; benefits are not insignificant
• Oregon could do its own cost study
• Actual RPS costs in other states have, in general, been relatively low
• Cost caps and RPS design can be tailored to avoid adverse cost impacts
• But… it is true that an RPS may increase retail electricity rates