environmental flow regime recommendations for the
TRANSCRIPT
The University of San FranciscoUSF Scholarship: a digital repository @ Gleeson Library |Geschke Center
Master's Projects and Capstones Theses, Dissertations, Capstones and Projects
Spring 5-16-2014
Environmental Flow Regime Recommendationsfor the Promotion of Salicaceae SeedlingRecruitment in California’s Central ValleyNicholas J. [email protected]
Follow this and additional works at: https://repository.usfca.edu/capstone
Part of the Terrestrial and Aquatic Ecology Commons
This Project/Capstone is brought to you for free and open access by the Theses, Dissertations, Capstones and Projects at USF Scholarship: a digitalrepository @ Gleeson Library | Geschke Center. It has been accepted for inclusion in Master's Projects and Capstones by an authorized administratorof USF Scholarship: a digital repository @ Gleeson Library | Geschke Center. For more information, please contact [email protected].
Recommended CitationTorrez, Nicholas J., "Environmental Flow Regime Recommendations for the Promotion of Salicaceae Seedling Recruitment inCalifornia’s Central Valley" (2014). Master's Projects and Capstones. 26.https://repository.usfca.edu/capstone/26

This Master’s Project
ENVIRONMENTAL FLOW REGIME RECOMMENDATIONS FOR THE PROMOTION
OF SALICACEAE SEEDLING RECRUITMENT IN CALIFORNIA’S CENTRAL
VALLEY
By
Nicholas Jon Torrez
is submitted in partial fulfillment of the requirements for the degree of:
Master of Science
In
Environmental Management
at the
University of San Francisco
Submitted:
………………………………………
Nicholas Jon Torrez Date
Received:
………………………………………
Gretchen Coffman, Ph. D. Date

Abbreviations
cfs cubic feet per second
HCA Hydrograph Component Analysis
IHA Indicators of Hydrologic Alteration
NRDC National Resources Defense Council
SJRRP San Joaquin River Restoration Program
CDWR California Department of Water Resources
DBH Diameter at Breast Height
WY water year
RM river mile
AF acre-feet
USBR U. S. Bureau of Reclamation
SRMAP Sacramento River Monitoring and Assessment
Project
GIS Geographic Information System
HFE high-flow experiment

1
Table of Contents
List of Figures .................................................................................................................. 3
List of Tables ................................................................................................................... 4
Abstract ........................................................................................................................... 5
Introduction ..................................................................................................................... 6
Methodology .................................................................................................................. 10
Salicaceae spp. ............................................................................................................. 14
Populus spp. - Ecology ....................................................................................... 14
Populus spp. - Seedling Recruitment Requirements .......................................... 16
Populus spp. - Effects of Altered Flow Regimes ................................................. 18
Salix spp. - Ecology ............................................................................................ 18
Salix spp. – Seedling Recruitment Requirements ............................................... 20
Salix spp. - Effects of Altered Flow Regimes ...................................................... 21
Central Valley Hydrology ............................................................................................... 22
San Joaquin River Background .......................................................................... 23
San Joaquin River Reach Descriptions .............................................................. 24
San Joaquin River Hydrology ............................................................................. 28
San Joaquin River - Salicaceae spp. Seed Release Timing ............................... 32
San Joaquin River - Salicaceae spp. Response to Receding Groundwater ....... 33
San Joaquin River Environmental Flow Recommendations ............................... 34
Magnitude ................................................................................................ 34
Frequency ................................................................................................ 37
Duration ................................................................................................... 38
Timing ...................................................................................................... 38
Rate of Change of Flow ........................................................................... 39

2
San Joaquin Vegetation Monitoring .................................................................... 40
Sacramento River Background ........................................................................... 42
Sacrament River Reach Descriptions ................................................................. 43
Sacramento River Hydrology .............................................................................. 44
Sacramento River - Salicaceae spp. Seedling Release Timing .......................... 48
Sacramento River - Salicaceae spp. Response to Receding Groundwater ........ 48
Sacramento Environmental Flow Recommendations ......................................... 49
Frequency ................................................................................................ 51
Duration ................................................................................................... 51
Timing ...................................................................................................... 51
Rate of Change ........................................................................................ 51
Sacramento Vegetation Monitoring .................................................................... 52
Recommendations ........................................................................................................ 52
Restoration Objectives ....................................................................................... 52
Restoration Implementation ................................................................................ 54
Restoration Monitoring ....................................................................................... 55
Adaptive Management ........................................................................................ 56
Environmental Flow Planning Recommendations .............................................. 57
Conclusion .................................................................................................................... 60
Literature Cited .............................................................................................................. 62

3
List of Figures
Figure 1: Five components of natural and altered flow regimes (Poff et al. 1997) .......... 8
Figure 2: HCA components used for the flow regime analysis on the San Joaquin River
(Cain et al. 2003). ....................................................................................... 12
Figure 3: HCA components used for the flow regime analysis on the Sacramento River
(Cain 2008). ................................................................................................ 13
Figure 4: Recruitment Box Model for Populus spp. (Mahoney and Rood 1998). ........... 16
Figure 5: Diagram of the importance of water table heights and Populus spp. seedling
recuitment (Mahoney and Rood 1998). ...................................................... 17
Figure 6: Comparison of Populus spp. and Salix spp. in the Recruitment Box Model
(Amlin and Rood 2002). .............................................................................. 20
Figure 7: Percentage of transects Along Hell's Canyon with Salix exigua (Rood et al.
2011). ......................................................................................................... 21
Figure 8: Low pulse flows after implementation of the Friant Dam (Cain et al. 2003)…30
Figure 9: Wet historic and altered water years, along the San Joaquin (Cain et al.
2003). ......................................................................................................... 31
Figure 10: Annual hydrograph v. fecundity index (Stillwater Sciences 2006) ................ 30
Figure 11: SJRRP restoration flow defalut schedule (San Joaquin River Restoration
Program 2013a).......................................................................................... 36
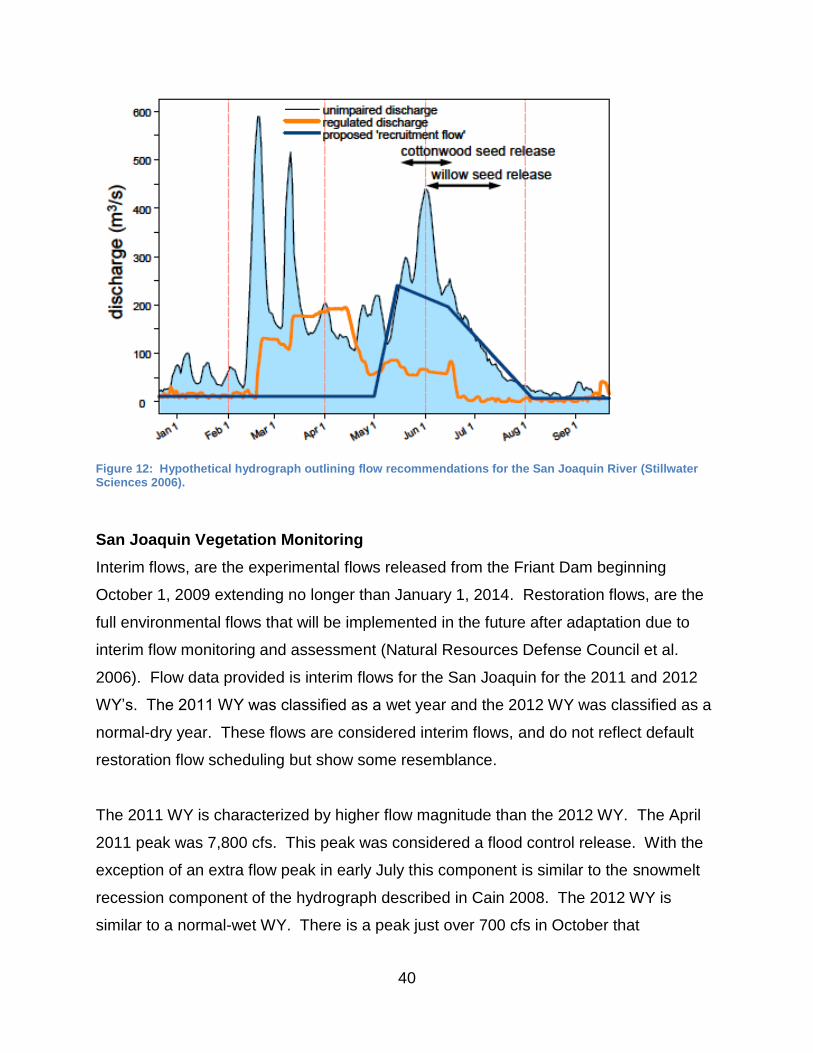
Figure 12: Hypothetical hydrograph outlining flow recommendations for the San
Joaquin River (Stillwater Sciences 2006). .................................................. 40
Figure 13: Interim flow data, 10-2010 through 10-2012, recorded from USGS gauge
11251000 just downstream of Friant Dam (United States Department of the
Interior 2013). ............................................................................................. 41
Figure 14: Wet water year for the Sacramento River (Cain 2008). ................................ 46
Figure 15: Dry water year for the Sacramento River (Cain 2008). ................................ 47
Figure 16: Critical water year for the Sacramento River (Cain 2008). ........................... 47
Figure 17: ELOHA framework for developing appropriate environmental flow regimes
(Poff et al. 2010). ........................................................................................ 59

4
List of Tables
Table 1: Cottonwood and willow species common to riparian ecosystems of California
………………………………………………………………………………………….9
Table 2: Recoccurence intervals for historic and altered flow regimes along the San
Joaquin River……………………………………………………………………..…28
Table 3: Average total percent overstory cover in San Joaquin river reaches for 2011
and 2012 (United States Department of the Interior 2013)…………………….42
Table 4: Reoccurrence Interval Data for the Sacramento River (Cain 2008)…….....…45
5
Abstract
Rivers around the world are being degraded due to alteration of natural flow regimes
caused by the creation of dams and diversions to serve human needs for water.
Alteration to natural flow regime affects a river’s flow magnitude, frequency, duration,
timing, and rate of change of flow. These changes have major repercussions on the
processes that drive riparian ecosystems. Repercussions to river processes are
manifested in the degradation of riparian forest health. This is evident in the rivers of
California’s Central Valley, where altered flow regimes are present in all of its major
rivers. As a result, Salicaceae spp. are not regenerating at historic rates and older trees
are senescing. This dominant riparian tree family is dwindling due to these factors.
Altered and historic flow regimes of Central Valley Rivers differ greatly. The most
critical differences include an overall decrease in flow magnitude, an absence of winter
flood peaks, and severe alteration to winter baseflow and snowmelt recession
components of the hydrograph. The rate of flow decrease during the snowmelt
recession is crucial to the recruitment of Salicaceae spp. It is recommended that flow
rate decrease at 1 to 3 cm d-1. This range of flow rates allows for the root system of
Salicaceae spp. to remain in contact with the receding instream and groundwater flows.
Timing of these rates should correspond with Salicaceae seed release which range
from mid-April to late May for Populus fremontii and from mid-May to late June for Salix
spp. While much research has been conducted to prescribe environmental flows in the
Central Valley, little has been done to ensure that these environmental flows regimes
are effective. It is recommended that monitoring protocol be implemented that
assesses the effectiveness of the Central Valley environmental flow regime.
Recommendations have also been made to improve flow planning framework and
implement an adaptive management approach to river restoration. These
recommendations will promote the success of environmental flow prescriptions in the
Central Valley and around the world.

6
Introduction
Rivers and associated riparian ecosystems are the networks that distribute fresh water
throughout earth. The riparian zone is the area of the stream channel between the low
and high water marks and that portion of the terrestrial landscape from the high water
mark toward the uplands where vegetation may be influenced by elevated water tables
or flooding and by the ability of the soils to hold water (Naiman and Décamps, 1997).
Throughout history rivers have provided mankind with many valuable services. These
services include flood control, erosion/sediment control, carbon and nitrogen
sequestration, food production, high biodiversity, temperature regulation, and water
purification (Palmer et al. 2009, Arthington 2012). Currently, fresh water from rivers has
been utilized as irrigation for agriculture, for human consumption, and for the creation of
hydroelectricity. Rivers and the fresh water they carry are necessary for the society to
exist.
Rivers around the world are threatened due to anthropogenic activities. Three factors
threatening the structure and function of river systems include: ecosystem destruction,
water chemistry alteration, and direct species additions or removals (Malmqvist and
Rundle 2002). These three factors can all be linked to anthropogenic practices that
modify a river’s hydrologic regime. These practices include land use, river
impoundments, and surface/groundwater abstraction (Arthington et al. 2010). Water is
the foundational factor effecting riparian ecosystem dynamics but is also a highly
significant resource for humanity.
River impoundments alter the hydrologic regime of rivers significantly through
construction of dams that typically decrease peak flows and the variability of hydrologic
regimes (Greet et al. 2011). An estimated $75 billion was spent by the World Bank in
the second half of the twentieth century constructing large dams (dams > 15 m) in over
92 countries across the world. The reservoirs created by these large dams have a
holding capacity of 7,000 to 10,000 km3, equivalent to roughly five times the volume of
the world’s rivers (Arthington 2012). California is home to 1,404 dams used for the
production of hydroelectricity, flood abatement, and water storage throughout the state

7
(KQED 2014). Management of these impoundments and the freshwater discharged for
agricultural uses, human consumption, or hydroelectricity needs to be thoughtfully
managed. The alteration of hydrologic regimes has changed composition, structure,
and function of the riparian ecosystems associated with these waters (Nilsson and
Berggren 2000). Flow on unregulated rivers in Mediterranean-type climates like
California is highly variable on an intra-annual and inter-annual temporal scale. This
variability is important to the functionality of healthy riparian ecosystems.
Management of allocated water from river impoundments is referred to as
“environmental flows.” Environmental flows describe the quantity, timing, and quality of
water flows required to sustain freshwater and estuarine ecosystems and the humans
that depend on these ecosystems (Arthington 2012). Environmental flows are
prescribed hydrologic regimes developed and implemented by environmental
managers. These prescribed flows must satisfy the ecological, agricultural, and societal
demands for water. Other terms used to describe environmental flows include
“instream flows,” “ecological flows,” “environmental water allocations,” “recruitment
flows” and “restoration flows” (Arthington et al. 2010).
Hydrology is considered the “master variable” (Power et al. 1995) because it greatly
influences other abiotic as well as biotic factors of a riparian ecosystem. The critical
components of hydrologic regimes include: magnitude, frequency, duration, timing, and
rate of change of flow (Richter et al. 1996, Poff et al. 1997). Magnitude refers to the
amount of discharge of water from a river at a given time and location. Magnitude is
usually measured in cubic feet per second (cfs). Frequency refers to how often a
discharge of a certain magnitude occurs. Duration is how long discharge of a certain
magnitude occurs. Timing is the annual temporal scale at which predictable flow rates
occur. The rate of change of flow, specifically the receding limb of the hydrographic
flood peaks is important to vegetation with phenologic adaptations to flow rate.

8
Figure 1: Five components of natural and altered flow regimes (Poff et al. 1997)
Each of these components must be carefully considered; together these components
dictate the biodiversity and ecological integrity of the river and surrounding riparian
ecosystem. Natural flow regimes, or flow regimes that mimic natural flow regimes,
create the conditions necessary to promote high levels of biodiversity and ecosystem
integrity within rivers and associated riparian zones (Naiman and Decamps 1997, Poff
et al. 1997). When natural flow regimes are not utilized as templates for environmental
flows or are abandoned all together, biodiversity and ecosystem integrity can decrease
dramatically.
Riparian ecosystems should be thought of as legitimate users of water (Naiman et al.
2002). Alteration of natural flow regimes is likely to affect riparian vegetation. Although
the effects of seasonal timing of flow on riparian vegetative communities are not well
understood (Poff and Zimmerman 2010), it is thought that these alterations will
negatively affect riparian vegetation (Nilsson and Berggren 2000, Catford et al. 2011).
Alterations in flow regimes increase the susceptibility of riparian ecosystems to invasion
by non-native species (Greet et al. 2013). It is hypothesized that altered flow regimes
create physical conditions that benefit non-natives, reduce competition from native
species as they are not well suited to altered flow regime conditions, and decrease

9
frequency and peak flows that promote species adapted for drier conditions (Catford et
al. 2011).
Alteration of seasonal timing of flow is a major threat to the health of riparian
ecosystems. Native tree species populations have declined along rivers with flow
regime alterations. Cottonwoods (Populus spp.) and willows (Salix spp.), belonging to
the Salicaceae family, are experiencing population declines throughout western North
America and in California (Mahoney and Rood 1998, Stella et al. 2006). These species
possess specialized morphological and reproductive adaptations for life along rivers.
Morphological adaptations of these riparian species to life in variable flows include
adventitious roots and flexible stems. An important reproductive adaptation is the
synchrony of receding peak flow and the release of seeds (Naiman and Decamps
1997). This process is known as “hydrochory” and is essential to the seedling
recruitment of Salicaceae species.
Table 1: Cottonwood and willow species common to riparian ecosystems of California
Common Name Scientific Name Family
Fremont cottonwood Populus fremontii Salicaceae
Gooding’s black willow Salix goodingii Salicaceae
sandbar willow or
narrow leaf willow
Salix exigua or
Salix exigua var. hindsiana
Salicaceae
Currently riparian ecosystems of California’s Central Valley are threatened due to
increase in demand for water and ongoing drought conditions. This last year (2013)
was the driest year in California’s recorded history. On January 17 of this year (2014)
Governor Jerry Brown declared California to be in a state of emergency and urged
Californians to reduce water consumption (Chappell 2014). The Central Valley was
naturally dominated by grassland ecosystems with patches of oak savanna, wetlands,
and riparian woodlands. Currently the land between the Coastal Range and the Sierra
Nevada Mountain Range is utilized mostly as farmland. The Central Valley is situated
in the middle of the state’s largest watershed with the Sacramento and the San Joaquin

10
Rivers constituting the largest rivers in the watershed. These rivers meet at the San
Francisco Bay Delta and flow into the San Francisco Bay before flowing in the Pacific
Ocean.
Currently, the rivers in the Central Valley are stressed due to water withdrawal. This
stress is compounded with the current and future drought conditions. Riparian
ecosystems are becoming increasingly vulnerable to invasion of non-native species,
decreased biodiversity, and decreased ecosystem integrity. Populations of Salicaceae
species have declined in the rivers of the Central Valley due to the same conditions. In
this research paper, I investigated environmental flow recommendations designed to
promote the recruitment of Salicaceae species seedlings in California’s Central Valley
along two rivers, the San Joaquin and Sacramento Rivers.
Methodology
I conducted a literature search for this study to find general information on Salicaceae
spp. common to California’s Central Valley riparian ecosystems. The focus of this study
is three species: Populus fremontii, Salix exigua, and Salix goodingii. Information was
collected outlining their ecology, including: distribution, adaptations, life strategies, and
function in the ecosystem. This information led to the establishment of general
requirements needed to promote and sustain populations of these species.
Environmental flow recommendations for Salicaceae recruitment are presented using
the Recruitment Box Model. This model creates a box over an annual hydrograph. An
annual hydrograph is the graph of flow magnitude of over time. The vertical sides of the
box correspond with the timings of seed dispersal for Salicaceae spp. The horizontal
sides of the box correspond with flow magnitude or river stage height and
corresponding groundwater recession requirements needed to give seedling roots a
constant supply of water. It is assumed that the river stage height is equivalent to the
elevation of groundwater along the stream banks. The effects of altered flow regimes
on Salicaceae spp. are briefly discussed.

11
California’s Central Valley is the area of interest for this study. This area is a vast
drainage basin that flows into the San Francisco Bay Delta, and out of the Golden Gate
into the Pacific Ocean. This region runs about 450 miles north and south and is about
40 to 60 miles wide. It is composed of two smaller valleys: the Sacramento Valley to
the north and the San Joaquin to the south. For this study the data from each river will
be synthesized to provide environmental flow recommendations for Salicaceae
recruitment.
Throughout this study, flow data prior to flow alteration will be referred to as the historic
flow regime instead of the natural flow regime. The term natural flow regime infers an
absence of any flow alteration or impediment. Flow gauge data has not been collected
on a long enough time scale, pre-alteration, to confidently state that it represents the
natural flow regime. Historic flow regime data is the data set that represents the natural
flow regime most closely. Historic flow regime data were compared to altered flow
regime data for the two rivers. Historic and altered flow regime data is presented in the
form of hydrographs. Hydrographs for both historic and altered flow regimes were
visually analyzed for this report.
Hydrologic data for both rivers were analyzed using the Hydrograph Component
Analysis (HCA) and Indicators of Hydrologic Alteration (IHA) analysis. These analyses
were conducted in the two Cain reports, comparing historic and altered flow regimes for
each river. HCA describes the components of the annual hydrograph in terms of the
aspects of the natural flow regime, including: magnitude, timing, duration, frequency,
and rate of change of flow. IHA analysis takes into account 33 ecological parameters to
hypothesize ecological effects of altered flow (Richter et al. 1996).
Figure 2 shows the annual hydrograph for the San Joaquin River is broken down into
seven main components of interest:
1. Fall baseflow – Baseflows necessary to sustain river height from October to
December. These are typically the lowest flows of the year.

12
2. Fall storm pulses -- Peak flows corresponding with the Fall Baseflows. These
are short relatively weak flood events.
3. Winter floods – Typically from mid-December to late-March. These stronger
flood events are responsible for the scouring of stream banks and creation of
lateral bars, point bars, and islands.
4. Winter baseflows – The low flows correspond with the winter floods. These
events are the valleys in between the floods.
5. Snowmelt floods – Spring snowmelt floods are weaker flood events than Winter
Floods.
6. Snowmelt recession – The ramping event that connects the increased winter
flows with the Summer Baseflow.
7. Summer baseflows – The minimum flows that sustain the river through the dry
summer months (Cain et al. 2003).
Figure 2: HCA components used for the flow regime analysis on the San Joaquin River (Cain et al. 2003).
Figure 3 shows the annual hydrograph for the Sacramento River is broken down into
four main components of interest:

13
1. Summer baseflows – The minimum flows needed to sustain the river through the
dry summer months.
2. Winter floods – Peak flows on the hydrograph from the beginning of December
through April.
3. Winter baseflows – The minimum flows in between the Winter Floods.
4. Snowmelt runoff – The recession limb of the hydrograph that connects the
increased winter flows to the Summer Baseflows (Cain 2008).
Data were organized according to wet, above normal, below normal, dry and critical
years for the Sacramento flow. Median flow was calculated for the historic and the
altered flow regimes, and 25th percentile and 75th percentile flows were calculated for
the historic flow regime only.
Figure 3: HCA components used for the flow regime analysis on the Sacramento River (Cain 2008).
Environmental flow regime recommendations for Salicaceae spp. were derived for the
snowmelt runoff component of the annual hydrograph using the Recruitment Box Model
format. The synthesis of this format requires:
site hydrology be assessed

14
seedling release and viability be documented
Seedling response to water stress be investigated
The environmental flows associated with Salicaceae spp. recruitment and the snowmelt
recession component of the hydrograph, are called recruitment flows and will be the
focus of flow recommendations. Recruitment flows are named such because they
promote recruitment of tree seedlings along the stream banks. Recruitment flows will
be a focal component of the environmental flow regime for this study.
Current flows for each restoration project will be provided. Vegetation coverage will be
compared before and after the implementation of an environmental flow prescription.
Salicaceae spp.
The Salicaceae family is comprised of willows (Salix spp.) and cottonwoods (Populus
spp.). The origin of the word Salicaceae means “near water” (Rood et al. 2007). This is
a fitting name for these trees whose life strategies revolve around the seasonal
variability of the water provided by rivers. Willows and cottonwood species recruitment
occurs on bare soil after a flood disturbance has rid the stream banks of competing
species. These pioneer species are important to riparian habitat structure because they
secure substrate, fix carbon, and create vertical habitat layers (Stillwater Sciences
2006). These life strategies allow for these species to occupy similar habitats within
similar geographic distributions. Riparian ecosystems of the western United States
display banded patterns of Salicaceae spp. These vertical banded patterns are in a
large part affected by instream flows and groundwater dynamics dictated by the
hydrologic regime. This pattern is also affected by differences in substrates. These
requirements allow for their seedling recruitment requirements to be similar.
Populus spp. - Ecology
The cottonwood species of interest for this study the Fremont cottonwood (Populus
fremontii). Populus fremontii ranges geographically throughout riparian ecosystems in
California’s Central Valley, the western Sierra, and near coastal Southern California.
15
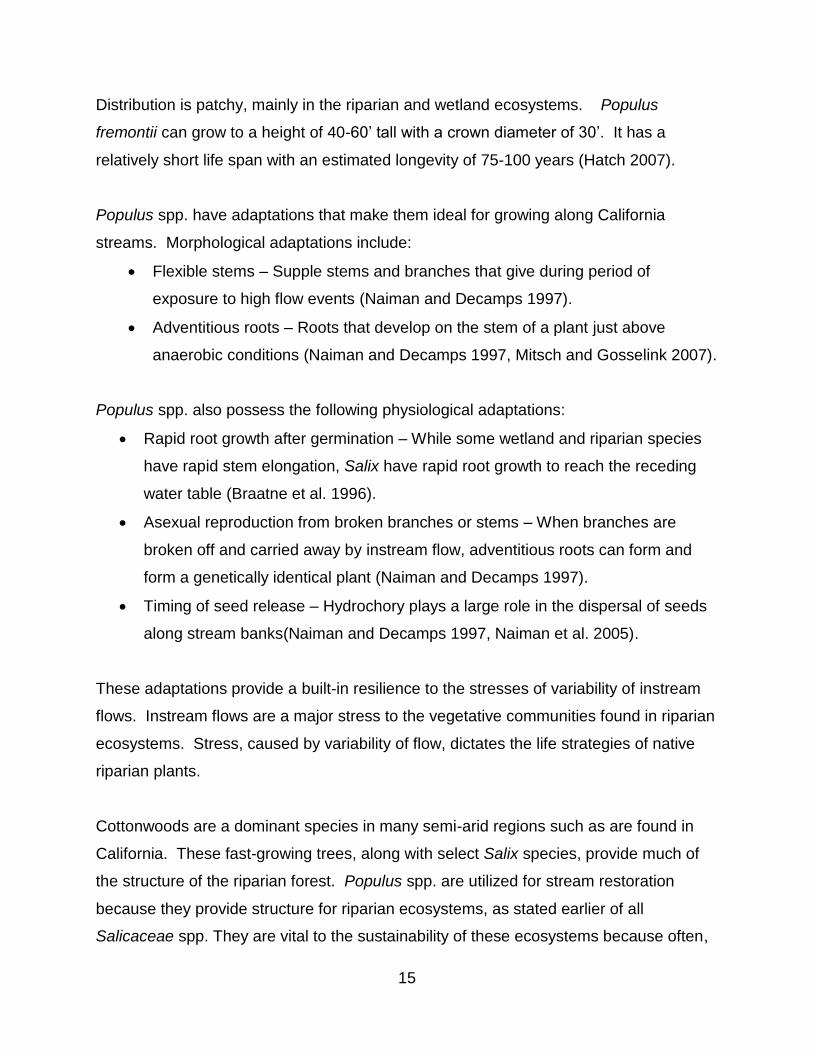
Distribution is patchy, mainly in the riparian and wetland ecosystems. Populus
fremontii can grow to a height of 40-60’ tall with a crown diameter of 30’. It has a
relatively short life span with an estimated longevity of 75-100 years (Hatch 2007).
Populus spp. have adaptations that make them ideal for growing along California
streams. Morphological adaptations include:
Flexible stems – Supple stems and branches that give during period of
exposure to high flow events (Naiman and Decamps 1997).
Adventitious roots – Roots that develop on the stem of a plant just above
anaerobic conditions (Naiman and Decamps 1997, Mitsch and Gosselink 2007).
Populus spp. also possess the following physiological adaptations:
Rapid root growth after germination – While some wetland and riparian species
have rapid stem elongation, Salix have rapid root growth to reach the receding
water table (Braatne et al. 1996).
Asexual reproduction from broken branches or stems – When branches are
broken off and carried away by instream flow, adventitious roots can form and
form a genetically identical plant (Naiman and Decamps 1997).
Timing of seed release – Hydrochory plays a large role in the dispersal of seeds
along stream banks(Naiman and Decamps 1997, Naiman et al. 2005).
These adaptations provide a built-in resilience to the stresses of variability of instream
flows. Instream flows are a major stress to the vegetative communities found in riparian
ecosystems. Stress, caused by variability of flow, dictates the life strategies of native
riparian plants.
Cottonwoods are a dominant species in many semi-arid regions such as are found in
California. These fast-growing trees, along with select Salix species, provide much of
the structure of the riparian forest. Populus spp. are utilized for stream restoration
because they provide structure for riparian ecosystems, as stated earlier of all
Salicaceae spp. They are vital to the sustainability of these ecosystems because often,

16
if they are extirpated, no other tree species will replace them (Braatne et al. 1996). This
keystone species and the abiotic factors that promote its recruitment and survivorship
must be a priority in California.
Populus spp. - Seedling Recruitment Requirements
Disturbance plays a key role in the
recruitment and establishment of
Populus spp. The phenology of
Populus spp. is determined by
photoperiod (i.e., the amount of light
present at a given time) and
temperature. This makes the release
of Populus seeds relatively predictable.
Populus spp. have a range of seedling
releases from March to July (Braatne
et al. 1996), with variation throughout
the various climate regions of the
United States.
Under conditions of natural flow
regimes, the release of seeds follows
the peak flows. These peak flows, or
flood pulses, are essential to the
maintenance of ecosystem function.
The flood pulse is easily seen in Figure
4, the peak of hydrograph is the flood
pulse. It is important because the high
flow rate scours the banks of the river,
leaving behind barren substrate. Barren
substrate is ideal for the recruitment of Populus spp. as their seedlings compete poorly
with other species. The pulse flow also carries sediment that is crucial for the creation
Figure 4: Recruitment Box Model for Populus spp. (Mahoney and Rood 1998).

17
of geomorphic features, such as point bars, lateral bars, and islands, which form crucial
habitat for Populus seedlings (Rood et al. 2007).
The recession limb of this hydrograph is critical information. Populus spp. need a
connection to the receding ground water in order to survive to the next season. Rapid
root elongation is an important adaptation that promotes recruitment. In semi-arid areas
of the United States, such as California’s Central Valley, rivers are often losing streams.
(i.e. those where water leaves the stream to recharge groundwater) (Ward and Trimble
2004). Semi-arid rivers usually exhibit groundwater levels that are equivalent to in
stream flow levels. The recession limb is important because the stage height is a real
time representation of the groundwater height. The capillary fringe serves as a buffer
zone between substrate surfaces to the receding water table.
Populus spp. roots can grow an estimated 60 – 100 cm to the capillary fringe. The
capillary fringe can extend 50 to 100 cm above the water table. Figure 5, shows the
location of the capillary fringe in relation to the river and groundwater height for semi-
arid rivers. A recruitment range above baseflow has been established. In coarse
textured substrate the recruitment range is 60-150 cm above baseflow. In fine textured
substrate the recruitment range is 60 – 200 cm above baseflow (Mahoney and Rood
1998).
Figure 5: Diagram of the importance of water table heights and Populus spp. seedling recuitment (Mahoney and Rood 1998).

18
A recession limb slope of 2.5 cm/day is suggested for prescribed flow regimes with
Populus spp. recruitment as a priority (Mahoney and Rood 1998).
Populus spp. - Effects of Altered Flow Regimes
Altering the disturbance regime of any ecosystem can make it prone to invasion by non-
native species (Merritt and Poff 2010). The predominant disturbance of the Central
Valley Rivers is flooding due to peak flows. When these flow peaks are diminished due
to flow diversions much of the variability of the natural flow regime is muted. Variability
in flow magnitude is what drives river health(Poff et al. 1997). The complexity of flow
magnitude, duration, frequency, timing, and rate of change of flow needs to be
understood at many different time scales. When this complex flow regime is altered the
peaks and troughs of the natural flow regime are smoothed out. This is detrimental to
species with phenologic adaptations. When these species are affected the ecosystem
becomes vulnerable to invasion by generalist and ruderal species, many of which are
non-native and invasive (Lytle and Poff 2004). Populus spp. are such a species with
phenologic adaptations and are thus affected by the alteration of flow regimes.
Salix spp. - Ecology
Two willow species are of interest for this study: Narrowleaf willow (Salix exigua) and
Gooding’s black willow (Salix goodingii). The Salix spp. can be found in wetlands and
in riparian ecosystems. This is evidence of their need for wet, moist soils. The Salix
spp. differ in geographic ranges only slightly Salix exigua ranges from Northern to
Southern California along the coast and eastward into the Central Valley. Salix
goodingii runs the length of California and east into the Central Valley. It is also
shrubby in size and stature, with an estimated height of 10-30’ tall. All of these Salix
spp. have an estimated life span of 40-60 years (Hatch 2007).
Salix spp. are a close relative of the Populus spp. and have many overlapping life
strategies for coping with life in the riparian ecosystems. Salix spp. morphological
adaptations include:
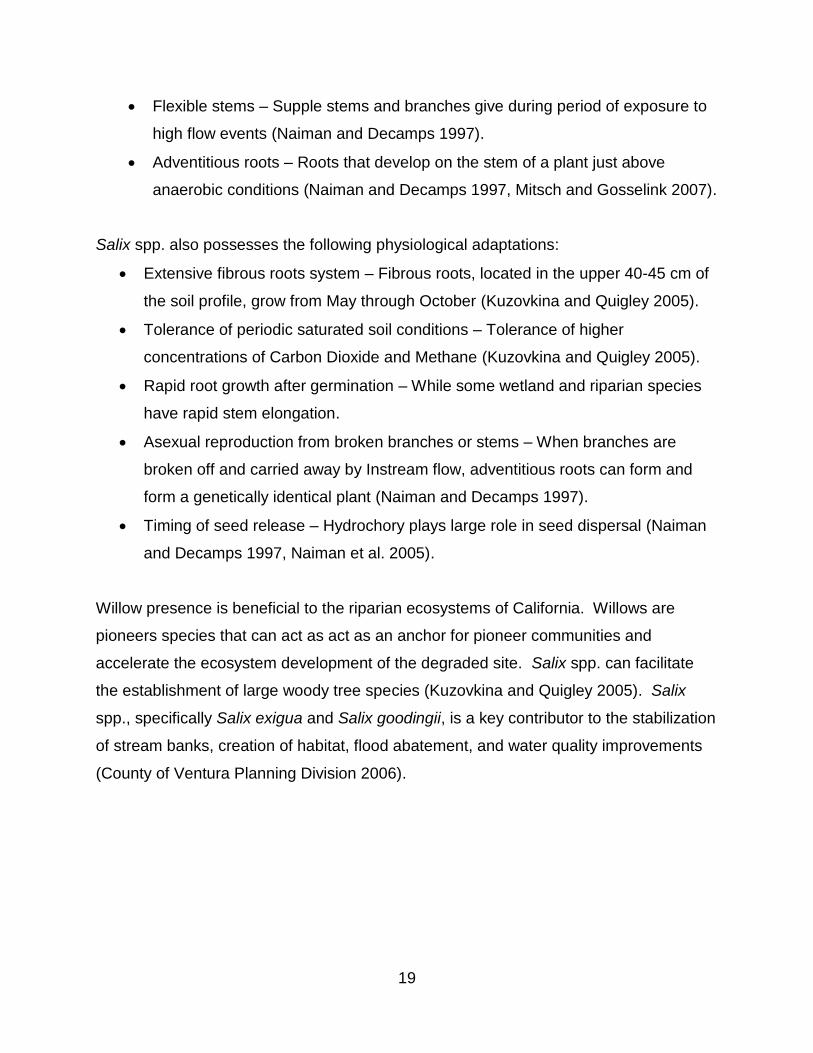
19
Flexible stems – Supple stems and branches give during period of exposure to
high flow events (Naiman and Decamps 1997).
Adventitious roots – Roots that develop on the stem of a plant just above
anaerobic conditions (Naiman and Decamps 1997, Mitsch and Gosselink 2007).
Salix spp. also possesses the following physiological adaptations:
Extensive fibrous roots system – Fibrous roots, located in the upper 40-45 cm of
the soil profile, grow from May through October (Kuzovkina and Quigley 2005).
Tolerance of periodic saturated soil conditions – Tolerance of higher
concentrations of Carbon Dioxide and Methane (Kuzovkina and Quigley 2005).
Rapid root growth after germination – While some wetland and riparian species
have rapid stem elongation.
Asexual reproduction from broken branches or stems – When branches are
broken off and carried away by Instream flow, adventitious roots can form and
form a genetically identical plant (Naiman and Decamps 1997).
Timing of seed release – Hydrochory plays large role in seed dispersal (Naiman
and Decamps 1997, Naiman et al. 2005).
Willow presence is beneficial to the riparian ecosystems of California. Willows are
pioneers species that can act as act as an anchor for pioneer communities and
accelerate the ecosystem development of the degraded site. Salix spp. can facilitate
the establishment of large woody tree species (Kuzovkina and Quigley 2005). Salix
spp., specifically Salix exigua and Salix goodingii, is a key contributor to the stabilization
of stream banks, creation of habitat, flood abatement, and water quality improvements
(County of Ventura Planning Division 2006).

20
Salix spp. – Seedling
Recruitment Requirements
Salix spp. like the Populus spp. is
dependent on a disturbance
regime. The flood pulse provides
Salix spp. with a pulse of nutrients,
sediments, organic material, and
energy. It is the energy that is
utilized in the process of
hydrochory. Salix spp. seed
release differs slightly with
differences in species, geographic
location, and annual variation in
weather patterns. A longitudinal
study of seed releases of Populus
fremontii, Salix exigua, and Salix
goodingii was conducted at three
remnant riparian ecosystems in the
San Joaquin Basin in California.
The study calculated the day of the
calendar year that the seed release
began and ended. Salix exigua
had a mean day of seed release
initiation for all three sites on all
three years of 150; this is equivalent
to April 30. Salix goodingii also had
a mean day of seed release initiation for all three sites on all three years of 150; this is
equivalent to April 30 (Stella et al. 2006). These initial release dates represent the three
San Joaquin Basin sites during the 2002, 2003, and 2004 calendar year. Salix exigua
begins seeding in mid-May and continues through mid-July (U. S. Forest Service 2014).
Figure 6: Comparison of Populus spp. and Salix spp. in the Recruitment Box Model (Amlin and Rood 2002).

21
A similar study was conducted comparing the groundwater requirements of Salix spp.
and Populus spp. Salix spp. require peak flows before the release of their seeds to
scour the river banks, creating habitat and reducing competition with other seedlings
found in sandy substrate near the river channel. Salix spp. generally seed after the
Populus spp. but the Populus spp. seedling recruitment occurs at a higher stream stage
and thus occurs at a higher elevation along the stream banks leading to the banded
pattern mentioned earlier. As the flood pulse subsides the rate of decrease of the
receding limb of the hydrograph, also subsides. Salix spp. require a stream stage
height decrease of 1cm day-1 (Amlin and Rood 2002). This is the general estimation for
Salix spp. and differs from across species and geographic distributions.
Salix spp. - Effects of Altered Flow Regimes
Alteration of the natural flow regime results in an increase in erosion, and in a decrease
of Salix spp. abundance due to lack of suitable habitat. Figure 7 shows the percentage
of transects with Salix exigua, taken along the Hell’s Canyon corridor along the Snake
River. The free flowing Salmon River has the highest percentage of Salix exigua, thus
correlating the natural flow regime with the promotion and survivorship of native
species. The downstream reaches exhibit the lowest percentage due to the alteration of
the natural flow regime(Rood et al. 2011).
Figure 7: Percentage of transects along Hell's Canyon with Salix exigua (Rood et al. 2011).
22
When Salix spp. are extirpated from a site there are effects on other aspects of the
ecosystem. Erosion increases in the downstream reaches where the Salix spp. have
been extirpated due to the low sediment loads of these waters. These low sediment
loads are trapped in the upstream reaches of dammed rivers. This water flows through
the downstream reaches and erodes instead of deposits. Erosion also negatively
affects Salix spp. recruitment and survivorship Due to the destruction of point bars,
lateral bars, and islands created by the deposition of sediment in rivers. These
geomorphic features are the habitat of the Salix spp. Such destruction of habitat
causes the vertical movement of these species vertically to higher location along the
stream bank.
Central Valley Hydrology
California’s Central Valley is the largest watershed in California with a surface area of
75,000 mi2. It is confined by the Coastal Ranges on the west, the Sierra Nevada on the
east, the Tehachapi Mountains on the south, and the Cascade Mountains on the north.
This large watershed is home to the Sacramento and San Joaquin Rivers, the two
largest rivers in California. These two rivers provide 25 million Californians with drinking
water and irrigate 7,000 mi2 of farm land (U. S. Environmental Protection Agency 2014).
The hydrology of Central Valley Rivers is driven by California’s topography and
Mediterranean climate. California’s climate is characterized by large rain events
typically from November to March, and these winter storms are typically the only source
of precipitation throughout the year. Summers in California are characterized by
drought conditions. Stark contrast in seasons drives the hydrology of California Rivers.
The large winter rain events cause the winter flood peaks in the hydrograph.
Consecutive winter rain events add to the increase of the winter baseflow until the rains
subside. Dry summer and early fall conditions slow the flow magnitude to a minimum.
The majority of winter precipitation that falls in the upper elevations of the Central Valley
falls as snow. While these winter storms bring rain to the lower elevations of the Central

23
Valley, snow simultaneously falls in the upper elevation. These snows cause a lag in
flow events along Central Valley Rivers. It is not until spring snowmelts occur that the
snow adds to the flow of the river. This is component of the hydrograph is generally
known as the receding limb or spring snowmelts component. Spring snowmelt events
are extremely important to the recruitment of Salicaceae spp. (Mount 1995).
San Joaquin River Background
The San Joaquin River is the second largest river in California flowing 350 miles from
the Sierra Nevada Mountains to the San Francisco Bay Delta. This large river once
supported the southernmost Chinook salmon runs on the west coast of the United
States. After the completion of the Friant Dam in 1942, nearly 95% of the instream flow
from the San Joaquin was diverted for agricultural uses. The San Joaquin Restoration
Project encompasses the river reach between the Friant Dam and the river’s confluence
with the Merced River (Natural Resources Defense Council 2013). The alteration of the
historic flow regime is due in a large part to the presence of the Friant Dam and many
other water diversions for agricultural use.
In 1988 the National Resources Defense Council (NRDC) led a law suit with several
other conservation organizations against the U. S. Bureau of Reclamation, the U. S.
Department of Commerce, National Marine Fisheries Service, U. S. Fish and Wildlife
Service, and numerous water districts associated with Friant Dam operations. This
lawsuit was filed on the basis that Friant Dam operations were the cause of decreased
flow magnitude in the river, and the reason that a 60 mile reach runs dry annually during
the summer months. Decreases in flow magnitude have negatively affected Salmonid
spp. within the river due to the 60 mile gap in the river flow. On September 13, 2006,
NRDC et al v. Kirk Rodgers et al. was settled in favor of the NRDC and other
conservation groups. This environmental lawsuit settlement calls for the implementation
of an environmental flow regime that would guarantee continuous flow, except in critical
low water years (WY), from the Friant Dam to confluence with the Merced River.
Improving the health of riparian ecosystems is a central issue in the reintroduction and
conservation of Salmonid spp. in the San Joaquin River. Salicaceae spp. are focal

24
species in the riparian ecosystem because they are dominant species that affect water
temperature, the detrital food web, and provide habitat structure. The restoration
project will run a 150 mile stretch of the river from the Friant Dam to the confluence of
the Merced River. Implementation of this project will be conducted under the guidance
of two main objectives:
1. To restore flows necessary to promote, sustain, and reintroduce Salmonid spp. in
the San Joaquin River.
2. To avoid decreases in water diversions to the water contractors along the river as
a result of the Interim or Restoration Flows.
On January 31, 2014, the San Joaquin River Restoration Project (SJRRP) announced
that the 2014 WY was classified as a critical low year. Restoration flows were halted on
February 1, one month earlier than scheduled. This decision was supported by the
restoration administrator. On February 1, 2014, flow from the Friant Dam decreased at
50 cfs/day until flow reaches 200 cfs. At that time flow will be incrementally decreased
until the only flow from the Friant Dam will be flow necessary to satisfy needs of prior
water rights holders in the upper San Joaquin River. It was suggested that decreasing
flows one month earlier would allow for an increase in environmental flow credits to be
utilized in the future and for current flow to be utilized for human needs (Johnson 2014).
San Joaquin River Reach Descriptions
Vegetation types were established using Holland’s vegetation type classification
(Holland 1986). Between July and October 2000, the California Department of Water
Resources (CDWR) conducted a vegetation survey along the five river reaches. The
three vegetation types of interest in this study are the cottonwood riparian forest, willow
riparian forest, and willow scrub.
Cottonwood riparian forest and willow riparian forests types are based on Holland’s
Great Valley Cottonwood Riparian Forest (#61410). Populus fremontii and Salix

25
goodingii dominate the cottonwood riparian forest. Other present tree species include
red willow (Salix laevigata), arroyo willow (Salix lasiolepis), box elder (Acer negundo),
and ash (Fraxinus Latifolia). Older stands can have trees ranging in height from 40 to
60 ft tall. Low density cottonwood riparian forests have the same species makeup but
display less than 50% coverage of these species. Tree heights usually range from 10 to
50 ft tall. These lower density stands are susceptible to invasion by non-native species.
Willow riparian forest is almost exclusively dominated by Salix goodingii. Other present
tree species include Populus fremontii, Salix laevigata, Salix lasiolepis, Acer negundo,
Fraxinus Latifolia. Low density willow riparian forests have the same species makeup
but display less than 50% coverage of these species. Tree heights usually range from
10 to 50 ft tall.
Willow scrub is based on Holland’s Great Valley Willow Scrub (#63410). Stands occur
in disturbed sand and gravel substrate, along open channel. These physical
characteristics support shrubby willow stands less than 15 ft tall. The dominant species
are Salix goodingii and Salix exigua. Low density willow scrub have the same species
makeup but display less than 50% coverage of these species (Moise and Hendrickson
2002).
The SJRRP has broken the river into five river reaches. Some river reaches are broken
into sub-reaches which are noted by the presence of a letter. Each of the river reaches
is marked by characteristic vegetation types and by distinct landmarks such as the
confluence of the San Joaquin and larger tributaries. The CDWR survey established
125 transects perpendicular to the river, along the five river reaches. The locations of
the transects were chosen to represent a range of vegetation types. At each transect
herbaceous plant cover, tree and shrub cover, and diameter at breast height (DBH) was
recorded. The vegetation types of each of the river reaches was established from the
information that was collected at each transect. The following descriptions were those
taken by the California Department of Water in 2000 (McBain and Trush 2002).

26
River Reach 1 extends from Friant Dam, river mile (RM) 267 to Gravelly Ford, RM 229.
This reach is broken into Sub Reaches 1A and 1B. Reach 1A extends from the Friant
Dam to RM 243 at Highway 99 Bridge in Herndon. Reach 1A is the most urban reach
of the entire river and is confined by steep bluffs on each side of the river. The two
main vegetation types in this reach are riparian oak forest and mixed riparian forest.
River Reach 1A contains 290 acres of willow scrub and 223 acres of willow riparian
forest. Reach 1B is very narrowly confined by levees and is about one half herbaceous
and exotic plants. Vegetation types include 193 acres of cottonwood riparian forests,
155 acres of willow scrub, and 120 acres of willow riparian forest.
River Reach 2 extends from Gravelly Ford, RM 229 to Mendota Pool RM 205. This
reach has coarse substrate and drains very quickly. Given the characteristics of the
substrate, riparian forest cannot be sustained in large quantities in this reach.
Herbaceous vegetation makes up about 71% of this reach. Vegetation types in this
reach include 254.2 acres of willow scrub, 165.4 acres of willow riparian forest, and
125.4 acres of cottonwood riparian forest. Reach 2 boasts 79.0 acre/mi native
vegetation per mile ratio.
River Reach 3 extends from RM 230 to 135; this is from Mendota Pool to Sack Dam.
This reach has a confined channel that flows continuously but flows are seasonally low.
This reach has the lowest percentage of herbaceous cover (25.2) and the highest% of
riparian forest (53.7). Vegetation types include 460.8 acres of cottonwood riparian
forests, 230.5 acres of willow scrub, and 124.8 acres of willow riparian forest.
River Reach 4 extends from the Sack Dam to the Bear Creek confluence (RM 136 –
182). River Reach 4 is broken into River Reach 4A and 4B, with River Reach 4A
extending from the Sack Dam to the boundary of the San Luis National Refuge (RM 148
– 182). This reach has the lowest ratio of native vegetation per RM. By vegetation type
Reach 4A is 66.7% herbaceous, 22.4% forest, and 5% scrub. Of the forest vegetation
89.1 acres were willow riparian and 19.3 were cottonwood riparian forest. River Reach
4B (RM 136 – RM 148) is unique because of elevated water table levels compared to
27
the other reaches of the San Joaquin. This reach also runs through public lands in
which native vegetation is protected. Reach 4B records high native vegetation per RM
ratio of 512.8 acres/mile. Reach 4B by vegetation type was 74.3% herbaceous, 12.1%
forest, and 13.6% scrub. Of the forest vegetation 701.2 acres were willow riparian
forest, 132.1% acres were willow scrub, and 36.9% were cottonwood riparian forest.
River Reach 5 extends from the confluence of Bear Creek (RM 136) to the confluence
of the Merced River (RM 118). This reach has similar characteristics to River Reach
4B. Reach 5 borders about eight miles of agricultural land and runs through relatively
undisturbed lands of duck clubs and state and federal protected parks and refuges.
Reach 4B and Reach 5 are home to more than twice the wetland acreage of the
remaining reaches combined. By vegetation type Reach 5 was 86% herbaceous,
12.2% forest, and 1.7% willow scrub. Of the forest 972.6 acres were willow riparian
forest, 86 acres were willow scrub, and 36.25% were cottonwood riparian forest
(McBain and Trush 2002, Moise and Hendrickson 2002).
According to the 2000 CDWR data collection, the largest cottonwood riparian forest
stands were located in River Reach 3 (441 acres), River Reach 1A (167 acres), and
River Reach 1B (79 acres). The largest cottonwood riparian forests in low density, were
located in River Reach 1B (114 acres), River Reach 2A (41 acres), and River Reach 1A
(27 acres). The largest stands of willow riparian forests were River Reach 5 (590
acres), River Reach 4B (508 acres), and River Reach 1A (205 acres). The largest
stands of willow riparian forest in low density, were located in River Reach 5 (308
acres), River Reach 4B (118 acres), and River Reach 1A (28 acres). The largest
stands of willow scrub were River Reach 1A (216 acres), River Reach 3 (190 acres),
and River Reach 1B (113 acres). The largest stands of willow scrub in low density,
were located in River Reach 2A (124 acres), River Reach 1A (74 acres), and River
Reach 3 (41 acres) (McBain and Trush 2002, Moise and Hendrickson 2002, Stillwater
Sciences 2003a).

28
River Reach 1A was in the top three of each of the six vegetation types. Even though
this was the most urban of all of the reaches this area promotes Salicaceae spp.
recruitment and survivorship. While River Reach 3 contains the largest amount of
mixed riparian forest by acre, a single dominant Salicaceae spp. type is not present.
Willow scrub is in the top three vegetation types in Reach 3. Reach 5 contains the
largest amount of willow riparian forest. Because the San Joaquin is a dynamic river
system that contains a mosaic of vegetation patches, it is important to observe patch
dynamics at the river reach scale and at the river scale to understand the vegetative
coverage pre-restoration.
San Joaquin River Hydrology
Hydrology was assessed for the San Joaquin River downstream of the Friant Dam to
the town of Newman, near the confluence of the Merced River. All data was collected
from two USGS stream gauges. Gauge # 11-251000, just below the Friant Dam, is
located at river mile 268 and has been in existence since 1907. Gauge #11-254000,
near the town of Mendota, is located at river mile 207 and has data ranging from 1939 –
1954 and from 2000 –present (United States Geological Survey 2014).
Table 2: Reoccurrence intervals for historic and altered flow regimes along the San Joaquin River (Cain et
al. 2003)

29
Significant alterations to the timing, magnitude, duration, frequency, and rate of change
are evident in the altered flow regime compared to the natural flow regime for the San
Joaquin River. Table 2 shows, flow magnitude decrease observed in reoccurrence
intervals for annual peak flows. The 1.5-year to 2-year flood events are thought to be
instrumental in reshaping the geomorphology of a river system by mobilizing bed loads
and defining channel geometry. Table 2 shows peak flows for the San Joaquin River
have drastically decreased from 8,651 cfs to 636 cfs. This decrease in flow will
decrease the geomorphic dynamics of the river and in turn affect habitat for native
species, including Salicaceae spp. The 5-year to 10-year flood events are a more
relevant flow range for Salicaceae spp. because it is in this range that scouring of
riverbanks occurs and bar morphology is changed within the river. At these flow rates,
the difference between the historic and altered flow rates differs by more than 30,000
cfs. With these significant decreases in flow rates at specific reoccurrence intervals,
river processes are being reduced tremendously.
The IHA analysis found that the most significant changes in flow include the following:
Average monthly flows have decreased by 82-97% along the middle San Joaquin
River.
The timing of the annual low flows are delayed a month from November to
December and the annual high flows delayed a month from May to June.
Figure 8 show low pulse flows, those in the 25th percentile or less, have
increased 900%. This is an increase of 5 to 54 days a year that the middle San
Joaquin River experiences flows in the 25th percentile or less (Cain et al. 2003).

30
Figure 8: Low pulse flows increase after implementation of Friant Dam (Cain et al. 2003).
The HCA found that the most significant changes in flow include the following:
Water yields have decreased from 1,813,000 AF to 528,000 AF, a 71% reduction
in yield.
Summer and fall baseflows naturally ranged from 200 to 1000 cfs, now are rarely
greater than 100 cfs.
The spring snowmelt runoff component of the hydrograph (recession limb) is
critically reduced. Historic flows ranged from 6000 cfs during dry water years to
18,000 during extremely wet water years, with peaks up to 30,000 cfs. Altered
flows range from 150 to 200 cfs during dry water years(Cain et al. 2003).

31
Figure 9: Wet historic and altered water years, along the San Joaquin (Cain et al. 2003).
Hydrographic comparisons display the drastic alterations in flow regimes. An overall
reduction in flow magnitude is apparent in the vertical height of the hydrographs.
Historic flow regime hydrograph maintains a higher cfs for the majority of the water year.
This alteration will lead to greater Salicaceae spp. seedling mortality. Lower flows lead
to lower seedling establishment along the river. This lower establishment makes
seedling much more susceptible to scour during wetter water years. Summer and fall
baseflows are comparable for three months of the water year. Flow magnitude affects
the river dynamics needed to shape river morphology. Scour, deposition, mobilization
of bed load, and the creation of river sands bars occur at a diverse range of flows.
Environmental flows without any resemblance to natural flow regimes will lead to more
static river systems that lack health and ability for regeneration.
Frequency of flow events are diminished in the altered flow regime. Each spike in the
hydrograph is representational of a rain or snowmelt event. While the historic

32
hydrograph has many peaks and valleys the altered flow regime is a whittled down
version of the natural. Little resemblance remains between the two.
Duration and timing of flood events is also critically altered. While the historic
hydrograph increases from fall baseflow in December the altered hydrograph does not
increase until mid-January. The natural hydrograph spikes in February, representing
late winter rain events, and then recedes to an elevated winter baseflow. A ramping
disturbance flow represents increasing cfs due to rain and snowmelt runoff (Naiman et
al. 2005). The winter snowmelt peaks in June before gradually receding to summer
baseflow. The altered hydrograph has much lower winter flows and does not display a
ramping disturbance flow or increasing winter baseflows. After increased discharge
events on the altered hydrograph occur, flow returns to an annual minimum flow.
Timing is also delayed about a month for each component of the hydrograph.
Rate of change of flow is greatly impacted; the historic hydrograph shows the presence
of a ramping disturbance flow while the altered hydrograph does not. The peaks of the
altered hydrograph increase and decrease at high rates of change, unlike the more
gradual rates of change present in the historic hydrograph. Each peak in the altered
hydrograph returns to an annual minimum flow greatly affecting the disturbance ecology
of the river system.
San Joaquin River - Salicaceae spp. Seed Release Timing
Seed release timing data for Salicaceae spp. is necessary for generating environmental
flow recommendations along the Sa Joaquin. Since, seed release timing varies
annually and from location to location, it is important establish a temporal range. Seed
release timing was studied along the San Joaquin by John Stella and his colleagues at
Stillwater Sciences. Between 2002 and 2004 seed fecundity index was calculated (i.e.
the average number of open catkins per tree in a given location.
At all locations, Populus fremontii and Salix goodingii have similar open catkins timings
and fecundity indexes. Salix exigua open catkins timings displayed a later peak release

33
than Populus fremontii and Salix goodingii and more irregular catkin opening timings.
This irregularity is hypothesized to be due to Salix exigua’s ability to clonally reproduce
when a branch is broken off and swept downstream. This difference in life strategies
could explain the difference in seed fecundity. Populus fremontii release their seeds
from mid-April through late May, Salix goodingii release their seeds from mid-May
through late June, and Salix exigua release their seeds immediately following Salix
goodingii.
Hydrochory is a phenomenon that is crucial to the establishment of Salicaceae spp.
seedlings. Figure 10 shows the sequential occurrence of peak flows caused by
snowmelt runoff and peak seed releases of Salicaceae spp. Populus fremontii seed
release peaks two to three weeks before the Salix spp. This occurred consistently in
the years these species were studied(Stella et al. 2006).
Figure 10: Annual hydrograph v. fecundity index (Stillwater Sciences 2006)
San Joaquin River - Salicaceae spp. Response to Receding Groundwater
Groundwater is essential for the recruitment of Salicaceae spp. seedling recruitment
after germination. Along rivers of the Central Valley the river stage is equivalent to the

34
height of groundwater. Salicaceae spp. require constant contact with a groundwater
source or they will not survive. Therefore, the rate of decrease of river height from
snowmelt peak to summer baseflow is crucial to the survival of Salicaceae seedlings.
Experiments conducted showed that for Populus fremontii the crucial threshold was a
rate of decrease of 1cm d-1, for Salix exigua the crucial threshold was a rate of decrease
of 1.5 cm d-1, and for Salix goodingii the crucial threshold was a rate of decrease of 3
cm d-1. At this rate Populus fremontii displayed a survival rate of 0.68, Salix goodingii
displayed a survival rate of 0.84, and Salix exigua displayed a survival rate of 0.64.
When the rate of decrease increased to 3 cm d-1, survival rates plummeted. Populus
fremontii survival rate decreased by 0.56 to 0.12, Salix goodingii decreased by 0.46 to
0.38, and Salix exigua decreased by 0.38 to 0.26. Seedling survival was highest from 0
– 1 cm d-1. Increased survivorship was positively correlated with increased root growth
rates. Overall Salix goodingii displayed the highest root growth rates and highest
survivorship under the largest range of receding groundwater rates (Stillwater Sciences
2006).
San Joaquin River Environmental Flow Recommendations
The natural flow regime‘s natural variability is beneficial to the overall health of a river
system(Poff et al. 1997). It is important that this variability be apparent in the
environmental flow regime prescription for any river. Environmental flows for Central
Valley Rivers should focus on the winter snowmelt component of the hydrograph.
Winter snowmelt is crucial to the establishment of Salicaceae spp. and other riparian
tree species.
Magnitude
Due to water diversions and the presence of dams along the San Joaquin River, an
overall decrease in flow magnitude is currently being experienced (McBain and Trush
2002, Cain et al. 2003). Key recommendations for flow magnitude along the San
Joaquin River provided by hydrographic components:

35
Summer baseflow – Flow should range from 200 to 400 cfs during the dry
summer months associated with California’s Mediterranean climate.
Winter floods – These peak winter flows are associated with large winter rain
storms. Natural winter floods are underrepresented in the current default
restoration flow schedule created by the SJRRP.
Winter baseflow - Depending on the restoration type-year winter baseflow will
increase as a ramping disturbance flow (i.e. a stair step shaped hydrographic
component). This ramping disturbance flow would mimic the natural winter
baseflow. Wet and normal-wet restoration type-years will experience a 4,000 cfs
flushing flow, as seen in figure 11. These flows occur from April 16-30 and have
geomorphological importance. Associated with the flushing flow, is a short lived
8,000 cfs flow. During wet restoration type-years recruitment flows may be
implemented. These are flows > 8,000 cfs that promote the recruitment and
survivorship of Salicaceae spp. along the stream bank and associated riparian
ecosystem (San Joaquin River Restoration Program 2010, 2013a).
Snowmelt recession– This component is most critical to the recruitment of
Salicaceae spp. California’s Central Valley. Snowmelt recession must mimic the
natural flow closely in order for seedling recruitment to occur. A major spike in
flow must occur to scour stream banks of vegetation, mobilize and deposit fine
sediments, and recharge the water table and soil moisture levels. The following
timeline outlines the general flow rates for recession limb of the winter snowmelt.

36
Figure 11: SRRJP restoration flow default schedule (San Joaquin River Restoration Program 2013a)
o March 15 – Starting at 1,500 cfs increase 300 cfs/day
o April 19 – Peak at 13,500 cfs, begin rapid decline of 500 cfs/day
o April 24 – Flow of 10,000 cfs ramp down is rapid and at 9,000 cfs ramp
down maintains 100 cfs/day ramp down to facilitate recruitment of Populus
fremontii.
o May 12 – At 7,500 cfs ramp down increases to 200 cfs/day
o June 1 – Second peak occurs at 7,000 cfs, this corresponds with Salix
goodingii recruitment timing.
o June 8 – Ramp down at 100 cfs/day to facilitate recruitment (Stillwater
Sciences 2003b)

37
Frequency
Due to this inter-annual variability in flow, the SJRRP has implemented a restoration
year-type classification system. It is useful for scheduling annual flow requirements in
the San Joaquin River, and ensuring inter-annual variability in the environmental flow
regime. This restoration year-type classification calculated the unimpaired inflow into
Millerton Lake, this is the Lake formed by the Friant Dam along the San Joaquin River.
Wet years are those when unimpaired flow > 2,500,000 acre feet (AF) per year.
Normal-wet years are those when unimpaired flow < 2,500,000 AF per year but >
1,450,000 AF per year. Normal-dry years are those when unimpaired flow < 1,450,000
AF per year but > 930,000 AF per year. Dry years are those when unimpaired flow <
930,000 AF per year but > 670,000 AF per year. Critical-high years are those when
unimpaired flow < 670,000 AF per year but > 400,000 AF per year. Critical-low years
are those when unimpaired flow < 400,000 AF per year (San Joaquin River Restoration
Program 2010, 2013a).
Each of these restoration year-types will determine a water allocation that may be
released from Friant and other dams along the San Joaquin. For the purpose of this
study the water allocations for the Friant Dam will be the only ones considered. Figure
11, shows the restoration year-type in the left hand column, the default restoration flow
schedule in the middle, and the water allocation in the right column. Water allocations
decrease as river conditions move from wet to dry years. Higher water allocations at
the Friant Dam allow for greater variation between winter peak flows and summer
baseflow.
Flushing flows are flows at 4,000 cfs that are only present during the wet restoration
type-years. These flows are designed to flush fine sediment and leave behind the
larger particles. Flushing flows are also associated with a short-lived (several hours)
8,000 cfs flow. This is another flow designed to facilitate geomorphic dynamics within
the river and associated riparian ecosystems. During wet years, the restoration
administrator has 90 days from the beginning of the flushing flows to schedule

38
recruitment flows. Recruitment flows are the larger magnitude flow events that facilitate
the recruitment of Salicaceae spp. along the stream banks and associated riparian
ecosystems (San Joaquin River Restoration Program 2013a). Recruitment flow will not
be scheduled every year however this is characteristic of the natural flow regime.
Duration
Restoration flows begin on March 1, because the restoration year begins in March.
From March 1 to May 28 the spring rise and pulse flows occur along the San Joaquin.
The spring rise pulse flow would be equivalent to the winter baseflow described in Cain
2008. Spring rise and pulse flows is considered a flexible flow period. This means that
the timing of release can be modified by the restoration administrator. Since this
component of the hydrograph is dependent on the timing of Salicaceae spp. seed
release its timing must be modified slightly from year to year. Summer baseflow occurs
from May 29 to August 31, it is equivalent to the hydrograph component of the same
name from Cain 2008. Spring and fall run spawning and incubation flows occur
between September 1 and December 31. This restoration hydrograph component is
designed to promote the recruitment and survivorship of Salmonid spp. and is the other
flexible flow period. This restoration hydrographic component is equivalent to the tail
end of summer baseflows and winter floods from Cain 2008. A small peak is scheduled
during this time and is aimed at facilitating Salmonid spp. survival. The winter flood
component from Cain 2008 is underrepresented here. Winter baseflows occur between
January 1 and February 28/29 and are equivalent to the beginning of the hydrograph
component of the same name from Cain 2008 (San Joaquin River Restoration Program
2010, 2013a).
Timing
Timing is variable. Flexible flow periods were created to adhere to the most critical
aspect of the natural flow regime, variability (Richter et al. 1996, Poff et al. 1997). The
timing of seed release from Salicaceae spp. is also variable due to temperature and
other factors (Mahoney and Rood 1998, Stella et al. 2006). The snowmelt recession of
the hydrograph corresponds with Salicaceae seedling recruitment. Populus fremontii

39
generally releases its seeds between mid-April and late May. Salix spp. generally
release their seeds between mid-May and late June.
Rate of Change of Flow
Rate of change of flow should resemble those characteristics of the natural flow regime.
Central Valley Rivers are flashy and display peak flows that recede quickly. These flood
peaks are those caused by large rain events. The only component that is different is
the snowmelt recession. Snowmelt recession displays winter baseflows that ramp up to
the snowmelt peak and ramp down to summer baseflow. Snowmelt recession should
recede at slower rates to mimic the natural flow regime and the facilitate Salicaceae
spp. recruitment. Due to the uniqueness of the snowmelt recession and its importance
to recruitment of Salicaceae seeds, specific recommendations will be provided for this
component only. The most important aspect of this component is that flow should
recede at a rate that the river stage decreases no more than 1 cm d-1 to maintain 50%
survivorship for Populus fremontii, 1.5 cm d-1 to maintain 50% survivorship for Salix
exigua, and 3 cm d-1 to maintain 50% survivorship for Salix goodingii (Stillwater
Sciences 2006). Figure 12 displays a hypothetical hydrograph depicting these
conditions. See the snowmelt recession section for a more detailed suggestion of what
this component should resemble.
40
Figure 12: Hypothetical hydrograph outlining flow recommendations for the San Joaquin River (Stillwater Sciences 2006).
San Joaquin Vegetation Monitoring
Interim flows, are the experimental flows released from the Friant Dam beginning
October 1, 2009 extending no longer than January 1, 2014. Restoration flows, are the
full environmental flows that will be implemented in the future after adaptation due to
interim flow monitoring and assessment (Natural Resources Defense Council et al.
2006). Flow data provided is interim flows for the San Joaquin for the 2011 and 2012
WY’s. The 2011 WY was classified as a wet year and the 2012 WY was classified as a
normal-dry year. These flows are considered interim flows, and do not reflect default
restoration flow scheduling but show some resemblance.
The 2011 WY is characterized by higher flow magnitude than the 2012 WY. The April
2011 peak was 7,800 cfs. This peak was considered a flood control release. With the
exception of an extra flow peak in early July this component is similar to the snowmelt
recession component of the hydrograph described in Cain 2008. The 2012 WY is
similar to a normal-wet WY. There is a peak just over 700 cfs in October that

41
corresponds with the fall run attraction flow designed facilitate Salmonid spp. migration
seen in figure 11. The hydrograph also displays a ramping winter baseflow beginning
March 1, 2012. Figure 12, also displays a hydrograph component similar to a ramping
flow that peaks just over 1,000 cfs.
Figure 13: Interim Flow Data, 10-2010 through 10-2012, recorded from USGS gauge 11251000 just
downstream of Friant Dam (United States Department of the Interior 2013).
Twenty transects were established by the United States Bureau of Reclamation (USBR)
in 2011. These transects were revisited in 2012. At each transect percent overstory
coverage was calculated. This was done by noting the point along the transect where
the species overstory began and ended. The height of the largest specimen within the
stand was then calculated (United States Department of the Interior 2012, 2013).
Results from table 3 showed that Populus fremontii decreased in percent overstory
coverage in River Reach 1B from 2011 to 2012 (4.1 to 2.7) but average height
increased from 2.0 m to 3.7m. Percent overstory coverage also decreased from 2011
to 2012 (16.7 to 14.4) but tree height remained the same (15.0 m). The smaller tree
heights at River Reach 1B indicate that the trees were young. It is hypothesized that
these young trees were lost due to the high flood control release that took place in April

42
2011. The increase in tree height could be contributed to the loss of smaller trees
located closer to the river that were swept away in the larger flow events of 2011. River
Reach 3 had the highest percentage of riparian forest cover. The average heights of
these trees were higher indicating they were older. Even though the percent overstory
coverage decreased the average height remained the same.
Table 3 shows Salix exigua increased in percent overstory coverage and average tree
height in River Reaches 1A and 1B. Salix goodingii increased in overstory percent
coverage with the exception of River Reaches 2A, 4B, and ESB. Average tree height
generally increased as well, with the exception of river reach 1B and 3. Due to very
different condition from the 2011 WY to the 2012 WY, it is doubtful that vegetation
changes were due to interim flows.
Table 3: Average total percent overstory cover in San Joaquin river reaches for 2011 and 2012 (United States Department of the Interior 2013).
Sacramento River Background
The Sacramento Valley, home of the largest river in California, is a 27,500 mi2
watershed in the northern portion of the Central Valley. The Sacramento River flows
43
447 miles from its headwaters in the Cascade Mountains to the San Francisco Bay-
Delta, making it the longest river in California. Tributaries of the Sacramento River
include the Feather River, the American River, and Butte Creek. Anthropogenic
degradation has been affecting the river since the mid-19th-century California gold rush.
20th-century farming practices have continued to degrade the river and associated
riparian ecosystems(U. S. Environmental Protection Agency 2014).
In 1986 the California Legislature passed Senate Bill 1086, which required the
protection and restoration of the Sacramento River and associated riparian ecosystems.
The reach of the river from Red Bluff to Colusa, known as the middle river, is the main
focus of ecological restoration along the river (Brown et al. 2011). The Upper
Sacramento River Fisheries and Riparian Habitat Plan, written in 1989, outlines the
objectives and implementation plan for the restoration of the Sacramento River.
Objectives for the restoration project include:
1. To protect and restore the health of the wild strains of Salmon and Steelhead
species in the river.
2. To protect and preserve current patches of riparian ecosystem. Then reestablish
continuous riparian ecosystem from the reach of river between Redding and
Chico, and reestablish riparian ecosystem from the reach of river between Chico
and Verona(The Resources Agency of the State of California 1989).
Sacrament River Reach Descriptions
Vegetative and land use descriptions for the river reaches of the Sacramento River
were based on aerial imagery. Aerial imagery surveys were carried in 1999 out by the
Geographic Information Center at Chico State University. For restoration purposes the
Sacramento River is broken down into four main river reaches. The following are
vegetative and land use descriptions of each reach.
River Reach 1 extends from Keswick Dam to the Red Bluff Diversion Dam (302 – 243
RM). Major land use by percentage incudes agriculture 35%, upland habitat 34%, and

44
riparian habitat 12%, and urban 12%. Of the vegetation in the conservation area 42%
was riparian forest and 30% was riparian scrub. This reach is unique for its 128 acres
of valley oak woodland vegetation type that occurs outside the river’s 100-year flood
plain.
River Reach 2 extends from Red Bluff Diversion Dam to Chico Landing (243 – 194L
RM). Major land use by percentage incudes agriculture 53%, riparian habitat 20% and
upland habitat 15%. Of the vegetation in the conservation area 15% was riparian forest
and 12% was riparian scrub.
River Reach 3 extends from Chico Landing to Colusa Bridge (194L – 143 RM). Major
land use by percentage incudes riparian habitat 48%, agriculture 16% and upland
habitat 11%. Of the vegetation in the conservation area 42% was riparian forest and
30% was riparian scrub. This reach boasts the largest acreage of freshwater marsh
and mature riparian forest.
River Reach 4 extends from Colusa Bridge to Verona (143 – 80 RM). Major land use by
Percentage incudes agriculture 53%, riparian habitat 20% and upland habitat 15%. Of
the vegetation in the conservation area 15% was riparian forest and 12% was riparian
scrub (Sacramento River Advisory Council 2003).
Sacramento River Hydrology
Hydrology was assessed for the Sacramento River downstream of the Shasta Dam to
the Verona. All data was collected from two USGS stream gauges. Gauge # 11-
377100, just below the Shasta Dam, is located near the Red Bluff California and has
been in existence since 1880. Gauge # 11-425500, near the town of Verona, and has
been in existence since 1929 (United States Geological Survey 2014).
A comparison of the natural and altered flow regimes shows the extent of alteration to
the flow regime of the Sacramento River. Reoccurrence Interval data in table 4 shows
how the alteration of the natural flow regime. This is evident in the flow decrease of
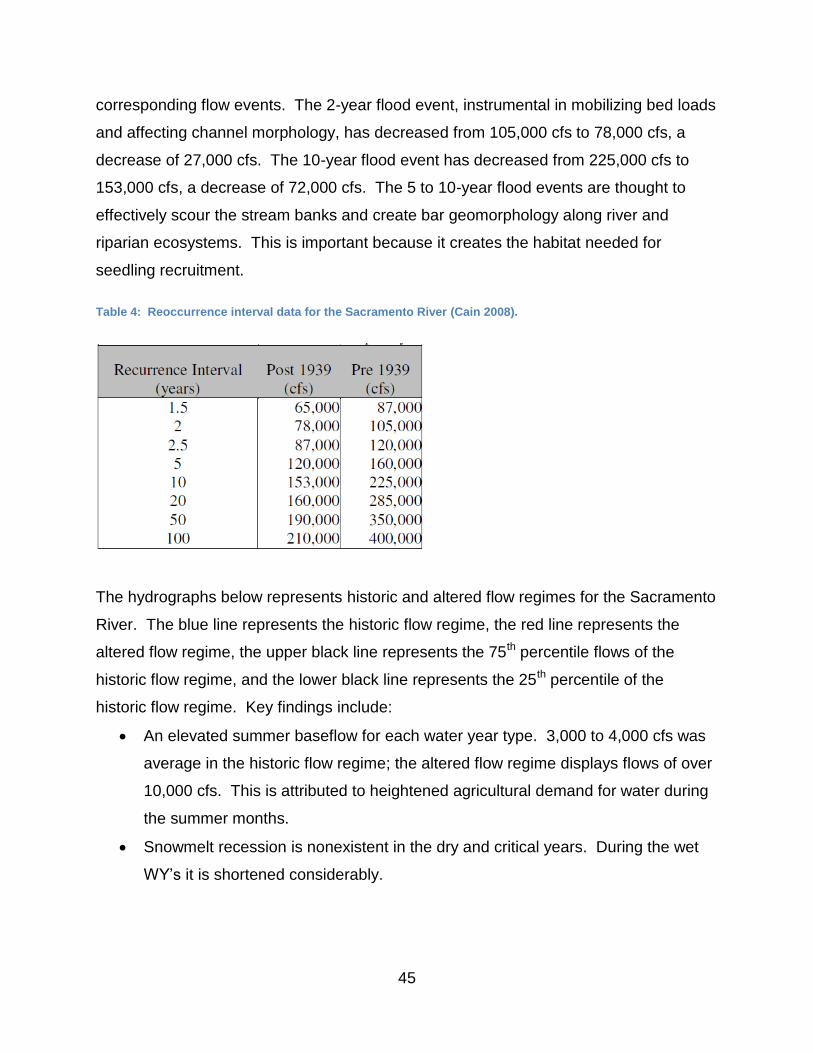
45
corresponding flow events. The 2-year flood event, instrumental in mobilizing bed loads
and affecting channel morphology, has decreased from 105,000 cfs to 78,000 cfs, a
decrease of 27,000 cfs. The 10-year flood event has decreased from 225,000 cfs to
153,000 cfs, a decrease of 72,000 cfs. The 5 to 10-year flood events are thought to
effectively scour the stream banks and create bar geomorphology along river and
riparian ecosystems. This is important because it creates the habitat needed for
seedling recruitment.
The hydrographs below represents historic and altered flow regimes for the Sacramento
River. The blue line represents the historic flow regime, the red line represents the
altered flow regime, the upper black line represents the 75th percentile flows of the
historic flow regime, and the lower black line represents the 25th percentile of the
historic flow regime. Key findings include:
An elevated summer baseflow for each water year type. 3,000 to 4,000 cfs was
average in the historic flow regime; the altered flow regime displays flows of over
10,000 cfs. This is attributed to heightened agricultural demand for water during
the summer months.
Snowmelt recession is nonexistent in the dry and critical years. During the wet
WY’s it is shortened considerably.
Table 4: Reoccurrence interval data for the Sacramento River (Cain 2008).
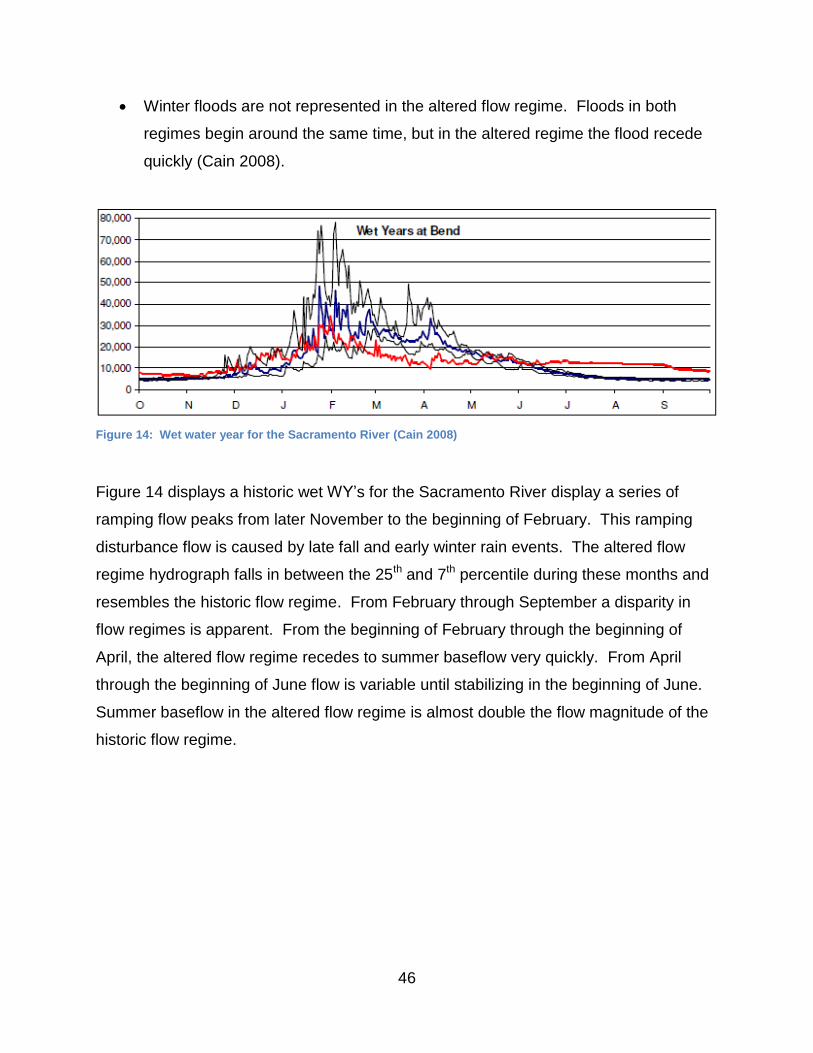
46
Winter floods are not represented in the altered flow regime. Floods in both
regimes begin around the same time, but in the altered regime the flood recede
quickly (Cain 2008).
Figure 14: Wet water year for the Sacramento River (Cain 2008)
Figure 14 displays a historic wet WY’s for the Sacramento River display a series of
ramping flow peaks from later November to the beginning of February. This ramping
disturbance flow is caused by late fall and early winter rain events. The altered flow
regime hydrograph falls in between the 25th and 7th percentile during these months and
resembles the historic flow regime. From February through September a disparity in
flow regimes is apparent. From the beginning of February through the beginning of
April, the altered flow regime recedes to summer baseflow very quickly. From April
through the beginning of June flow is variable until stabilizing in the beginning of June.
Summer baseflow in the altered flow regime is almost double the flow magnitude of the
historic flow regime.

47
Figure 15: Dry water year for the Sacramento River (Cain 2008).
Historic and altered dry years sow an increased disparity in the flow regimes. The
altered flow regime shows limited variability making it difficult to differentiate the unique
components of a Central Valley River hydrograph. Increased summer baseflow
displays the highest flow magnitude of the altered flow regime during a dry year. Winter
floods, winter baseflow, and snowmelt recession are not represented in altered flow
regime.
Figure 16: Critical water year for the Sacramento River (Cain 2008).
Critical water years are similar to the dry water years on the Sacramento River.
Variability in the altered flow regime is minimal, the summer baseflow peaks around
10,000 cfs during the months of July and August. Winter floods, winter baseflow, and
snowmelt recession components are nonexistent.

48
Sacramento River - Salicaceae spp. Seedling Release Timing
Salicaceae spp. seedling release varies between locations, species, and annually. Data
presented in this section represents average seedling release timings. Data collected
along the Sacramento is also cross referenced with the studies conducted along the
San Joaquin by Stillwater Sciences and J. Stella between 2002 and 2006.
Populus fremontii seedling release along the Sacramento River was calculated from
April 15 through July, with a peak from the last week of April through the beginning of
June. Salix goodingii was calculated from May 15 through August, with a peak from
June 1 through July 15. Salix exigua seedling release was calculated from June
through August, with a peak between June 1 through July 15 (Stillwater Sciences 2007).
Note the lack of specificity in the date ranges: it is suggested that the degree-day model
be utilized to calculate seedling releases (Stillwater Sciences 2006, 2007).
Sacramento River - Salicaceae spp. Response to Receding Groundwater
Salicaceae spp. are considered phreatophytic, meaning that their roots must remain in
contact with a perennial water source (Stillwater Sciences 2007). This perennial water
sources is groundwater. Assuming that groundwater and river stage height are
equivalent, stage height above summer baseflow is a critical factor in the seedling
recruitment.
Data on seedling root growth and subsequent response to the receding groundwater
was conducted by Roberts in 2002 and was cross-referenced with Stillwater Sciences’
study conducted by Stella in 2006. Roberts found that on average seven week old
seedling roots grew 40 cm in length. Average root growth over the seven week period 8
mm d-1 (Roberts et al. 2002). Another study conducted by Morgan in 2005 recorded
average root growth of Populus fremontii seedlings at 5 mm d-1 (Stillwater Sciences
2007).
With slightly higher root growth rate along the Sacramento River, receding groundwater
rates are suggested to recede at < 2 cm d-1. Decreasing rates of 2-4 cm d-1 result in
49
moderate percentages of seedling recruitment. Decreasing rates less than 4 cm d-1 is
highly stressful for seedling recruitment and can result in 100% seedling mortality
(Roberts et al. 2002, Stillwater Sciences 2006).
Receding groundwater rates of 2 - 4 cm d-1 will result in higher percentages of Salix
spp. seedling recruitment. At a receding groundwater rate of 3 cm d-1 Salix goodingii
displays 35% survivorship, Salix exigua displays 26% survivorship, and Populus
fremontii displays 12% survivorship (Stillwater Sciences 2006). Some receding
groundwater rates are more beneficial to Salix spp. then Populus spp. Populus
fremontii requires a slower rate of decline for higher percentage of seedling recruitment
than Salix goodingii and Salix exigua.
Sacramento Environmental Flow Recommendations
The Sacramento River natural flow regime displays higher flow magnitude relative to the
San Joaquin. During dry years this magnitude is greatly reduced and the natural
variability of the river is non-existent. Summer baseflows are abnormally high in the
altered flow regime. These issues and those surrounding recruitment flows will be
addressed in the this section.
Magnitude
Due to water diversions and the presence of dams along the Sacramento River, an
overall decrease in flow magnitude is currently being experienced (McBain and Trush
2002, Cain 2008). Key recommendations for flow magnitude along the Sacramento
River include:
Summer baseflow, under the altered hydrologic regime, is high. This excess flow
should be utilized at other times of year when flow is more crucial to Salmonid
spp. or riparian tree recruitment. Lower summer baseflows would also be
beneficial in controlling the spread of non-native vegetation. Flow should
decrease as water nears the San Francisco Bay Delta. Suggested Summer
Baseflows are 8,000 cfs below Keswick Dam, 6,000 cfs below Red Bluff

50
Diversion Dam, 4,500 below Glenn Colusa Irrigation District Diversion (GCID)
Dam, and 4,000 cfs below Colusa. Fall baseflow is the lowest flow of the year
and should have a similar flow allocation 5,500 cfs below Keswick Dam, 5,250
cfs below Red Bluff Diversion, 5,000 cfs below GCID Diversion Dam, and 4,750
cfs below Colusa (Cain 2008).
Winter floods should initiate the geomorphic processes of bed mobilization,
scour, and channel migration. Data on bed mobilization is most abundant than
the other two processes. Suggested flow rates from Keswick Dam to Bend
Bridge (near Red Bluff) is 105,000 cfs in wet years, 85,000 cfs for normal-wet
years, 65,000 cfs normal-dry years, and 35,000 cfs for dry years. Ideal time for
these flow peaks is early March (Cain 2008).
Winter baseflow will increase with the ramping disturbance flow. The duration
and magnitude of this ramping flow will depend on the WY. This ramping
disturbance flow would mimic the natural winter baseflow. Suggested flows from
Keswick Dam are 8,000 cfs in wet years, 7,000 cfs in normal-wet years, 6,500 cfs
in normal-dry years, 6,000 cfs in dry years, and 4,500 cfs in critical years (Cain
2008).
Snowmelt recession is the most critical hydrographic component to the
recruitment of Salicaceae spp. Snowmelt recession must mimic the natural flow
closely in order for seedling recruitment to occur. A major spike in flow must
occur to scour stream banks of vegetation, mobilize and deposit fine sediments,
recharge the water table and soil moisture levels. Suggested snowmelt peaks
from Keswick Dam in wet years is 37,000 cfs and in normal-wet years is
23,000(Cain 2008). These peaks should be maintained for four to seven days
and should begin a 50 day ramp down period to suggested summer baseflow.
These recruitment flows should occur from late April to early June to facilitate
Populus fremontii seedling recruitment, from late May to early July to facilitate
Salix goodingii seedling recruitment. Recruitment flows prior to late April might
benefit Arroyo Willow (Salix lasiolepis) and those after the windows suggested
might benefit Salix goodingii and Salix exigua (Stillwater Sciences 2007).

51
Frequency
Due to this inter-annual variability in flow, a restoration year-type classification system
has been utilized. This is a similar classification used by the SJRRP. The Sacramento
River classification was developed by the CDWR which was developed by the State
water Resources Control Board. Wet and normal-wet years occur 40% of the time. For
the Sacramento River recruitment flows occur only during these two WY classifications
(Stillwater Sciences 2007). Normal-wet, dry and critically dry years occur 60% of the
time and do not facilitate recruitment flows.
Duration
A general hydrographic schedule is outlined. Fall baseflow would last from September
16 to November 30. Winter baseflow would last from December 1 through March 1.
March 1 through the beginning of July would encompass the snowmelt recession
component of the hydrograph. Summer baseflow would last from June 15 through
September 15 (Cain 2008). These durations can vary from year to year depending on
temperature and precipitation amounts.
Timing
Timing is variable but general guidelines are outlined in Cain 2008 for the timing of
hydrologic events. See the Duration section for a timeline of events.
Rate of Change
The most important rate of change rate is the decrease of snowmelt recession
component of the hydrograph. Over the 50 day ramp down period, critical rates of
decrease include the following: a decrease in flow magnitude < 2 cm d-1 will facilitate
the recruitment of Populus fremontii and a decrease in flow magnitude of 2-4 cm d-1 will
facilitate the recruitment of Salix spp. seedlings. A disparity in required decrease in flow
rates exists between the two Salix spp. but they are grouped together because of Salix
exigua’s ability to reproduce asexually. Ability to reproduce clonally through branch
pieces reduces Salix exigua’s dependence on high success rates for seedling
recruitment (Stillwater Sciences 2007).

52
Sacramento Vegetation Monitoring
In 2011 the Sacramento River Monitoring and Assessment Project (SRMAP) released a
final administrative report. This report outlined results found from a 2007 vegetative
mapping project, changes between vegetative mapping conducted in 1999 and in 2007,
and improvements to methodology. The mapping was conducted using Geographic
Information Systems (GIS) technology. Fourteen vegetation types and two habitat
types were delineated for the study. The two habitat types were gravel bars and open
water.
SRMAP found that of the 32,811 acres that make up the Sacramento Conservation
Area 7,892.5 acres consisted of Populus fremontii coverage, 92.2 acres consisted of
Salix goodingii coverage, 1,849.5 acres consisted of mixed willow (Salix spp.) coverage,
and 1,717.4 acres consisted of gravel bar habitat. The gravel bar habitat type was
included because of its importance to the germination of Salicaceae spp. along the
stream banks of rivers (Brown et al. 2011). SRMAP was reluctant to make large scale
comparisons between the 1999 vegetative maps and data produced by the Geographic
Information Center at Chico State. This was due to differences in methodologies. Due
to inconsistencies in methodology, data cannot accurately link flow releases with
successional trends in vegetation.
Recommendations
The following recommendations are made to ensure the effectiveness of restoration
activities and environmental flow regime prescriptions. Recommendations for
restoration and environmental flow regime are based on related literature.
Restoration Objectives
I recommend that the Sacramento River restoration and the SJRRP develop specific
ecosystems process based objectives. Both restoration projects have been driven by
conservation objectives designed to protect and restore primarily Salmonid fish species
and to promote the general health of the river. Even though the Endangered Species
Act dictates that these fish species should be protected, a restoration objective should
be added to address ecosystem processes that drive the health of these fish and the

53
overall health of the watershed as a whole (Palmer et al. 2009). Although the
restoration project on the San Joaquin River is being implemented as the result of the
law suit settlement for Salmonid spp., I believe incorporating an ecosystem objective
would enhance success of the overall project.
While restoration on both rivers investigates a wide variety of factors affecting Salmonid
spp., such as riparian ecosystem and river health, ecosystem processes should be
listed specifically in their objectives. Large river restoration projects have budgets in the
millions of dollars, SJRRP has an estimated $892,056,000 through 2025 (estimate does
not include the San Joaquin River Fund) (San Joaquin River Restoration Program
2013b). With this much money on the line, adequate development of objectives that
promote the health and sustainability of the whole watershed is a necessity. Ecosystem
based objectives should drive these large projects and restoration methods and
monitoring protocol. The implementation of environmental flows can easily be linked to
environmental processes, such as physical and biochemical processes that increase
water purification (Palmer 2008). Both restoration projects take multi-disciplinary
approaches to their focal species approach with a variety of restoration activities that
address a myriad of underlying ecosystem processes. Process based objectives should
be clearly stated in the objectives so that the many government agencies, consulting
firms, and universities involved do not lose sight of the underlying restoration goals.
Process based objectives can also be easily translated into ecosystem services that are
beneficial to stakeholders. This is key in the paradigm shift needed to take place if river
restoration and environmental flow implementation is to gain support (Naiman et al.
2002). While biodiversity is a crucial ecosystem service, the ecosystem service is not
enough to convince funders or the voting public that money should be allocated to
restore a river system. Process based objectives, while sometimes difficult to assess,
address root issues and limiting factors that have caused degradation of the ecosystem
or landscape.

54
Restoration Implementation
Implementation of several guidelines is recommended for each of these restoration
projects:
Promotion of stream migration (Stillwater Sciences 2006)
Eradication of weedy species (Stillwater Sciences 2006)
Incorporation a default flow schedule for the Sacramento River
Inclusion of a winter flood pulse for both rivers
Any channelization of both rivers should be minimized to promote the creation of
suitable habitat for Salicaceae spp. As a river meanders it erodes outside of the s-
shaped curve and deposits sediment on the inside of the s-shaped curve. This
deposition creates point bars along the stream bank which are ideal habitat sites for
Salicaceae spp. seedlings to germinate (Mahoney and Rood 1998, Stillwater Sciences
2006, Rood et al. 2007).
The eradication of invasives species should be undertaken by each of the river
restoration projects. Along the stream banks, scour caused by peaks in flow magnitude
will control the encroachment of invasive species. At higher elevations along the flood
plain, manual eradication should be considered for those species that provide the
largest threat to native riparian species present. Priority invasive species include: giant
reed (Arundo donax), tree of heaven (Ailanthus altissima), perennial pepperweed
(Lepidium latifolium) and Tamarix spp.
SJRRP has a default restoration flow schedule that outlines the magnitude, frequency,
duration, timing, and rate of change of the restoration flow regime. Creating this
schedule would be a valuable tool for the Sacramento River. Within these schedules
both river projects should reevaluate the incorporation of the winter flood pulse. The
winter flood pulse is representative of large winter rain events that produce high flow
events (HFE’s) within the river channel. In the SJRRP default restoration flow schedule
these events are underrepresented.

55
Restoration Monitoring
Monitoring data is crucial for an adaptive management approach. SJRRP does a great
job of outlining its monitoring plan. It is recommended that these procedures should be
adopted and implemented along the Sacramento River. Key monitoring data needed
for the assessment of Salicaceae spp. recruitment are as follows (San Joaquin River
Restoration Program 2014):
Flow data, magnitude and stage height data
Percent overstory coverage
Tree DBH
Stem density
Riparian habitat evaluation
Groundwater levels
Aerial imagery
Flow data will provide information that can be used to make connections between
changes in flow regime and Salicaceae spp. recruitment. Percent overstory coverage,
tree DBH, and stem density is also used to establish the relationship between flow
regime and Salicaceae spp. recruitment. These data will help to develop an
understanding of locations that possess physical characteristics that promote the
recruitment and survivorship of Salicaceae spp. Groundwater is an important physical
characteristic needed for riparian tree establishment (United States Department of the
Interior 2013, San Joaquin River Restoration Program 2014).
Long term data are needed to drive Central Valley River restoration. This requires that
current monitoring plans be implemented over the life of these projects. It is
recommended that both river restoration projects utilize aerial imagery to analyze long
term vegetative community dynamics. A consistent protocol should be adopted in the
Central Valley watershed. Constituent mapping techniques would allow for successes
to be investigated and compared throughout the Central Valley and between restoration
projects. I recommend that both restoration projects adopt the mapping guidelines, field

56
forms, and protocol outlined in the Vegetation Program developed by the California
Native Plant Society (CNPS). This program is clearly described and easily accessible
on the CNPS website. It also utilizes A Manual of California Vegetation (2009) a more
current manual than Holland’s 1986 manual.
Adaptive Management
An adaptive management approach is clearly displayed in SJRRP documents. The
interim flow project is an example of how this approach can drive restoration monitoring
and assessment. As stated in the previous section monitoring data should be collected
and documented in a way that it can be utilized for future use.
The adaptive management plans for the Central Valley should include high flow
experiments (HFE). Due to incomplete historic flow data experiments should be
conducted in wet WY’s, when reservoirs are at or near capacity. These HFE’s should
be designed to represent large flow events such as the 75-year flood event. A great
example of such an adaptive management approach is the Glenn Canyon Dam along
the Colorado River. HFE’s along the Colorado were conducted in 1996, 2004, and
2008. In 1996 a seven day peak of 45,000 cfs provided much data on sediment
dynamics, sandbar deposition, and the effects of HFE’s on rainbow trout (Oncorhynchus
mykiss) habitat (United States Department of the Interior and United States Geological
Survey 2011, Konrad et al. 2011).
Winter flood peaks are underrepresented along the two main Central Valley Rivers.
Flood peaks provide many unknown services that drive physical and biological
processes. With limited water resources and increased water needs winter floods do
not occur every WY but they do serve a purpose in river flow regimes. Ample
experiments should be undertaken during such even including documentation of pre
and post sandbar conditions, vegetative coverage along stream banks, and water
quality (i.e. temperature).

57
Timing of HFE should be planned in ordered to not adversely affect fish species,
riparian vegetation communities, and river processes. It is recommended that HFE’s
occur from the beginning of January through the end of March. This will mimic the
natural flow regime of Central Valley Rivers.
Environmental Flow Planning Recommendations
Water needs will increase as human population levels increase, along with demands for
energy, irrigation for agricultural needs, industrial uses of water, and uncertainties
associated with climate change (Palmer et al. 2009). As rivers continue to be
harnessed and altered for human benefit, the less the river reflects the dynamic natural
flow regime. The less the river reflects the natural flow regime the more degraded the
health of the river becomes. It is recommended that environmental flow planning strive
to balance the river’s need for the natural flow regime and the human need for water.
Due to increased needs for water planning protocol associated with river conservation
and restoration becomes vital. Effective planning will maximize cost-effectiveness,
promote decisions based on scientific research, promote decisions that incorporate
stakeholder input, and ultimately contribute to fields of hydro-ecology and environmental
flow management.
It is recommended that the ecological limits of hydrologic alteration (ELOHA) framework
be utilized to further develop environmental flow requirements for California’s Central
Valley Rivers. ELOHA is a framework that utilizes historic flow data, modeled flow data,
and current flow data to classify rivers by type and establish environmental flow
requirements (Poff et al. 2010). Current frameworks resemble those outlined in (Richter
and Thomas 2007) which is a for-runner of the ELOHA framework.
The ELOHA planning network begins by collecting baseline hydrographs and developed
hydrographs in step one, as seen in figure 17. Baseline hydrographs represent rivers
with minimal alterations, while the developed hydrograph represents the altered flow
regime associated with flow alteration and other anthropogenic alteration such as land
use and urban encroachment. These hydrographs will be generated using models and
58
historic flow data. Step two analyzes flow regime and geomorphic characteristics to
classify rivers by type. This allows for commonalities to be found between rivers of the
same type. The third step is analyzing the degree flow alteration; this is done through
the use of computer software. The degree of alteration is calculated by comparing the
difference between the baseline hydrograph and the developed hydrograph. Step four
is the development of a hypothesis to relate quantified ecological metrics to a degree of
alteration of the hydrograph. General concepts are well established in the hydro-
ecology community. One such example is Poff’s paradigm of the natural flow regime
which states that the natural variability of a river is crucial to the ecological health of the
river and associated riparian ecosystems. Step four will drive the promotion of data that
links specific ecological metrics with the degree of deviation between the baseline and
developed hydrographs. This step is crucial in collecting data necessary to develop
hydro-ecology and the science of prescribing environmental flow regimes. Poff et al
2010 admits shortcomings in developing a societal process for incorporating input from
stakeholders and resource managers. Societal input has been incorporated into this
model in Pahl-Wostl et al 2013 (Pahl-Wostl et al. 2013). After environmental flow
regimes are prescribed and implemented an adaptive management is approach is
utilized to ensure the calibration of the environmental flow regime. The pivotal segment
of the ELOHA framework is ecological data, because this data drives understanding of
the effects of the degree of deviation between the baseline hydrograph and the
developed hydrograph(Poff et al. 2010).
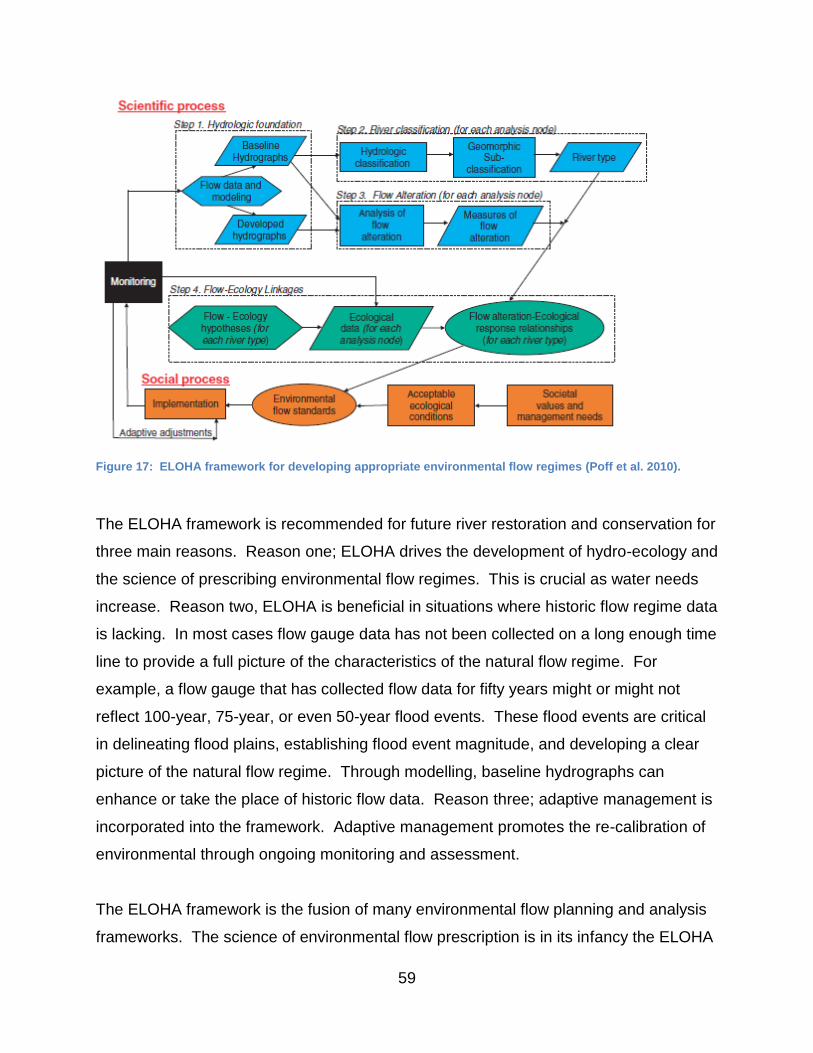
59
Figure 17: ELOHA framework for developing appropriate environmental flow regimes (Poff et al. 2010).
The ELOHA framework is recommended for future river restoration and conservation for
three main reasons. Reason one; ELOHA drives the development of hydro-ecology and
the science of prescribing environmental flow regimes. This is crucial as water needs
increase. Reason two, ELOHA is beneficial in situations where historic flow regime data
is lacking. In most cases flow gauge data has not been collected on a long enough time
line to provide a full picture of the characteristics of the natural flow regime. For
example, a flow gauge that has collected flow data for fifty years might or might not
reflect 100-year, 75-year, or even 50-year flood events. These flood events are critical
in delineating flood plains, establishing flood event magnitude, and developing a clear
picture of the natural flow regime. Through modelling, baseline hydrographs can
enhance or take the place of historic flow data. Reason three; adaptive management is
incorporated into the framework. Adaptive management promotes the re-calibration of
environmental through ongoing monitoring and assessment.
The ELOHA framework is the fusion of many environmental flow planning and analysis
frameworks. The science of environmental flow prescription is in its infancy the ELOHA

60
framework needs further evaluation and modification. The main modification is the
need for analysis of water quality data in conjunctions with the analysis of flow data.
Implementation of the ELOHA framework in the Upper Tennessee River Basin resulted
in mixed results. The results were attributed to the need for further investigation in the
relationship between water temperature variation and fish survivorship (McManamay et
al. 2013). Water quality is included in the definition of environmental flow provided by
the 2007 Brisbane Declaration. Water quality includes water temperature, sediment
loads, salinity, and the presence of pollutants. Water quality data needs to be
incorporated into the prescription of environmental flows.
Conclusion
The flow regimes of the two main Central Valley Rivers have been greatly altered. So
much water has been diverted from the San Joaquin stream channel that a 60 mile
reach annually runs dry. The extirpation of Chinook salmon can be linked to this break
in river flow. Salicaceae spp. and other Salmonid spp. are among the numbers
organisms that are affected by this annual occurrence. Similar conditions exist on the
Sacramento River. Lowered winter floods have affected Populus fremontii recruitment
along its stream banks. It is important that a default environmental flow schedule be
implemented for the Sacramento to address issues of altered flow regime and
decreasing Salicaceae seedling recruitment.
Many of the articles and reports cited in this study have systematically gathered the
data required to prescribe an environmental flow regime needed to promote Salicaceae
seedling recruitment. Seedling release timings and effects of receding groundwater on
seedlings is well understood. Data proving the effectiveness of these flow regimes
within the Central Valley are lacking. Adaptive management strategies not only improve
the effectiveness of restoration techniques but they also drive the science behind
restoration ecology and environmental flow regimes. Both restoration projects can
promote environmental flow science by gathering and synthesizing this data for use in
other rivers in California and around the world.

61
Monitoring and assessment of the effectiveness of the environmental flow regime in the
Central Valley can be very effective. It will require the monitoring of the five
components of natural flow regimes and vegetation dynamics in the riparian
ecosystems. These data will need to be assessed properly so that scientists and river
managers can adequately understand the effects of these restoration implementations.
Groundwork has been laid, especially in the SJRRP, to collect and synthesize large
quantities of flow and vegetative data. These projects have the capacity to restore
these degraded river systems and refine restoration ecology. In time it will be
understood to what extent these projects are deemed successful.
62
Literature Cited
Amlin, N. M., and S. B. Rood. 2002. Comparative tolerances of riparian willows and cottonwoods to water-table decline. Wetlands 22:338–346.
Arthington, A. H. 2012. Environmental flows: saving rivers in the third millennium. University of California Press, Berkeley, California, USA.
Arthington, A. H., R. J. Naiman, M. E. McClain, and C. Nilsson. 2010. Preserving the biodiversity and ecological services of rivers: new challenges and research opportunities. Freshwater Biology 55:1–16.
Braatne, J. H., S. B. Rood, and P. E. Heilman. 1996. Life history, ecology and conservation of the riparian Cottonwood in North America. pages 18–67 Biology of Poplus.
Brown, D. L., S. Strachan, and R. Funes. 2011. Sacramento monitoring and assessment project: final administrative report. pages 1–59.
Cain, J. 2008. Estimating ecologically based flow targets for the Sacramento and Feather Rivers. pages 1–69.
Cain, J., R. P. Walkling, S. Bearnish, S. Cheng, E. Cutter, and M. Wickland. 2003. San Joaquin Basin ecological flow analysis. pages 1–224.
Catford, J. a., B. J. Downes, C. J. Gippel, and P. a. Vesk. 2011. Flow regulation reduces native plant cover and facilitates exotic invasion in riparian wetlands. Journal of Applied Ecology 48:432–442.
Chappell, B. 2014. California’s governor declares drought state of emergency. National Public Radio.
County of Ventura Planning Division. 2006. Guide to native and invasive streamside plants. Ventura County, USA.
Greet, J., R. D. Cousens, and J. A. Webb. 2013. More exotics and fewer native plants: riverine vegetation patterns associated with atered seasonal flow patterns. River Research and Applications 706:686–706.
Greet, J., J. A. Webb, and B. J. Downes. 2011. Flow variability maintains the structure and composition of in-channel riparian vegetation. Freshwater Biology 56:2514–2528.
Hatch, C. 2007. Trees of the California landscape. University of California Press, Berkeley, California, USA.
63
Holland, R. F. 1986. Preliminary descriptions of the terresterial natural communities of California.
Johnson, T. 2014. San Joaquin Restoration Program restoration administrator flow recommendation. pages 1–4.
Konrad, C. P., J. D. Olden, D. a. Lytle, T. S. Melis, J. C. Schmidt, E. N. Bray, M. C. Freeman, K. B. Gido, N. P. Hemphill, M. J. Kennard, L. E. McMullen, M. C. Mims, M. Pyron, C. T. Robinson, and J. G. Williams. 2011. Large-scale flow experiments for managing river systems. BioScience 61:948–959.
KQED. 2014. Calfornia plumbing:a mind-boggling web.
Kuzovkina, Y. A., and M. F. Quigley. 2005. Willows beyond wetlands: uses of Salix L. species for environmental projects. Water, Air, and Soil Pollution 162:183–204.
Lytle, D. a, and N. L. Poff. 2004. Adaptation to natural flow regimes. Trends in Ecology & Evolution 19:1–7.
Mahoney, J. M., and S. B. Rood. 1998. Streamflow requirements for cottonwood seedling recruitment - an integrative model. Wetlands 18:634–645.
Malmqvist, B., and S. Rundle. 2002. Threats to the running water ecosystems of the world. Environmental Conservation 29:134–153.
McBain and Trush. 2002. San Joaquin River restoration study, background report.
McManamay, R. a, D. J. Orth, C. a Dolloff, and D. C. Mathews. 2013. Application of the ELOHA framework to regulated rivers in the Upper Tennessee River Basin: a case study. Environmental management 51:1210–35.
Merritt, D. M., and N. L. Poff. 2010. Shifting dominance of riparian Populus and along gradients of flow alteration in western North American rivers. Ecological Society of America 20:135–152.
Mitsch, W. J., and J. G. Gosselink. 2007. Wetlands. 4th edition. John Wiley and Sons, Inc., Hoboken, New Jersey, USA.
Moise, G. W., and B. Hendrickson. 2002. Riparian vegetation of the San Joaquin River. pages 1–36.
Mount, J. F. 1995. California rivers and streams: the conflict between fluvial processes and land use. pages 145 – 186. University of California Press, Berkeley, California, USA.
64
Naiman, R. J., S. E. Bunn, C. Nilsson, G. E. Petts, G. Pinay, and L. C. Thompson. 2002. Legitimizing fluvial ecosystems as users of water: an overview. Environmental Management 30:455–467.
Naiman, R. J., and H. Decamps. 1997. The ecology of interfaces : riparian zones. The Annual Review of Ecology, Evolution, and Systematics 28:621–658.
Naiman, R. J., H. Decamps, and M. E. McClain. 2005. Riparia: ecology, conservation, and management of streamside communitites. pages 79–91. Elsevier, Boston, Massachusetts, USA.
Natural Resources Defense Council. 2013. Restoring the San Joaquin River. http://www.nrdc.org/water/conservation/sanjoaquin.asp.
Natural Resources Defense Council, Friant Water Users Authority, and U.S. Department of the Interior. 2006. Agreement signals start to historic San Joaquin River restoration. Agreement Signals Start to Historic San Joaquin River Restoration.
Nilsson, C., and K. Berggren. 2000. Alteration of riparian ecosystems caused by river regulation. BioScience 50:783–792.
Pahl-Wostl, C., A. Arthington, J. Bogardi, S. E. Bunn, H. Hoff, L. Lebel, E. Nikitina, M. Palmer, L. N. Poff, K. Richards, M. Schlüter, R. Schulze, A. St-Hilaire, R. Tharme, K. Tockner, and D. Tsegai. 2013. Environmental flows and water governance: managing sustainable water uses. Current Opinion in Environmental Sustainability 5:341–351.
Palmer, M. a. 2008. Reforming watershed restoration: science in need of application and applications in need of science. Estuaries and Coasts 32:1–17.
Palmer, M. A., D. P. Lettenmaier, N. L. Poff, S. L. Postel, B. Richter, and R. Warner. 2009. Climate change and river ecosystems: protection and adaptation options. Environmental management 44:1053–68.
Poff, N. L., J. D. Allan, M. B. Bain, J. R. Karr, K. L. Prestegaard, B. D. Richter, R. E. Sparks, and J. C. Stromberg. 1997. The natural flow regime: a paradigm for river conservation and restoration. BioScience 47:769–784.
Poff, N. L., B. D. Richter, A. H. Arthington, S. E. Bunn, R. J. Naiman, E. Kendy, M. Acreman, C. Apse, B. P. Bledsoe, M. C. Freeman, J. Henriksen, R. B. Jacobson, J. G. Kennen, D. M. Merritt, J. H. O’Keefe, J. D. Olden, K. Rogers, R. E. Tharme, and A. Warner. 2010. The ecological limits of hydrologic alteration (ELOHA): a new framework for developing regional environmental flow standards. Freshwater Biology 55:147–170.

65
Poff, N. L., and J. K. H. Zimmerman. 2010. Ecological responses to altered flow regimes: a literature review to inform the science and management of environmental flows. Freshwater Biology 55:194–205.
Power, M. E., A. Sun, G. Parker, W. E. Dietrich, and J. T. W. 1995. Hydraulic food-chains models: an approach to the study of food-web dynamics in large rivers. BioScience 45:159–67.
Richter, B. D., J. V Baumgartner, J. Powell, and D. P. Braunij. 1996. A method for assessing hydrologic alteration within ecosystems. Conservation Biology 10:1163–1174.
Richter, B. D., and G. A. Thomas. 2007. Restoring environmental flows by modifying dam operations. Ecology and Society 12.
Roberts, M. D., D. R. Peterson, D. E. Jukkola, and V. L. Snowden. 2002. A pilot investigation of cottonwood recruitment on the Sacramento River. pages 1–20.
Rood, S. B., L. a Goater, K. M. Gill, and J. H. Braatne. 2011. Sand and sandbar willow: a feedback loop amplifies environmental sensitivity at the riparian interface. Oecologia 165:31–40.
Rood, S. B., L. a. Goater, J. M. Mahoney, C. M. Pearce, and D. G. Smith. 2007. Floods, fire, and ice: disturbance ecology of riparian cottonwoods. Canadian Journal of Botany 85:1019–1032.
Sacramento River Advisory Council. 2003. SB 1086 Sacramento River conservation area forum handbook. pages 3–1 – 6–11.
San Joaquin River Restoration Program. 2010. Water year 2010 interim flows project biological assessment.
San Joaquin River Restoration Program. 2013a. Restoration flows guidelines. pages 1–43.
San Joaquin River Restoration Program. 2013b. Fiscal year 2013 annual work plan.
San Joaquin River Restoration Program. 2014. 2014 Monitoring and Analysis Plan.
Stella, J. C., J. J. Battles, B. K. Orr, and J. R. McBride. 2006. Synchrony of seed dispersal, hydrology and local climate in a semi-arid river reach in California. Ecosystems 9:1200–1214.
Stillwater Sciences. 2003a. Restoration objectives for the San Joaquin River. pages 1–272.

66
Stillwater Sciences. 2003b. Draft restoration strategies for the San Joaquin River.
Stillwater Sciences. 2006. Restoring recruitment processes for riparian cottonwoods and willows : a field-calibrated predictive model for the lower San Joaquin Basin. pages 1–151.
Stillwater Sciences. 2007. Linking biological responses to river processes: implications for conservation and management of the Sacramento River — a focal species approach. pages 1–496.
The Resources Agency of the State of California. 1989. Upper Sacramento River fisheries and riparian habitat management plan. pages 1–10.
U. S. Environmental Protection Agency. 2014. San Francisco Bay, about the watershed. http://www2.epa.gov/sfbay-delta/about-watershed.
U. S. Forest Service. 2014. U. S. Forest Service. http://www.fs.fed.us.
United States Department of the Interior. 2012. Vegetation response to interim flows in the San Joaquin River. pages 1–19.
United States Department of the Interior. 2013. Vegetation response to interim flows in the San Joaquin River. pages 1–27.
United States Department of the Interior, and United States Geological Survey. 2011. Three Experimental High-Flow Releases from Glen Canyon Dam , Arizona — Effects on the Downstream Colorado River Ecosystem. USGS science for a changing world.
United States Geological Survey. 2014. National water interface. http://waterdata.usgs.gov/ca.
Ward, A. D., and S. W. Trimble. 2004. Environmental hydrology. Lewis, Boca Raton, Florida, USA.