environmental problems & their causes chapter 1 sections 1.1 – 1.3
TRANSCRIPT

Environmental Problems & Environmental Problems & Their CausesTheir Causes
Chapter 1Chapter 1
Sections 1.1 – 1.3Sections 1.1 – 1.3

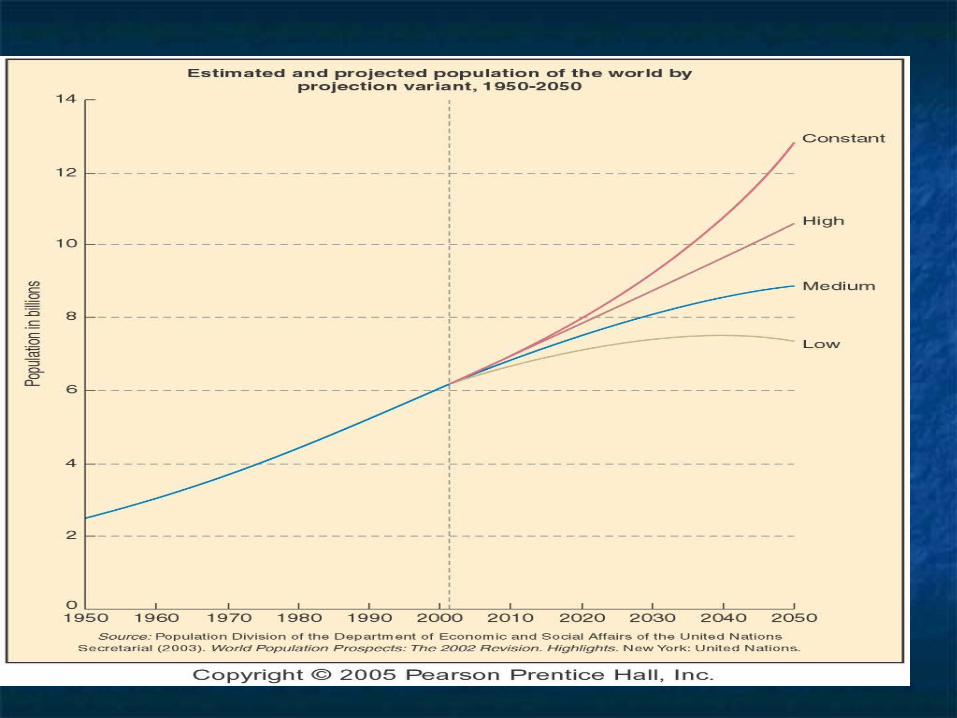
Dr. Isaac Asimov (in this 1966 interview he predicted that world Dr. Isaac Asimov (in this 1966 interview he predicted that world population would reach 6 billion near the year 2000, but his population would reach 6 billion near the year 2000, but his
prediction was conservative: we passed the 6 billion mark in October prediction was conservative: we passed the 6 billion mark in October 1999.) 1999.)
""Which is the greater danger - nuclear Which is the greater danger - nuclear warfare or the population explosion? warfare or the population explosion? The The latter absolutely! To bring about nuclear latter absolutely! To bring about nuclear war, someone has to DO something; war, someone has to DO something; someone has to press a button. To bring someone has to press a button. To bring about destruction by overcrowding, mass about destruction by overcrowding, mass starvation, anarchy, the destruction of our starvation, anarchy, the destruction of our most cherished values-there is no need to most cherished values-there is no need to do anything. We need only do nothing do anything. We need only do nothing except what comes naturally - and breed. except what comes naturally - and breed. And how easy it is to do nothing." And how easy it is to do nothing."

CapitalCapital
It doesn’t just refer to money!It doesn’t just refer to money! 99% of earth’s energy comes 99% of earth’s energy comes
from the sunfrom the sun

Living Sustainably Living Sustainably
Sustainable SocietySustainable Society Manages its economy & population size Manages its economy & population size
without using the resources to the point without using the resources to the point of failing to replenish.of failing to replenish.
Earth CapitalEarth Capital = Earth’s air, water, = Earth’s air, water, soil, wildlife, minerals, fossil fuels…soil, wildlife, minerals, fossil fuels…etc…etc…

Linear vs. Exponential Linear vs. Exponential GrowthGrowth
Linear GrowthLinear Growth
Equal quantity is Equal quantity is added during each added during each time period.time period.
Straight, sloped lineStraight, sloped line
Exponential GrowthExponential Growth
Quantity increases Quantity increases by a fixed by a fixed percentage of the percentage of the whole in a given whole in a given time.time.
““J” shaped lineJ” shaped line

LINEAR vs. LINEAR vs. EXPONENTIALEXPONENTIAL

Human Population GrowthHuman Population Growth

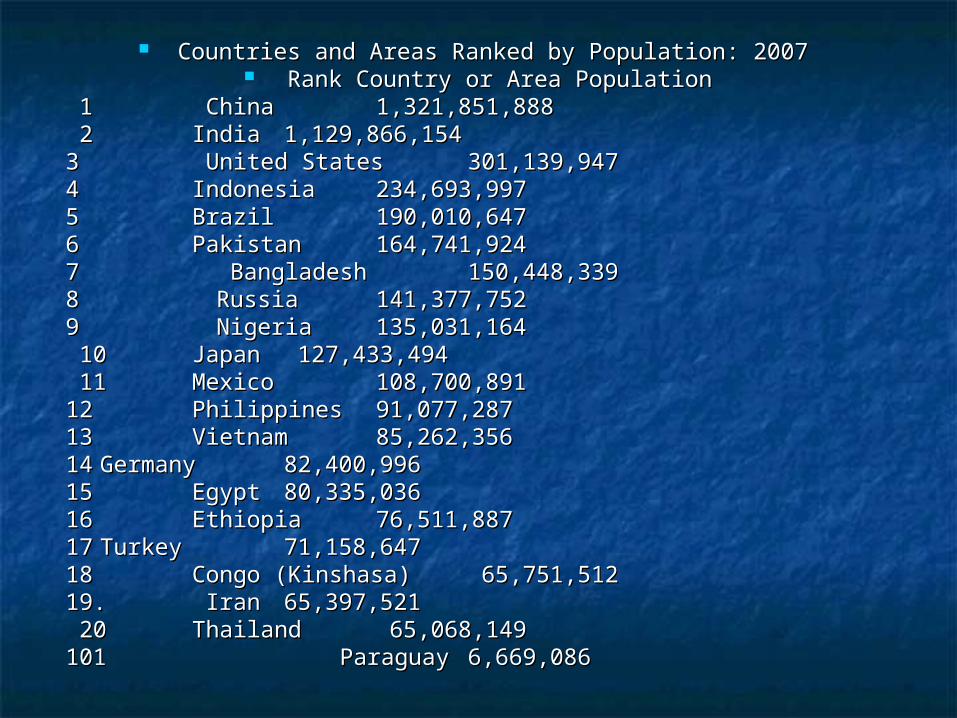
Countries and Areas Ranked by Population: 2007 Countries and Areas Ranked by Population: 2007 Rank Country or Area PopulationRank Country or Area Population
1 1 China China 1,321,851,888 1,321,851,888 2 2 India India 1,129,866,154 1,129,866,154 3 3 United States United States 301,139,947 301,139,947 4 4 Indonesia Indonesia 234,693,997 234,693,997 5 5 Brazil Brazil 190,010,647 190,010,647 6 6 Pakistan Pakistan 164,741,924 164,741,924 7 Bangladesh 7 Bangladesh 150,448,339 150,448,339 8 Russia 8 Russia 141,377,752 141,377,752 9 Nigeria 9 Nigeria 135,031,164 135,031,164 1010 JapanJapan 127,433,494 127,433,494 11 11 Mexico Mexico 108,700,891 108,700,891 1212 Philippines Philippines 91,077,287 91,077,287 13 13 Vietnam Vietnam 85,262,356 85,262,356 1414 Germany Germany 82,400,996 82,400,996 1515 Egypt Egypt 80,335,036 80,335,036 1616 Ethiopia Ethiopia 76,511,887 76,511,887 1717 Turkey Turkey 71,158,647 71,158,647 1818 Congo (Kinshasa)Congo (Kinshasa) 65,751,512 65,751,512 19.19. Iran Iran 65,397,521 65,397,521 2020 ThailandThailand 65,068,149 65,068,149101 Paraguay101 Paraguay 6,669,086 6,669,086

1
23

http://desip.igc.org/mapanim.html
Watch the world growWatch the world grow

Rule of 70Rule of 70
Determines Determines how many how many years it will years it will take a take a population to population to double in double in size.size.
70 70 == % growth rate% growth rate
EX: % growth rate for EX: % growth rate for America is = 0.91%America is = 0.91%
70 70 = 77 years = 77 years 0.910.91
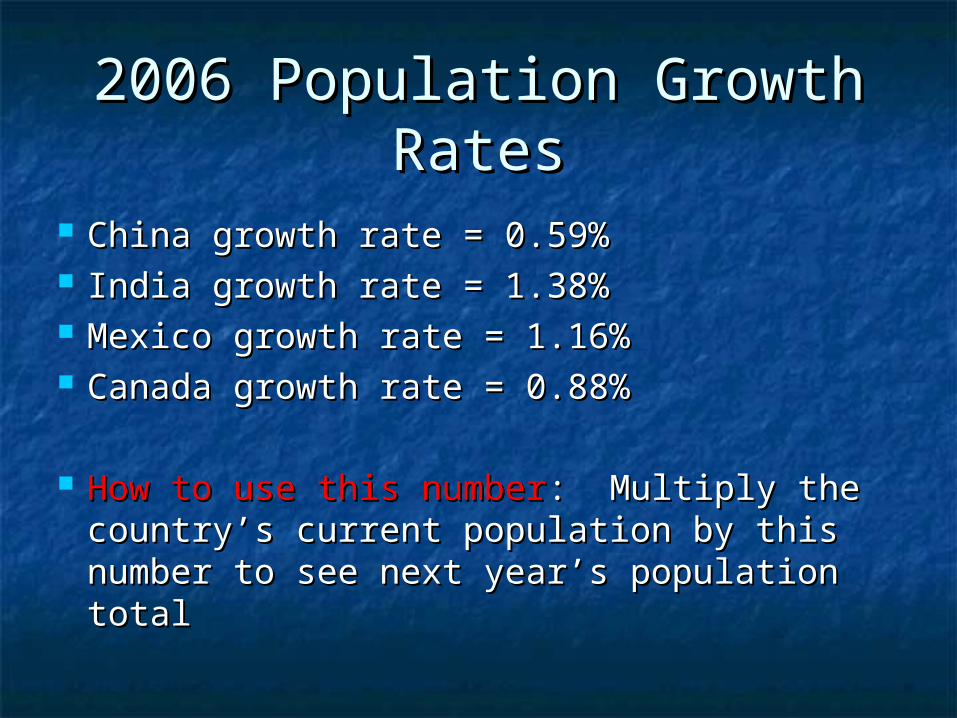
2006 Population Growth 2006 Population Growth RatesRates
China growth rate = 0.59%China growth rate = 0.59% India growth rate = 1.38%India growth rate = 1.38% Mexico growth rate = 1.16%Mexico growth rate = 1.16% Canada growth rate = 0.88%Canada growth rate = 0.88%
How to use this numberHow to use this number: Multiply the : Multiply the country’s current population by this country’s current population by this number to see next year’s population totalnumber to see next year’s population total

Economic GrowthEconomic Growth
An increase in the capacity to provide An increase in the capacity to provide goods & services for people’s final use.goods & services for people’s final use.
Two ways to increase economic growthTwo ways to increase economic growth Increase the CONSUMPTION of goodsIncrease the CONSUMPTION of goods Increase the Increase the populationpopulation with needs with needs
These are at odds with sustainabilityThese are at odds with sustainability

GNP, GDP, & per capita GNPGNP, GDP, & per capita GNP GNP = Gross National ProductGNP = Gross National Product
All the goods & services provided within All the goods & services provided within & outside of a country. (current $ value)& outside of a country. (current $ value)
GDP = Gross Domestic ProductGDP = Gross Domestic Product Goods & services provided within a Goods & services provided within a
countrycountry
Per Capita GNP = GNP divided by Per Capita GNP = GNP divided by total populationtotal population Assumes each person gets equal shareAssumes each person gets equal share

Developing CountriesDeveloping Countries
Per capita GNP <$4,000Per capita GNP <$4,000 Low to moderate industrializationLow to moderate industrialization Rural, agricultural, illiterate, poorRural, agricultural, illiterate, poor 80% of world’s population80% of world’s population
50% of population is under age 1550% of population is under age 15 15% of wealth15% of wealth 10-20% of resource usage10-20% of resource usage

List of Least Developed CountriesList of Least Developed CountriesUN 2008UN 2008
1. Afghanistan 1. Afghanistan
2. Angola2. Angola
3. Bangladesh3. Bangladesh
11. Chad11. Chad
17. Ethiopia17. Ethiopia
Per capita GDPPer capita GDP $700 (‘03)$700 (‘03) $1900 (‘04)$1900 (‘04) $1900 (‘03)$1900 (‘03) $1200 (‘03)$1200 (‘03) $700 (‘03)$700 (‘03)

Reasons for Large Reasons for Large Families in Families in Developing Developing CountriesCountries
Old age securityOld age security Infant and Infant and
childhood childhood mortality ratesmortality rates
Children are an Children are an economic asseteconomic asset Grow food, gather Grow food, gather
fuel, tend fuel, tend livestock, beg, livestock, beg, carry watercarry water

Developed CountryDeveloped Country
Per capita GNP >$4,000Per capita GNP >$4,000 Highly industrializedHighly industrialized Urban, industrial, educated, & Urban, industrial, educated, &
wealthywealthy 20% of world’s population20% of world’s population
85% of wealth85% of wealth 80 - 90% of resource usage80 - 90% of resource usage

Per capita GNP (2005)Per capita GNP (2005)
#1 - Luxemburg $65,602#1 - Luxemburg $65,602 #6 – United States $43,763#6 – United States $43,763 #36 – Canada - $32, 546#36 – Canada - $32, 546 #80 – Mexico - $7, 154#80 – Mexico - $7, 154 #145 – China - $1, 736#145 – China - $1, 736 #175 – India - $724#175 – India - $724

GNP 1998GNP 1998

Wealth GapWealth Gap
Per capita GNP is calculated equally per Per capita GNP is calculated equally per person, but it is not distributed equally.person, but it is not distributed equally.
Gap between rich & poor is growing.Gap between rich & poor is growing. Assets of the average person = $2,200Assets of the average person = $2,200 1% of world has 40% of total wealth1% of world has 40% of total wealth
37 million people; at least $500,000 in assets.37 million people; at least $500,000 in assets. Over 1 billion people survive on less than Over 1 billion people survive on less than
$1 per day.$1 per day.

GNI (gross national income)GNI (gross national income) High-income, highly developed, industrialized High-income, highly developed, industrialized
countriescountries United States, Japan, CanadaUnited States, Japan, Canada Average GNI per capita = $26,710Average GNI per capita = $26,710
Middle-income, moderately developed Middle-income, moderately developed countriescountries Latin America, South Africa, ChinaLatin America, South Africa, China Average GNI per capita = $1,850Average GNI per capita = $1,850
Low-income, developing countriesLow-income, developing countries Western and central Africa, India, central Western and central Africa, India, central
AsiaAsia Average GNI per capita = $430Average GNI per capita = $430

Population Increase in Developed and Population Increase in Developed and Developing CountriesDeveloping Countries
Where should we implement mechanisms to slow population growth?
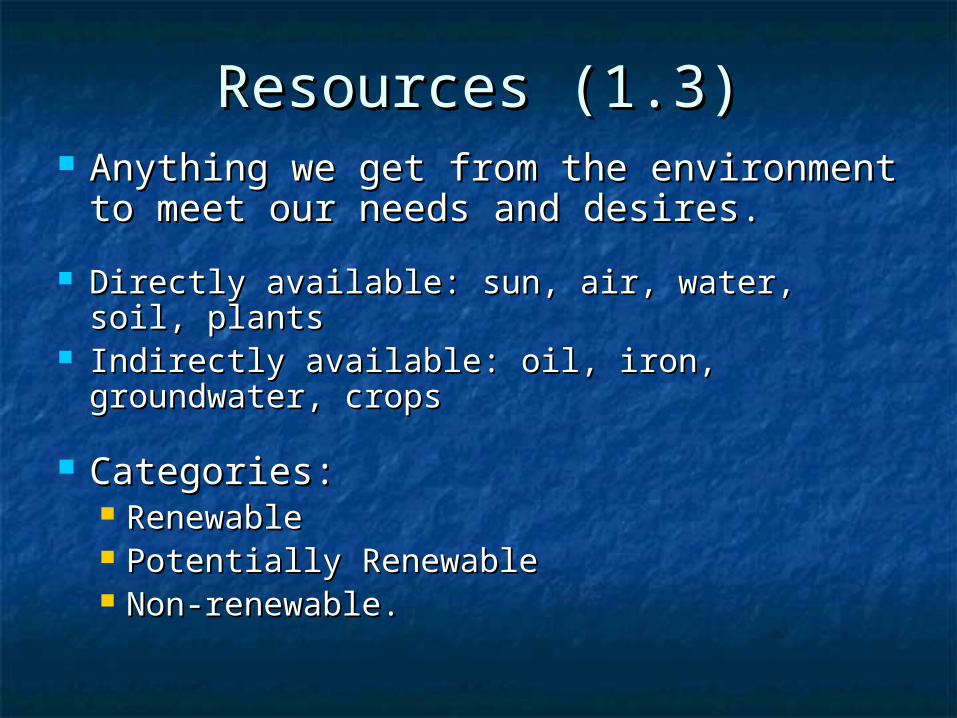
Resources (1.3)Resources (1.3) Anything we get from the environment Anything we get from the environment
to meet our needs and desires.to meet our needs and desires.
Directly available: sun, air, water, soil, plantsDirectly available: sun, air, water, soil, plants Indirectly available: oil, iron, groundwater, Indirectly available: oil, iron, groundwater,
cropscrops
Categories:Categories: RenewableRenewable Potentially RenewablePotentially Renewable Non-renewable.Non-renewable.

RenewableRenewable
Can be Can be replaced in our replaced in our lifetime.lifetime.
Solar Energy Solar Energy
Winds, Tides, & Winds, Tides, & flowing Waterflowing Water

Nonrenewable ResourcesNonrenewable Resources Not renewable on a human time scaleNot renewable on a human time scale Energy ResourcesEnergy Resources
Fossil Fuels (oil, coal & natural gas)Fossil Fuels (oil, coal & natural gas) Not recyclableNot recyclable
Metallic Minerals Metallic Minerals iron, copper, aluminum…iron, copper, aluminum… RecyclableRecyclable
Non-metallic mineralsNon-metallic minerals clay, sand, phosphates…clay, sand, phosphates… Recyclable, but not economically logicalRecyclable, but not economically logical


Coal Mine Coal Mine

Potentially RenewablePotentially Renewable
Renewable resources that if over-Renewable resources that if over-exploited will become nonrenewable exploited will become nonrenewable during our lifetime. Natural processes during our lifetime. Natural processes renew.renew.
WaterWater AirAir SoilSoil Biodiversity (plants & animals)Biodiversity (plants & animals)

BiodiversityBiodiversity
Three (3) Types of Biodiversity:Three (3) Types of Biodiversity:
Genetic DiversityGenetic Diversity The variation in genetic traitsThe variation in genetic traits
Species DiversitySpecies Diversity The variation in species in an ecosystemThe variation in species in an ecosystem
Ecological DiversityEcological Diversity The variation of ecosystems.The variation of ecosystems.

Environmental DegradationEnvironmental Degradation
Mor
e
Populat
ion
Cause
s…
Urbanization of productive landSalinization / waterlogging of soilPoor soil managementWetlands destructionDeforestationGroundwater depletionPollutionLivestock overgrazingReduction in biodiversity by eliminating habitat
See fig 1-13

Where does the most Where does the most pressure come from?pressure come from?

Tragedy of the CommonsTragedy of the Commons
Common property resources Common property resources Owned by no one (or everyone) for freeOwned by no one (or everyone) for free
Clean air, open ocean, its fish, Clean air, open ocean, its fish, migratory birds, public landsmigratory birds, public lands
Tragedy of the CommonsTragedy of the Commons
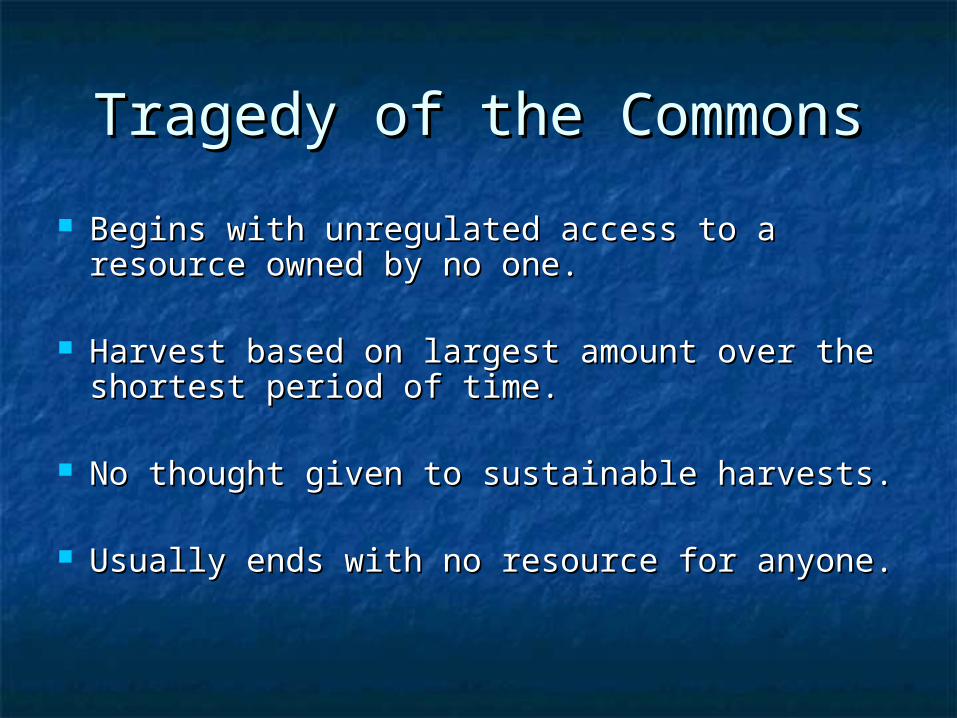
Begins with unregulated access to a Begins with unregulated access to a resource owned by no one. resource owned by no one.
Harvest based on largest amount over the Harvest based on largest amount over the shortest period of time.shortest period of time.
No thought given to sustainable harvests.No thought given to sustainable harvests.
Usually ends with no resource for anyone.Usually ends with no resource for anyone.

Preventing a Tragedy of the Preventing a Tragedy of the CommonsCommons
Private ownershipPrivate ownership Users pay approachUsers pay approach Regulated accessRegulated access
Use resources at rates below sustainable Use resources at rates below sustainable yieldyield
Fairness in access rightsFairness in access rights Common consent of the regulatedCommon consent of the regulated
What did you do to regulate the number What did you do to regulate the number of goldfish you caught?of goldfish you caught?

Depleting our ResourcesDepleting our Resources Economic Depletion Economic Depletion costs of exploiting costs of exploiting
what is left exceeds the economic value of what is left exceeds the economic value of itit
We have 5 choices:We have 5 choices: Recycle/reuse Recycle/reuse does it change forms? does it change forms? Use less of itUse less of it Develop a substituteDevelop a substitute Do without itDo without it Waste lessWaste less
Discuss the options in relation to gasolineDiscuss the options in relation to gasoline

ReservesReserves http://www.infoplease.com/ipa/A0872964.html
Known Known deposits of a usable mineral deposits of a usable mineral that can be that can be profitablyprofitably extracted at extracted at current current prices.prices.
Today, the US reserve has the capacity to hold Today, the US reserve has the capacity to hold 727 million barrels. It is the largest emergency oil 727 million barrels. It is the largest emergency oil stockpile in the world. Together, the facilities and stockpile in the world. Together, the facilities and crude oil represent about $22 billion investment crude oil represent about $22 billion investment in energy security ($5 billion for facilities and $17 in energy security ($5 billion for facilities and $17 billion for crude oil). U.S. Dept. of Energy 2008billion for crude oil). U.S. Dept. of Energy 2008

Returning to the Root of Returning to the Root of the Problem: What’s the Problem: What’s
putting pressure on our putting pressure on our Resources?Resources?
Human Population: Growth Human Population: Growth & Distribution& DistributionChapter 6Chapter 6
Sections 6.1 & Sections 6.1 & 6.26.2

What’s this showing?What’s this showing?

DemographyDemography
The study of the size, composition, & The study of the size, composition, & distribution of human populations distribution of human populations and consequences of changes in and consequences of changes in these characteristics. these characteristics.

Calculating Population Calculating Population ChangeChange
Based upon births, deaths, & migrationBased upon births, deaths, & migration
Population ChangePopulation Change = =
(Births + Immigration) (Births + Immigration) –– (Deaths + Emigration) (Deaths + Emigration)
Crude birth rateCrude birth rate = # of live births per 1,000 = # of live births per 1,000 people in a given yearpeople in a given year
Crude death rateCrude death rate = # of deaths per 1,000 = # of deaths per 1,000 people in a given yearpeople in a given year
ZPGZPG
Zero Population GrowthZero Population Growth Birth = DeathBirth = Death Immigrants = EmigrantsImmigrants = Emigrants Population growth rate = 0%Population growth rate = 0%
The Earth’s Goal for all countriesThe Earth’s Goal for all countries Japan is the most modern country Japan is the most modern country
close to achieving ZPGclose to achieving ZPG

Calculating Population Calculating Population ChangeChange
Annual rate of natural population changeAnnual rate of natural population change
(Births – Deaths)(Births – Deaths) X 100 = ______% X 100 = ______%
10001000
EX: (EX: (1000 births – 500 deaths1000 births – 500 deaths) X 100 = 50%) X 100 = 50%
10001000
Earth’s Human Annual Rate of Earth’s Human Annual Rate of Population ChangePopulation Change
1963 = 2.2%1963 = 2.2% 2004 = 1.2%2004 = 1.2%
Rate of the world’s population is slowing, Rate of the world’s population is slowing, BUTBUT population went from 3.2 billion to population went from 3.2 billion to 6.4 billion during this time!6.4 billion during this time!
Developing Countries = 1.46%Developing Countries = 1.46% Developed Countries = 0.25%Developed Countries = 0.25% Fastest growing countries: Fastest growing countries:
INDIA, CHINA, PAKISTAN, NIGERIA, BANGLADESH, & INDIA, CHINA, PAKISTAN, NIGERIA, BANGLADESH, & INDONESIA.INDONESIA.
Global Fertility RatesGlobal Fertility Rates FertilityFertility
# of births that occur to an individual woman # of births that occur to an individual woman in a population.in a population.
Replacement Level FertilityReplacement Level Fertility # of children needed to replace their parents# of children needed to replace their parents Projected number... “should have”Projected number... “should have”
Total Fertility Rate (TFR)Total Fertility Rate (TFR) Average # of children that a woman has Average # of children that a woman has
during her fertile years.during her fertile years. Actual, real number…”does have”Actual, real number…”does have”
Global Fertility RatesGlobal Fertility Rates Replacement Level Fertility Rates (1997)Replacement Level Fertility Rates (1997)
Developed countries = 2.1 childrenDeveloped countries = 2.1 children Developing countries = 2.5 childrenDeveloping countries = 2.5 children
(Since some baby girls die before they reproduce, the (Since some baby girls die before they reproduce, the number is slightly greater than two.)number is slightly greater than two.)
Also, not every woman has a childAlso, not every woman has a child
Total Fertility Rates (TFR) (1997)Total Fertility Rates (TFR) (1997) World Average = 3.0 childrenWorld Average = 3.0 children Developed – 1.6 childrenDeveloped – 1.6 children
2.5 children in 1950.2.5 children in 1950. Developing – 3.4 childrenDeveloping – 3.4 children
6.5 children in 1950. 6.5 children in 1950.

TFRTFR Africa has the highest in worldAfrica has the highest in world U.S. has had higher than most U.S. has had higher than most
developed countries:developed countries: Large # of baby boomers = momsLarge # of baby boomers = moms Increased number of unmarried mothersIncreased number of unmarried mothers Increased fertility rates in some Increased fertility rates in some
racial/ethnic groupsracial/ethnic groups Legal/illegal immigrantsLegal/illegal immigrants
(11% of population are foreign born. (11% of population are foreign born. (NOVA (NOVA 2007)2007)

Factors Affecting Birth & Fertility RatesFactors Affecting Birth & Fertility Rates
Increasing FactorsIncreasing Factors
Children in labor forceChildren in labor force Rural areasRural areas Lack of birth controlLack of birth control Religious/cultural values Religious/cultural values
against birth controlagainst birth control Lack of abortion accessLack of abortion access Younger than 25 at Younger than 25 at
marriagemarriage Few jobs for womenFew jobs for women Lack of educational Lack of educational
opportunitiesopportunities
Decreasing FactorsDecreasing Factors
Low infant mortality rateLow infant mortality rate Educational & job Educational & job
opportunities for womenopportunities for women AffluenceAffluence Cost of raising childrenCost of raising children UrbanizationUrbanization Older than 25 at marriageOlder than 25 at marriage Availability of pension Availability of pension
systemssystems

Fertility Rate and IncomeFertility Rate and Income

Contraceptive Use and Contraceptive Use and Fertility RatesFertility Rates
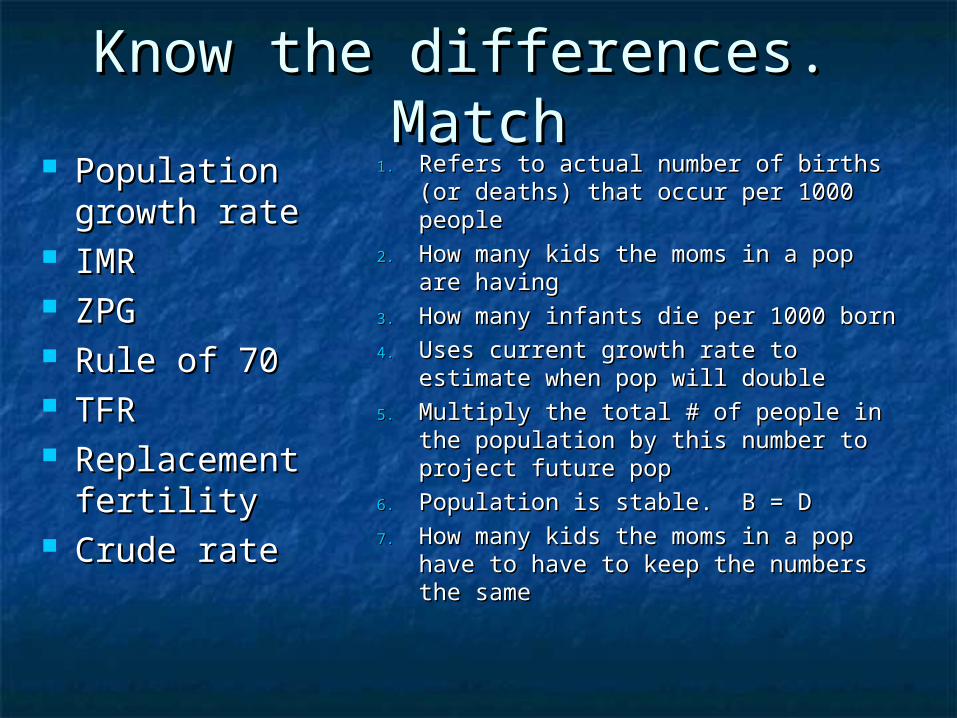
Know the differences. Know the differences. MatchMatch
Population Population growth rategrowth rate
IMRIMR ZPGZPG Rule of 70Rule of 70 TFRTFR ReplacemeReplaceme
nt fertilitynt fertility Crude rateCrude rate
1.1. Refers to actual number of births (or Refers to actual number of births (or deaths) that occur per 1000 peopledeaths) that occur per 1000 people
2.2. How many kids the moms in a pop How many kids the moms in a pop are havingare having
3.3. How many infants die per 1000 bornHow many infants die per 1000 born
4.4. Uses current growth rate to estimate Uses current growth rate to estimate when pop will doublewhen pop will double
5.5. Multiply the total # of people in the Multiply the total # of people in the population by this number to project population by this number to project future popfuture pop
6.6. Population is stable. B = DPopulation is stable. B = D
7.7. How many kids the moms in a pop How many kids the moms in a pop have to have to keep the numbers have to have to keep the numbers the samethe same

Know the differences.Know the differences.5. Population 5. Population
growth rategrowth rate
3. IMR3. IMR
6. ZPG6. ZPG
4. Rule of 704. Rule of 70
2. TFR2. TFR
7. 7. ReplacemeReplacement fertilitynt fertility
1. Crude rate1. Crude rate
Multiply the total # of people in the Multiply the total # of people in the population by this number to project population by this number to project future popfuture pop
How many infants die per 1000 bornHow many infants die per 1000 born Population is stable. B = DPopulation is stable. B = D Uses current growth rate to Uses current growth rate to
estimate when pop will doubleestimate when pop will double How many kids the moms in a pop How many kids the moms in a pop
are havingare having How many kids the moms in a pop How many kids the moms in a pop
have to have to keep the numbers have to have to keep the numbers the samethe same
Refers to actual number of births (or Refers to actual number of births (or deaths) that occur per 1000 peopledeaths) that occur per 1000 people

Factors Affecting Death Factors Affecting Death RatesRates
Population increase over the past Population increase over the past 100 years most influenced by the 100 years most influenced by the decrease in death rates!decrease in death rates!
Better food supplies & distributionBetter food supplies & distribution Better nutritionBetter nutrition Better water suppliesBetter water supplies Advances in medicine & sanitationAdvances in medicine & sanitation

Causes of Human MortalityCauses of Human Mortality

Measures of Overall HealthMeasures of Overall Health Life expectancyLife expectancy
Average # of years a newborn can expect to Average # of years a newborn can expect to livelive
Developed countries = 71 years (1997); 77 (2007)Developed countries = 71 years (1997); 77 (2007) Developing countries = 62 years (1997); 64.5 (2007)Developing countries = 62 years (1997); 64.5 (2007)
Infant Mortality RateInfant Mortality Rate # of babies out of every 1,000 who die before # of babies out of every 1,000 who die before
their first birthday.their first birthday. Reflects a country’s level of nutrition & health careReflects a country’s level of nutrition & health care Single best measure of a society’s quality of life.Single best measure of a society’s quality of life.

U.S. Infant Mortality RateU.S. Infant Mortality Rate
Higher than 35 other countries due Higher than 35 other countries due to:to:
Inadequate health care for poor women Inadequate health care for poor women & their babies& their babies
Drug addiction among pregnant womenDrug addiction among pregnant women
High birth rate among teenagersHigh birth rate among teenagers

MIGRATIONMIGRATION
Is not always voluntaryIs not always voluntary Involuntary displacement by:Involuntary displacement by:
Armed conflictArmed conflict Environmental degradationEnvironmental degradation Natural disasterNatural disaster
Why would a population continue Why would a population continue to grow if it achieved replacement to grow if it achieved replacement
level fertility rates?level fertility rates?
Because of the AGE STRUCTUREBecause of the AGE STRUCTURE How many future moms are there?How many future moms are there?

Population Age StructurePopulation Age Structure
Section 6-2Section 6-2

Age Structure DiagramsAge Structure Diagrams The % of males & females in the total The % of males & females in the total
population divided by age groups:population divided by age groups:
0 - 14 yrs = 0 - 14 yrs = Pre-ProductivePre-Productive ages ages 15 - 44 yrs = 15 - 44 yrs = ReproductiveReproductive ages ages 45 - older yrs = 45 - older yrs = Post-ReproductivePost-Reproductive ages ages
***The ***The MAJORMAJOR determining factor of a determining factor of a country’s future population growth is: country’s future population growth is: the number of the number of pre-productive peoplepre-productive people! (Under ! (Under
15 yrs).15 yrs).

Where are the baby boomers?Where are the baby boomers?
http://www.census.gov/ipc/www/idb/summaries.html

Is this population growing or Is this population growing or shrinking?shrinking?

Is this population growing or Is this population growing or shrinking?shrinking?

Disadvantages to declining Disadvantages to declining populationspopulations
Increased demand forIncreased demand for Medical careMedical care Social SecuritySocial Security Public servicesPublic services
2.5 elderly to every 1 young person2.5 elderly to every 1 young person U.S. = 31.9% projected tax rate to pay for U.S. = 31.9% projected tax rate to pay for
services. Italy = 71.5% payroll taxservices. Italy = 71.5% payroll tax
Labor shortagesLabor shortages Alleviated by automation or immigrationAlleviated by automation or immigration

Projecting Projecting Future Future
Populations: Populations: Developed Developed CountriesCountries
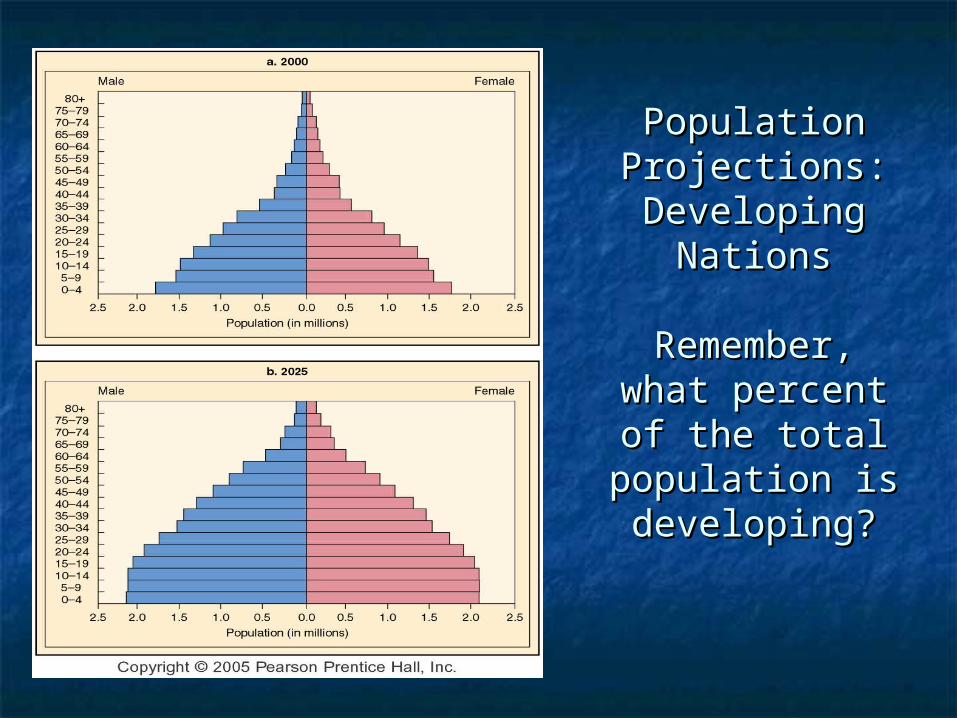
Population Population Projections: Projections: Developing Developing
NationsNations
Remember, Remember, what percent what percent of the total of the total
population is population is developing?developing?

Population PowerPopulation Power In 2000, In 2000, 31% of people on the planet were 31% of people on the planet were
under 15 yrs old.under 15 yrs old. ( (1.9 billion1.9 billion people) people) 34% of population in developing countries34% of population in developing countries 19% of population in developed countries 19% of population in developed countries
Even if each woman only has 1 or 2 children, Even if each woman only has 1 or 2 children, the overall population size will soar!the overall population size will soar!
How to slow or stop this exponential growth?How to slow or stop this exponential growth? Effective methods to slow birth ratesEffective methods to slow birth rates Drastic rise in death ratesDrastic rise in death rates
Would a bird flu pandemic be bad for the Earth????Would a bird flu pandemic be bad for the Earth????

The Demographic The Demographic TransitionTransition

Demographic TransitioningDemographic Transitioning
PRE-INDUSTRIAL STAGEPRE-INDUSTRIAL STAGE Harsh living conditions lead to high birth Harsh living conditions lead to high birth
rate (high IMR) & high death raterate (high IMR) & high death rate TRANSITIONAL STAGETRANSITIONAL STAGE
Industrialization begins, food production Industrialization begins, food production goes up, healthcare improvesgoes up, healthcare improves
death decreases but birth rates stay death decreases but birth rates stay highhigh
Rapid growthRapid growth

Demographic TransitioningDemographic Transitioning INDUSTRIAL STAGEINDUSTRIAL STAGE
Industrialization is widespread. Industrialization is widespread. Jobs increase, education & its cost increase, Jobs increase, education & its cost increase,
IMR goes down, birth control use is up. IMR goes down, birth control use is up. Birth rate approaches death rateBirth rate approaches death rate
POST-INDUSTRIAL STAGEPOST-INDUSTRIAL STAGE ZPG achieved, population size decreases as ZPG achieved, population size decreases as
birth rate continues to fallbirth rate continues to fall Sustainable economic dev’tSustainable economic dev’t 37 countries (mostly W. Europe) have 37 countries (mostly W. Europe) have
enteredentered

How can we lower our growth How can we lower our growth rates?rates?
Problem: Problem:

China’s Population ControlChina’s Population Control
Socialist dictatorshipSocialist dictatorship 1960’s realized only option to population control 1960’s realized only option to population control
was mass starvation!was mass starvation!
Instituted social coercion planInstituted social coercion plan Free birth control, abortions, & sterilizationsFree birth control, abortions, & sterilizations Encouraged to marry at later age & only 1 kidEncouraged to marry at later age & only 1 kid
Between 1972 – 2000Between 1972 – 2000 Crude birth rate drop 50%Crude birth rate drop 50% TFR dropped from 5.7 to 1.8TFR dropped from 5.7 to 1.8

China’s One Child PolicyChina’s One Child Policy
Couples who pledged only one child:Couples who pledged only one child:
Extra foodExtra food Larger pensionsLarger pensions Better housingBetter housing Free medical careFree medical care Salary bonusesSalary bonuses Free school tuitionFree school tuition Preferential treatment in employment Preferential treatment in employment
marketsmarkets
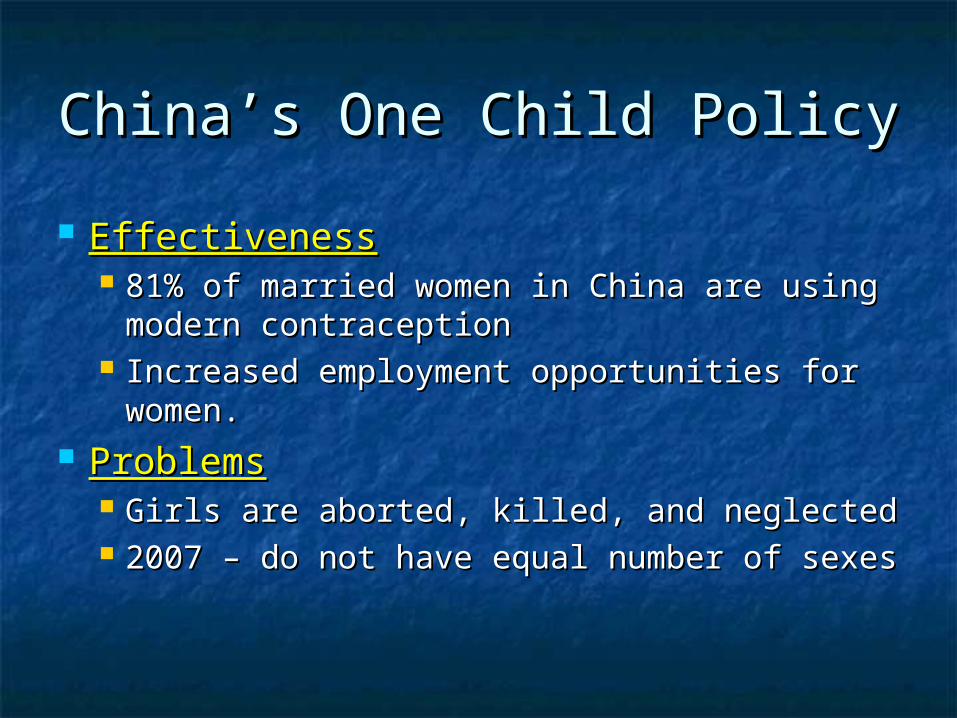
China’s One Child PolicyChina’s One Child Policy
EffectivenessEffectiveness 81% of married women in China are using 81% of married women in China are using
modern contraceptionmodern contraception Increased employment opportunities for Increased employment opportunities for
women.women. ProblemsProblems
Girls are aborted, killed, and neglectedGirls are aborted, killed, and neglected 2007 – do not have equal number of sexes2007 – do not have equal number of sexes

Extra SlidesExtra Slides
Some may clarify conceptsSome may clarify concepts
Some are just interesting Some are just interesting factsfacts
Some are to challenge your Some are to challenge your critical thinkingcritical thinking

Changing Human Changing Human Survivorship Curves: Went Survivorship Curves: Went
from B to Afrom B to A%
Sur
viva
l
AgeBirth Death
A
B

World Population Growth World Population Growth and Absolute Growthand Absolute Growth
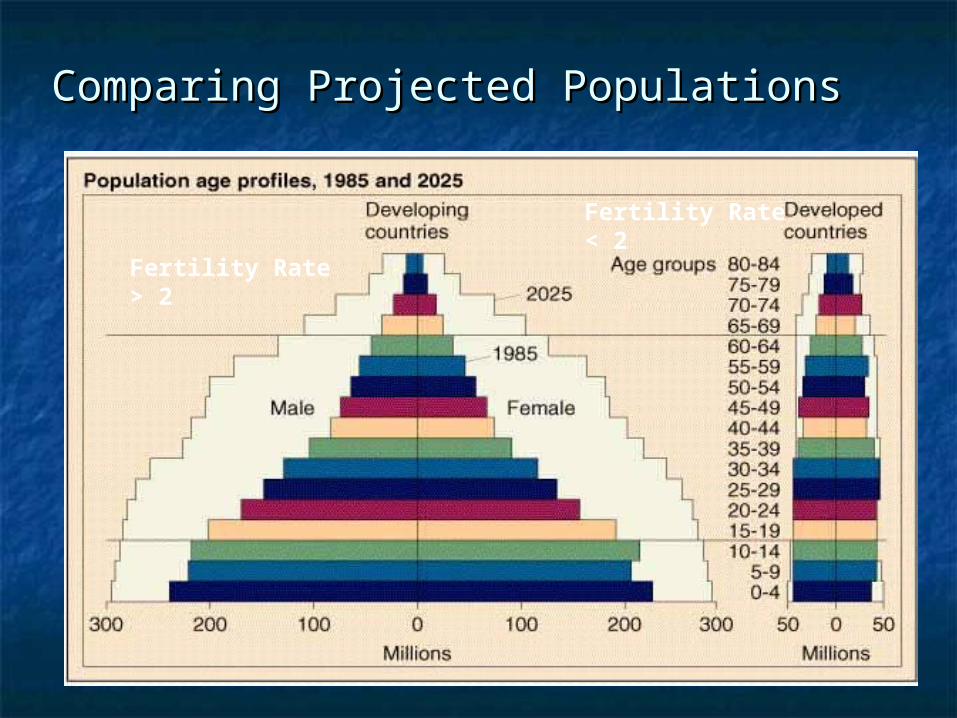
Comparing Projected PopulationsComparing Projected Populations
Fertility Rate> 2
Fertility Rate< 2


Demographic Transition Demographic Transition ComparisonsComparisons

Calculating Fertility Rates Calculating Fertility Rates and Doubling Timesand Doubling Times
(CBR – CDR)/10 = Rate of increase or decrease in population per 1,000 per year
70/Rate of Increase = Doubling Time
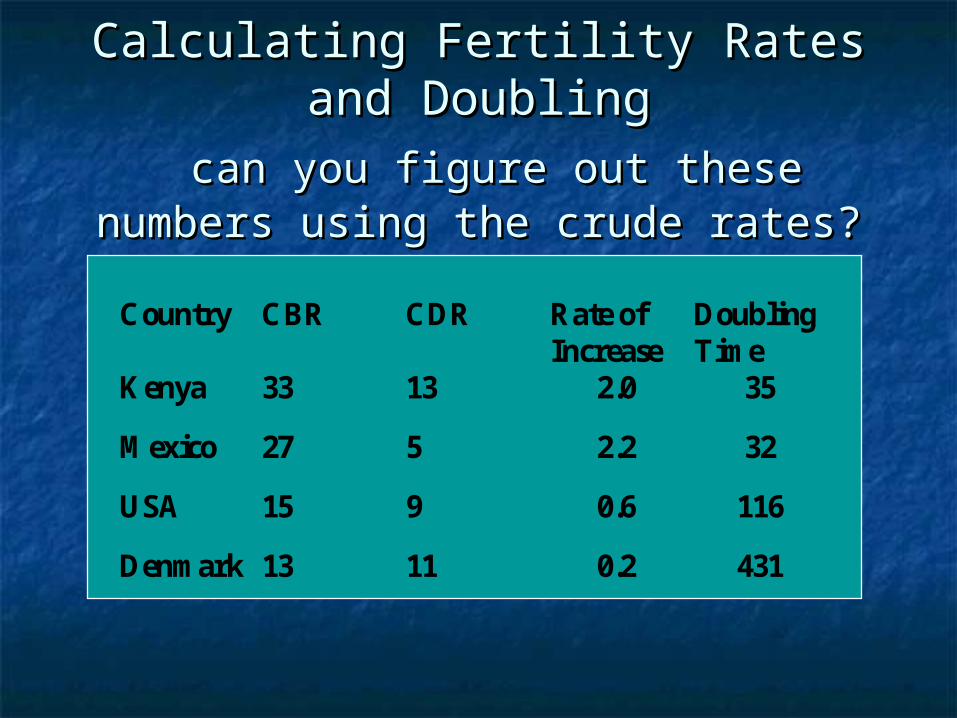
Calculating Fertility Rates and Calculating Fertility Rates and DoublingDoubling
can you figure out these numbers can you figure out these numbers using the crude rates?using the crude rates?
Country CBR CDR Rate of Increase
Doubling Time
Kenya 33 13 2.0 35
Mexico 27 5 2.2 32
USA 15 9 0.6 116
Denmark 13 11 0.2 431


The 10 Leading Global Risk The 10 Leading Global Risk FactorsFactors
Fig. 15-9 here

Public Policy:Public Policy: The Policy Life Cycle: how media, The Policy Life Cycle: how media,
individuals, law & government react to individuals, law & government react to issuesissues
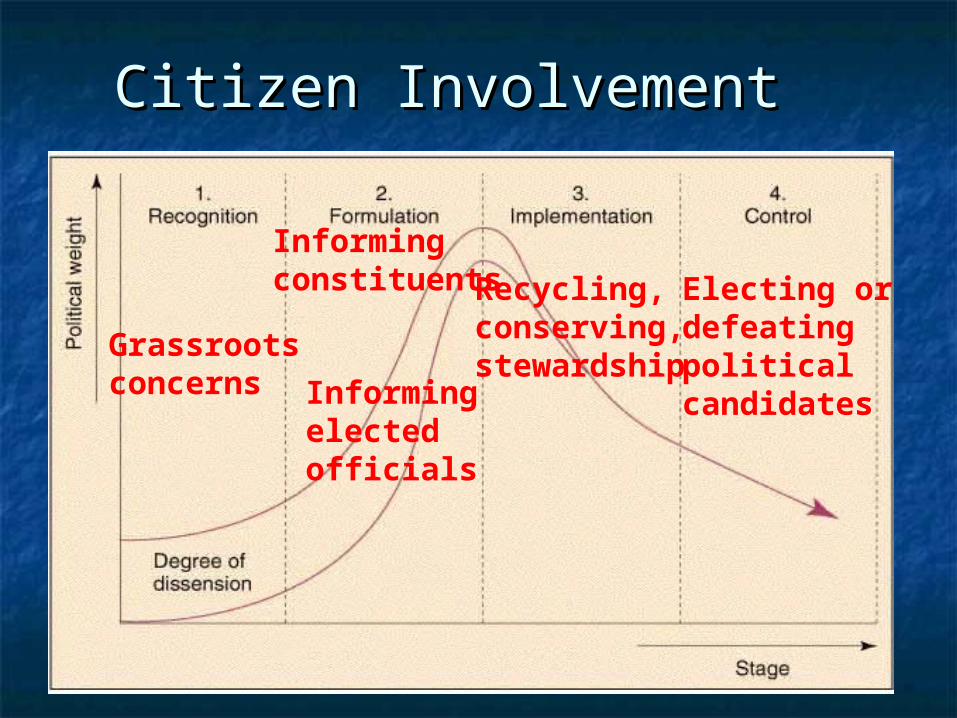
Citizen InvolvementCitizen Involvement
Grassrootsconcerns
Informingconstituents
Informingelectedofficials
Electing ordefeatingpoliticalcandidates
Recycling,conserving,stewardship

Environmental Problems in various Environmental Problems in various Policy Life Cycle Stages Policy Life Cycle Stages