epa’s new environmental s new environmental requirements: how will they impact the power...
TRANSCRIPT

EPA’s New Environmental Requirements: How Will They Impact the Power Sector?
National Conference of State Legislatures Webinar
November 3, 2011
Daniel Chartier
Director, Environmental Markets & Air Quality Programs

Electric Companies Use a Diverse Mix
Of Fuels to Generate Electricity
*Includes generation by agricultural waste, landfill gas
recovery, municipal solid waste, wood, geothermal,
non-wood waste, wind, and solar.
** Includes generation by tires, batteries, chemicals, hydrogen,
pitch, purchased steam, sulfur, and miscellaneous
technologies.
Source: U.S. Department of Energy, Energy Information
Administration, Power Plant Operations Report (EIA-923); 2010
preliminary generation data.
July 2011
© 2011 by the Edison Electric Institute. All rights reserved.
2010
National Fuel Mix
2

*Includes generation by
agricultural waste, landfill gas
recovery, municipal solid waste,
wood, geothermal, non-wood
waste, wind, and solar.
** Includes generation by tires,
batteries, chemicals, hydrogen,
pitch, purchased steam, sulfur,
and miscellaneous technologies.
Sum of components may not add
to 100% due to independent
rounding.
Source: U.S. Department of
Energy, Energy Information
Administration, Power Plant
Operations Report (EIA-923);
2010 preliminary generation data.
July 2011
© 2011 by the Edison Electric
Institute. All rights reserved.
Different Regions of the Country Use
Different Fuel Mixes to Generate Electricity
3

Coal Units by Age, Capacity and Emissions U.S. Generating Units, 10 Year Increments
4
Age of Units*
Generating Units
Total Nameplate Capacity
Total Net Generation Year 2008
Total CO2 Emissions Year 2008
Total SO2 Emissions Year 2008
Total NOX
Emissions Year 2008
# Percent of Total
GW Percent of Total
GWH Percent of Total
MTons Percent of Total
Tons Percent of Total
Tons Percent of Total
0-10 Years 16 1.4% 5.3 1.6% 19,788 1.1% 28.7 1.4% 18,083 0.2% 13,779 0.5%
11-20 Years 64 5.8% 14.9 4.5% 78,261 4.2% 78.1 3.8% 137,803 1.9% 108,115 3.8%
21-30 Years 186 16.7% 86.1 26.1% 541,408 29.0% 615.0 29.6% 1,336,033 18.0% 763,207 26.9%
31-40 Years 238 21.4% 122.5 37.1% 724,206 38.8% 780.7 37.6% 2,750,025 37.1% 1,053,259 37.1%
41-50 Years 270 24.3% 60.8 18.4% 316,029 16.9% 352.2 16.9% 1,879,152 25.4% 533,038 18.8%
51-60 Years 304 27.3% 39.3 11.9% 187,473 10.0% 220.7 10.6% 1,265,388 17.1% 356,902 12.6%
61-70 Years 30 2.7% 0.9 0.3% 1,166 0.1% 2.5 0.1% 19,223 0.3% 6,554 0.2%
> 70 Years 4 0.4% 0.0 0.01% 5 0.0003% 0.1 0.004% 87 0.001% 484 0.02%
Coal Unit Totals
1,112 100.0% 329.95 100.0% 1,868,336 100.0% 2077.9 100.0% 7,405,794 100.0% 2,835,339 100.0%
Source: Ventyx, Inc.—EV Suite MTon = million tons * Does not include units that came online in 2009

Location of Coal- and Oil-Based Plants
Source: National Electric Energy Data
System (NEEDS 4.10) (EPA, December 2010) 5

Possible Timeline for Environmental Regulatory
Requirements for the Utility Industry
Ozone (O3)
PM/PM2.5
'08 '09 '10 '11 '12 '13 '14 '15 '16 '17
Begin CAIR
Phase I
Seasonal
NOx Cap
HAPs MACT
Proposed
Rule
Revised
Ozone
NAAQS
Begin CAIR
Phase I
Annual SO2
Cap
Adapted from Wegman (EPA 2003 Updated 09-12-2011
Proposed
PM-2.5
NAAQS
Revision
PM
Transport
Rule
SO2 Primary
NAAQS
SOX/NOx
Secondary
NAAQS
NOx
Primary
NAAQS
SOx/NOx/Visibility
CAMR &
Delisting
Rule
vacated
Hg/HAPS
Transport Rule
Proposal Issued (CAIR Replacement)
HAPs MACT
Final Rule
Expected
CAIR
Vacated
HAPS MACT
Compliance
3 yrs After
Final Rule
CAIR
Remanded
CAIR/Transport
Begin CAIR
Phase I
Annual NOx
Cap
316(b)
Proposed
Rule
316(b) Final
Rule
Expected
316(b)
Compliance
1-8 yrs After
Final rule
Effluent
Guidelines
Proposed Rule
Expected
Water
Effluent Guidelines
Final Rule Expected
Effluent Guidelines
Compliance 0-5+ yrs
After Final Rule
Begin Compliance
Requirements
Under Final CCB
Rule (ground
water monitoring,
double liners,
closure, dry ash
conversion)
Ash
Proposed
Rule for
CCBs
Management
Final Rule
for CCBs
Mgmt
CSAPR Issued (CAIR/Transport
Rule Replacement)
CO2
CO2
Regulation
(PSD/BACT)
Ozone
NAAQS
Revision
CSAPR
Phase I
Reductions
CSAPR
Phase II
Reductions
Ozone
Transport
Rule
GHG NSPS
Proposal
GHG
NSPS
Final
Expected
Final PM-2.5
NAAQS
Revision
PCB Phase-out
PCB
ANPR
PCB
Proposed
Rule
Expected
PCB Final Rule
Expected (start
of phase-out
period)
EPA Notice -
Regional Haze
SIPS Overdue
BART
(Visibility)
Deadline at
Some Plants
EPA Action
on Regional
Haze/BART
GHG NSPS
Implementation
(existing sources)
6

Congressional Landscape
EPA regulations a primary focus of activity
Republicans using 3-pronged strategy to target EPA regulations:
Increase oversight – numerous hearings on EPA authority, timing and cost of rules
Decrease funding
Eliminate EPA authority
House has passed several bills (TRAIN Act, Upton bill, appropriations bills)
House has announced schedule of activity through the winter targeting individual, major rulemakings
Unlikely any major environmental legislation passes in current Congress
Republican House opposes GHG caps, additional environmental legislation
Efforts to reform environmental statutes would not survive Presidential veto even if passed by both Houses
Memories of failed effort on cap-and-trade in last Congress
7

Role of States
States have a critical role to play in environmental regulations – the feds may regulate but the states have to implement
Have to develop the specific policies and rules to implement the regulations
Have to balance the views of various interests within the state while also being one of the calmer stakeholders in the federal process
Exercise oversight in implementation
States have to provide the necessary funding for permitting and enforcement of the regulations
Slow economy and state budget issues are impacting level of resources and personnel available to implement some standards (e.g., NAAQS)
“The fiscal impact has been deep and prolonged, with fiscal year 2012 marking the fourth consecutive year that states face significant mismatches between revenue and spending” – State Budget Update: Summer 2011 (NCSL)
Loss of ARRA funds; PUC budget cuts
8

Power Sector Objectives
Minimize economic impacts to consumers
Continue environmental improvements
Maintain system reliability
Maintain fuel diversity options
Develop and deploy new technologies
Obtain access to capital and cost recovery
Negotiate myriad political landscapes
9

Power Sector Objectives (2)
Power sector has been proactive in addressing these regulations
Have tried to carry a positive message – want to comply with regulations and make necessary reductions
Important that it be done cost-effectively and minimize economic impacts to consumers
Diversity of views within industry
CEOs have taken active role in development of EEI positions
10
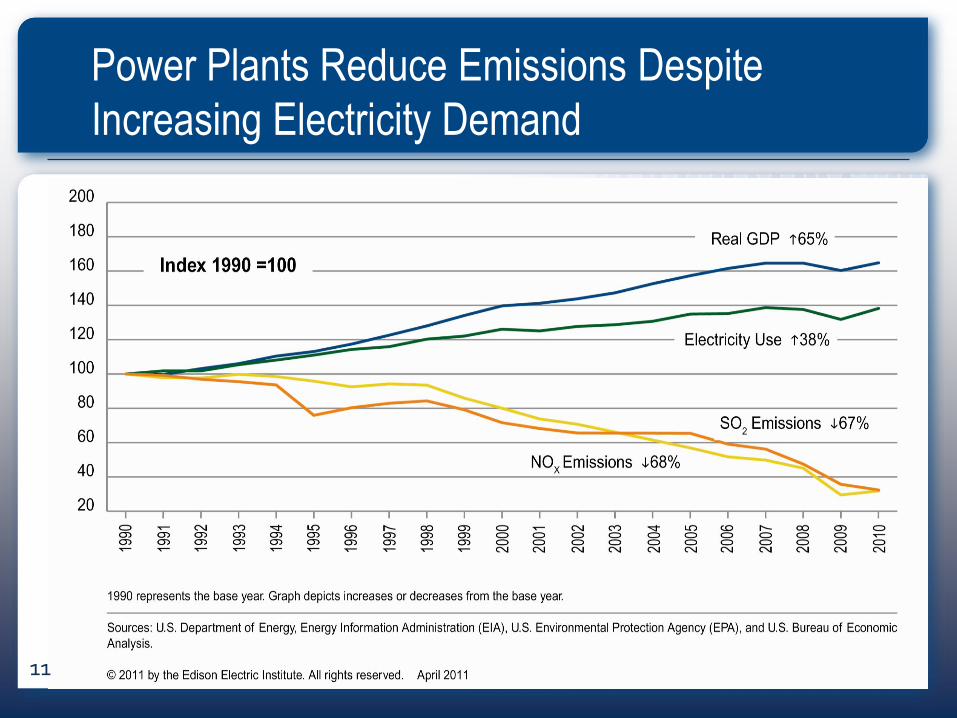
Power Plants Reduce Emissions Despite
Increasing Electricity Demand
11

Utility MACT Regulation
Proposed in March 2011; final rule due by December 16, 2011
3-yr compliance timeline after final rule; states/EPA have authority to grant 1-yr extension under limited circumstances
Key Issues
Compliance timeline
Use of filterable PM as surrogate for non-mercury metals
DSI may not be viable option for all coal units
Mercury standard should be based on best 12% average
Monitoring and verification requirements should be streamlined
Work practice standards for limited use oil-based units, and for startup and shutdown
New unit standards should be based on technology at existing sources
Allow broad emissions averaging as alternative compliance mechanism
12

Utility MACT Regulation (2)
Annualized compliance costs to power industry estimated at $10.9 billion (2007$) in 2015, and ~$10 billion in 2020 and 2030
EPA projects ~10 GW of coal-based generation may retire by 2015
EPA projects the installation of:
81 GW of dry scrubbing controls
93 GW of activated carbon injection
166 GW of fabric filters (baghouses)
EPA projects this rule will yield annual monetized benefits of $59-140 billion (2007$) using a 3-percent discount rate
CEO-level activity having an impact on rulemaking:
Develop consensus on EEI issues
Extensive discussion on advocacy; extensive state and beltway-focused strategies in play
13

Transport Rule
Final Transport Rule signed July 6, 2011
Proposal affects power companies in 31 eastern states
Emission budgets for NOx and/or SO2 (both for most states)
Supplemental proposal (July 11) to add NOX ozone season requirements for IA, KS, MI, MO, OK, WI (OK = 28th state)
Some EEI members can meet requirements, others have concerns:
Must be met only 6 and 30 months after rule is finalized
Provides little long-term certainty – requirements will be superseded by subsequent Transport Rules addressing potential changes to PM and ozone standards
Constraints on emissions trading
Numerous legal challenges have been filed 14

Cross-State Air Pollution Rule
15

Cooling Water Intake Structures 316(b)
Proposed rule signed March 28, 2011; EPA is required to finalize the rule by July 27, 2012
In general, the rule sets separate standards for impingement mortality and entrainment mortality for units with design intake rates above 2 million gallons per day (MGD)
The proposed rule leaves much to the discretion of the permit writer (and the EPA Region that reviews the permit)
EPA estimates the total annualized cost of the rule at $384.8 million; benefits = $18 million; cost-benefit ratio ~21:1
EEI and its allies having positive impact on rulemaking
16

Cooling Water Intake Structures – 316(b) Rule
17

Coal Combustion Residuals (CCR)
Co-proposal of two options in June 2010 (75 Fed. Reg. 35128):
Subtitle C, “Special” hazardous waste listing; Subtitle D regulations
Beneficial use exempt from regulation
Comments submitted Nov. 2010; Final Rule expected 2012
Subtitle C option would reverse 1993 & 2000 Regulatory Determinations
Majority of states, ash recyclers, industry groups, large number in Congress oppose hazardous waste regulations
Will significantly impact operations: closure of ash ponds, construction of additional disposal capacity, reductions in beneficial use
EEI and its allies having positive impact on rulemaking
18

GHG Regulation
Motor vehicle GHG regulation forced stationary source GHG regulation
EPA Tailoring Rule modified permitting rules to exclude small sources (at least for several years)
Legal basis uncertain – numerous lawsuits because CAA reinterpreted by EPA
Affected sources subject to Best Available Control Technology (BACT) reviews as of January 2011
Inherent uncertainty; states issue permits on case-by-case basis
GHG NSPS being developed for fossil power generators and refineries, including for existing sources
Draft rule due in July, now likely out in December 2011
19

National Ambient Air Quality
Standards (NAAQS)
1-hour NO2 and SO2 standards revised in 2010
EPA expected to tighten PM and ozone standards in 2012 and 2013, respectively:
New PM and ozone standards will drive additional new Transport Rules
Ozone review delayed until 2013 by President (September 2)
NAAQS continually ratcheted down over time:
Ozone – 1994, 2008, 2011
PM2.5 – 1997, 2006, 2012
State Implementation Plans: EGUs in bulls-eye due to perceived cost-effectiveness
20

Industry Next Steps
Have to retrofit, retire or repower virtually every coal plant Estimates of retirements vary widely
Impacts on reserve margins
~48 GW of coal-fired generation retirements have been announced already; ceiling may be ~60-80 GW Take place between 2010 and 2022
Most will be 50-60 years old upon retirement
Due to fuel and/or compliance costs, consent decrees, age, etc.
Some will be replaced with natural gas
Will require significant amount of investment; potential impacts on power prices
Continued active oversight and engagement by CEOs
21

Utility Power Plants Closing Coal Units Between 2010 -2022
22

Contact Information
Daniel Chartier
Director, Environmental Markets & Air Quality Programs
202-508-55710
23